Charter Schools in Newark: The Effect on Student Test Scores

Photo: monkeybusinessimages / iStock / Getty Images Plus
This report estimates the effect of enrolling in a charter school on student standardized test scores in Newark, New Jersey. The results indicate that attending a Newark charter school that participated in the city’s common enrollment system leads to large improvements in math and reading scores, and the effect is especially large for students who attend a charter school run by either the KIPP or Uncommon public schools networks.
The analysis is based on data from the first two years of the city’s common enrollment system, which uses the deferred acceptance (DA) mechanism to assign students to all traditional public and magnet schools, as well as most charters. The DA mechanism assigns students to schools based on the parent preferences and other characteristics via an algorithm. I apply the method for producing causal estimates within a DA-style assignment mechanism recently developed by Abdulkadiroğlu et al.[1] to measure the effect of enrolling in a charter school on student test scores after one, two, and three years. This approach takes advantage of a random component in assignments to charter schools, making it similar to a conventional randomized field trial.
The results add to a limited body of research evaluating a broad set of charter schools in a city with high charter school concentration. Newark’s charter school sector is one of the most expansive and rapidly growing in the nation; it now enrolls about a third of the city’s roughly 55,000 public school students. The policy implications of this research are particularly salient because charter expansion in Newark was a major component of the city’s educational reforms in 2010, after a $100 million gift in 2010 from Facebook CEO Mark Zuckerberg and his wife, Priscilla Chan.
Major Findings:
- Enrollment in a Newark charter school that participated in the common enrollment system leads to large improvements in math and English language arts (ELA) test scores, on average.
- There are potential differences in the effect of enrolling in a charter school by student subgroup, such as race, gender, or qualification for free lunch. However, due to the smaller sample sizes, these models are estimated too imprecisely to detect such differences as statistically significant.
- Students who enrolled in a charter school operated by either the KIPP or Uncommon national charter school networks experienced especially large effects. When considered as a group, participating charter schools operated by other entities produce some gains, though of a smaller magnitude.
Introduction
Previous research suggests that, on average, urban students benefit from attending a charter school, but charter school effectiveness varies across localities.[2] Few studies have evaluated a broad set of charter schools operating within a locality where charters enroll a substantial share of public school students. Addressing this limitation in existing research is important because charter schools may not scale well. For instance, large charter sectors might dig deeper into the local market for teachers and school leaders, necessitate a larger bureaucracy, or lead to changes in the characteristics of students who enroll in charters.
Evaluating highly concentrated charter school sectors is of immediate policy concern. Charter schools enroll only about 6% of public school students nationwide. But there are 16 public school districts in which they enroll at least a third of public school students.[3] If charters are to revitalize public education in the way that many of their advocates envision, they must maintain effectiveness as the sector grows within a locality.
Newark’s charter school sector, which now enrolls about a third of the city’s public school students, is one of the most expansive and rapidly growing in the nation. Legislation has paved the way for further growth of the sector, which is projected to enroll 44% of public school students by 2022.[4] Newark also provides an especially salient policy context in which to consider charter school effects. The state took over Newark’s public school system in 1995, following years of ineffectiveness and did not relinquish control until 2018. Expanding the city’s charter sector was among several reforms driven by a $100 million matching gift in 2010 from Facebook CEO Mark Zuckerberg and his wife, Priscilla Chan. The couple announced the gift on the Oprah Winfrey Show, alongside then-governor Chris Christie and then-mayor and now U.S. senator Cory Booker. The political response to these philanthropically inspired reforms has been mixed.[5]
In this report, I contribute to the evidence on urban charter school impacts by estimating the effect of enrolling in a charter school in Newark, New Jersey, on student standardized test scores. I analyze data from the first two years of the city’s common enrollment system, which assigns students to all traditional public and magnet schools, as well as most charters.[6] This approach employs variation from the 70% of the city’s charter schools that use the common enrollment system, which currently enroll about 85% of its charter school students. I produce plausibly causal estimates for the effect of enrolling in a charter school that participated in the common enrollment system (hereafter, “participating charter schools”), and I show that my results are not likely to be driven by ineffective charters choosing not to participate. Additionally, because the analysis is based on the later-year test scores of students who enrolled in a charter school in a given year—regardless of whether they remain enrolled—the effect on test scores cannot result from charters removing low-performing students, as they are often accused of doing.
I find that enrolling in a Newark participating charter school leads to large improvements in a student’s math and English language arts (ELA) test scores, on average. Students appear to maintain these positive test-score effects over time. The magnitude of the impact from attending a Newark participating charter school is comparable with that found in previous research on charters in Boston and Denver. To place the result into context, attending a Newark participating charter school has a larger effect than 80% of other educational interventions that have been recently studied using an experimental design.[7]
I also report results from analyses evaluating whether the effect of enrolling in a participating charter school differed by student subgroup. I find the potential for some differences in the effect of attending a participating charter school based on several key demographic characteristics, such as race, gender, or qualification for free lunch. However, the small number of students in some of these analyses leads to imprecise estimates that are not detected as statistically significant by the model.
Also consistent with previous research in Boston and Denver, I find meaningful differences in the impact of attending charter schools based on the school’s operator. I find especially large test-score impacts from attending a charter school operated by one of two wellknown national charter management organizations: the Knowledge Is Power Program (KIPP) and Uncommon public schools. Charter schools operated by these providers are especially interesting because they have national reach, they account for about half of Newark’s charter school students, and both have previously been described as applying the “no excuses” approach that previous studies have found to be especially effective at improving student test scores.8 Participating charter schools run by other operators have smaller—and, at times, statistically insignificant—effects. However, limitations in the data require lumping all participating charters not run by KIPP or Uncommon into a single category, even though their methods are diverse. There may be meaningful differences in the effects of charter schools in Newark that are run by entities other than KIPP or Uncommon.
Data [9]
The analysis is based on information from two sources. I acquired longitudinal administrative data—including test scores, demographics, and school enrollments—for students attending traditional public and charter schools in Newark from 2013–14 through 2017–18 from the New Jersey Department of Education (NJDOE).
The administrative data are matched to records from Newark Enrolls, the city’s common enrollment assignment mechanism. My analysis relies on the data that the city used to match students to schools for the 2014–15 and 2015–16 school years, which were the first two years of the system. These data include school preference orderings and the school assignments resulting from a deferred acceptance (DA) algorithm. Participants in the common enrollment system were matched to the state administrative data by first and last name, date of birth, race/ethnicity, gender, and the grade level to which they were applying for enrollment.
The dependent variable in my analysis is each student’s test score on the state’s math or ELA exam, standardized by subject, grade, and year. Newark students were typically tested in grades three through nine prior to the 2014–15 school year; thereafter, testing was expanded to include most students enrolled in grades nine through eleven.[10] The estimation sample includes students who participated in the initial assignment round of the Newark Enrolls process and who are successfully matched to records in NJDOE data with non-missing test scores.[11] All students in the estimation sample also have valid test scores in the year prior to assignment for use as a control, which excludes students seeking seats in grade three.
I report results from models that combine students from the first and second years of the DA system into a single regression. The dependent variable is thus the student’s standardized score, a given number of years following initial assignment. For example, the analysis of test scores one year following assignment uses the spring 2015 score for students who participated in the 2014–15 DA process and the spring 2016 score for students who participated in the 2015–16 DA process.
The Challenge of Measuring the Effect of Attending a Charter School on Student Outcomes
The policy-relevant research question is: What is the difference in later outcomes for students who enroll in a charter school, compared with the outcome that the same students would have achieved in a traditional public school? In economics parlance, we are interested in estimating the causal effect of enrolling in a charter school on later student outcomes.
Rather, estimating causal effects requires a strong research design that compares the outcomes of students who enroll in charters with a counterfactual group of students who are essentially identical in all ways except that they attend a traditional public school. One way of making these comparisons involves statistically controlling for observed differences—in race, family income, etc.—between charter and traditional public school students. Inevitably, there are unobserved differences, such as parental involvement and motivation, that cannot be captured in the data and thus cannot be controlled for directly.
The most convincing studies in the charter school literature take advantage of randomization within the process of assigning students to charter schools in order to account for both observed and unobserved differences between charter and traditional public school students. When there are more applicants for a charter school than available seats, students are often assigned a spot randomly. The only difference between students who applied and got in and those who applied and did not get in is a random flip of the coin—rather than a factor like parental involvement, which may itself influence outcomes. Thus, any difference in later outcomes between these groups can be interpreted as the causal effect of enrolling in the charter school. This approach, which is modeled on medical trials, is known as a randomized field trial (RFT).
However, it is not possible to use a conventional RFT to evaluate Newark charter schools during the period that I analyze because most charter schools in the city do not operate a single lottery to enroll students. Since the 2014–15 school year, Newark has used a centralized enrollment system, branded “Newark Enrolls,” which applies a DA algorithm to assign students to all public schools and most charter schools. However, the DA enrollment system has a randomized component that can be exploited to tackle the problem of unobserved differences between charter and traditional public school students.
The Process of Assigning Students to Schools in Newark
Rather than apply to each desired charter school separately, parents in Newark who want to enroll their child in a new school submit a rank-ordered list of school preferences to the centralized school district. Schools submit their number of available seats in each grade. Schools also have priorities for students based on a few factors. Siblings of students currently enrolled in a school are given highest priority, followed by students who live in the neighborhood surrounding a school. In Newark, schools with relatively few students eligible for free or reduced-priced lunch and those with few special-education students give a priority to some students in these categories. Magnet schools also provide a rank-ordered list of students whom they have identified as eligible for enrollment. Even after all these preferences are taken into account, however, there are still ties that need to be broken. This is where the random component comes in: students are assigned a randomly generated lottery number that is used when there are not enough seats to accommodate all the students who want to attend a school and are in the same school-preference category.
An algorithm assigns students to schools according to their preferences. Students are initially matched to their first-preference school. If, in all cases, the number of students with a first preference for a school is less than the number of available seats, the assignment is completed. But if more students list a school as their first preference than there are available seats, the students are ranked according to the school’s preference categories, and those with the highest priority are provisionally assigned to the school. Students not admitted to their top-ranked school are then considered for their second-ranked school, along with those who were provisionally admitted in the first step. A student who ranked a school second may bump one who was provisionally assigned to the school in the first stage if the former student is in a higher school-preference category or has a higher lottery number within the same category. The algorithm continues until all students are admitted to a school or the remaining students have no additional schools on their preference list. If students fail to obtain a seat at any of their listed schools and their current school offers their grade, they are reseated at their current school or at a “guaranteed” school that is typically based on their residence.
Unfortunately, the district was unable to provide the specific algorithm used to assign students: thus I was forced to replicate the assignment mechanism. Some data limitations prevent me from fully replicating the process.[12] Despite these limitations, I am able to replicate the true seating assignments for 85% of participating students.[13]
 All traditional public and magnet schools were required to participate in the Newark Enrolls process. Charter schools, however, could opt into or out of the system. Figure 1 shows which schools participated in 2014–15 and 2015–16. The causal estimates in this report apply only to charter schools that participated in Newark Enrolls.
I also report estimates for the relationship between enrolling in a nonparticipating charter school and student test scores. I find a positive relationship between enrolling in one of these schools and test scores; importantly, these results cannot be interpreted as causal. However, the fact that the estimate for attending a nonparticipating school is positive suggests that the estimates for participating charter schools are not the result of the least effective charter schools choosing not to enroll in the enrollment system.
Estimation Strategy
I apply the process recently developed by Abdulkadiroğlu et al. to estimate the effect of attending a charter school in Denver by calculating a propensity score within a DA-type assignment mechanism.[14] The method takes advantage of the fact that student and school preferences are fixed, which means that the student’s randomly generated lottery number determines school assignment. After students and schools submit their preferences, it is only the randomly generated lottery number that determines the schooling placement. By repeatedly simulating the assignment process, I can find the probability that a student with a given set of preferences and characteristics will be assigned to a charter school.
| Interpreting the Charts |
| The dot and number show the estimate of the causal effect of charter school attendance, measured in standard deviation units. The line moving through each dot illustrates the 95% confidence interval, which is a measure of the estimate’s precision. The true value may be higher or lower than the dot, but there is a 95% chance that the true charter school effect is found at some point on the line. Smaller lines reflect a more precise estimate. If the line contains both positive and negative values, we say that the estimate is “statistically insignificant” because we are less than 95% sure that the effect is different from zero. |
I generate random lottery numbers 500 times and use them in combination with the student and school preferences included in the data to simulate school assignments had the students been given a different random lottery number. The percentage of times that the algorithm assigns a student to a charter school is the conditional probability of random assignment, also known as the propensity score. This propensity score is included as a control in a two-stage least-squares regression that uses assignment to a charter school as an instrument for charter school enrollment that year to estimate the effect of enrolling in a charter school on later student outcomes.
This method has important advantages when compared with propensity matching, another commonly used research design. Unlike most propensity-matching approaches, my approach allows me to directly observe student and school preferences, and I can reasonably approximate student assignments. First, I am able to confine the estimates to evaluate only students who have some probability of receiving a charter school offer—that is, I compare students who enrolled in charter schools only with those students in traditional public schools who also expressed at least some desire and had a chance of attending a charter school. Second, the modeling of the enrollment process and the use of a randomized component in school assignment mimics assignment in a conventional lottery-based study.
This approach addresses a limitation in studies of a single lottery. Because the data come from a centralized enrollment system, I can observe student assignments to a broad set of charter schools. In addition, the estimation procedure within the DA framework allows me to increase the number of schools used in the analysis because the data are not limited to only those that are oversubscribed. There is variation in the assignment of individual students to any school due to their random lottery number from the larger DA process. All students with a propensity of enrollment to a charter school between zero and one contribute to the variation used for estimation.
Treating the estimate as the causal effect of enrolling in a charter school hinges on the assumption that, conditional on all the factors controlled for directly in the analysis, assignment to a charter school is associated with charter enrollment but has no other impact on student outcomes.[15] It is not possible to truly test whether any unobserved differences remain between a treatment and comparison group. However, in this case, I can speak to this issue by evaluating whether differences in the observed characteristics of those who were or were not offered a charter school seat remain after accounting for the propensity score. The Appendix reports some descriptive statistics and a test for covariate balance, the results of which suggest that this central assumption likely holds for the analysis.
A two-stage least-squares regression directly accounts for the fact that some students who were initially offered a charter school seat did not attend, and some students who were not initially offered a charter school seat did end up attending one via some other means. The model essentially divides the estimated effect of assignment to a charter school by the proportion of assigned students who actually enrolled in a charter. The effect of this adjustment is to provide an estimate for the impact of actual charter enrollment.
I apply this approach to data from the first two school years that the city used Newark Enrolls to assign students to schools, for school years 2014–15 and 2015–16. My primary estimates combine data from both entry cohorts, which increases the number of available observations in the analysis and improves the precision of the estimate.
The data allow me to directly address the common accusation that charters systematically “counsel out,” or otherwise remove low-performing students. The later-year estimates presented below represent the effect of enrolling in a charter school on student outcomes a given number of years later, regardless of whether the student remained enrolled. That is, if a student enrolled in a charter school in one year and moved to a traditional public school the following year, that student is treated as part of the charter group. This data structure is appropriate and provides the most policy-relevant estimate. Later-year estimates should not be interpreted as the effect of attending a charter school for that number of years, or as the effect of attending a charter school during that year. The data in this report do not allow for convincing estimation of those type of effects.
Results
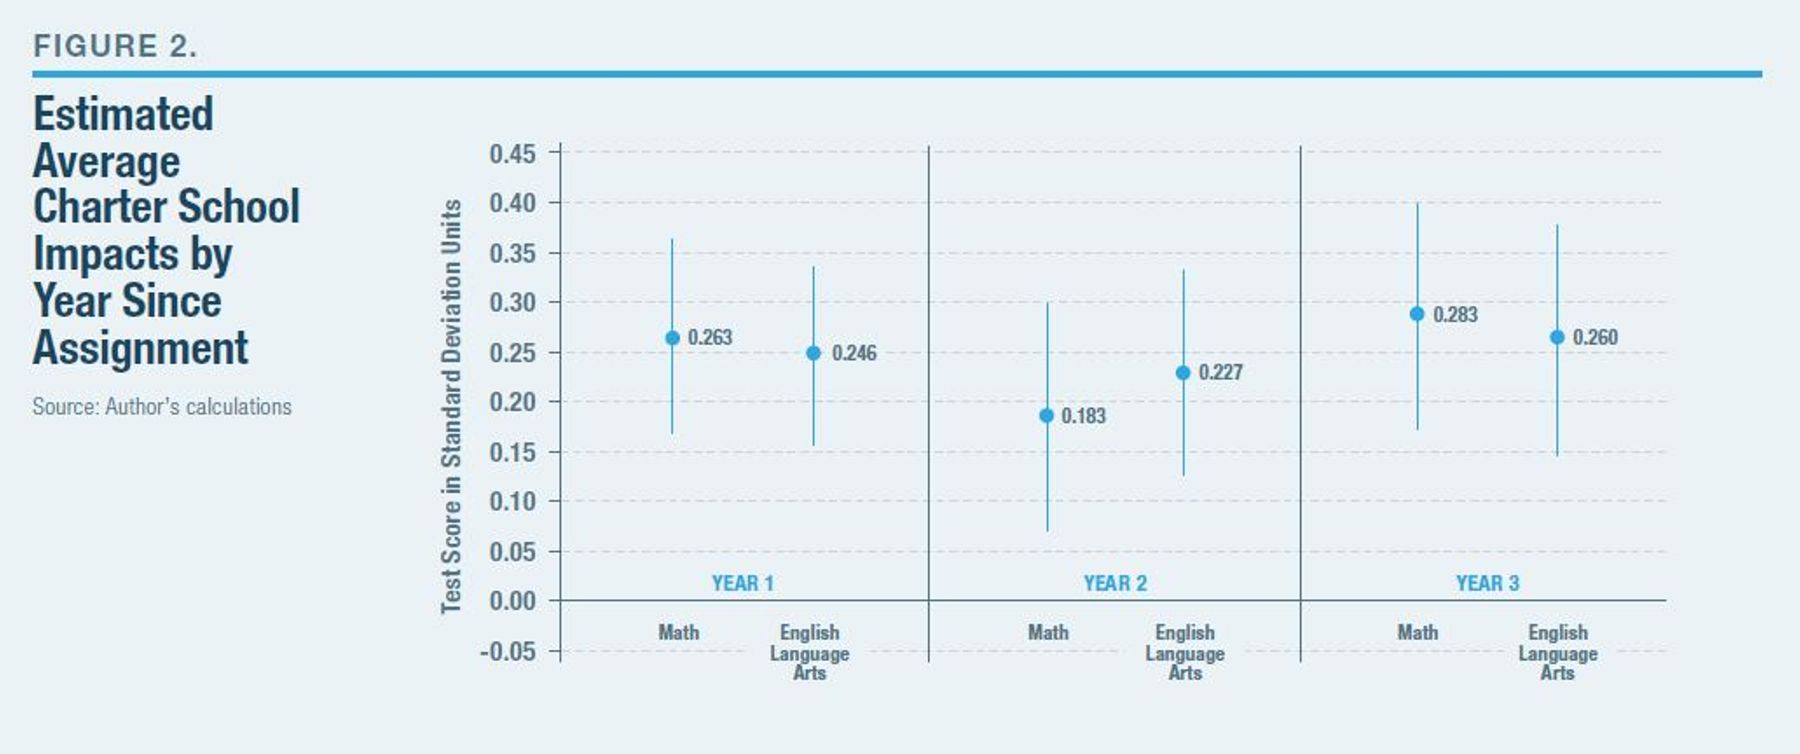
Figure 2 illustrates the results from estimating the effect of enrolling in a participating charter school on student math and ELA scores one through three years later. The analysis estimates that enrolling in a charter school that participated in Newark Enrolls, rather than a traditional public school, leads to an increase of 0.263 and 0.246 standard deviations in a student’s score that year in math and ELA, respectively. These results are statistically significant and are considered “large,” according to the standard for interpreting effect sizes in education recently posited by Kraft.[16]
The figure also reports the effect of enrolling in a charter school on student outcomes two and three years later. Recall that these estimates should be interpreted as the effect of enrolling in a charter school on the student’s test score after the respective number of years, regardless of whether the student remains in the charter school for the entire period. Further, the results from these models are not directly comparable with the Year 1 effect, or with each other, because in each subsequent year the sample becomes smaller as some students leave Newark or, more often, enter an untested grade. Keeping these factors in mind, the analysis nonetheless finds a relatively stable impact from initially enrolling in a charter school on average student test scores over time.
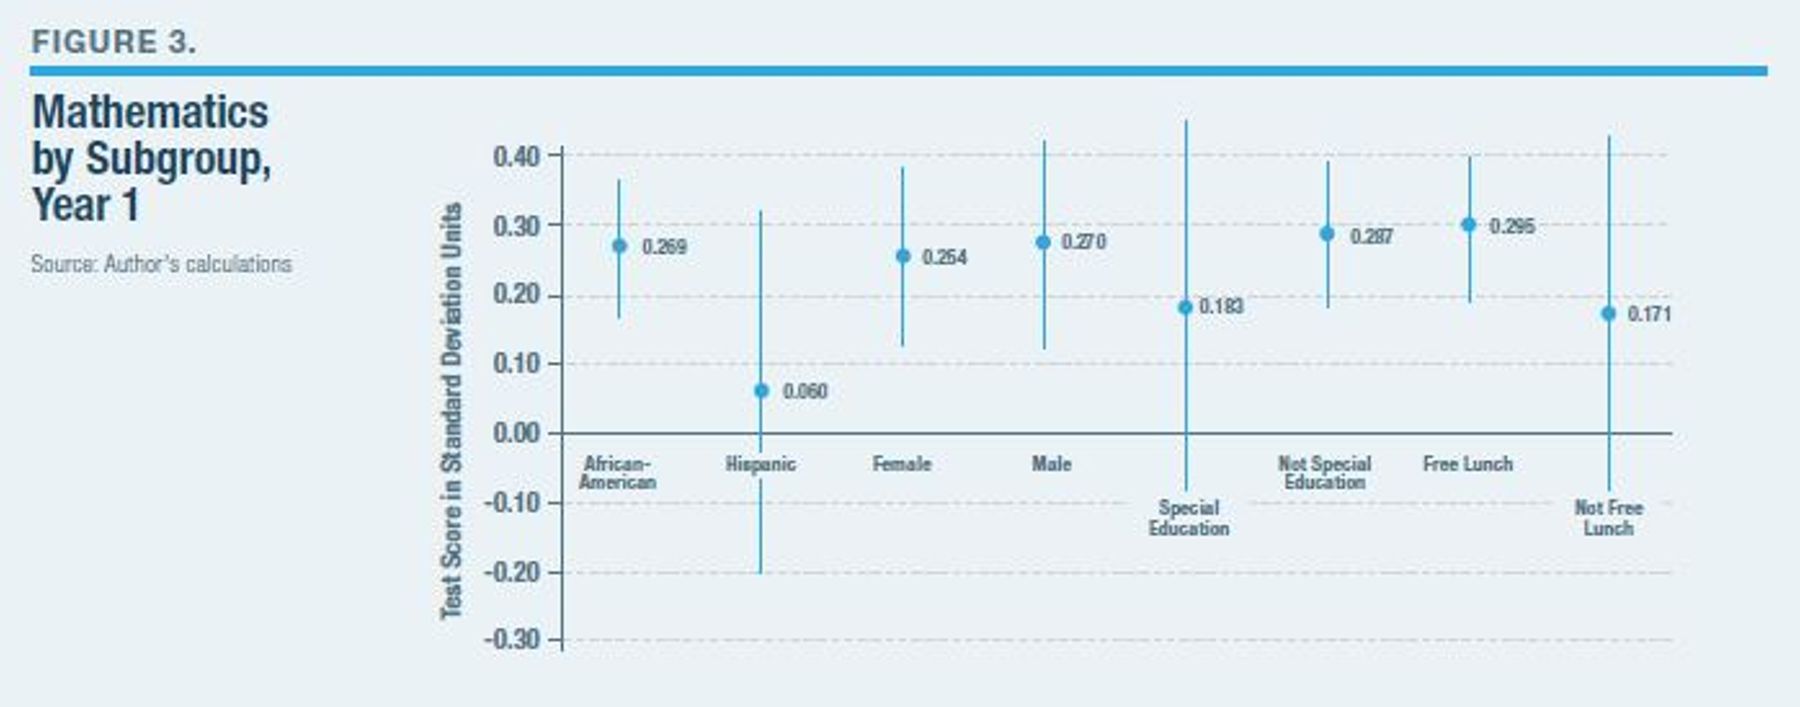
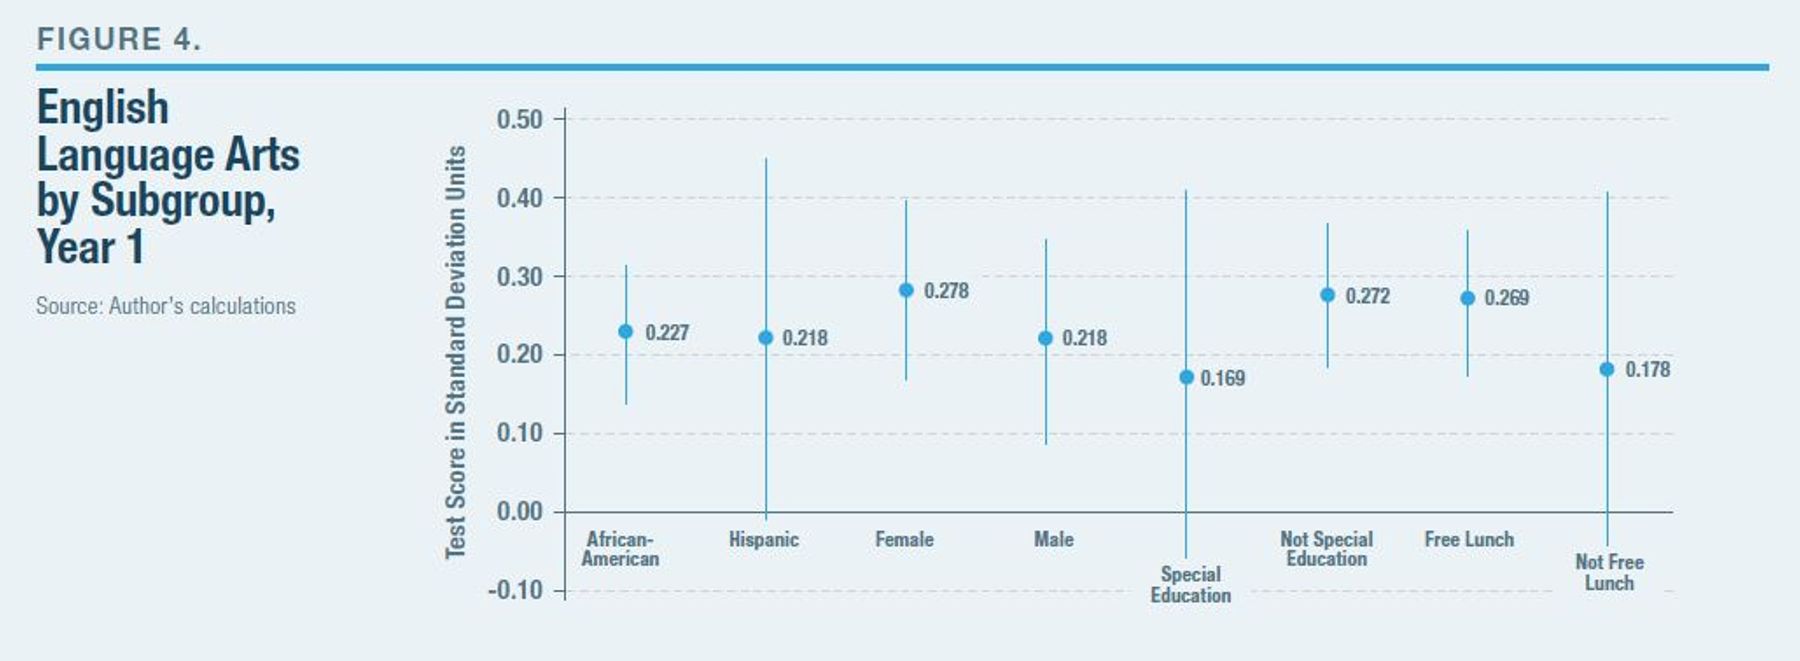
Figures 3 and 4 report the results from analyses that separately measure the effect of enrolling in a charter school on student scores in math and ELA, broken down by gender, race, special-education status, and qualification for free lunch. There appear to be some differences in the effect of enrolling in a charter school by student subgroup, though the models are estimated too imprecisely to detect the differences as statistically significant. Notably, the estimates are uniformly positive and, in several cases, are statistically significant. With the exception of Hispanic students on the math exam, the confidence intervals suggest that the analysis can credibly rule out that enrolling in a charter school negatively affected student test-score outcomes.
Let us now consider whether the effect of attending a charter school differs by operator. Figures 5 and 6 illustrate the estimated effect over time of enrolling in one of three types of charter schools. The first type is schools that are operated by either KIPP or Uncommon public schools. About half the city’s charter school students are enrolled in a school operated by one of these two providers. The figure also reports estimates for the average effect of attending a participating charter school not operated by KIPP or Uncommon. Because there are not enough data available to separately measure the impact of each of these schools, I must group them into a single aggregated category. However, there is more substantial variation in the educational philosophies and environments among these schools than between KIPP and Uncommon. It’s plausible that some of these schools may provide large benefits that I am unable to capture adequately.
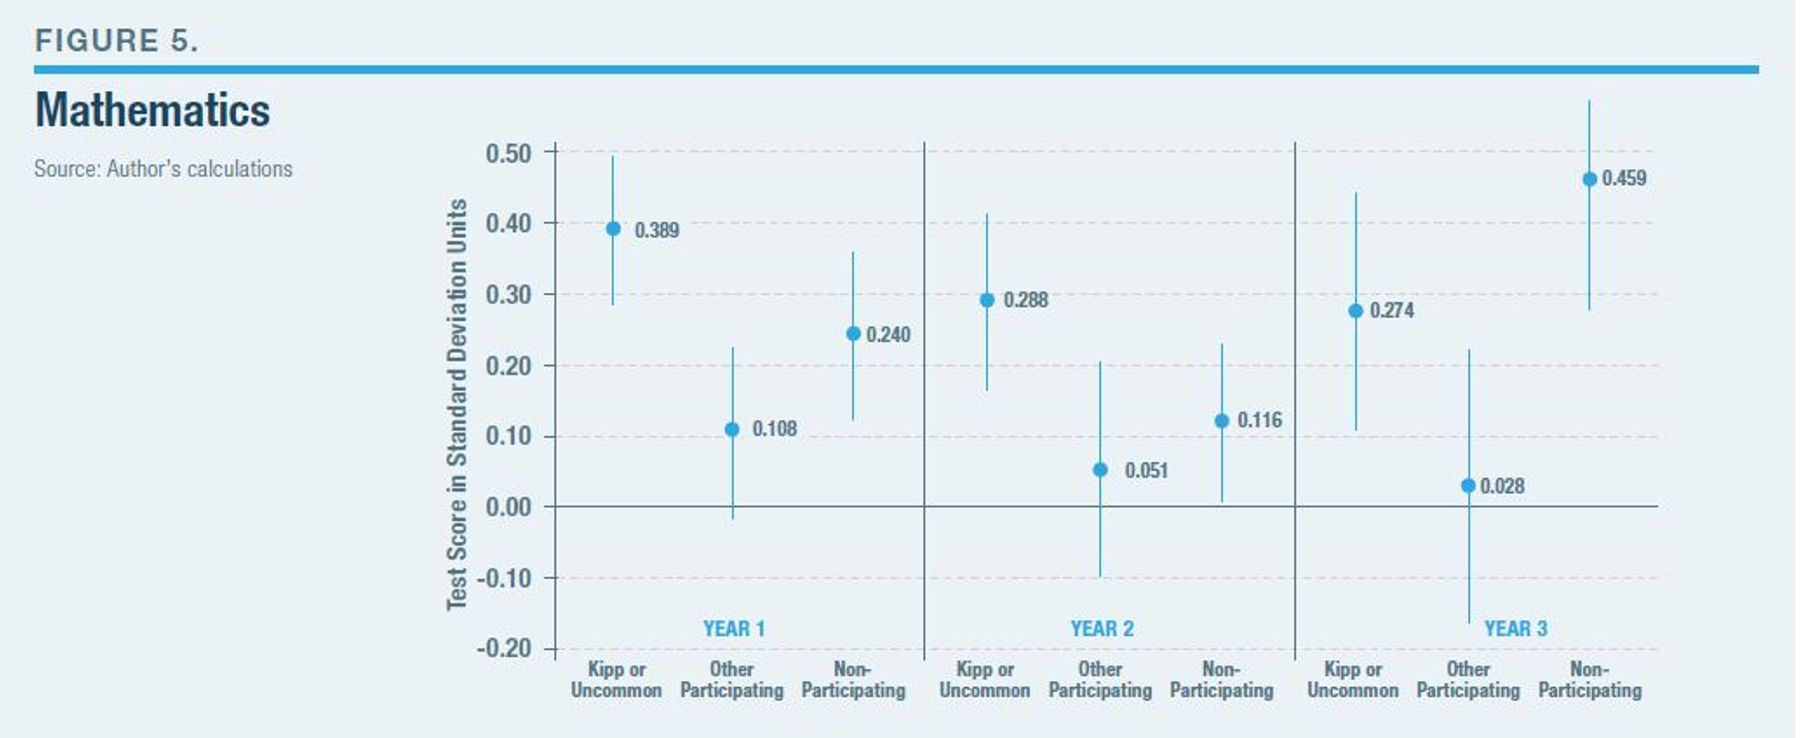
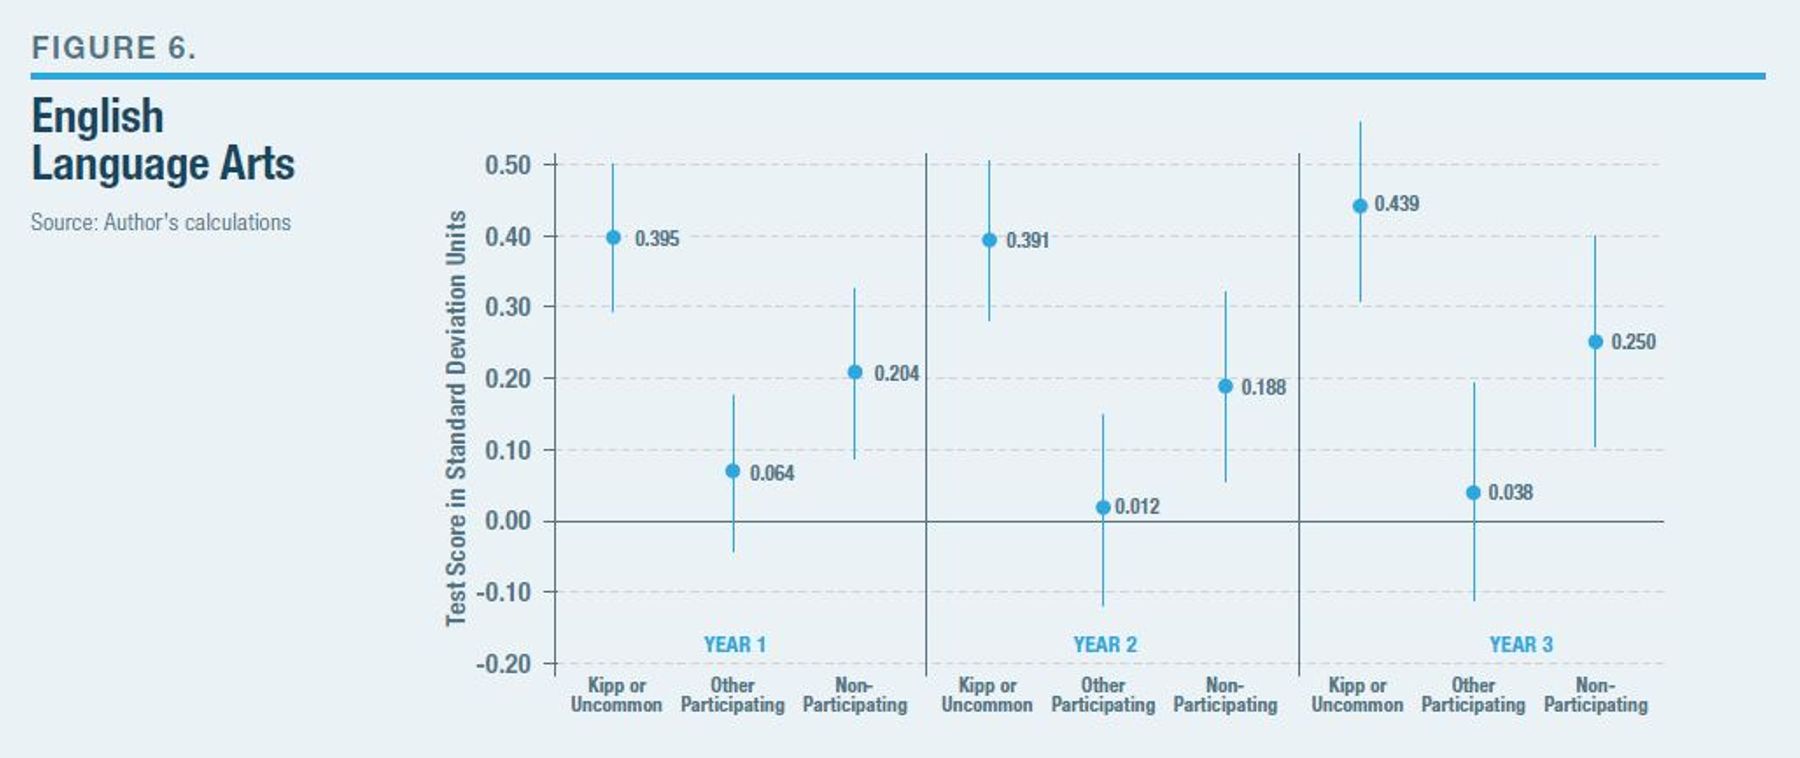
Finally, the figures report the estimate for enrolling in a charter school that did not participate in Newark Enrolls during the respective year. Recall that because assignment to these schools cannot be modeled within the DA process, the estimates for nonparticipating charter schools should not be given a causal interpretation.
Enrolling in a charter school operated by KIPP or Uncommon leads to statistically significant, and quite large, improvements in student math and ELA scores. Participating charter schools operated by other entities, by contrast, do not produce a statistically significant effect on student ELA scores, on average. I do find evidence of a positive initial effect in math from attending a participating charter school not operated by KIPP or Uncommon; this effect narrowly misses the threshold for statistical significance, at the 5% level illustrated in the figure, but is statistically significant at the 10% level. The magnitude of this effect is meaningful, though significantly smaller, than that of attending a charter school operated by KIPP or Uncommon.
Further, though not causal, it is notable that the estimates suggest a positive relationship between attending a charter that did not participate in the Newark Enrolls process and later student outcomes. This suggests that the main findings are not likely to be driven by the composition of who participates in the system, with only the most effective charters choosing to participate, thus excluding the least effective schools from the causal analysis.
Conclusion
Newark offers an example of an effective charter school sector operating at a scale large enough to truly have an impact on local educational outcomes. I find evidence that attending a Newark charter school that participated in the city’s common enrollment process has a statistically significant and large positive effect on student test scores.
Few previous studies in the charter school literature employ a research design that takes advantage of randomized admissions and include a broad subset of charter schools within an urban area. Several previous lottery-based studies of urban charter school impacts are limited because they observe only a small subset of charters within the locality that provided the necessary data, and some other studies evaluated charter sectors before they reached a meaningful enrollment level.
My findings from Newark are similar to those of other recent studies in Denver and Boston, which observed nearly the whole universe of charter school students. Taken together, these findings strongly suggest that charter school sectors that enroll a substantial share of local students are capable of producing large effects on student outcomes relative to local traditional public schools. Notably, in each of these cities, a large portion of students attending charter schools enroll in a charter that employs principles found by previous studies to have significant positive effects on student test-score outcomes. That is not true for some other cities.
These findings provide strong evidence that charter school enrollment in Newark has had a meaningful causal effect on student outcomes for several years, even in a city where charter schools already enroll a significant portion of public school students. As charters continue to grow, future research using causal identification methods in other localities that exhibit different distribution of charter school types is necessary.
Appendix
Test for Covariate Balance
The central assumption behind the strategy employed in this report to identify the causal effect of enrolling in a charter school is that conditional on all the factors controlled for directly in the analysis, assignment to a charter school is associated with charter enrollment but has no other impact on student outcomes. In addition to providing descriptive statistics overall, Figure 7 reports the results of a test for covariate balance meant to address the plausibility of this assumption.
 The first two columns of the table compare the characteristics of all Newark students with those of students who participated in the Newark Enrolls process. Participating students have lower baseline math and ELA scores and are more likely to be in special education than other students in the city.
The remaining columns are restricted to include data only for students who participated in Newark Enrolls and had a probability of being assigned to a charter school that is between zero and one. Recall that these are the students who contribute the variation that the model uses to measure the effect of enrolling in a charter school. Among the group of students with some probability of assignment to either a charter or traditional public school, Column 3 reports the characteristics of students who were not offered a charter school seat, and Column 4 reports the characteristics of students who were offered a charter school seat. Column 5 reports the difference between the first two columns and indicates whether the difference is statistically significant at the 5% or 10% level of confidence.
The table shows that those with some probability of charter school assignment have meaningfully different characteristics from other Newark Enrolls participants. More essential for the estimation is that important differences remain in the characteristics of students who were or were not offered a charter school seat, even when I restrict the comparison to include only those with some probability of charter school assignment. Compared with students with some probability of charter assignment who were not offered a charter school seat, students who were assigned to a charter school have significantly higher baseline math and ELA scores and are more likely to have enrolled in a charter the previous year.
My estimation approach assumes that controlling for the propensity score sufficiently accounts for all pretreatment differences between those with a given probability of assignment to a charter who were assigned to a charter, and those with the same probability who were assigned to a traditional public school. Column 6 reports the difference in the mean value for each characteristic between those who were or were not offered a charter school seat after accounting for the propensity score within an OLS regression. Controlling for the propensity score has the effect of removing most of the differences in characteristics observed in Column 5. After conditioning on the propensity score, there remain no significant differences at the conventional 5% confidence level, though there are marginally significant differences in the probability that the student is female and the probability that the student attended a charter school in the previous year. A joint F-test on all the covariates listed fails to find an overall significant difference in the adjusted baseline characteristics of those offered or not offered a charter school seat, though it is somewhat disconcerting that the test only slightly misses the threshold for marginal significance at the 10% level.
The existence of some marginally significant differences in the baseline characteristics of those students who are or are not assigned to charter schools even after conditioning on the propensity score is likely due to the incomplete modeling of the assignment process described previously. Even these slight differences in covariate balance are cause for some caution when applying a causal interpretation to the estimates. The primary regressions directly account for the differences in the above observed characteristics. The potential concern is that the existence of these observed differences imply that there could also be unobserved differences between the charter and non-charter groups for which the model does not account.
In the more technical companion to this report, I address the potential that the propensity score does not sufficiently create like comparison groups, by showing that the estimated effect of attending a participating charter school is very similar in models that control for the propensity score and other observed covariates listed in Figure 7 and in models that control only for the propensity score. This pattern of results implies that the propensity score itself sufficiently controls for the observed characteristics in the comparison for students attending a participating school. It is reasonable, then, to assume that the propensity score also accounts for unobserved differences between charter school and non-charter school students.
Endnotes
Photo: monkeybusinessimages / iStock / Getty Images Plus
Are you interested in supporting the Manhattan Institute’s public-interest research and journalism? As a 501(c)(3) nonprofit, donations in support of MI and its scholars’ work are fully tax-deductible as provided by law (EIN #13-2912529).