The Mediocre State of New York State Schools

Photo: Elliott Kaufman/The Image Bank via Getty Images
Executive Summary
New York has built one of the nation’s largest and most expensive public education systems. The state spends more per pupil than any other state, pays among the highest teacher salaries, maintains some of the most rigorous teacher certification requirements, and identifies a larger share of students with disabilities than nearly every other state. But student outcomes remain mediocre. On the 2024 National Assessment of Educational Progress (NAEP), only 31% of fourth- and eighth-grade students reached proficiency in reading, while 37% of fourth-graders and 26% of eighth-graders reached proficiency in math, placing the state in the middle of the national rankings.
New York’s high spending does not lead to better student results primarily because the state does not measure what works or use evidence to guide decisions. The root of the problem is a governance system—led by the Board of Regents and the State Education Department—that makes no one truly responsible for results. This report examines how this flaw contributes to issues regarding the way New York identifies and supports students, prepares teachers, sets graduation standards, and manages its schools.
These findings suggest three main priorities for education in New York: measure what works, follow the evidence, and fix the accountability system.
First, New York should measure what works. The state should implement an educational return on investment (EROI) system to publicly track what each district, charter school, and student group achieves with taxpayer money. Elementary students should also be screened in reading and math several times a year. This way, struggling students can be identified as early as kindergarten, rather than waiting until third grade, at which point gaps have grown.
Second, New York should follow the evidence. The state should ensure that teacher training is based on the best research on reading and math instruction and allow teachers certified in other states to help fill shortages. In addition, the NY Inspires diploma reforms should include safeguards to ensure that a New York State diploma has the same value everywhere. The state should remove the cap on charter schools, which have often outperformed district schools, and it should allow families to use the Federal Tax Credit Scholarship Program, rather than losing out on up to $1 billion annually to students in other states.
Third, New York needs to fix its accountability system. The state cannot measure what works or use evidence effectively if no one is responsible for results. New York should require public reporting on special education, school-based mental health services, spending, and outcomes. It should also review the current governance system—the legislature appoints all members of the Board of Regents, and the Regents choose the commissioner of education—while the governor, who is most accountable to voters, does not appoint anyone.
Introduction
Spending and Enrollment
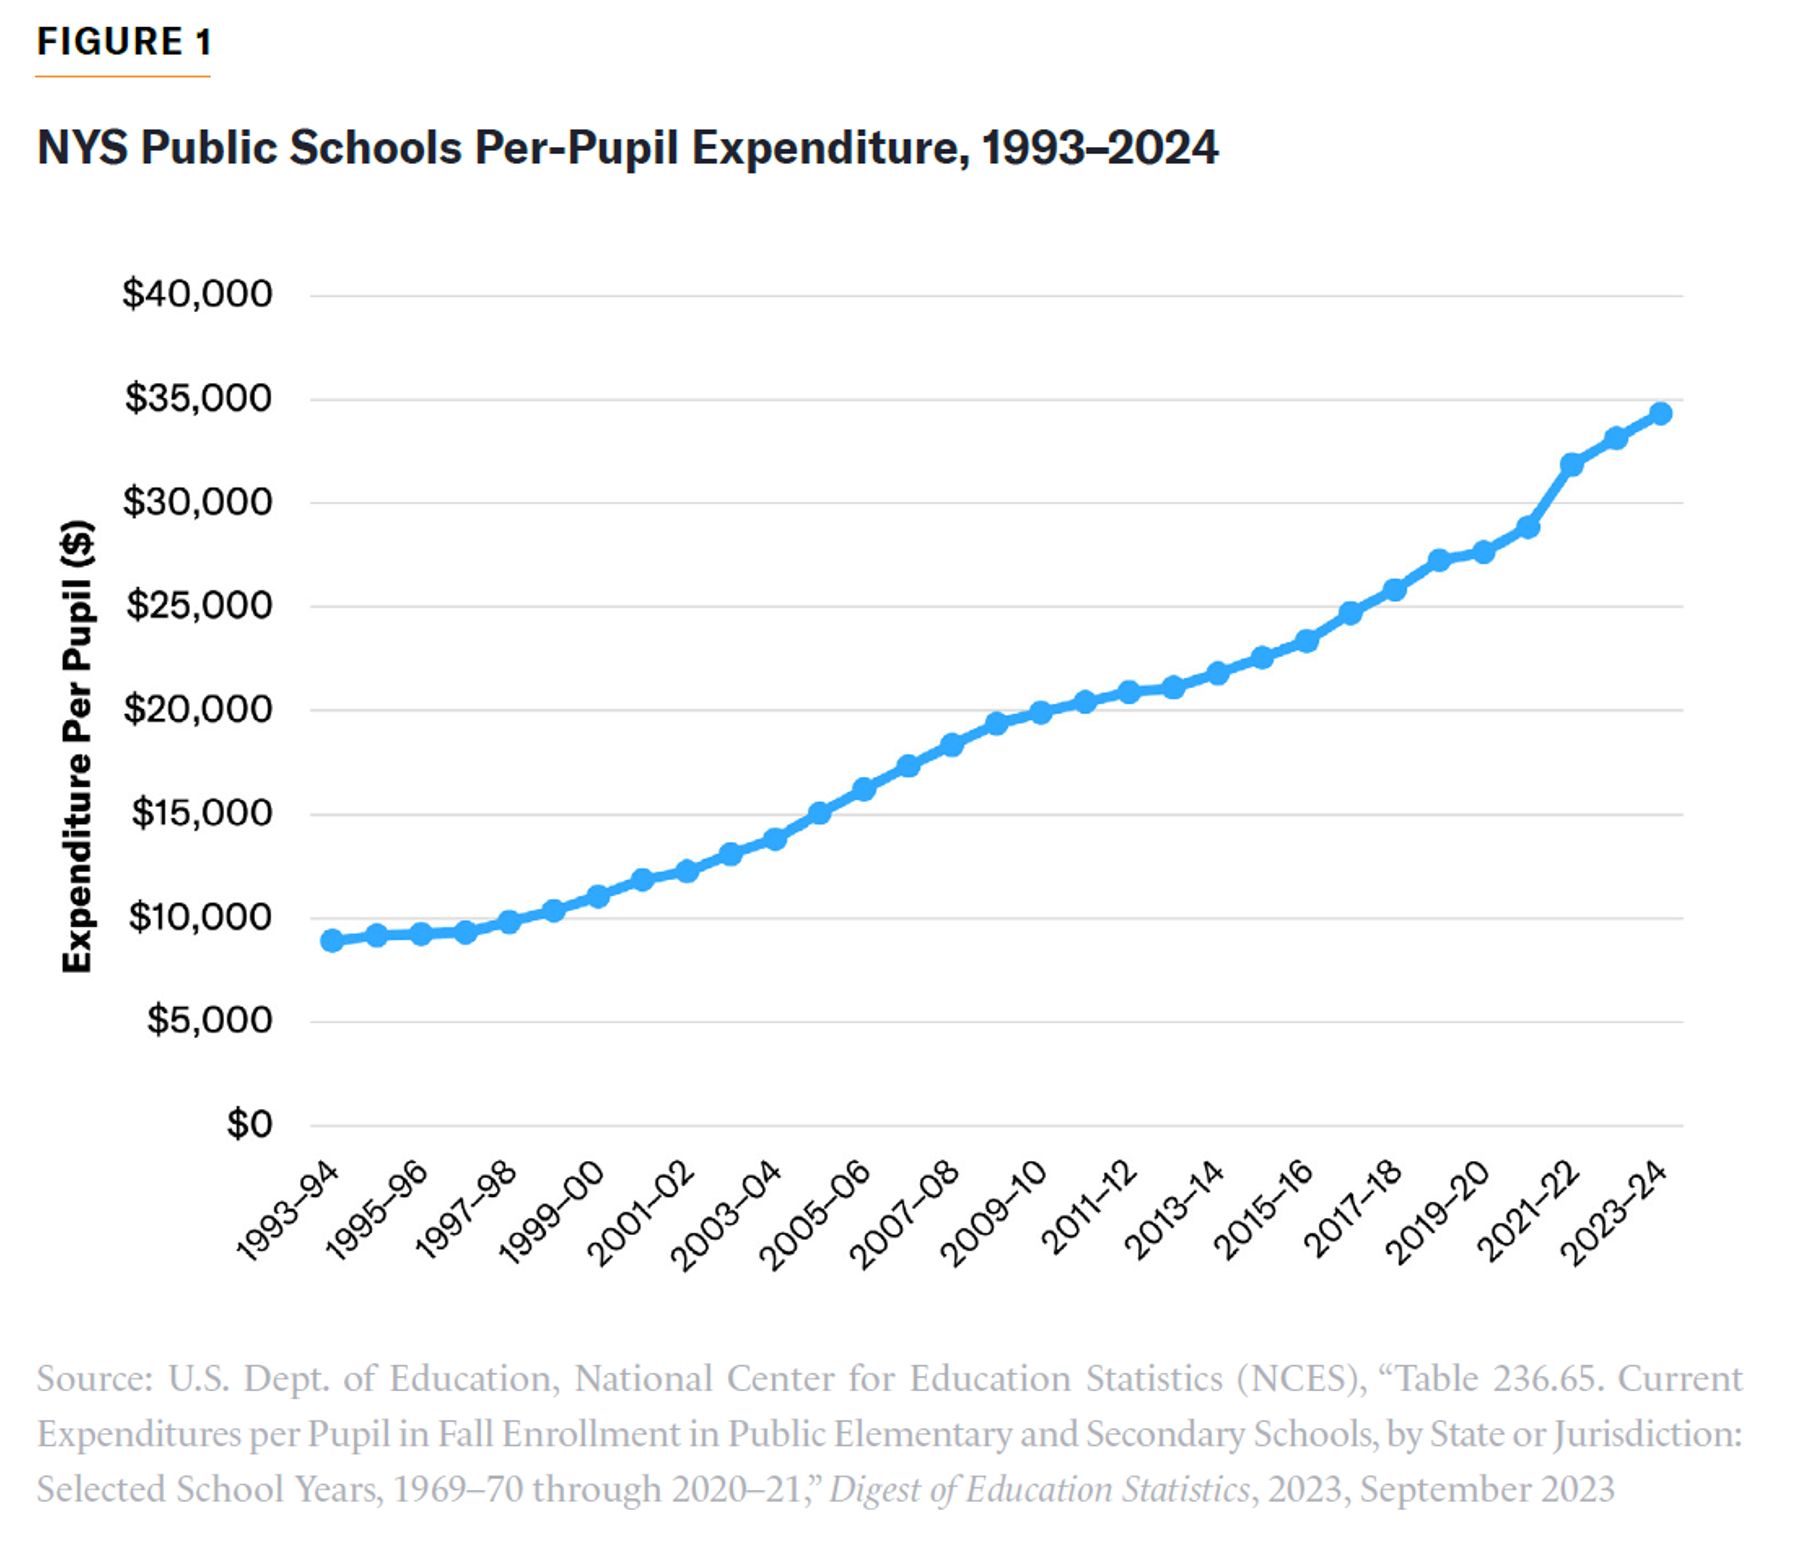
New York State spends more per pupil than any other state in the nation. During the 2023–24 school year, per-pupil expenditures reached approximately $34,300, more than double the national average (Figure 1).[1] Spending has increased over the past three decades, while enrollment has declined. Between 1993–94 and 2023–24, per-pupil expenditures rose significantly, from approximately $8,900 to $34,300.[2] Even after adjusting for inflation, this represents a near doubling of per-pupil spending ($8,900 in 1993–94 is equivalent to roughly $18,800 in 2023–24 dollars).[3] During the same period, statewide enrollment declined from 2.67 million to 2.42 million students.[4]
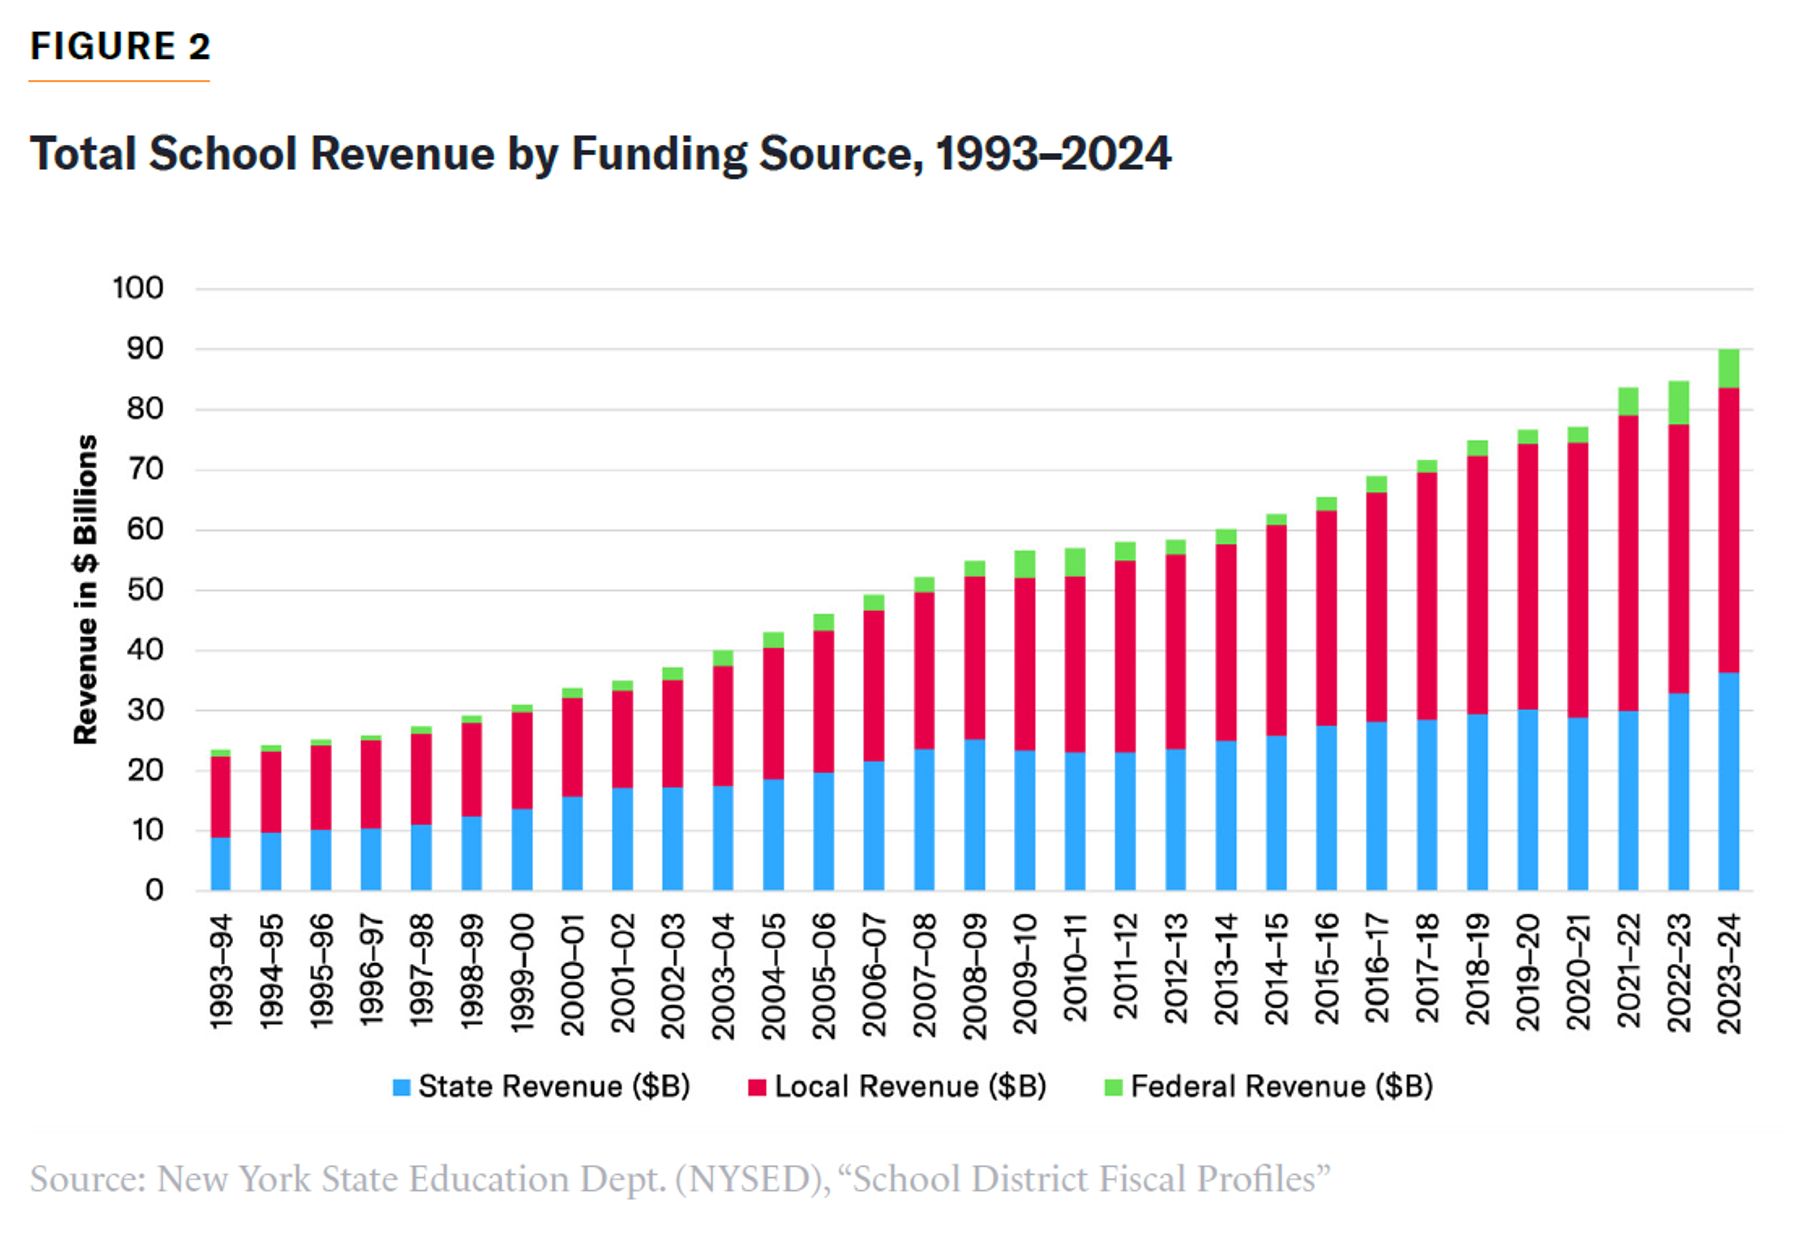
Total school revenue has also grown, from $23.5 billion in 1993–94 to $90.1 billion in 2023–2024 (Figure 2).
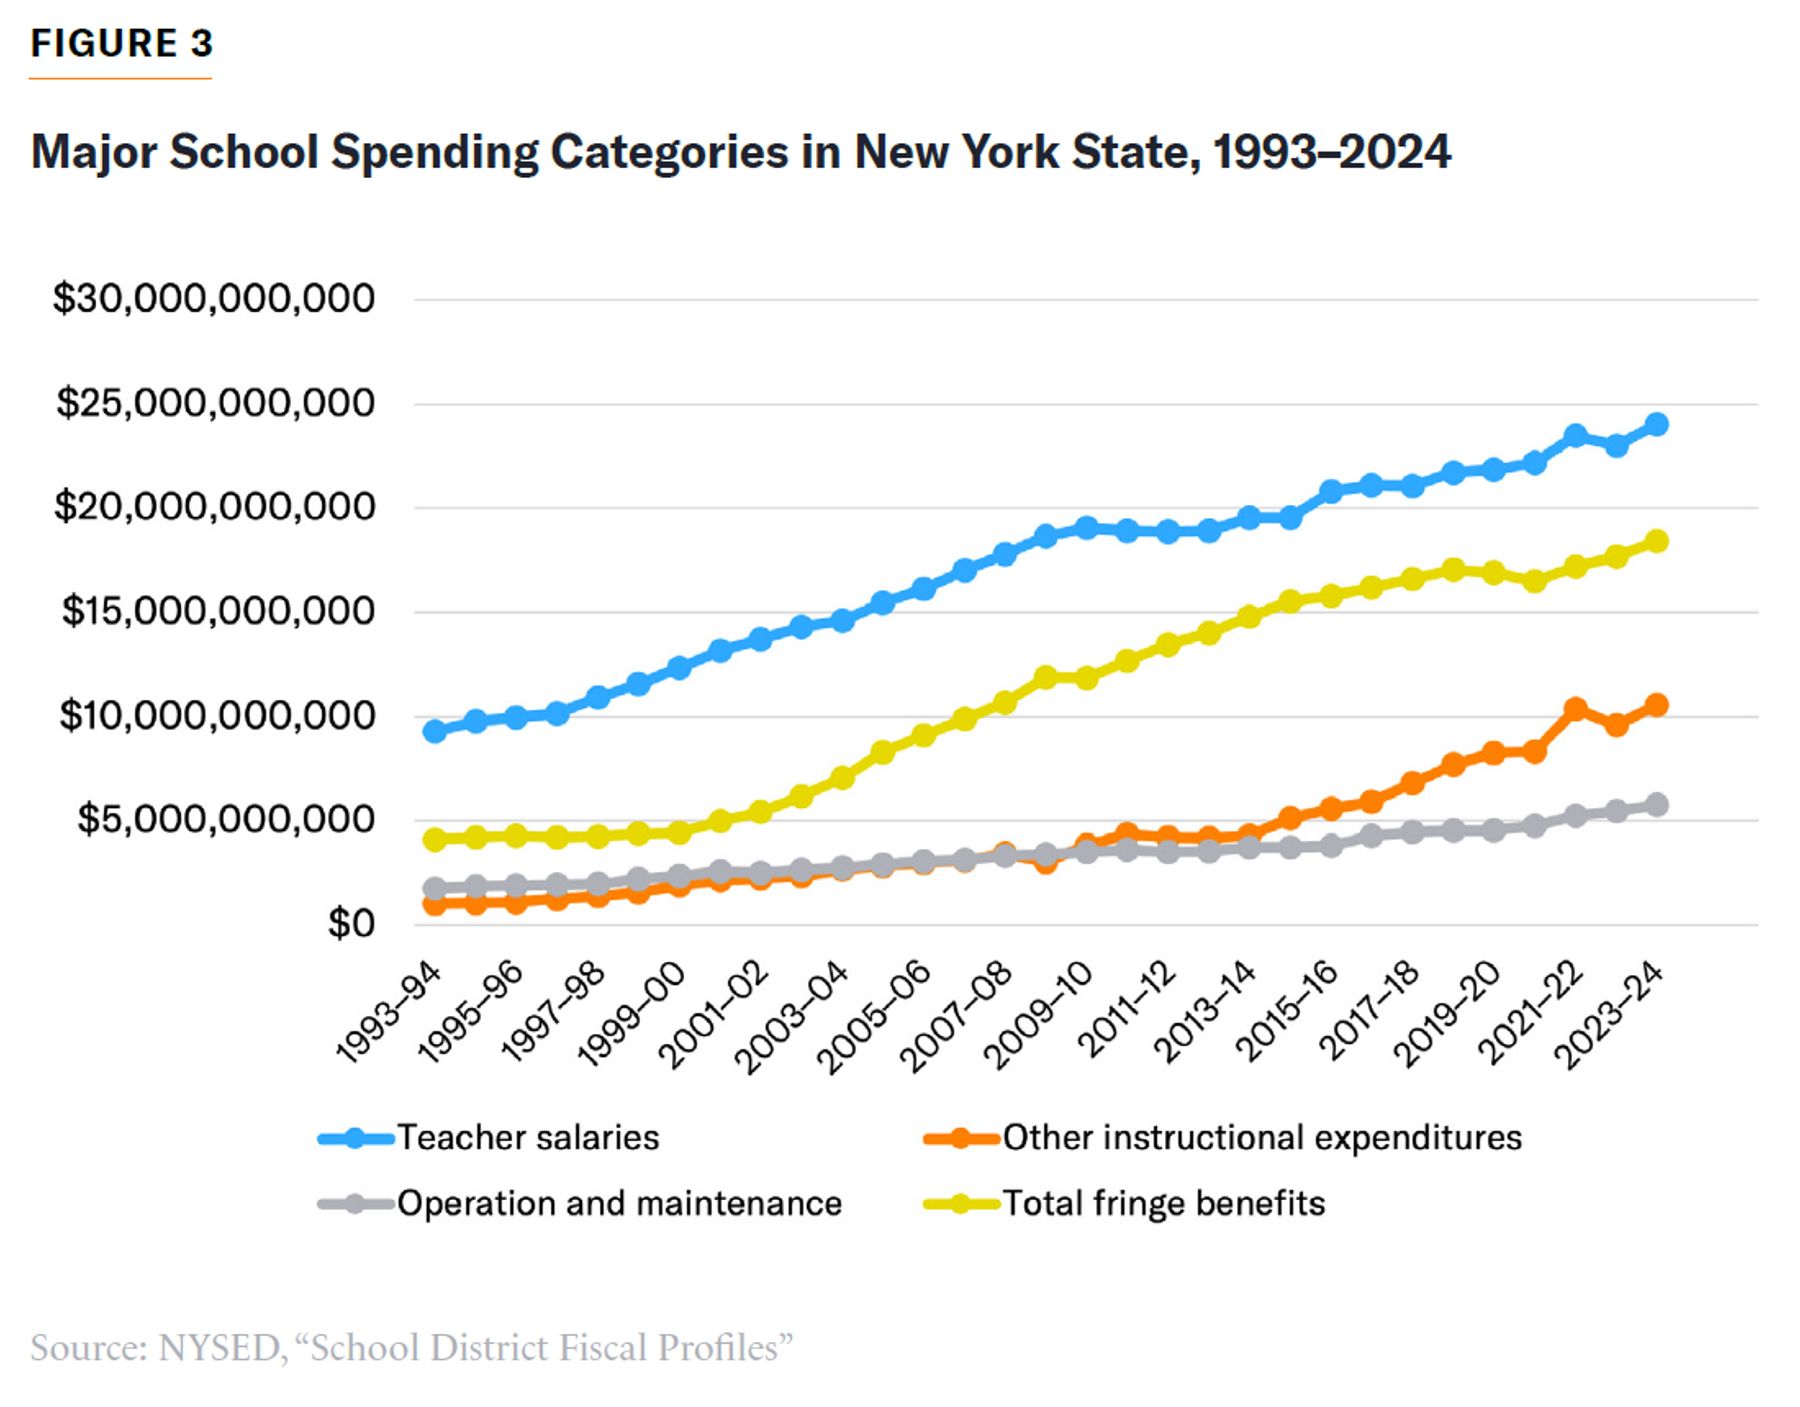
The composition of educational spending has also changed over time. Teacher salaries, historically the largest category of school expenditures, declined as a share of total spending, from 41% in 1993–94 to 29% in 2023–24. Over the same period, spending on fringe benefits, debt service, transportation, and other instructional expenditures increased (Figure 3). While teacher salaries remain the largest single expenditure category in absolute dollars, an increasing share of educational spending is directed toward activities other than direct classroom instruction.
Student Achievement
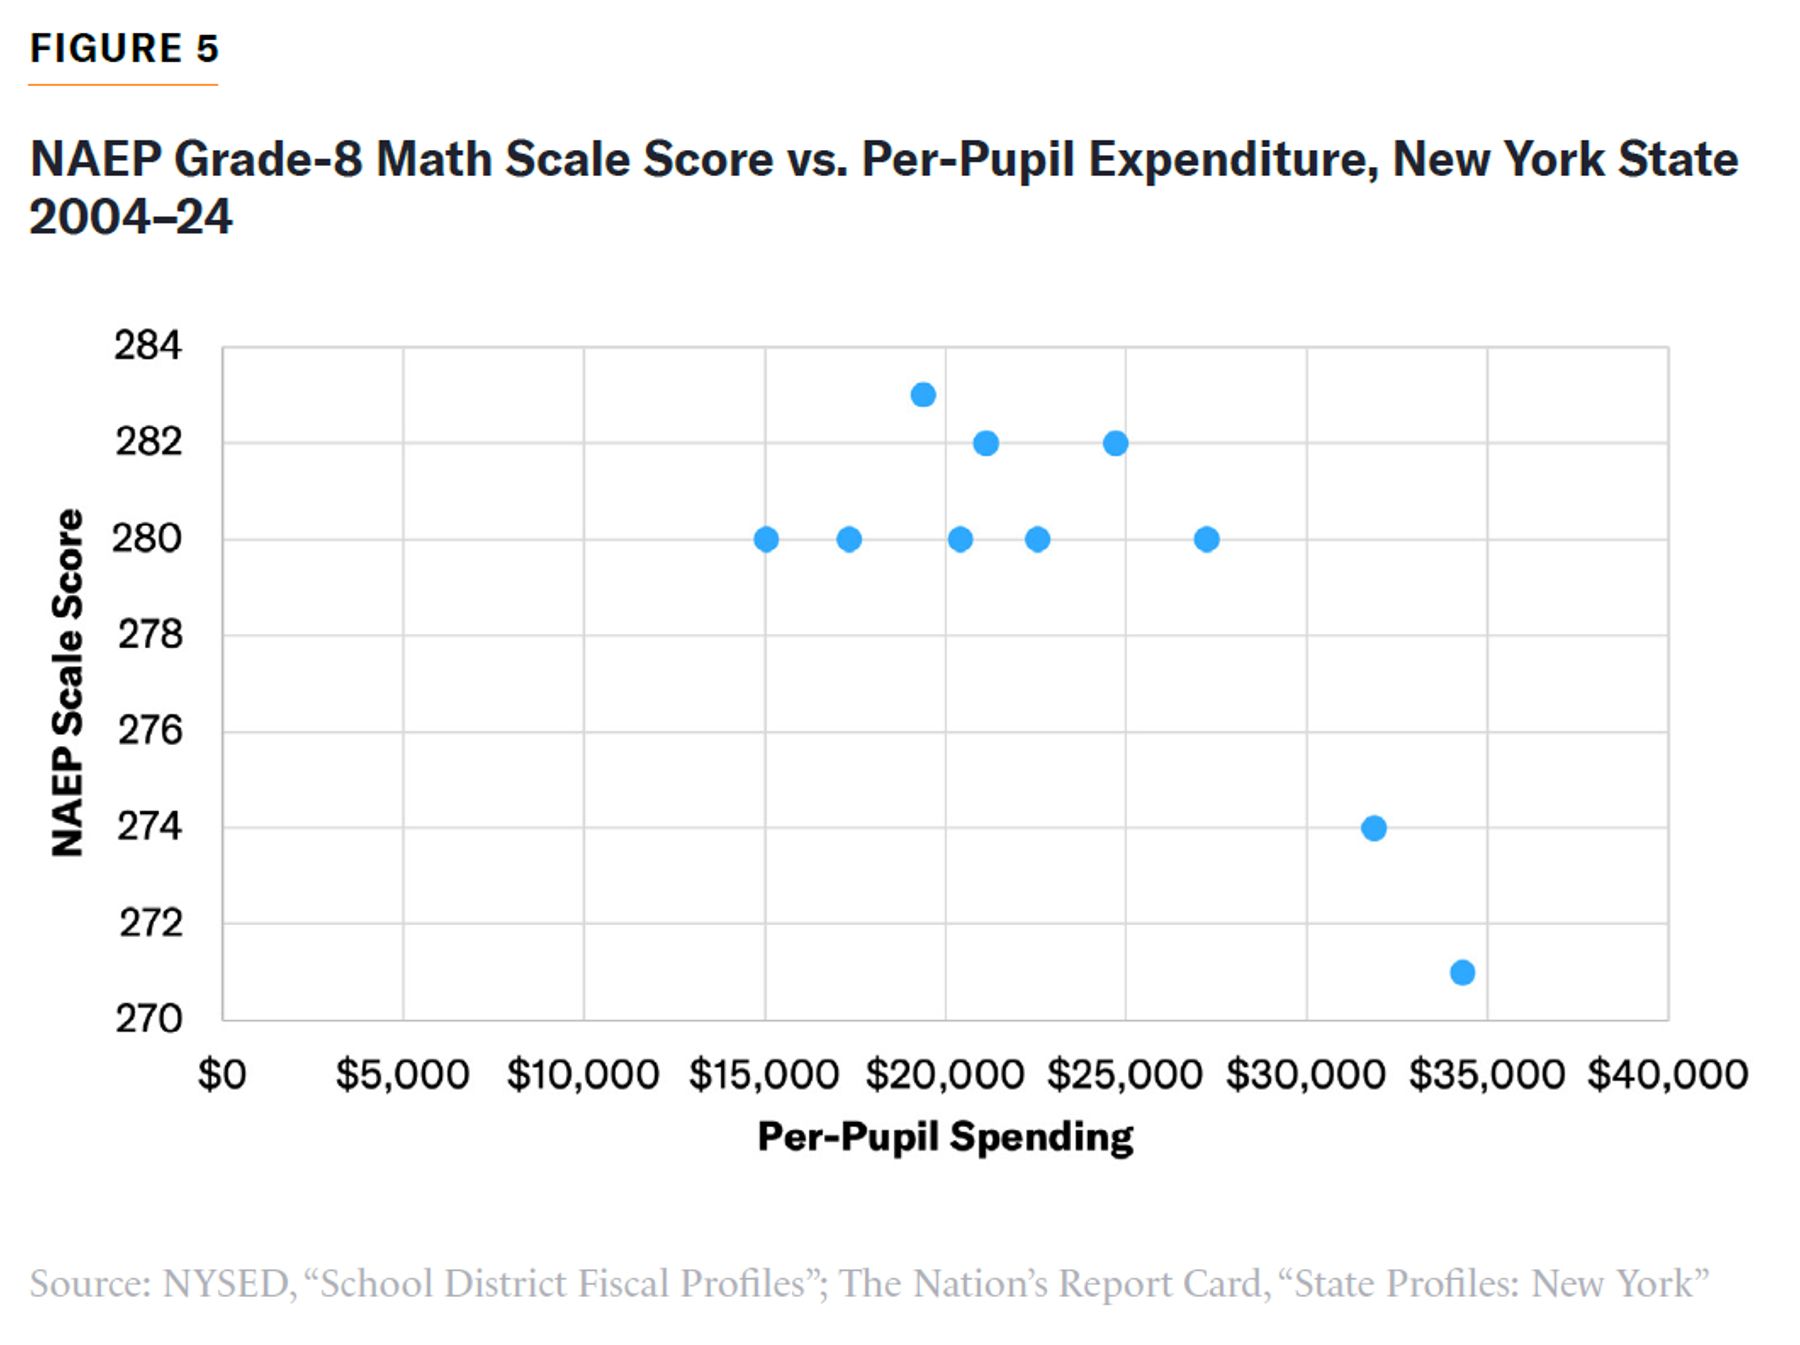
New York’s performance on the National Assessment of Educational Progress (NAEP), the nation’s most consistent measure of long-term academic performance, has shown little improvement over the past two decades. Between 2004–05 and 2023–24, fourth-grade reading scores declined from 223 to 215, while eighth-grade reading scores fell from 262 to 258. Fourth-grade mathematics scores declined from 238 to 234, and eighth-grade mathematics scores fell from 280 to 271. Each measure is now at or near its lowest level in two decades (Table 1).[5]
NAEP classifies performance as basic, proficient, or advanced. Across all tested subject and grade levels, the average New York student scores in the basic range.[6]
The decline in student outcomes did not begin with the Covid-19 pandemic. Between 2004–05 and 2018–19, performance was either stagnant or declining on every NAEP measure. The pandemic merely accelerated a preexisting trend of declining progress. Even excluding the pandemic years (2021–22 and 2023–24), student performance in most subjects shows little improvement over two decades.
Amid declining outcomes over the last two decades, New York has attempted several reforms, including new academic standards and revised teacher evaluation systems. But none of these reforms has led to any evidence of sustained improvement.
TABLE 1
NYS NAEP Scores, 2004–24
| Year | Grade 4 Reading | Grade 8 Reading | Grade 4 Math | Grade 8 Math |
| 2004–05 | 223 | 262 | 238 | 280 |
| 2006–07 | 224 | 264 | 243 | 280 |
| 2008–09 | 224 | 264 | 241 | 283 |
| 2010–11 | 222 | 265 | 238 | 280 |
| 2012–13 | 224 | 264 | 240 | 282 |
| 2014–15 | 223 | 268 | 237 | 280 |
| 2016–17 | 222 | 267 | 236 | 282 |
| 2018–19 | 220 | 263 | 237 | 280 |
| 2021–22 | 214 | 260 | 227 | 274 |
| 2023–24 | 215 | 258 | 234 | 271 |
Source: The Nation’s Report Card, “State Profiles: New York”
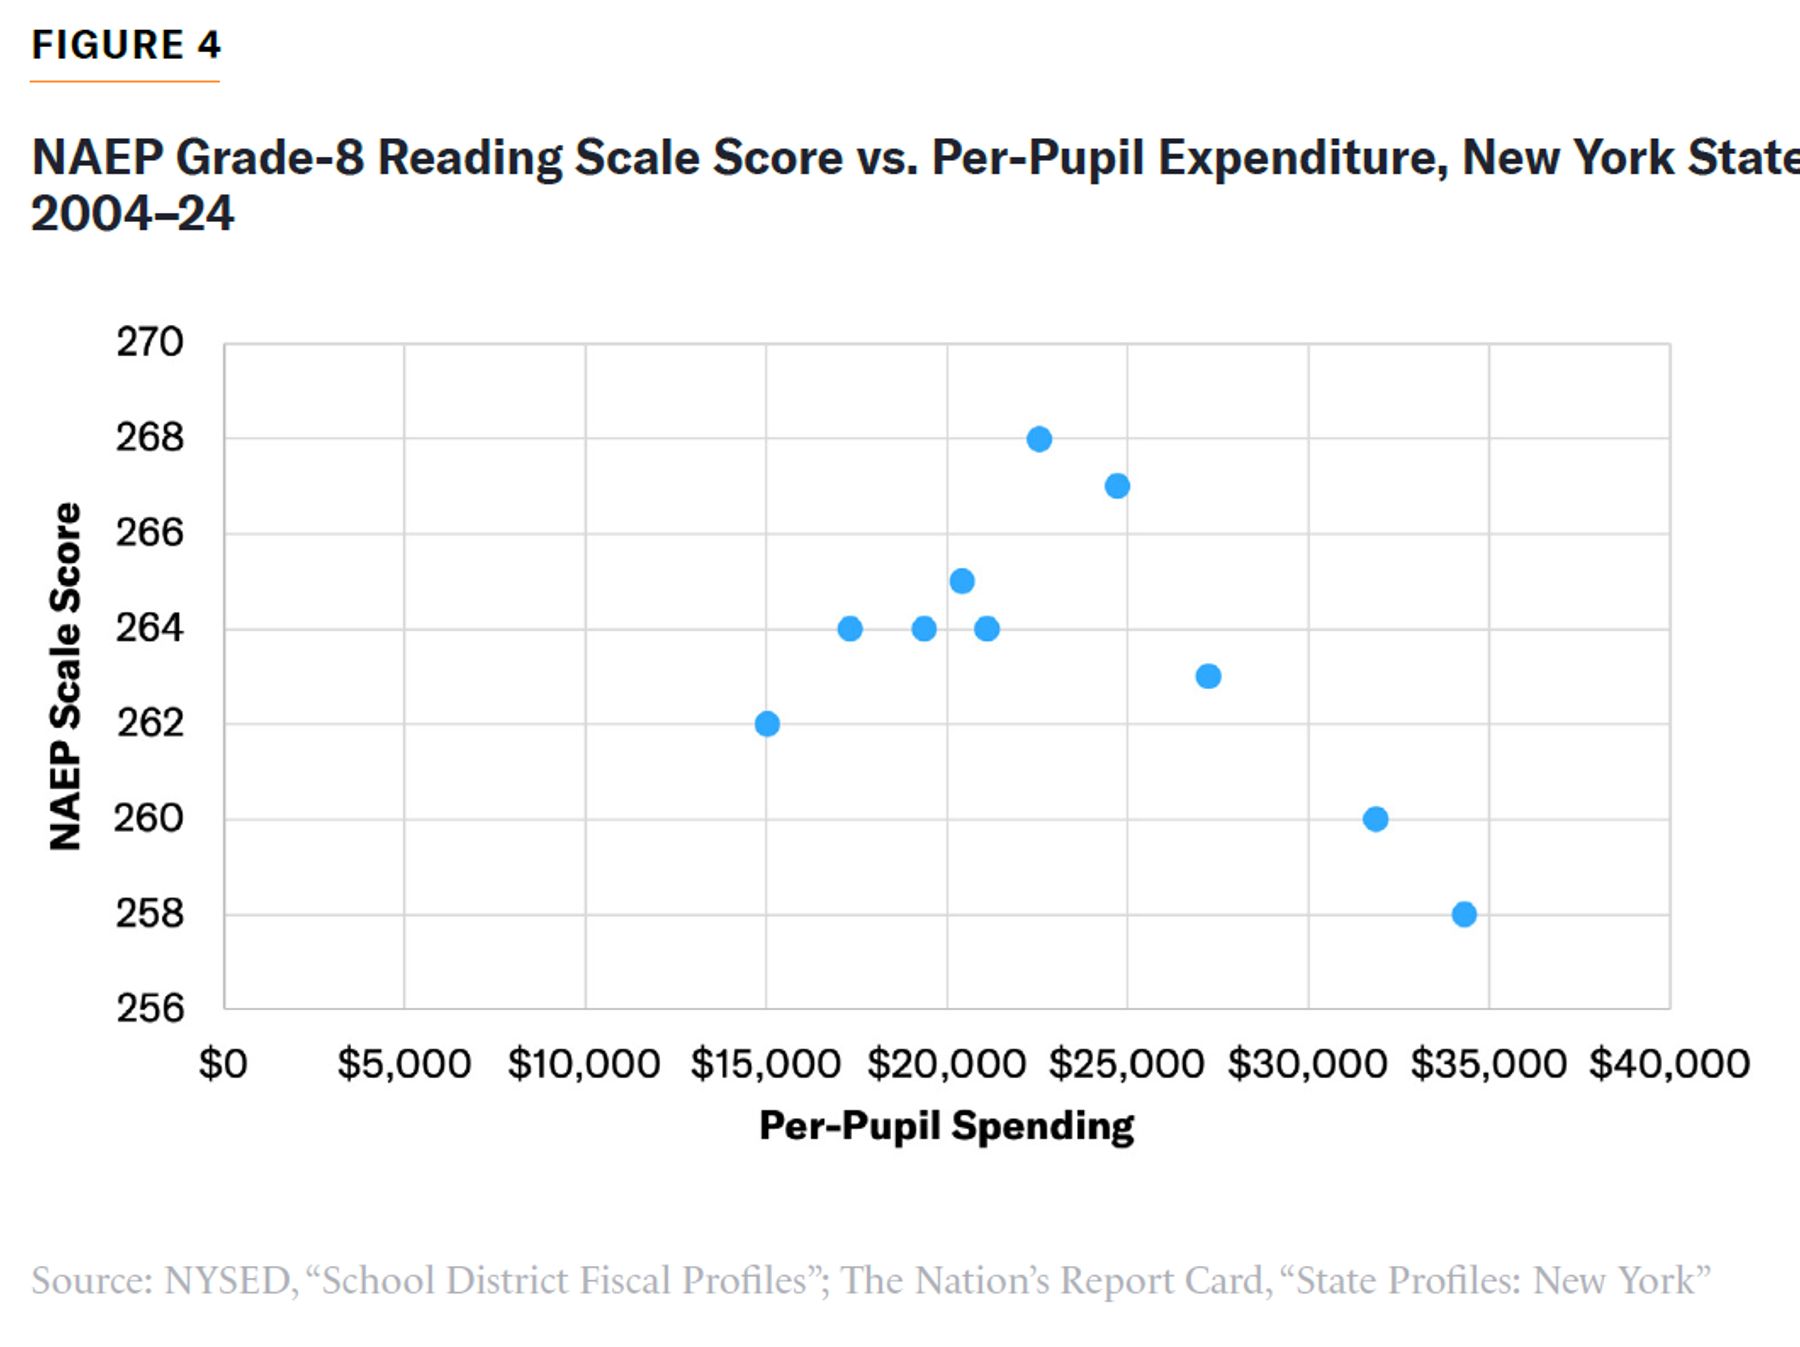
NAEP scores also reveal a disconnect between the state’s education spending and student outcomes. From 2004–05 to 2023–24, the highest-spending years correspond to the lowest NAEP scale scores, while the highest scores came in years where the state spent far less than what is spent today. Clearly, increases in per-pupil expenditures have not produced better student outcomes (Figures 4 and 5).
Graduation Outcomes
Graduation rates in New York State have increased over the past decade. In 2025, the statewide graduation rate reached 85.5%, compared with 81.7% in 2016.[7] But over that same period, the share of students receiving the most rigorous type of diploma declined. In 2021, 42.1% of students graduated with the highest-level credential (the Regents Diploma with Advanced Designation), compared with only 30.8% of students in 2025, an 11.3-point decrease over four years. The less demanding Local Diploma, which had nearly disappeared by 2022, was awarded to more than 5% of students in 2025. The standard Regents Diploma also became more prevalent as the Advanced Regents credential declined (Table 2).
Regents examinations were canceled or optional from June 2020 through January 2022. Students who passed the corresponding course were exempted from the exam requirement, with exemptions counted as passing scores for all diploma types. As examinations returned, the state simultaneously made diploma requirements more flexible. In May 2022, the Board of Regents approved a “special appeal,” allowing students scoring 50–64 on Regents examinations (well below the standard passing score of 65) to graduate, applicable to any diploma type.[8]
Composition of NYS Public High School Diplomas, 2016–25
| June Graduation | Regents Diploma | Regents Diploma with Advanced Designation | Local Diploma | Non-Diploma | Total Graduation Rate |
| 2016 | 45.8% | 31.3% | 4.7% | 0.7% | 81.7% |
| 2017 | 44.1% | 33.0% | 5.1% | 0.7% | 82.1% |
| 2018 | 43.4% | 33.5% | 5.7% | 0.7% | 82.6% |
| 2019 | 43.7% | 33.6% | 6.1% | 0.6% | 83.4% |
| 2020 | 43.4% | 38.7% | 2.7% | 0.5% | 84.8% |
| 2021 | 42.4% | 42.1% | 1.5% | 0.5% | 86.1% |
| 2022 | 44.6% | 41.8% | 0.6% | 0.5% | 87.0% |
| 2023 | 49.6% | 36.2% | 0.6% | 0.5% | 86.4% |
| 2024 | 51.2% | 32.9% | 2.2% | 0.4% | 86.3% |
| 2025 | 49.4% | 30.8% | 5.3% | 0.5% | 85.5% |
Source: NYSED, “Graduation Data”
Spending, achievement, and graduation trends present a mixed picture of educational performance in New York State. Resources have increased, and graduation rates have risen; yet academic achievement has remained stagnant, and fewer students are earning the state’s most rigorous diploma. The problem is that the state does not measure what works, and it does not use the evidence when it exists.
Measurement: How NYS Identifies and Supports Students
As we have seen, New York’s mediocre student outcomes cannot be explained by a lack of spending. The focus should instead be on how the state identifies, supports, and educates students throughout their academic careers. This is where the measurement problem begins.
Early Childhood
Early childhood investment in New York includes both childcare programs, governed by the Office of Children and Family Services, and prekindergarten programs, governed by the State Education Department. Governor Kathy Hochul has made universal childcare and early childhood expansion a major policy priority. The state’s FY 2023 budget committed $7 billion over four years to childcare access, eligibility expansion, subsidies, and workforce supports, described as the largest childcare investment in the state’s history.[9] Subsequent budgets have built on that base: the FY 2027 budget includes an additional $1.7 billion in funding, bringing total spending on childcare and prekindergarten services statewide to approximately $4.5 billion.[10] The administration has outlined a pathway toward universal access, with a commitment to make high-quality pre-K seats available for all four-year-olds statewide by the 2028–29 school year, along with expanded 3K access in partnership with New York City and a new “2-Care” program for two-year-olds.
According to the National Institute for Early Education Research (NIEER), New York’s state-funded preschools enrolled about 159,000 children in 2023–24, covering 56% of the state’s four-year-olds and 19% of three-year-olds.[11] New York also meets seven of NIEER’s 10 quality benchmarks for state preschool programs, which include measures of teacher qualifications, staff-to-child ratios, class size, and continuous quality monitoring.[12]
With expanded access to early childhood programs, it is even more important to identify students who are not on track academically, before achievement gaps widen. Yet New York lacks any consistent statewide measures of school readiness, and it does not require universal screening in reading or mathematics. Therefore, the state has limited ability to determine whether students entering school are prepared for grade-level instruction and, more broadly, whether expanded early childhood investments are producing long-term academic gains.
Universal Screening
Universal screening allows schools to identify students who are not on track to meet grade-level expectations before instructional gaps widen and become difficult to close. In both reading and math, early identification is one of the most consistently supported practices for preventing long-term achievement gaps.
New York does not require universal K–3 reading screening. According to the New York State Dyslexia and Dysgraphia Task Force (2024), 20 states have adopted or exceeded the International Dyslexia Association’s recommended K–2 screening practice, and 16 others have partially met that standard.[13] New York has done neither. The state has no universal, evidence-based reading screening requirement before the third-grade ELA exam. By the time students are first assessed under the state testing system, those who have fallen behind in foundational reading skills have typically been struggling for several years without systematic identification.
As of 2025, 37 states require reading intervention for struggling students, while only seven require math intervention.[14] New York requires neither. Although early math screening remains less common nationally, some states have recently considered or adopted legislation in this area, suggesting that math most likely will follow the trajectory that reading policy has taken over the past decade.[15]
Recent state actions have focused on improving reading instruction without establishing screening requirements. The 2024 Back to Basics initiative required Science of Reading–aligned instruction, and the Center for Dyslexia and Dysgraphia was established in 2025 to provide guidance and resources.[16] Neither initiative, however, created a statewide screening mandate.
New York has fallen behind. While several screening-related proposals have been introduced in the legislature, none has been enacted. Without universal screening, instructional decisions in early grades rely on inconsistent district-level practices and on the judgment of individual teachers, who vary in ability to identify struggling students. Students who fall behind in foundational skills are often not identified until exams are required in third grade or later. At that point, the gaps in student achievement that will persist throughout middle and high school are already well established. Screening is the most basic form of measurement in education, and NYS has neither adopted nor followed the example set by most other states.
Multitiered Systems of Support and Response to Intervention
When students are falling behind, schools are expected to provide increasingly intensive support through a tiered system of intervention. NYS has several frameworks designed to provide that support. In practice, however, the requirements vary by subject, identification often depends on annual state testing rather than ongoing screening, and implementation is left largely to local districts.
New York operates three overlapping intervention frameworks: 1) Response to Intervention (RTI) is required for students in grades K–4 in reading; 2) Academic Intervention Services (AIS) apply to students in grades K–12 and are primarily triggered by performance on state assessments; and 3) the state has also developed a broader Multi-Tiered System of Supports (MTSS-I)—but as of 2026, it remains a pilot initiative and not a statewide requirement.[17]
These frameworks result in several inconsistencies. RTI is required for K–4 reading, but not for math at any grade level. AIS eligibility for grades 3–8 is triggered by state test scores, so students are often identified only after struggling for a year or longer. For students in grades K–2, identification depends largely on district-developed procedures, making early intervention inconsistent across the state. And the most comprehensive framework, MTSS-I, is not yet implemented statewide.
A tiered intervention system depends on the reliable identification of students who need support. Without universal screening, students often enter intervention systems only after performing poorly on annual assessments. By that point, foundational gaps may have persisted for years. The consequences of these gaps are particularly visible in math, where the state lacks universal screening requirements and has even fewer pathways available for intervention.
On the most recent NAEP, only 37% of New York fourth-graders reached proficiency in math, ranking the state 38th nationally.[18] Governor Hochul made math instruction a priority in her 2026 State of the State address, but the proposals focus on curriculum guidance and teacher training, rather than on screening or intervention.[19] As an earlier Manhattan Institute brief documented, this is a familiar pattern for the state, which has revised its math standards three times in two decades, with stagnant or declining performance after each revision.[20] The state has repeatedly tried to make progress by changing what is taught, without measuring how well that teaching is being received and without intervening with students who are falling behind.
Special Education
New York identifies a disproportionately high share of its students as having disabilities. According to federal data for the 2022–23 school year, 21% of New York’s public school students received services under the Individuals with Disabilities Education Act, tied with Pennsylvania and Maine for the highest rate in the nation. The national average was 15%, with state rates ranging from 12% to 21%.[21]
The state’s elevated rate is driven largely by students with speech or language impairment classifications, who accounted for 29.6% of New York’s students with disabilities, compared with approximately 19.0% nationally.[22] By contrast, the portion of students with a specific learning disability is slightly lower in New York than nationwide.
Why does New York have so many students with disabilities? Due to limited transparency, it is hard to know for sure. Speech and language impairment is identified through clinical analysis, rather than standardized diagnostic criteria. Identification practices thus may account for much of the gap. NYSED maintains a federal monitoring framework to identify inappropriate patterns in special-education classifications. However, unlike many states, New York does not publicly report which districts have been flagged through this process, limiting the transparency for stakeholders.
A series of audits by the Office of the State Comptroller documented weaknesses in the oversight and delivery of special-education services. A 2024 audit found that 83% of responding districts maintained wait lists for preschool special-education services and that 93% reported provider shortages.[23] The audit found that NYSED lacks real-time data on student enrollment, service delivery, and district wait lists. Earlier audits identified delays in evaluations and service provision, including cases in which students did not receive evaluations or services within federally required timelines.
Identification depends on intervention systems that are inconsistently implemented and not supported by universal screening. At the same time, provider shortages, delayed evaluations, and service delivery challenges make it difficult to ensure that students receive the supports to which they are entitled. Students’ experiences often vary substantially, depending on the district in which they live. Here again, the state has invested substantial sums of money but does not track what it gets in return.
School-Based Mental Health
Over the last decade, New York State has given public schools a greater responsibility for youth mental health, while developing a growing infrastructure to deliver mental health programming and clinical services through the education system.[24] These efforts, nationally, have not improved students’ mental health or academic outcomes, but they have created significant accountability gaps in public schools.[25]
School-based mental health in New York State operates through two distinct delivery systems, one governed by the state education department (NYSED) and the other by the state Office of Mental Health (OMH) and Department of Health (DOH). Separately, mental health services for certain students are mandated under federal special-education law. These systems operate under different legal authorities, professional and clinical standards, and privacy frameworks, creating a fragmented infrastructure for youth mental health with overlapping obligations but no common accountability structure. Medicaid serves as an important financing mechanism of each delivery system.[26]
The first delivery system encompasses universal mental health programming and school-based mental health staffing governed by NYSED. School counselors and school psychologists are certified by NYSED, not licensed through the behavioral health system.[27] NYSED-certified school staff are not subject to the same scope-of-practice rules, supervision requirements, or disciplinary processes as licensed clinical social workers, counselors, or psychologists practicing in clinical settings. Since 2018, New York Education Law 804 has required that mental health instruction be included as part of health education in all K–12 schools;[28] since the 2019–20 school year, districts have been required to maintain a comprehensive school counseling program for all K–12 students.
The second delivery system comprises licensed clinical services delivered inside school buildings but governed by the state behavioral health and public health systems, not NYSED. School-based mental health clinics (SBMHCs) are licensed by OMH. In February 2024, Governor Hochul committed to funding an SBMHC in “every school that wants one”; as of that date, more than 1,000 such satellite clinics existed statewide.
A parallel system of school-based mental health services operates under federal special-education law. Students with a mental health condition that affects their ability to benefit from education can, through an Individualized Education Program (IEP), be eligible to receive mental health services under the Individuals with Disabilities Education Act (IDEA) such as counseling, psychological services, and social work as “related services.”[29] These services may represent the largest single category of school-based mental health spending in New York, but they are largely invisible in state reporting on aggregate school mental health and special-education spending.
Medicaid is an important financing mechanism across both systems. Students who are enrolled in Medicaid and receive special education services under IDEA Part B have Medicaid as the “payer of first resort” for the student’s covered IEP services.[30] Separately, in FY 2024, Governor Hochul implemented a 25% increase in Medicaid rates for school-based mental health services provided by SBMHCs.[31] As a result, a licensed provider receives more Medicaid revenue for the same service if it is delivered in a school rather than a community clinic. This premium has no clinical justification but provides an incentive to locate and deliver treatment in schools.
Despite this substantial public investment, aggregate mental health and education outcomes in New York have not improved. Broader empirical evidence that school-based mental health efforts improve general student mental health and academic outcomes is weak, at best. New York’s SBMHC model has increased students’ contact with mental health care, and high-quality research has found that school-based mental health services increase outpatient mental health service use.[32] However, the same research finds no evidence that these services improve average attendance or standardized test scores, nor do they improve mental health outcomes. More students are connected to treatment, but no evidence shows that the treatment is effective or that the right students are connected to it. The same pattern appears in New York Medicaid data: the total number of children in Medicaid with behavioral health diagnoses has grown steadily since 2016, as has the number receiving at least one prescription medication for a behavioral-health or mental-health condition.[33] Nominal Medicaid spending on youth behavioral health has nearly doubled over the same period.
While the state has invested in mental health staffing, existing research has not established a precise ratio below which hiring additional mental health staff produces better student outcomes. Staffing ratios promoted by NYSED are based on recommendations from professional associations, organizations with a direct incentive to advocate for lower ratios that would require hiring more of their members. The American School Counselor Association, for example, recommends a student-to-counselor ratio of 250:1.[34] While some quasi-experimental research suggests that adding counselors to reduce caseloads—to below around 500 students per counselor[35]—produces possible benefits on graduation, college enrollment, and school climate, no credible or causal evidence suggests that 250:1 is optimal or yields meaningful additional benefit. New York already has among the lowest student-to-counselor ratios of all states (305:1),[36] and the raw number of school counselors and school psychologists employed in the state’s public schools now approaches or exceeds the number of licensed clinical counselors and clinical psychologists practicing in community-based settings statewide. New York has no shortage of school-based mental health staff. What is absent is a mechanism to ensure that existing staff are delivering effective services.
The components of New York’s school-based mental health investment that directly affect all students have the weakest evidence base. Universal mental health literacy programs, Mental Health First Aid training, and social-emotional learning curricula have not been shown to improve mental health outcomes or academic outcomes in rigorous evaluations. A report from the state comptroller, for example, favorably cited the “Crew” program as a promising approach to school connectedness. A closer look at the evidence is less encouraging: while the Crew model produced a marginal improvement in attendance, it did not improve ELA, math, or social-emotional learning outcomes. The state’s guidance on mental health programming has also repeatedly promoted universal mental health screening, which can lead to negative outcomes such as overdiagnosis.[37]
The students most in need of effective mental health supports through the education system—those with a special-education designation of emotional disturbance or disability (ED)—do not benefit from expanding the current school-based mental health infrastructure delivering non-intensive services through the typical neighborhood public school. These students experience some of the worst outcomes of any in the state. ED students in New York public schools have a graduation rate below 47%, compared with an 81% statewide graduation rate. Black and Latino students with ED designations fare even worse, with graduation rates of approximately 38%. Per the NYC Independent Budget Office, ED-designated students were suspended at a rate of 15.4%, more than five times the rate of non-special-education students. New York State does not publish per-pupil spending for students with disabilities specifically, but it has been estimated at approximately $38,170 per pupil in a 2020 Empire Center analysis. In total, New York’s spending just on students with disabilities exceeds total K–12 spending in all but seven states.[38]
But the state has no accountability mechanisms to determine who is being served by this spending, how much is being spent, or whether students are unintentionally being harmed. A 2022 audit by State Comptroller Thomas P. DiNapoli found that the New York City Department of Education does not monitor whether schools have implemented required mental health education meeting standards under Education Law 804, nor does it assess whether the programs are effective. NYC DOE responded that doing so would violate student privacy and health laws. As a result, no standardized case-management system exists, and neither the city nor the state tracks whether students are receiving care. The city and state also do not evaluate program effectiveness. Importantly, there is no way to determine whether any services are unintentionally causing harm to students, though harms have been documented in several rigorous randomized control trials of common programs.
New York State does not track compliance with parental consent laws in schools, so it is unclear whether mental health services are being provided to students without parental knowledge or consent. Consider Teenspace, a free tele–mental health app for NYC teens advertised by NYC DOE, which operates through a $26 million, three-year contract between the city’s Department of Health and Mental Hygiene and Talkspace.[39] Data privacy advocates have raised concerns that the service asks teens to disclose sensitive personal information—including mental health history, address, and gender identity—before securing legally required parental consent and that Talkspace’s terms of service permit the use of personal data for marketing purposes, to which students are automatically opted in. In a public records request, the city Department of Health and Mental Hygiene could not identify how many students were receiving services without parental consent through Teenspace, because no record has been kept.
Lack of clarity around school-based mental health professionals’ roles and responsibilities often result in unmatched expectations between those professionals, administrators, parents, and students. School-based mental health professionals consistently report being placed in an untenable position, asked to take on clinical responsibilities beyond their training and role and facing a lack of engagement from parents. Parents and administrators may inappropriately look to them as the default mental health resource because the school-based infrastructure signals to families that the school is the appropriate locus of mental health care. When schools function as de facto mental health clinics, parents may not seek the community-based clinical care that their children actually need, and schools may strain to focus on their core educational mission. The distinct professional practices and legal regulations between schools and clinical settings leave all parties with fewer guardrails and mechanisms for resolution when uncertain or inappropriate circumstances manifest. More generally, the state expanded a system despite evidence that it does not work to improve mental health or educational attainment.
Evidence: Teacher Preparation and Educational Pluralism
New York maintains one of the country’s most demanding teacher certification requirements. Candidates must complete a state-approved preparation program, pass several state examinations, complete student teaching, undergo fingerprinting, and satisfy several state-mandated training requirements. Teachers are required to have a bachelor’s degree with a minimum GPA threshold and, in most cases, a graduate-level preparation program.
The content of New York’s teacher preparation programs, however, is not held to similarly rigorous standards. The National Council on Teacher Quality (NCTQ) rates New York’s teacher preparation policy as “weak” on early reading, placing it among 16 states with policies that do not adequately ensure competency in the five components of science-based reading instruction (phonemic awareness, phonics, fluency, vocabulary, and comprehension). Several of the state’s programs received “cannot be determined” designations in NCTQ’s national review because they did not provide course materials for evaluation. In other words, the state imposes high procedural bars on aspiring teachers but does little to ensure that they are being trained in evidence-based instructional practices.
Another constraint on New York’s teacher workforce are the state’s reciprocity rules, which allow for full reciprocity with only four states; Massachusetts, Ohio, Pennsylvania, and Vermont.[40] Teachers from other states must demonstrate that their preparation program is comparable to a New York program or document three years of satisfactory teaching experience within the previous seven years to qualify for certification. As a result, experienced teachers trained in most other states face additional time and barriers before they can teach in a NYS public school classroom.
At the same time, New York has a shortage of teachers in many of the fields with the greatest student need, including special education, bilingual education, math, and science. A 2021 study found that teachers entering fields with a shortage were retained at lower rates than teachers in non-shortage fields.[41] Workforce pressures are likely to intensify in coming years, with approximately 35% of New York’s current teachers eligible for retirement within the next five years.
Educational Pluralism: Private Schools, Charter Schools, and Homeschooling
Across the country, state-level universal school choice programs—typically in the form of education savings accounts—have grown rapidly. These programs provide public support for families to pay for private school tuition or supplementary educational services in the public, charter, and homeschooling sectors.
New York State has no such program. It has limited school choice to charter schools, whose growth is stymied by a legislative cap on the creation of new charter schools (Table 3).
This is somewhat ironic, as New York State, a port of entry for wave after wave of immigrants, has always had a good deal of educational pluralism. Pre-2000, that pluralism primarily came in the form of private and religious schools. In 1961, at the peak of the post–World War II baby boom, the Roman Catholic Archdiocese of New York alone enrolled more than 212,000 students in its 414 parochial and high schools.[42] Today, the state’s educational landscape has diversified.
TABLE 3
Total Enrollment by Sector, 2025–26
| Public | 2,255,993 | 80.3% |
| Charter | 190,602 | 6.8% |
| Non-public schools (NPS) | 309,256 | 11.0% |
| Homeschools | 53,905 | 1.9% |
| Total | 2,809,756 |
In the private school sector, Jewish schools—largely serving the Hasidic or haredi sectors—have replaced Catholic schools as the largest group (Table 4).
TABLE 4
Jewish and Catholic School Enrollment Trends in New York State
| 2015–16 | 2025–26 | Change | ||
| Jewish School Enrollment | 163,086 | 193,791 | 30,705 | 18.8% |
| Catholic School Enrollment | 168,338 | 112,200 | –56,138 | –33.3% |
Homeschooling, though still infrequent, has grown by 126% in the last 10 years (Table 5).
TABLE 5
Growth of Homeschooling in New York State
| 2016 | 2026 | Change | ||
| Number of Home-school Students | 23,875 | 53,905 | 30,030 | 126% |
Charter schools have been popular in the state’s urban school districts (Table 6) and among black and Hispanic families, whose children account for 87% of charter school enrollment.
TABLE 6
Portion of Students in Charter Schools by New York State School District, 2024–25
| District | Charter Student Count | District Student Count | Total Students | Charter Enrollment Share |
| Albany City School District | 3,231 | 8,051 | 11,282 | 28.64% |
| Buffalo City School District | 10,096 | 28,874 | 38,970 | 25.91% |
| Greece Central School District | 1,159 | 9,906 | 11,065 | 10.47% |
| New York City Public Schools | 142,910 | 827,733 | 970,643 | 14.72% |
| Rochester City School District | 7,335 | 22,076 | 29,411 | 24.94% |
| Syracuse City School District | 2,646 | 18,039 | 20,685 | 12.79% |
Source: https://data.publiccharters.org/school-district-enrollment-share
A majority of charter school students in the state are either black (46%) or Hispanic (41%), compared with 13% black and 30% Hispanic in the public schools statewide (Table 7).
TABLE 7
New York State School Sector Demographics
| Charter | Public | NPS | |
| American Indian/ Alaska Native | 1% | 1% | 0% |
| Asian/ Pacific Is-lander | 4% | 11% | 6% |
| Black | 46% | 13% | 7% |
| Hispanic | 41% | 30% | 9% |
| Multiracial | 2% | 4% | 4% |
| White | 5% | 41% | 74% |
Looked at another way, 21% of the state’s black students and 10% of its Hispanic students are enrolled in charter schools. In addition, 7% of black students and 5% of Hispanic students are enrolled in private and religious schools.
The charter schools in NY perform significantly better than their district counterparts. In an analysis by The74, charters accounted for 38.5% of exemplar schools that “beat the odds” by helping low-income students to read at grade level, despite representing less than 10% of schools statewide.[43] Another analysis shows that more than half the state’s 100 best public schools, as ranked by state math and ELA tests, are charters.[44] Despite this impressive academic performance, New York City is still subject to a cap on the number of new charter schools. Nevertheless, enrollment continues to grow, reaching more than 150,000 students in the 2025–26 school year, representing 15.2% of all NYC public school students.
A Promising but Uncertain Opportunity
Governor Hochul’s recent announcement that the state will opt in to the Federal Tax Credit Scholarship Program—which provides a federal tax credit for donations to scholarship granting organizations that fund K–12 scholarships—will allow more families to switch to private schools or pay for additional education expenses. The move, which is opposed by leaders in the state legislature and the Board of Regents, will greatly benefit New York, given that it is one of the top three states in federal tax revenue. Education Reform Now estimates that the program could generate in excess of $1 billion dollars every year for scholarship, depending on how many taxpayers choose to participate.[45] If New York does not opt in, this money would benefit students and families in other states. The U.S. Treasury Department has confirmed that 27 states have officially opted in to the program, and four states (including NY) have verbally committed to opt in.
The scholarships funded by the tax credit will be available only to families that earn up to 300% of their local area median gross income (AGMI), so the program will benefit the students most in need of educational options. Scholarship granting organizations will be required to spend 90% of the funds raised directly on scholarships. The program will help New York compete with other states that offer generous school choice programs. There are now 33 states (plus Washington, D.C., and Puerto Rico) that have some form of private school choice program on the books.[46] It is estimated that more than 50% of students across the U.S. are now eligible for school choice programs. The number of students participating in a school choice program (excluding charters) is now 1.2 million, double what it was only three years ago.[47]
Accountability: Graduation Standards and Governance
The state’s failure to measure outcomes and follow evidence is rooted in a deeper accountability problem. In NYS, responsibility for education is divided between state institutions that answer to no elected executive and roughly 730 local districts that implement state policy with wide discretion. No one is directly responsible when outcomes fall short.
Graduation Standards and Diploma Pathways
The accountability problem can be seen in the state’s ongoing experience with graduation reforms. When districts control implementation, it is hard to maintain consistency and accountability. In November 2024, NYSED released NY Inspires, the most significant change to NYS graduation requirements in more than a century. The plan calls for four major reforms: adoption of the Portrait of a Graduate framework; a shift from seat-time requirements toward demonstrations of proficiency; the removal of Regents examination passage as a graduation requirement; and the consolidation of the existing Local, Regents, and Advanced Regents diplomas into a single NYS diploma.[48] The Board of Regents formally adopted the Portrait of a Graduate framework in July 2025. Students entering ninth grade in fall 2027, the class of 2031, will be the first cohort not required to pass Regents examinations to graduate, with full implementation projected by the 2029–30 school year.
Under the new Portrait of a Graduate framework, students will demonstrate mastery in several ways, including coursework, capstone projects, internships, work-based learning experiences, community service, Career and Technical Education (CTE) pathways, and other locally determined measures.[49] Regents exams will continue to be administered for federal accountability purposes but will no longer serve as a statewide graduation requirement.
These reforms are intended to provide students with several pathways to demonstrate readiness for college, careers, and civic life. At the same time, they shift NYS away from a graduation system built around common statewide assessments and toward one that relies increasingly on locally evaluated evidence. As a result, maintaining consistency, comparability, and public confidence in the meaning of a NYS diploma will likely become a challenge.
The Current State of Educational Governance
Many challenges discussed throughout this report—including student outcomes, student identification, intervention, special education, teacher preparation, and graduation requirements—ultimately depend on decisions made by the New York State Board of Regents and the State Education Department. New York’s educational governance structure concentrates significant policymaking authority in these institutions while providing limited mechanisms for executive oversight or performance-based evaluation. In other words, the people making the decisions do not answer to voters.
The governance structure is rooted in Article XI of the New York State Constitution,[50] which contains only three brief provisions related to education:
- Section 1 requires the legislature to maintain and support a system of free public schools: “The legislature shall provide for the maintenance and support of a system of free common schools, wherein all the children of this state may be educated.”
- Section 2 establishes the Board of Regents and grants the legislature authority to determine its powers and structure: “The corporation created in the year one thousand seven hundred eighty-four, under the name of The Regents of the University of the State of New York, is hereby continued under the name of The University of the State of New York. It shall be governed and its corporate powers, which may be increased, modified or diminished by the legislature, shall be exercised by not less than nine regents.”
- Section 3 prohibits the use of state or local public funds in religious schools, except for the provision of transportation services: “Neither the state nor any subdivision thereof, shall use its property or credit or any public money, or authorize or permit either to be used, directly or indirectly, in aid or maintenance, other than for examination or inspection, of any school or institution of learning wholly or in part under the control or direction of any religious denomination, or in which any denominational tenet or doctrine is taught, but the legislature may provide for the transportation of children to and from any school or institution of learning.”
Thus, while the constitution requires the existence of a Board of Regents, its powers and the manner of its members’ appointment are subject to legislative review and revision.
The Board of Regents currently comprises 17 members: one for each of the state’s 13 judicial districts; and four at-large members. Each member serves a five-year term; each year, at least one member’s term expires on April 1.
Under the State Education Law, members of the Board of Regents are appointed by the legislature via concurrent resolution—but if the two houses cannot agree, they meet in joint session and elect a Regent by joint ballot.[51] The requirement for a joint session has always given greater strength to the assembly because it has more members than the senate. Historically, the assembly has been controlled by the Democratic Party. Since 2019, however, the Democrats have also controlled the state senate. Even if the Republicans win back the senate, they will have little power over the appointment of the Regents.
Noticeably absent from the appointment process is the governor, who has no direct role in selecting members of the Board of Regents or the commissioner of education, who is appointed by the Regents. As a result, many of the state’s most consequential education policies are developed and implemented through institutions that operate largely independent of executive oversight. According to a recent review by the Education Commission of the States, New York is one of only nine states in which the governor has no role in appointing the state’s top educational policymakers.[52]
This appointment process tends to produce a Board of Regents largely aligned with the state’s legislative majority. Publicly available information suggests that most current Regents have affiliations or backgrounds associated with the Democratic Party, reflecting the long-standing political composition of the legislature that selects them.
The Board of Regents, along with their appointee as state commissioner of education, exerts a fair amount of control over education in the state. They promulgate state-level learning and assessment standards and make recommendations to the legislature on the amount of state-level funding each year. Choice of curriculum, collective bargaining, and personnel policy are largely left to the state’s 730 local school districts, which include New York City; five other cities in the state; and 724 rural, small-town, and suburban districts. The state, in turn, makes annual public reports on the performance of these districts and their schools.
Since the collapse of the national “Common Core” reforms, as well as the associated “opt out movement,” the Board of Regents and the Department of Education have tightened their grip on the schools and have systematically frozen out key constituencies from policymaking. Many examples exist:
- Charter school students and their families: As documented above, charter schools serve a disproportionately black, Hispanic, and lower-income population and outperform their district counterparts; yet their growth remains capped by the legislature. The Regents have been silent on this issue. Further, since the resumption of statewide assessment in 2022, the state Education Department has made no mention of overall charter school performance in the state. The department’s website provides information on individual schools, but one must wade into a large database to extract charter results and compute their performance relative to district schools.
- Taxpayers: 53% of all school revenue in the state comes from local taxes and revenue sources. In every district except New York City, residents of each district vote directly on the school budget each spring, where changes in spending and tax rates are fully explained. In New York City, local education revenue is decided by the mayor and the city council as part of the city’s budget adoption process. Though local districts retain control over collective bargaining, hiring, training and evaluating staff, the selection of instructional materials, and other important matters, they are still required to follow state mandates and whatever costs they impose. As noted above, the state has continued to increase spending despite a drop in school enrollment.
- Private school families: More than 309,000 students, 11% of the statewide total, attend private or religious schools; yet the state has never embraced broad school choice. New York provides these families with some services, such as student transportation and reimbursement for state-mandated activities, but little else. The Board of Regents and legislative leaders have announced their opposition to the Federal Tax Credit Scholarship Program discussed earlier, even though those scholarships would cost the state nothing and could be used by lower-income parents across all sectors. The opposition signals clear hostility toward lower-income families that choose private and religious schools—and, more broadly, reflects how insulated education policymaking in New York has become from the families it affects.
The state Department of Education collects a tremendous amount of data on the state’s schools, their students, and teachers. It also maintains and makes publicly available summary data on school district funding and its use. Missing from these data are public calculations or reporting of the productivity of our schools and districts: What, exactly, do the state’s taxpayers get in return for their investment in the state’s schools?
A Manhattan Institute paper by William Henson describes a methodology for calculating the educational return on investment (EROI) for the state as a whole, individual districts, and groups of private schools or charter schools.[53] Unlike the traditional per-pupil spending metric, EROI can tell us how much each group of schools spends over time to produce one high school or college graduate. Because some critical data on college completion for specific groups of high school graduates are not available to the public, Henson had to make some assumptions, described in his report. NYSED, however, could obtain these data and offer a more definitive statement on the productivity of the state’s schools. By doing so, it would create an understanding of the effectiveness of educational spending.
The exclusion of the governor from educational appointment powers reduced the ability of centrist voters in both parties to influence policy. New York has always been a Democratic state and will likely remain so. As in much of the country, policy debates are now between the moderate and extreme factions of the Democratic Party. Even if enough moderate Democrats joined with moderate Republicans to elect a moderate of either party to the governor’s office, that official would still have little power to counter the power of the Board of Regents as now constituted.
The power in the legislature rests with the leadership of the assembly and the senate; individual members of the majority have little independent influence, and members of the minority have none. Major decisions, including the extension of mayoral control of New York City’s schools, are made by legislative leadership, often described as simply “three people in a room.”
It is no secret that Democratic leaders in New York pay close attention to the demands of teachers’ unions. According to a recent report, the National Education Association (NEA), the nation’s largest teachers’ union, has for decades directed nearly 90% of its $175 million annual budget for political spending to Democrats. The American Federation of Teachers, likewise, directs nearly all of its $45 million in political spending to Democrats.[54]
The spending, enrollment, and outcome data presented earlier in this report make clear that New York is on the wrong track educationally. As many other states have moved dramatically to universal school choice programs, it is time for New Yorkers to consider whether our governance model for education, forged in progressive-era ideals of professional command and control, is viable.
Recommendations
Table 8 presents several recommendations to help New York State improve student outcomes, ensure that financial investments match outcomes, and provide more transparency and oversight for families.
TABLE 8
Summary of Recommendations
| Priority | Recommendation |
| Measure what works | 1. Adopt and publish a statewide Educational Return on Investment (EROI) framework. 2. Establish universal early screening in reading and math. |
| Follow the evidence | 3. Align teacher preparation with evidence-based instruction and expand certification reciprocity. 4. Ensure consistency and comparability of graduation standards. 5. Lift charter school cap and permit the use of Federal Tax Credit Scholarship Program. |
| Fix accountability system | 6. Require public reporting on special education and school-based mental health services. 7. Change the structure of educational governance. |
- Establish a statewide EROI framework.
NYSED collects data on enrollment, expenditures, graduation rates, and assessment outcomes but does not publish integrated metrics that compare spending with student outcomes. NYSED should adopt and publish EROI metrics for all NYS public school districts, charter schools, and student subgroups, including low-income students and students with disabilities. Doing so would provide the public with a meaningful basis on which to evaluate whether educational investments are producing the outcomes they are intended to support.
- Establish universal early screening in reading and math as a statewide initiative.
The state should adopt a universal K–3 screening requirement in reading, using state-approved, evidence-based assessment instruments, administered several times per school year. The screening requirement should be paired with consistent statewide intervention frameworks so that students identified as not on track receive appropriate, evidence-based support. Without early screening, students who fall behind in foundational skills are typically not identified until they encounter formal state assessments in third grade, by which point the readiness gaps that will persist throughout middle and high school have already been established. Implementing universal screening would not, by itself, raise proficiency but is a prerequisite for the targeted intervention that can do so.
- Align teacher preparation with evidence-based instruction and address workforce shortages.
The state should require teacher preparation programs to demonstrate alignment with evidence-based instruction in reading and mathematics, including the five components of science-based reading instruction; expand certification reciprocity to additional states with comparable preparation standards, particularly to address shortage areas; and require NYSED to publish detailed ratings of teacher preparation programs, including transparency about programs that decline to provide course materials for external review. These measures would address the structural mismatch between New York’s high barriers to entering the profession and the content of the preparation protected by those barriers.
- Ensure consistency and comparability as graduation standards transition.
The NYSED NY Inspires plan represents the most significant change to graduation requirements in over a century.[55] The reform shifts the state’s graduation requirements away from common statewide assessments and toward locally evaluated evidence. As the transition proceeds, the state should require statewide consistency in the evidence required to demonstrate proficiency under the Portrait of a Graduate framework, including state-approved assessment frameworks for capstone projects and work-based learning, common rubrics with strong calibration across districts to ensure consistent application of evaluation criteria, and external moderation of locally evaluated work to verify comparability of standards. Without these safeguards, the meaning of a NYS diploma will increasingly depend on which district awarded it, and the public’s ability to evaluate the readiness of high school graduates will decrease.
- Lift the charter school cap and permit families to use the Federal Tax Credit Scholarship Program.
New York’s charter schools serve a disproportionately black, Hispanic, and lower-income population and consistently outperform their district counterparts; yet a legislative cap limits their growth even where demand exceeds available seats. The legislature should raise or remove the cap. The state should follow through on participation in the Federal Tax Credit Scholarship Program, which is limited to families earning up to 300% of area median income and would cost the state nothing; declining to participate would send up to $1 billion annually in scholarships to students in other states.
- Strengthen accountability for special education and school-based mental health services.
New York identifies a larger share of students as having disabilities than nearly any other state, and it has built one of the most extensive school-based mental health infrastructures in the country. But the state cannot consistently track whether these students receive the services they are entitled to or evaluate the effectiveness of those services. A 2024 audit by the state comptroller found that 83% of responding districts maintained preschool special-education wait lists, 93% reported provider shortages, and NYSED lacks current data on enrollment, services, and wait lists. Similar accountability gaps exist in school-based mental health, where the state does not evaluate program effectiveness or track whether students are receiving care.
The state should require districts to report regularly on preschool and school-age special-education enrollment, evaluations, services, and wait lists, with district-level data made publicly available. For school-based mental health services, the state should require regular reporting of utilization data and service outcomes within each delivery system, using consistent definitions and metrics to enable cross-system comparisons. These measures would create a basic infrastructure required to determine whether public investment in special education and school-based mental health is producing the outcomes it is intended to support.
- Change the structure of educational governance.
The Board of Regents is governed by a model that was built in an earlier era, before the expansion of state responsibilities and public investment documented in this report. The state has not seriously asked whether it remains fit for purpose. The state should reform educational governance to provide accountability for the decisions and investments now being made. A reform process should address the legislative process for appointing the Board of Regents, the absence of a gubernatorial role in selecting the commissioner of education, and the relationship between the Regents and the officials accountable to voters.
Even without structural reform, NYSED can publicize the evidence behind its decisions. The Regents announce major changes and take public comments but do not publish the underlying data and analysis. The state should publish annual aggregate reporting on charter school performance relative to district schools; the data and methodology behind the Regents’ funding and policy recommendations to the legislature; and the evidence base supporting major regulatory changes, such as the shift to locally evaluated graduation measures.
Conclusion
New York has spent more on public education than any other state; yet the outcomes come nowhere close to justifying the expenditure. In many areas—including special education, school-based mental health, teacher preparation, and graduation requirements—the state has expanded programs without measuring what works. The state has ignored clear evidence on issues such as the benefits of universal early screening and charter school performance. Both problems are rooted in a governance system that makes no one accountable. The state should implement the reforms in this report, measure what works, follow the evidence, and fix the accountability system before adding new programs to a system that cannot account for the ones it already has. Until it does, what the state spends will not translate into what students achieve.
About Authors
Jennifer Weber is a fellow for K-12 Education Policy at the Manhattan Institute. Her work builds on educational research and behavioral science to inform systems change and connect research with practice and policy. She consulted for public and charter schools nationwide. She has over a decade of experience teaching graduate-level courses in the science of behavior, research design, and evidence-based instruction. She holds a Ph.D. in applied behavior analysis from Columbia University.
Ray Domanico is a senior fellow at the Manhattan Institute. His career has spanned the public and non-profit sectors, in research and advocacy roles. Most recently, Domanico was director of education research at New York City’s Independent Budget Office, where he led a team tasked with studying and reporting on the policies and progress of America’s largest public school system. Previously, he served as senior education advisor to IAF Metro NY where he worked with local leaders and educators to design and support a small group of new district high schools and charter elementary schools. Domanico began his career in research positions in the New York City school system, and he has taught graduate-level courses in educational research and policy analysis at Brooklyn College and at Baruch College.
Domanico holds an MPP (master of public policy) from the University of California, Berkeley.
Carolyn D. Gorman is a fellow at the Manhattan Institute where her research examines how policy changes in the U.S. impact individuals with mental illness. Previously, Gorman was a data science and policy associate at the JPMorgan Chase Institute, an associate research scientist at the Coleridge Initiative, and the senior project manager for mental illness policy at Manhattan Institute. She served as vice chair of the board of the former Mental Illness Policy Org., a nonprofit founded by the late DJ Jaffe, and as staff on the U.S. Senate Committee on Health, Education, Labor and Pensions.
Gorman’s writing has appeared in the Wall Street Journal, New York Daily News, New York Post, City Journal, National Review, The Hill, and RealClearHealth, as well as the peer-reviewed Psychiatric Services and The Routledge Handbook of the Economics of Ageing. Gorman holds a B.A. from Binghamton University and an M.S. in public policy from the Robert F. Wagner Graduate School of Public Service at New York University.
Endnotes
Are you interested in supporting the Manhattan Institute’s public-interest research and journalism? As a 501(c)(3) nonprofit, donations in support of MI and its scholars’ work are fully tax-deductible as provided by law (EIN #13-2912529).