The Limits of Taxing the Rich

Photo: niphon/iStock
Executive Summary
Budget deficits have risen to nearly 6% of GDP and are projected to rise to 10% of GDP over three decades. If Congress continues to enact additional tax cuts and spending expansions, these deficits will grow even larger. To close these baseline deficits and finance additional expansions, most progressives reject most spending cuts as well as middle-class tax increases. Instead, just “tax the rich” has become an easy and popular answer. However, while there is surely room to raise some revenue from corporations and wealthy families, the plausible revenue estimates from these proposals fall far short of closing these budget gaps.
This report models an aggressive tax-the-rich agenda that pushes tax rates for corporations and wealthy families toward revenue-maximizing levels. It shows that such policies could raise, at most, 2% of GDP—and likely far less, when accounting for the macroeconomic losses that would result from layering so many new taxes on top of one another. Consequently, a sustainable economic and tax agenda would limit upper-income-tax increases to 1% of GDP.
In response to likely progressive counterarguments, this report also shows that: 1) Senator Bernie Sanders’s tax agenda has not identified additional plausible tax-the-rich policies; 2) America’s upper-income-tax rates align with international norms, and Europe’s higher tax revenues overwhelmingly result from broad-based consumption and payroll taxes; and 3) the 1950s and 1960s income tax rates exceeding 90% raised little additional tax revenue.
Given the mathematical limits of taxing the rich, policymakers should broaden their deficit-reduction strategies to include spending savings and even middle-class taxes.
Introduction
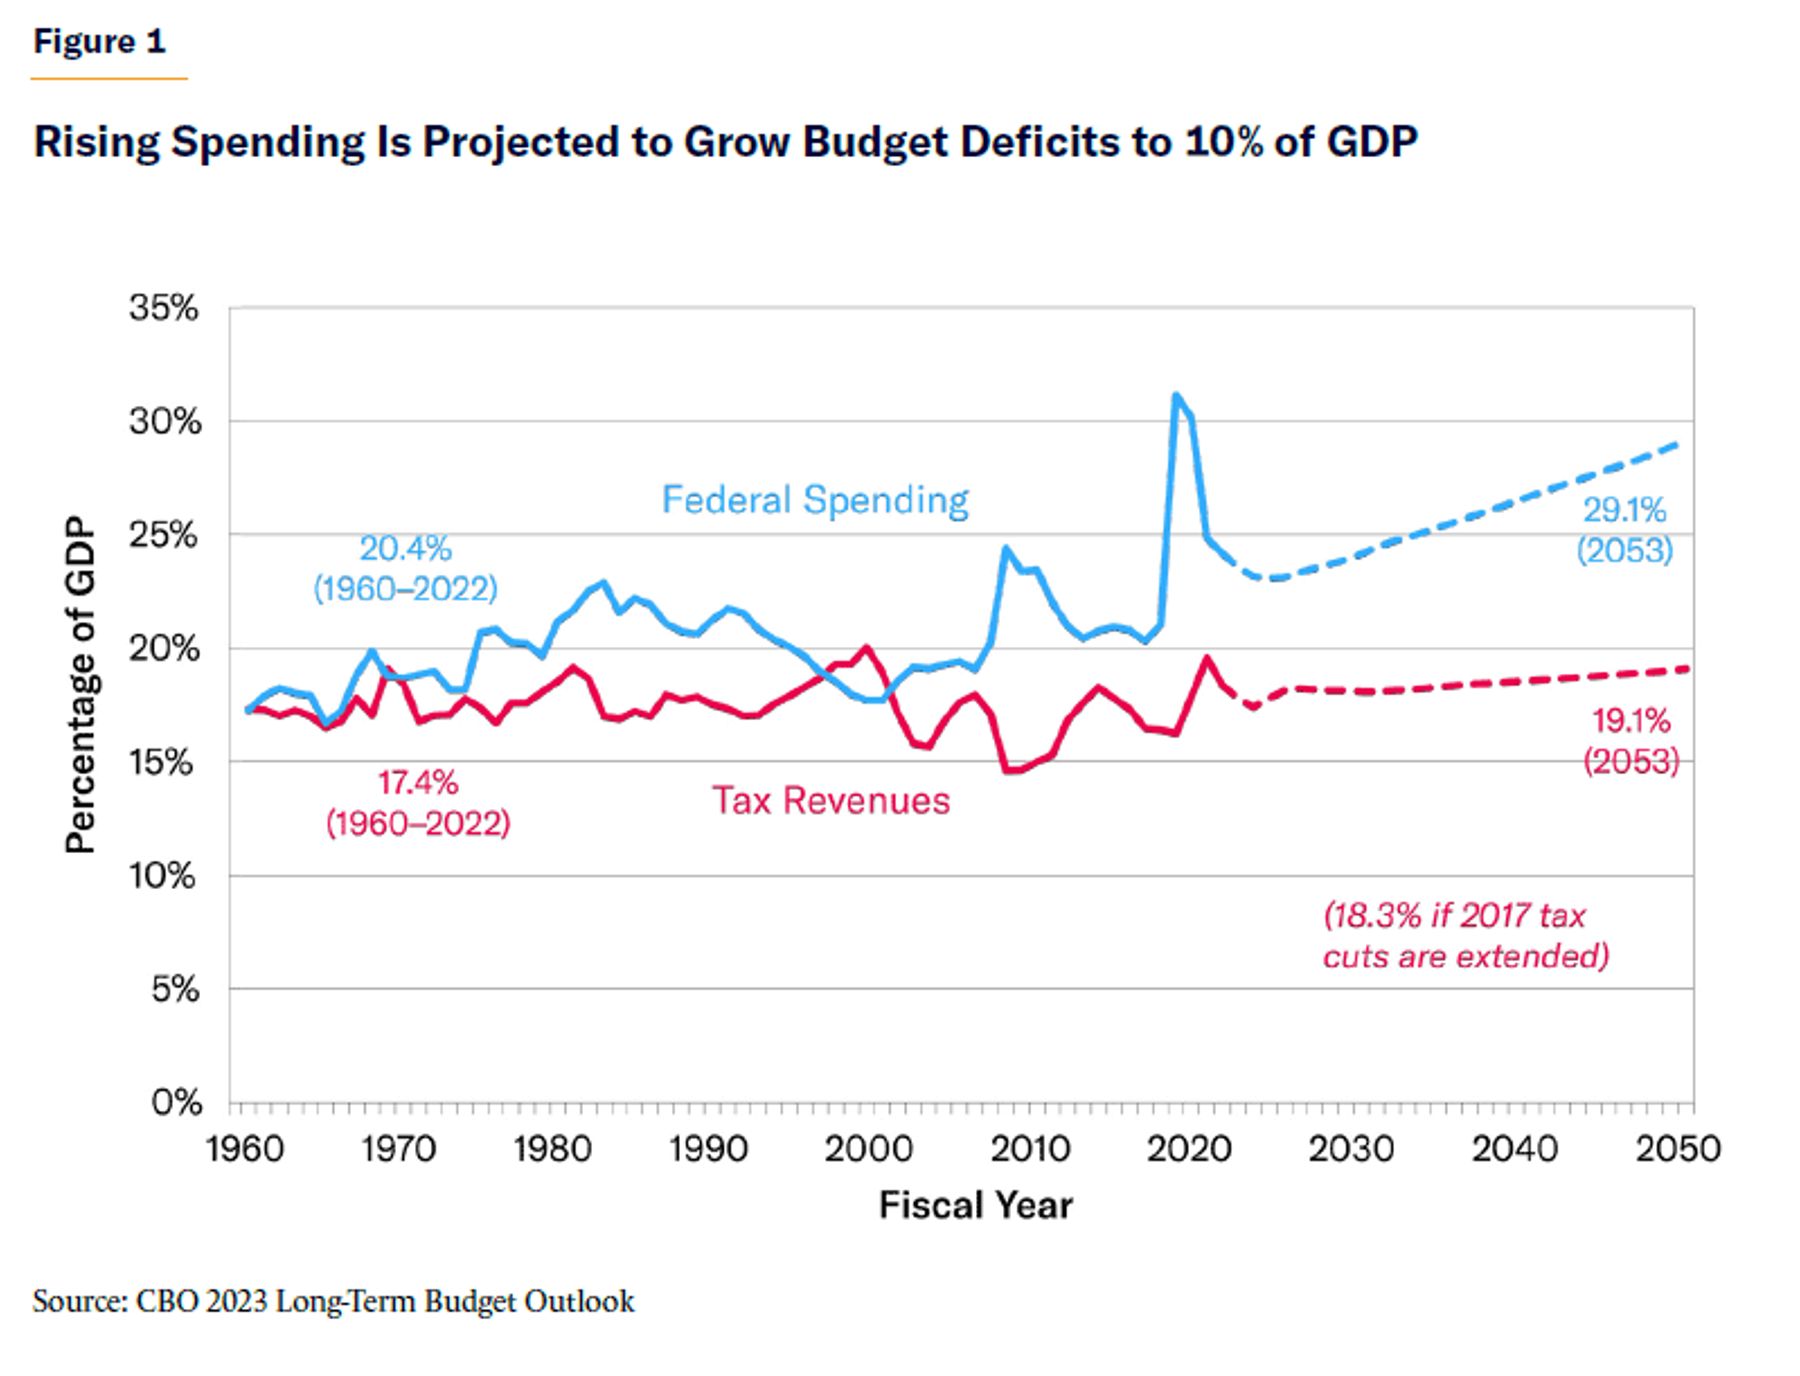
The persistent growth of budget deficits now exceeding $1.5 trillion annually, as well as the recent deluge of trillion-dollar spending proposals, has created an enormous funding challenge for the federal government. Specifically, annual budget deficits are projected by the Congressional Budget Office (CBO) to approach $3 trillion (or 7.3% of GDP) within a decade.[1] Over the long run, CBO projects that Social Security and Medicare cash shortfalls of $116 trillion over three decades will push budget deficits past 10% of GDP even in the rosy scenario of expiring tax cuts, no spending expansions, and low interest rates on the federal debt (see Figure 1).[2] Most economists believe that the likely combination of sustained deficits of 10% of GDP and a federal debt greater than 200% of GDP is unsustainable and risks a debt crisis.
Yet Washington seems more likely to expand these deficits than to curtail them. In his first two years in the Oval Office, President Biden signed legislation and executive orders that altogether expanded 10-year deficits by $5 trillion;[3] and his latest budget proposed trillions in new spending over the decade. The expected renewal of the 2017 tax cuts for most taxpayers would push annual deficits well past $3 trillion within a decade. Progressives such as Senators Bernie Sanders (I-VT) and Elizabeth Warren (D-MA) have proposed tens of trillions of dollars in new spending expansions covering health care, Social Security, climate, education, antipoverty aid, infrastructure, family leave, federal job guarantees, and child tax credits.
When pressed on how to finance budget deficits likely heading past 8% of GDP within a decade, as well as trillions of dollars in proposed spending expansions, progressive leaders and activists usually respond, “Easy! Just tax the rich!” Indeed, President Biden and many progressive lawmakers have committed to never raising taxes on the 98% of families earning below $400,000, and opposing all spending cuts involving Social Security, Medicare, Medicaid, the safety net, veterans, and most social programs. That leaves only cuts to defense spending (which has already declined to 3.5% of GDP and is projected to fall further over time) and taxing upper-income families and corporations to produce virtually all necessary savings.
President Biden and progressive leaders regularly claim that such a budget path is sustainable—that America can close deficits rising to 10% of GDP and also pay for new European-style social welfare expansions on the backs of corporations and the richest 2% of families. This makes for popular politics—everyone wants a free lunch, and taxing the rich has always been popular with voters—but even moderately informed voters understand that such a promise is mathematically—and economically—absurd. Yet the persistence of these claims raises the important question of just how much tax revenue can be raised by taxing “the rich.” Specifying the limits of taxing the rich can help us move past the false “easy answers” and begin to explore other, less popular, options to stabilize budget deficits, such as restraining the Social Security and health-care spending that are driving deficits upward, and raising middle-class taxes. In modeling various tax proposals, this report will show that:
- America’s federal tax code is already the most progressive in the Organisation for Economic Co-operation and Development (OECD) and has become sharply more progressive over the past 40 years.
- Much of this tax progressivity is the result of drastic cuts to low- and middle-income taxes while leaving upper-income-tax rates closer to international norms.
- An aggressive tax-the-rich agenda that targets high earners and corporations could raise, at most, 1.5% or 2.0% of GDP in revenues—and likely significantly less than that.
- While modest upper-income- and corporate-tax increases may not significantly harm the economy, tax rates approaching revenue-maximizing levels would substantially reduce economic growth, incomes, and wages.
- Progressive leaders like Bernie Sanders have not produced tax-the-rich proposals with tax revenues exceeding the estimates in this report.
- Europe’s significantly higher tax revenues are driven overwhelmingly by broad-based consumption and payroll taxes, rather than by notably higher tax rates on the wealthy.
- The income-tax rates exceeding 90% in the 1950s and early 1960s produced minuscule levels of additional tax revenue.
For much of the past 50 years, budget deficits were small enough that raising taxes by 1% of GDP on corporations and high-income families could have solved much of Washington’s fiscal challenges. However, baseline budget deficit projections—as well as the cost of progressive spending proposals—have grown so steeply that the usual tax-the-rich options can no longer come close to filling this gap. Either middle-class taxes must also rise sharply, or Washington’s spending appetite must be pared back.
Specifically, stabilizing the federal debt at 100% of GDP over the long term—which would far exceed the post-1960 average of 45% of GDP—would require non-interest savings beginning at 2% of GDP and ramping up to 5% of GDP over the next three decades. (The resulting interest savings from a smaller debt would provide the rest of the savings.) These figures assume the renewal of the 2017 tax cuts (as there is strong bipartisan support for extending the tax cuts for the bottom-earning 98% of earners)[4] but do not assume any additional spending expansions, tax cuts, or economic crises—all of which would also have to be fully offset to meet this debt target. In short, the non-interest savings required to stabilize the debt will almost surely rise past 5% of GDP when accounting for additional spending and tax-cut legislation. Taxing the rich cannot close more than a small fraction of this gap.
In order to avoid the partisan misrepresentations that typify tax policy debates, it is important to clarify, at the outset, that this report is not a conservative antitax manifesto. It does not argue that upper-income taxes should not be raised at all. Nor does it claim that all tax cuts pay for themselves. Indeed, soaring deficits will require some tax increases to accompany the necessary spending reforms.
Instead, this report employs consensus economic modeling and research to build a more realistic framework for taxing the rich—and to rein in the unrealistic perception that taxing the rich can sufficiently eliminate budget deficits and finance the progressive agenda. The limits of upper-income taxes should induce lawmakers, analysts, and voters to broaden their savings proposals to include substantial spending reforms and even to consider middle-class tax increases.
Background: Washington’s Progressive Tax Code
As background, the U.S. is a relatively low-tax nation with a highly progressive federal tax code. Total federal, state, and local tax revenues in 2021 totaled 26.6% of GDP, making it 32nd of the 38 OECD countries, which averaged revenues of 34.1% of GDP.[5] A nation born from a tax rebellion has long maintained a more libertarian resistance to exorbitant broad-based taxes, even as Europe built expensive social democracies in the decades following World War II.
At the same time, the taxes that America does collect—particularly at the federal level—are extraordinarily progressive. America’s corporate, capital-gains, and estate-tax rates exceed those of much of Europe and OECD. Even America’s top income-tax brackets are within the norm of other major economies. But there are two unique features of U.S. tax collection.
First, America’s comparatively lower tax revenues overwhelmingly result from being the only OECD nation without a value-added tax (VAT). The average 7.2% of GDP raised by VATs accounts for 96% of the total tax-revenue gap between America and the OECD average. Excluding VATs, OECD nations collect 26.9% of GDP in taxes, compared with America’s 26.6%.[6]
Second, America taxes lower- and middle-income families at a substantially lower rate than other major economies. Decades of refundable child tax credits, earned income-tax credits, increased standard deductions, and lower marginal tax rates have essentially moved half of all families off the federal income-tax rolls. America’s non-wealthy families also benefit from lower payroll-tax rates than other nations and, most important, the lack of a VAT.
Consequently, an OECD study in 2008 concluded that—even when controlling for income inequality—the U.S. had the most progressive income and payroll-tax code in OECD.[7] Specifically, the highest-earning decile of American families pay a share of the nation’s income and payroll taxes that is 35% greater than its share of the total income earned—compared with an average of 11% across OECD. And these income- and payroll-tax figures even understate America’s relative progressivity by excluding the VATs that further drag down other nations’ overall progressivity levels.
Washington’s income taxes are extraordinarily top-heavy. Treasury data show that, in 2023, the bottom 40% of earners collectively pay no income tax and will instead receive a collective tax rebate of $123 billion. The middle-earning quintile pays an effective income-tax rate of just 2.2%, while the second-highest quintile pays an effective rate of 5.7%. Even when including all payroll and other federal taxes, the middle-earning quintile still pays only 11.9% of its income in federal taxes, and the second-highest quintile pays 16.2%. Overall, the bottom-earning 60% of families altogether financed just 23 days of federal spending in 2023.[8]
Meanwhile, the top-earning quintile—while earning 58% of all income—pays 69% of all federal taxes and 90% of all income taxes. And the top 1% of earners—while earning 18% of all income—pay 25% of all federal taxes and 40% of all income taxes. By contrast, the bottom-earning 60% earns 23% of all income, yet pays just 13% of the total federal taxes, including a combined negative income tax.[9]
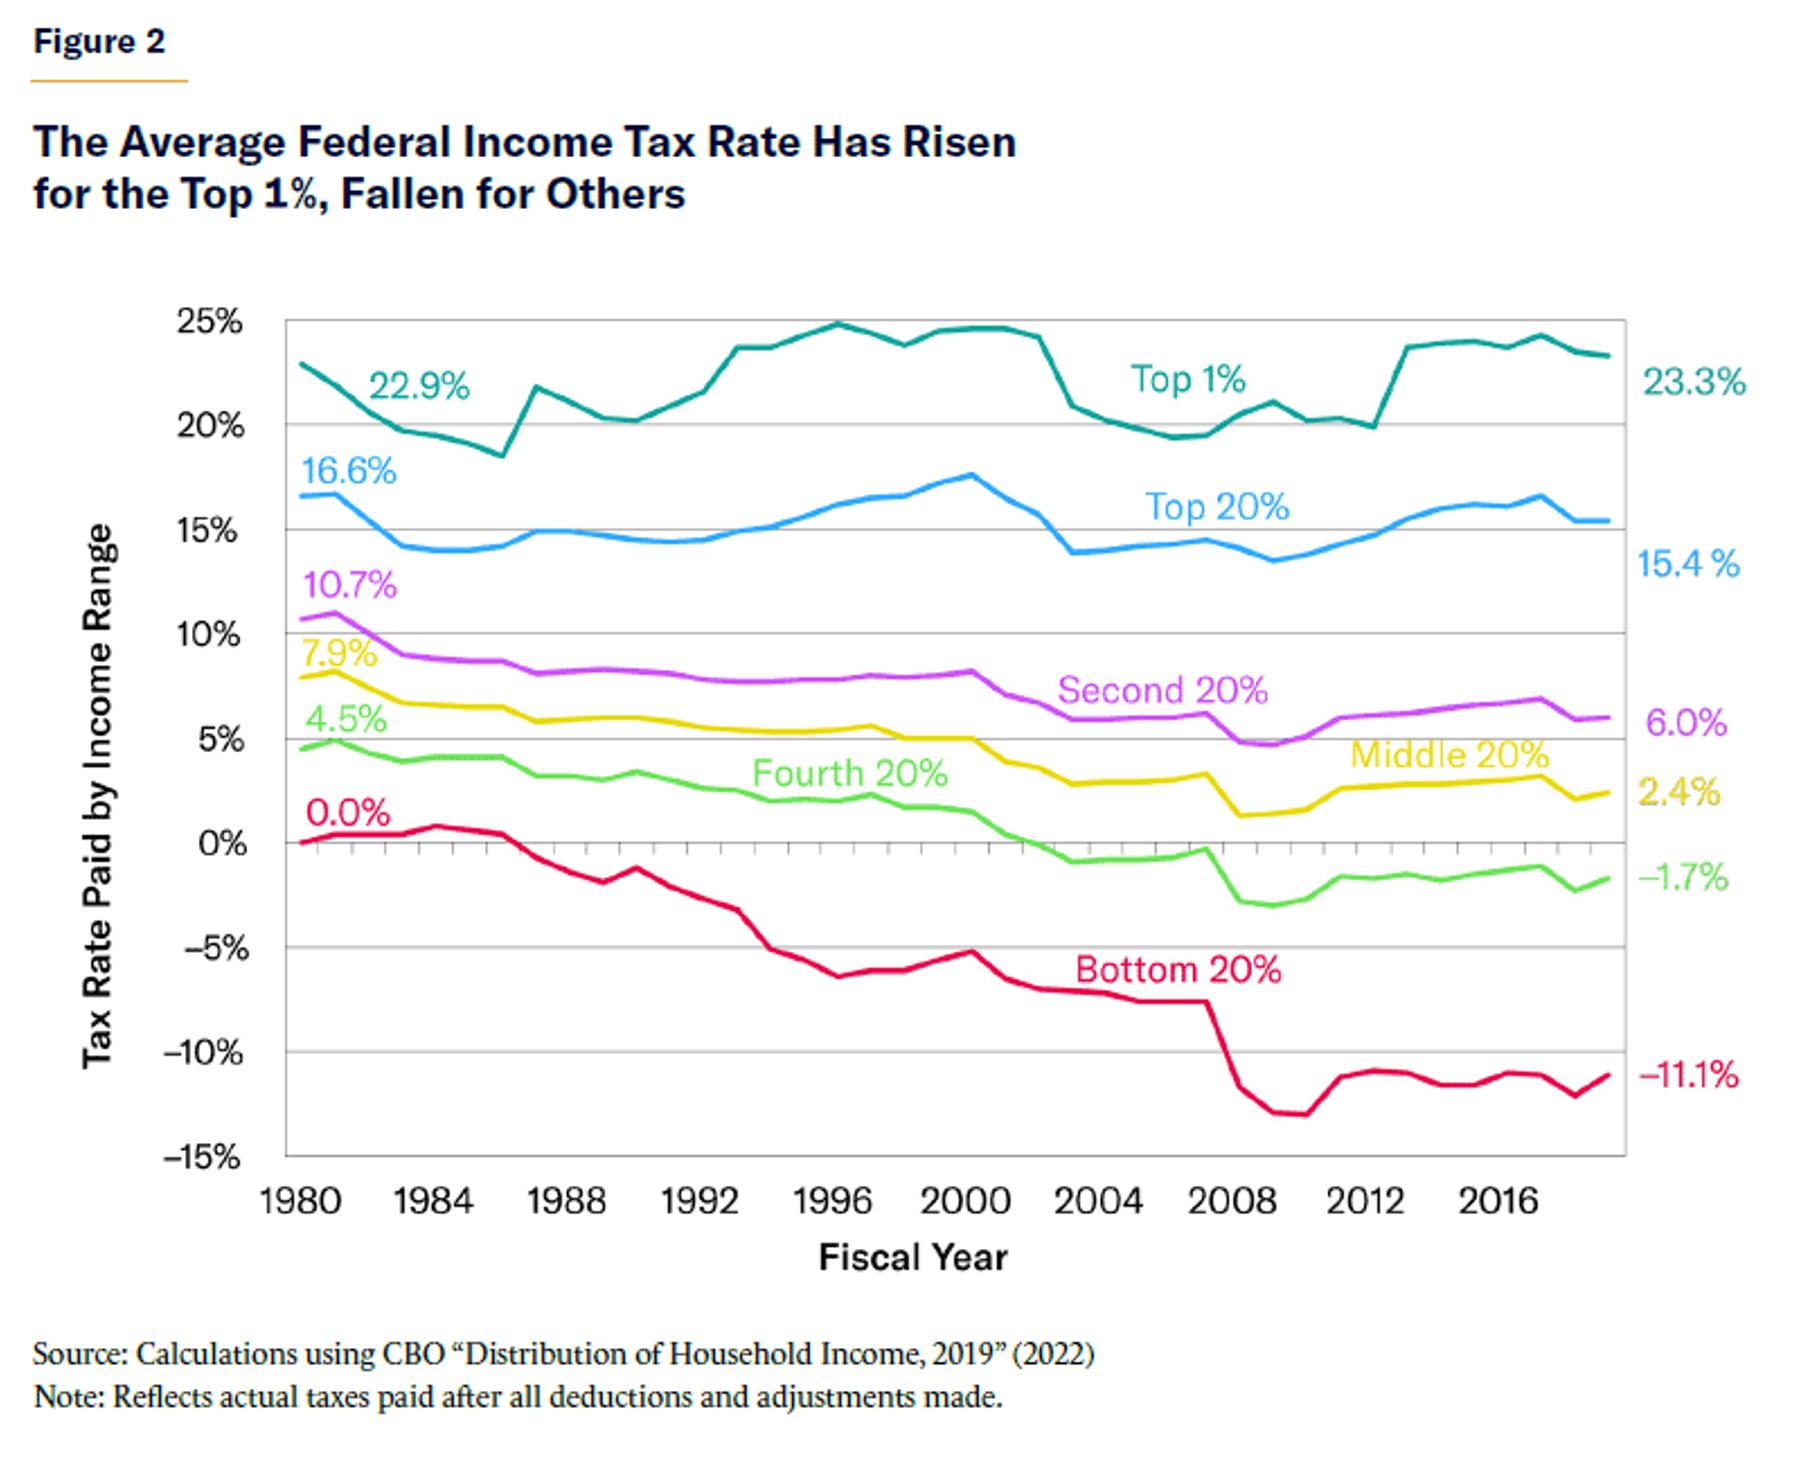
In contrast to conventional wisdom, the federal tax code has grown significantly more progressive over time. Figure 2 shows that, since the election of Ronald Reagan, effective income-tax rates have fallen dramatically for middle- and low-income earners while slightly rising for the top-earning 1%. Between 1980 and 2019 (the latest year available), the effective income-tax rate for the middle-earning quintile collapsed by more than two-thirds, from 7.9% to 2.4%. The bottom-earning two quintiles saw their effective income-tax rates fall by 8 percentage points into negative tax rates. Meanwhile, the top-earning quintile’s income-tax rate fell by much less, from 16.6% to 15.4%. And—most surprising—the effective income-tax rate for the top-earning 1% slightly rose from 22.9% to 23.3%.[10] Even as the top income-tax rate dipped, soaring incomes for the top 1% left more of their earnings in the top tax bracket, pushing up their effective tax rate.
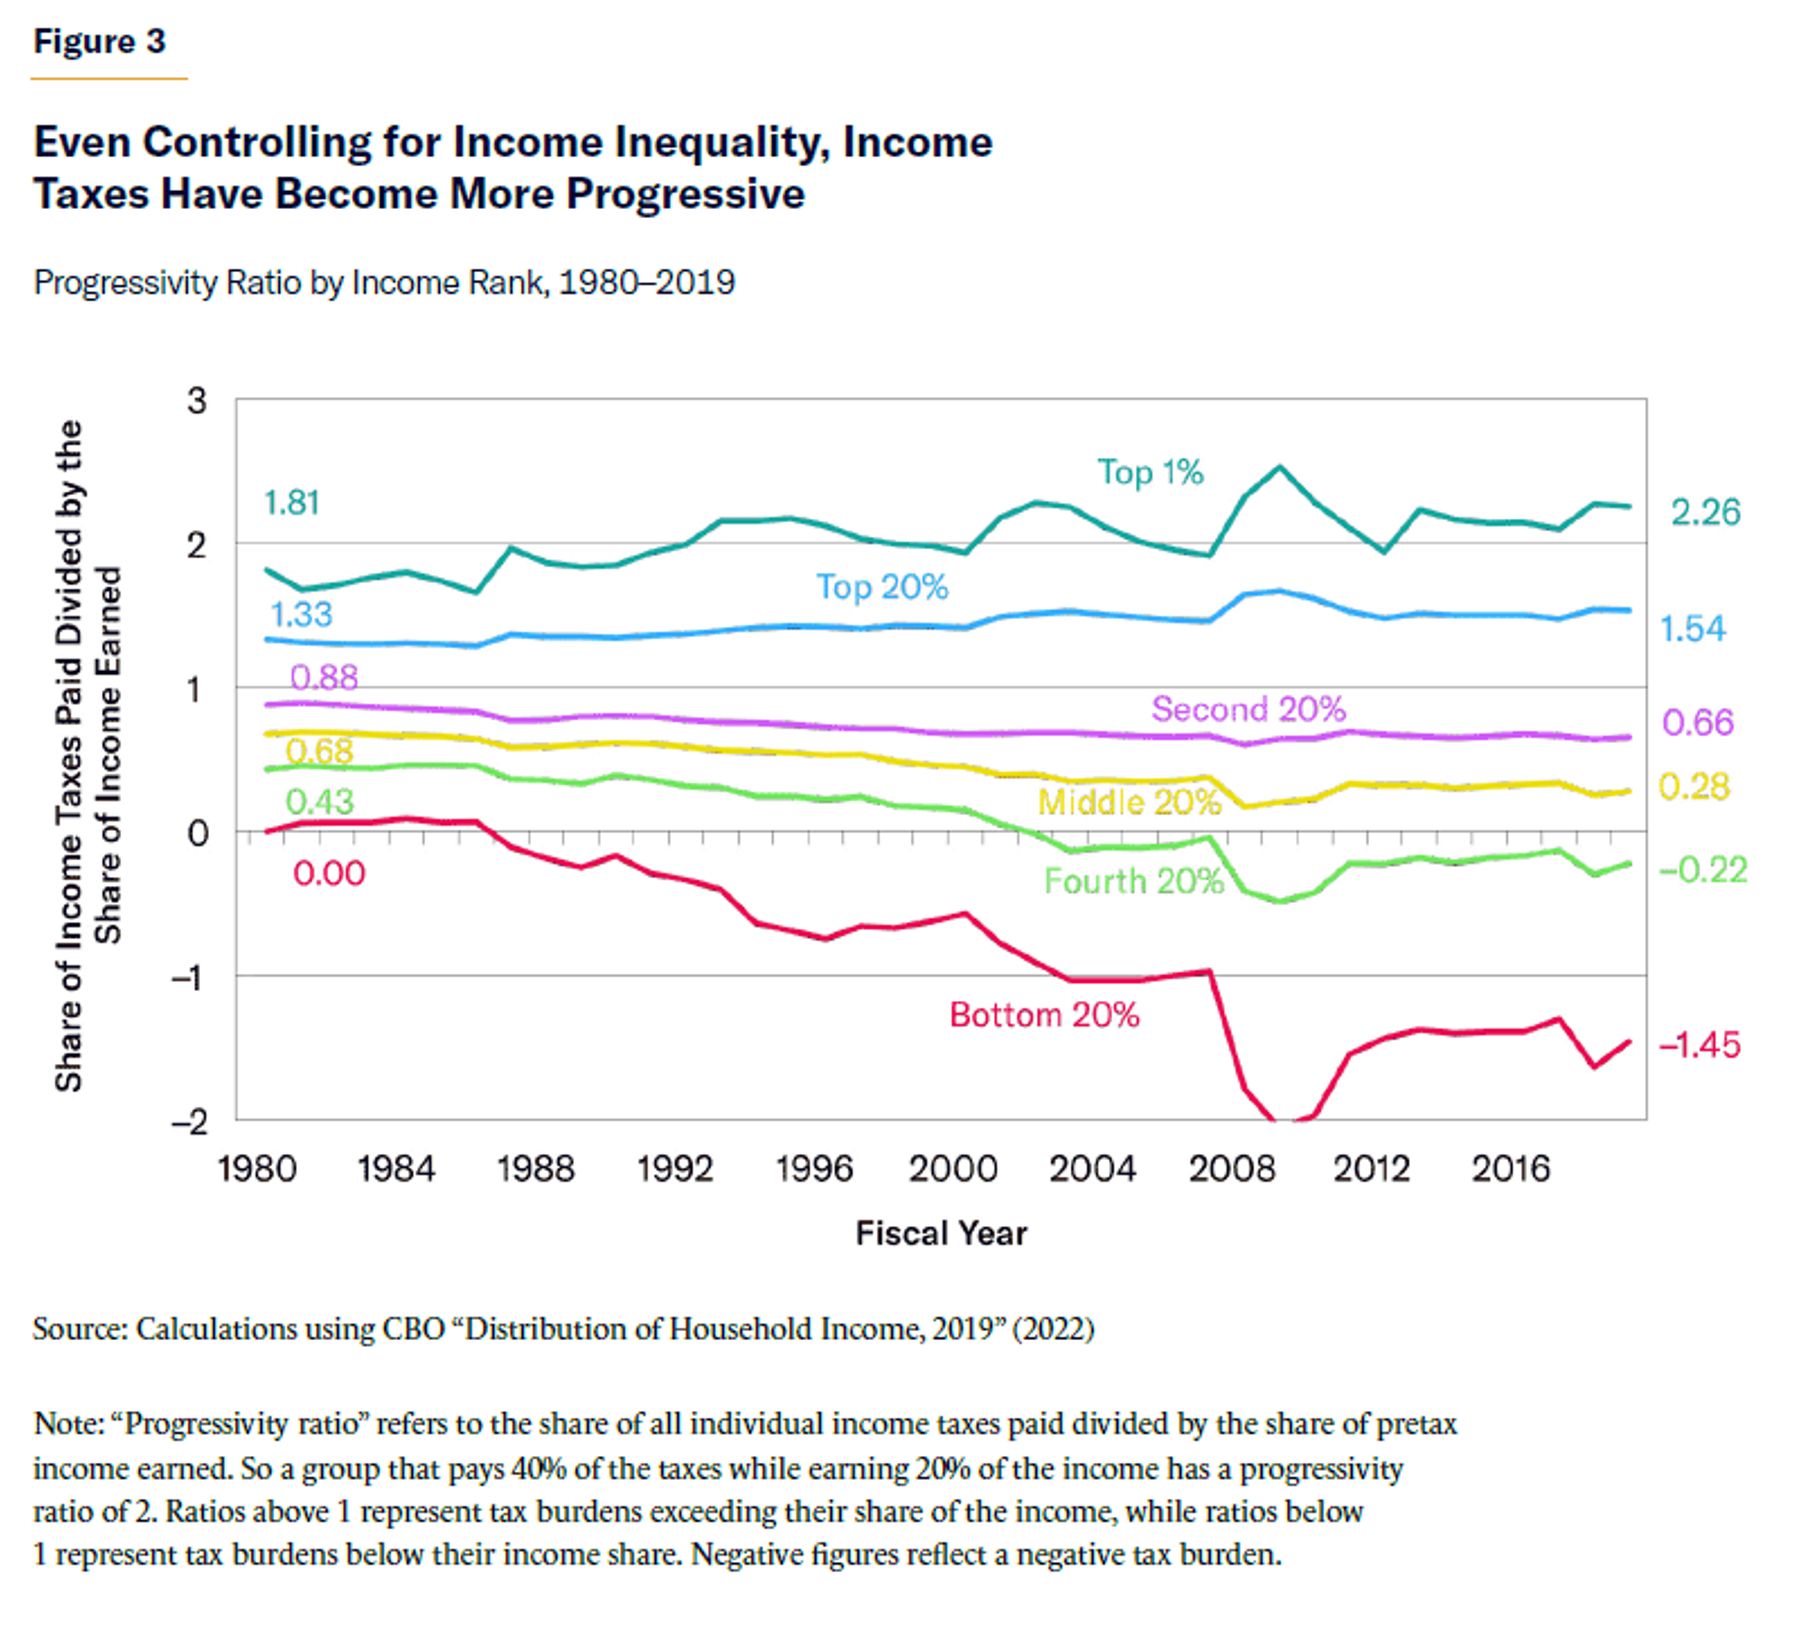
At the same time, the income tax has become more progressive even adjusting for changes in income inequality. Adopting the OECD methodology above, we can divide each income group’s share of the taxes paid by its share of the income earned—essentially adjusting tax shares for changes in income equality over time. A “progressivity ratio” greater than one means that an income group is paying a higher share of the income taxes than its share of the income earned. A ratio of exactly one means that a group’s share of income taxes paid matches its share of the income earned (a perfectly proportional system), while a ratio below one means that their tax share is less than their income share. Negative ratios reflect negative tax rates.[11]
For the top-earning 1%, Figure 3 shows that the progressivity ratio has increased since 1980 from 1.81 to 2.26 (meaning that its share of the federal income taxes paid has risen to 226% of its share of the income earned). The progressivity ratio of the highest-earning 20% of taxpayers has risen from 1.33 to 1.54. The ratio has fallen for every other income quintile, including the second highest income quintile (from 0.88 to 0.66), the middle (from 0.68 to 0.28), fourth (0.43 to –0.22), and bottom (0.00 to –1.45).
Other measures of tax progressivity consider the amount of redistribution from the rich to the poor, such as by examining changes in after-tax income. By those measures, Washington’s tax code is less redistributive than other nations’ tax systems because it has a smaller footprint. America does not raise enough taxes to redistribute as much money as some other nations do. However, for the amount of tax revenue that Washington does collect, it is overwhelmingly dependent on the top-earning 20% of taxpayers, and it shields lower-earning families from nearly all taxes except payroll taxes. This means that there is likely more fiscal space to raise taxes on non-wealthy earners than the wealthy, even if upper-income taxes may be a popular place to start.[12]
How Much Tax Revenue Can Be Raised from the Wealthy?
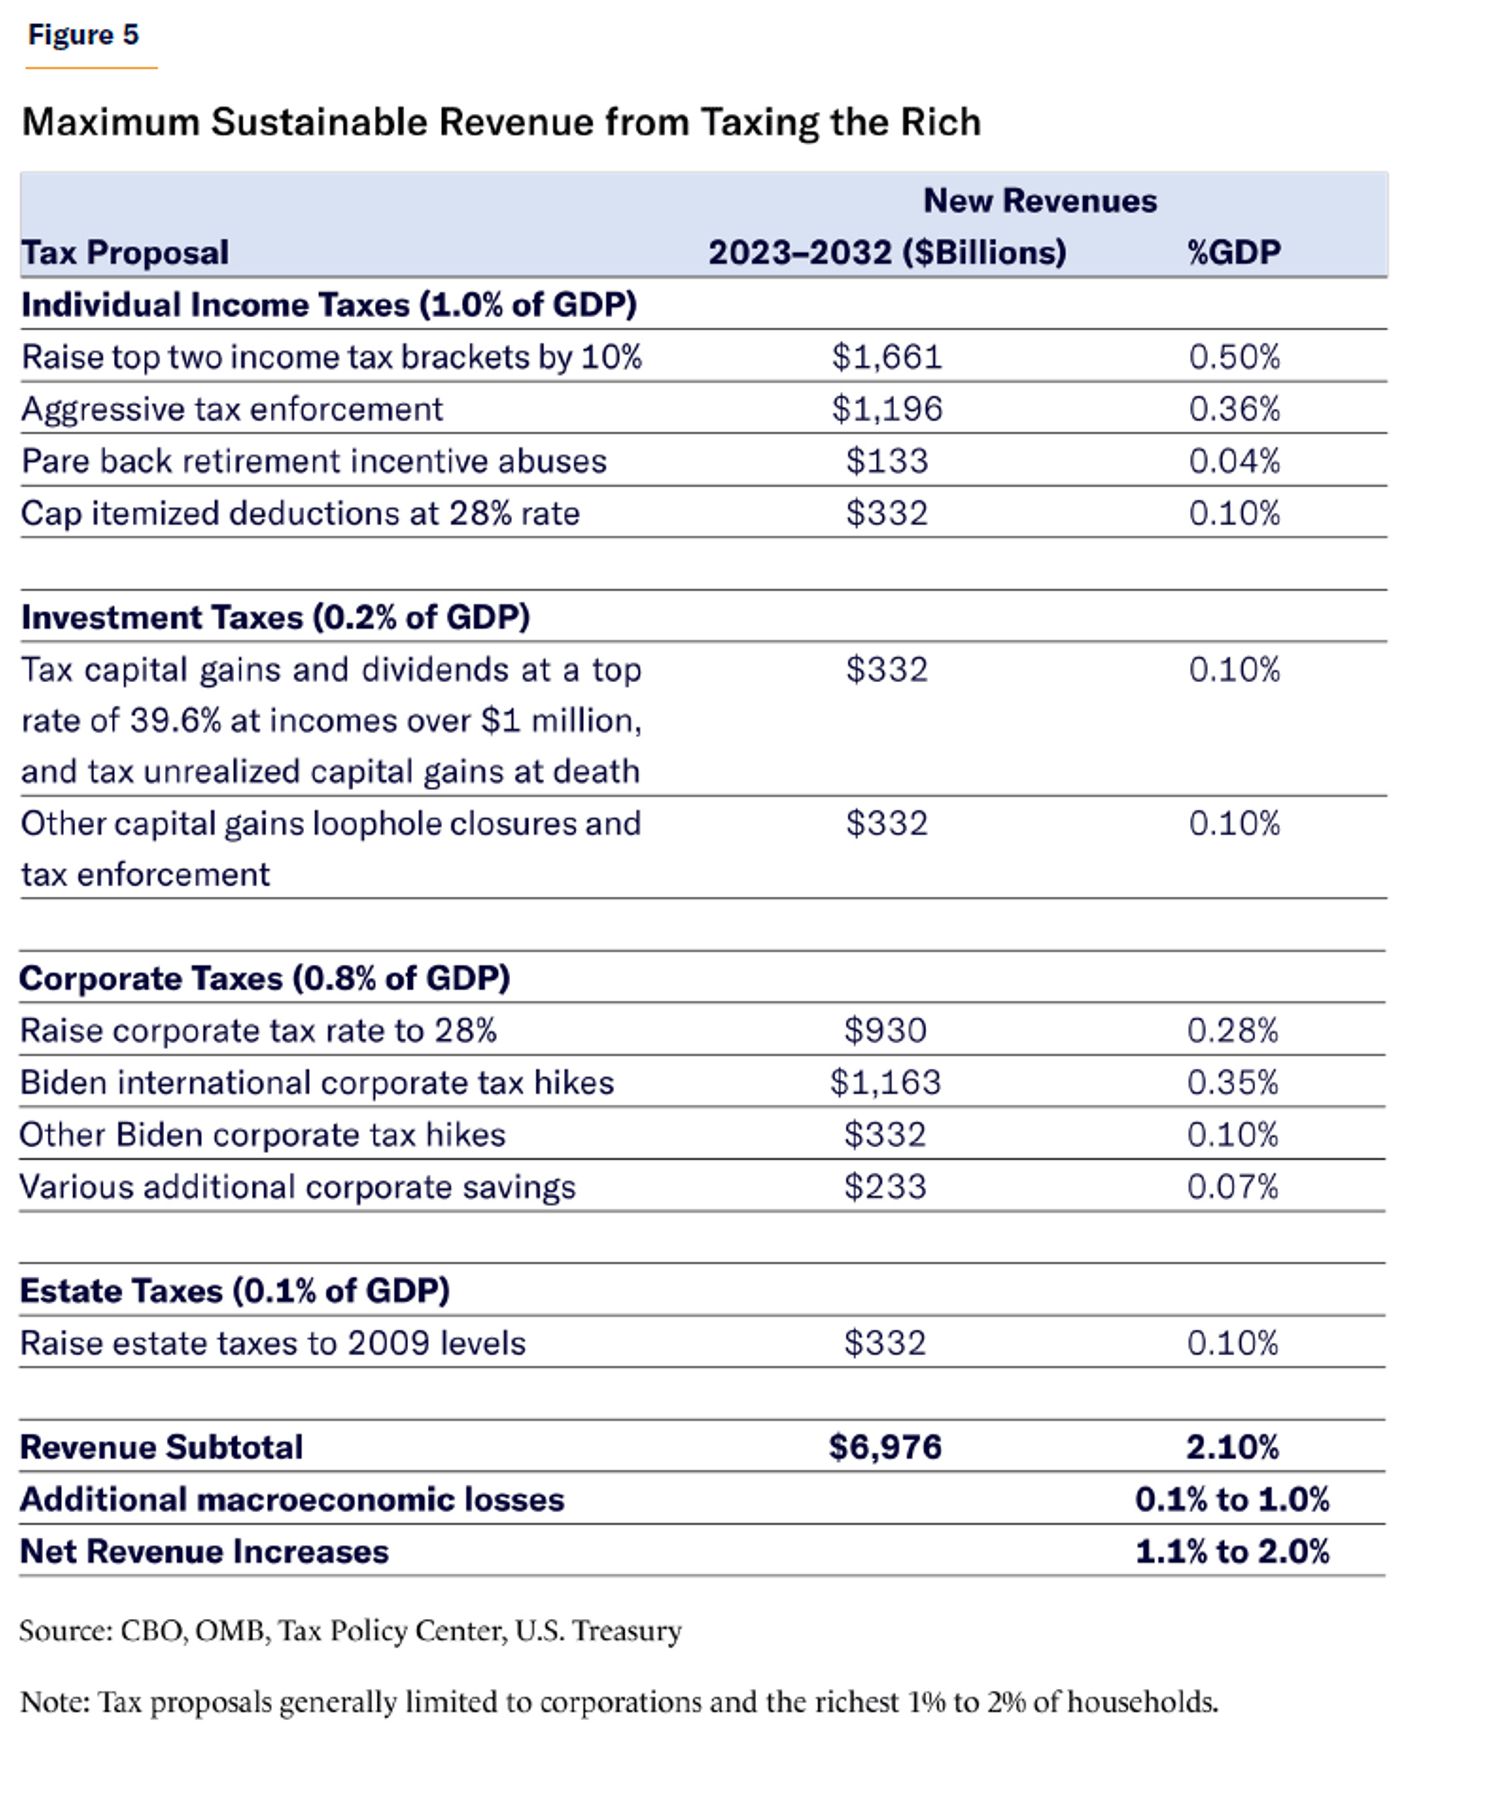
The following section calculates how much tax revenue can be raised from the wealthy through income, payroll, investment, corporate, estate, and wealth taxes. In most instances, each tax is first modeled to show the total amount of untaxed income above the wealthy thresholds—which approximates the theoretical amount that could be raised with 100% tax rates. The next step incorporates consensus economic research on the revenue-maximizing tax rates when incorporating economic and behavioral responses. From there, the amount of revenue from those tax rates is estimated, as well as any additional revenue that can be raised from plausible reforms to close the tax gap (the amount of unpaid taxes) and pare back tax preferences. For individuals, “wealthy” is typically defined as families with earnings in the top 1% ($686,100 for a family of two in 2023), although, in some cases, the income threshold falls to $400,000. Ultimately, this section will show that taxing the rich at revenue-maximizing rates would raise, at most, 2% of GDP—but that, after accounting for macroeconomic responses, the real figure is likely 1%–2% of GDP. (see Figures 4 and 5).
I. Wage Income and Payroll Taxes (1.0% of GDP)
The potential tax revenue to be raised from wage taxes on top-earning households is limited by both the small number of families included and their significant reliance on investment income rather than wages. Roughly two-thirds of all income is earned outside the top 5% of earners.[13] After removing long-term capital gains, the top two income-tax brackets (which begin at $462,500 for joint tax returns) produce just 14% of taxable income.[14] This is partly because less than one-third of the top 1% of taxpayers’ market income is from wages and salaries. One-fifth is business income (mostly taxed as income, albeit at a lower rate), and 37% is investment income.[15] Even within the top 1%, rising incomes correlate with rising shares of investment income that are subject to capital-gains taxes rather than traditional income and payroll taxes.
Total Untaxed Income. Treasury data define the top 1% of earners in 2023 as those with incomes above $686,100 (for a family of two). The untaxed income above this threshold can be calculated as follows:[16]
- These earners’ total market income (wages and investment income) is 13.6% of GDP, of which 8.7% of GDP is earned above the top 1% ($686,100) income threshold, and is thus subject to higher marginal tax rates
- Within that, 5.7% of GDP (or $1.5 trillion) remains after removing the current federal and state income taxes already paid on these earnings
- Subtracting the remaining investment income leaves 2.85% of GDP ($750 billion) in untaxed wage income above the top 1% earnings threshold
That 2.85% of GDP is the theoretical maximum additional revenue that could be raised by applying a 100% income-tax rate on the top 1% of earners above that income threshold (if the individuals did not respond by reducing work hours, reducing income, or shielding their incomes).[17] Put differently, the average family in the top 1% earns $1.88 million—or $1.19 million above the $686,100 threshold of the top 1%. And of that $1.19 million earned over the top 1% threshold,
$403,000 is already paid in federal and state income taxes, leaving $792,000 untaxed. And that amount is split between salaries taxed as income and longer-term investments, which are subject to capital-gains taxes.
Modeling Revenue from Tax-Rate Increase. With CBO data, we can broaden our analysis to cover the 1.5% of tax filers in the 35% and 37% marginal income-tax brackets[18]—that is, those with taxable income greater than $462,500 for joint filers in 2023. This group collectively reports taxable income (excluding long-term capital gains) of 5.9% of GDP ($1.55 trillion),[19] which means that each percentage-point increase in income-tax rate corresponds to 0.059% of GDP, or $15.5 billion in tax revenues. However, for high earners, CBO assumes (consistent with conventional economics) that behavioral responses and income changes (to be discussed below) would reduce new revenues by approximately 15% from this baseline. That means that each percentage-point tax increase would bring in 0.05% of GDP, or $13 billion in annual revenues.[20]
Determining a Plausible Top Tax Rate. CBO reports that those in the 35% and 37% tax brackets produced $564 billion in federal income-tax revenue in 2023, which corresponds to a blended average marginal tax rate of 36.4%.[21] However, this income was also subject to a Medicare payroll tax of 2.9%, an additional Medicare tax of 0.9%, and state income taxes, which have top marginal rates exceeding 10% in states with high concentrations of millionaires (and rise as high as 13.3% in California). These policies add up to a current marginal tax rate of approximately 50% on labor income for the richest 1.5% of earners. Any revenue-maximizing tax rate must adjust from that current rate.
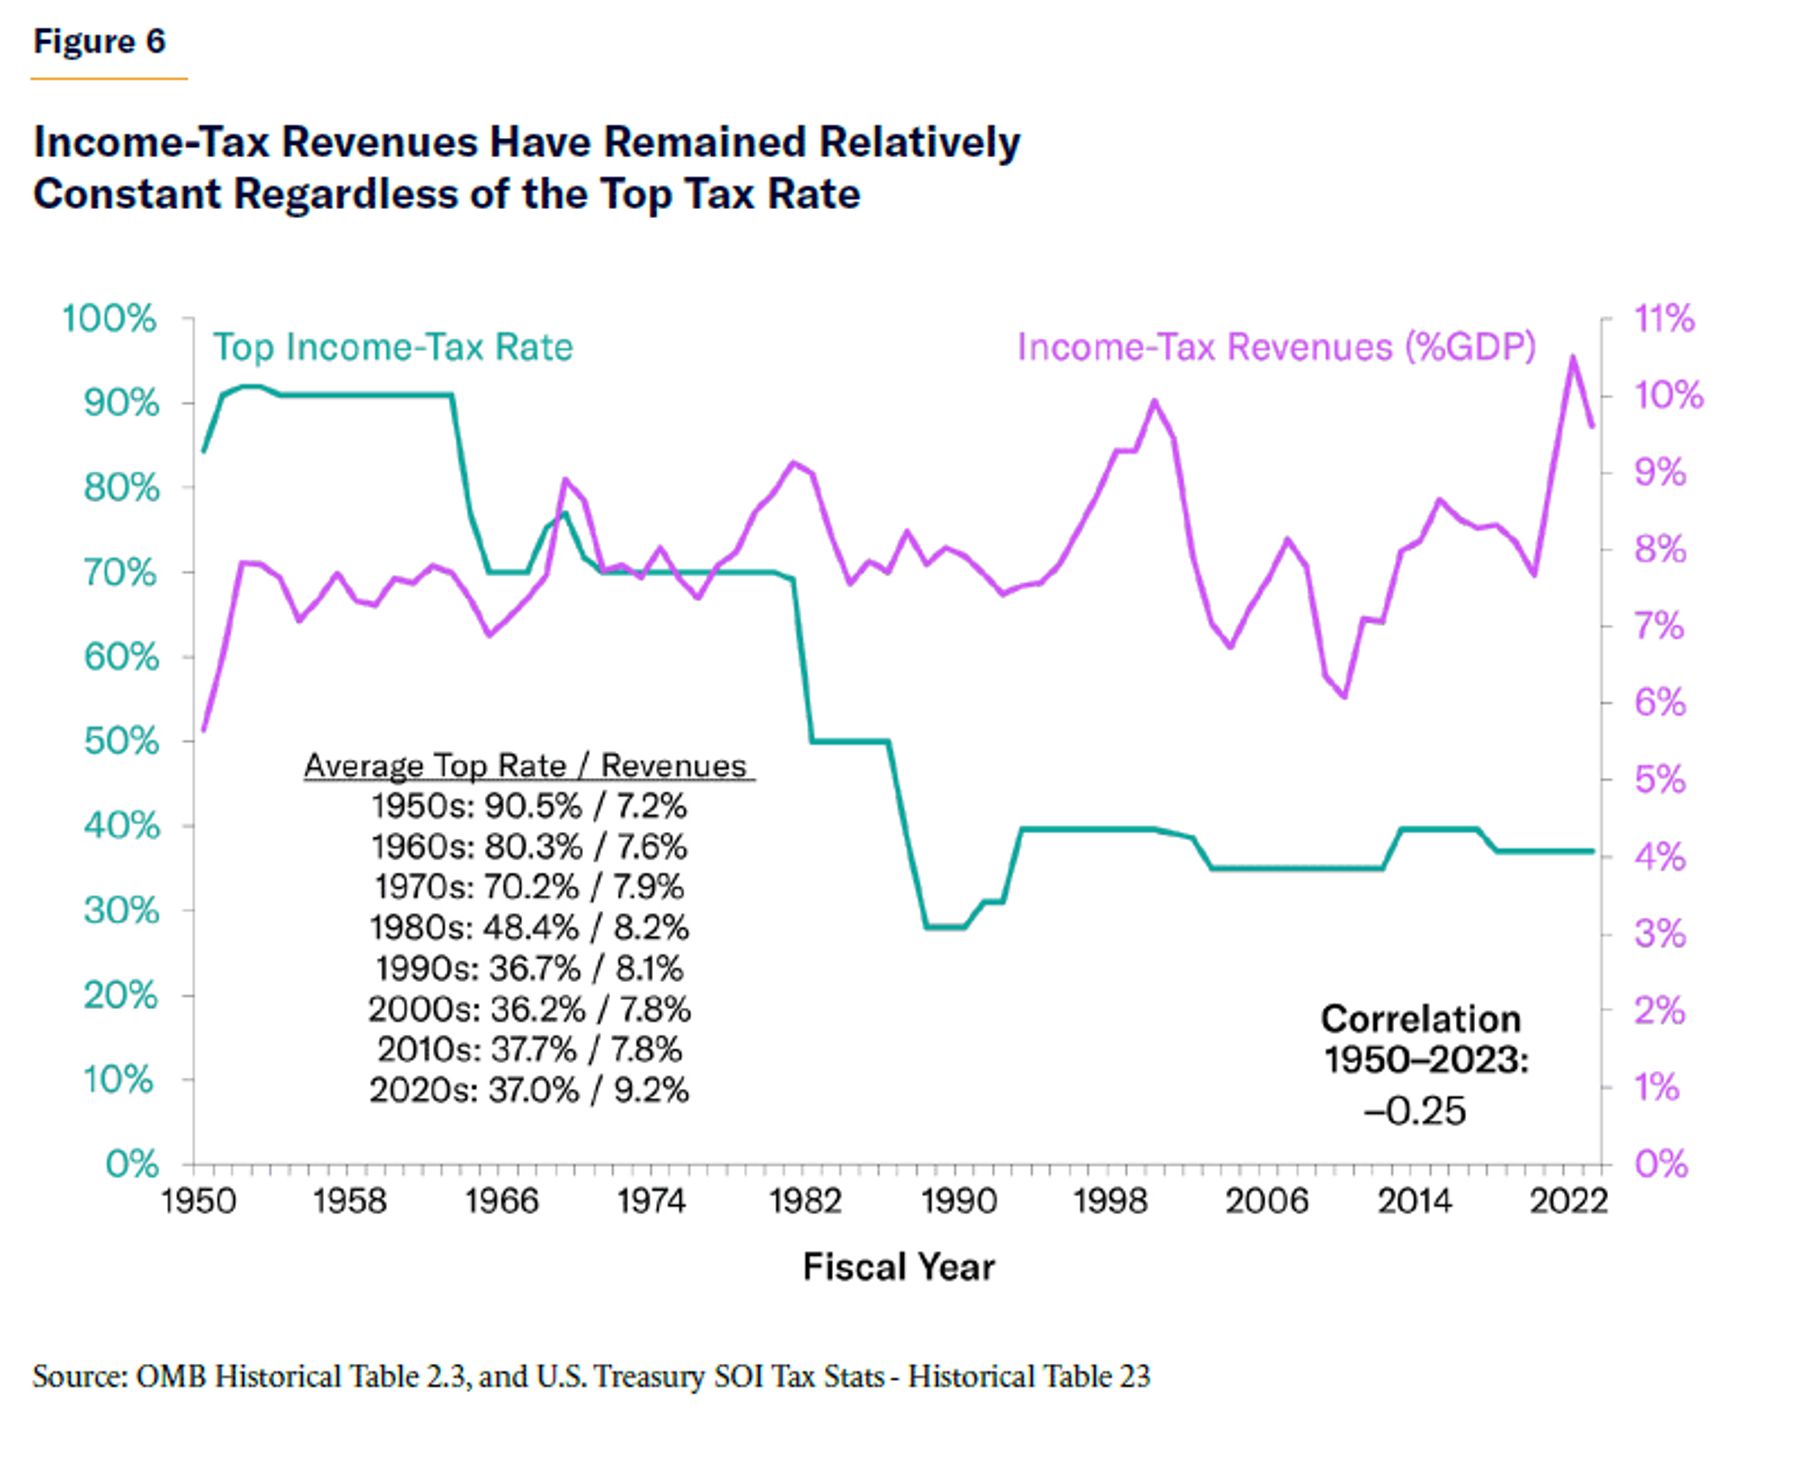
Determining the tax rate that maximizes revenue—known as the peak of the Laffer Curve—has been a lead issue in public finance economics for nearly 50 years. Critics often mock the idea that reducing tax rates can increase tax revenues (which assumes that the current tax rate already exceeds the revenue-maximizing rate). However, the Laffer Curve’s central tenet that there exists some tax rate—below 100%—where revenues peak and therefore higher rates would reduce revenues is not controversial among economists. The debate has instead centered on where the peak rate lies. In fact, Figure 6 shows that there has been no correlation between the top income-tax bracket and total income-tax revenues because tax-rate increases have sacrificed some of the revenue to tax evasion, tax avoidance, macroeconomic losses, and various tax preferences.
Howard Gleckman of the Urban-Brookings Tax Policy Center (TPC) observes that “no matter where Congress has set the top rate over the past half-century, effective tax rates for the highest income 1% stayed in a range of roughly 20% to 24%. Rate hikes could raise significantly more revenue but only if they are combined with measures to limit tax avoidance, such as eliminating tax preferences—a step Congress has largely been unwilling to take for the past three decades.”[22]
Economists Peter Diamond and Emmanuel Saez famously offered 73% as the revenue-maximizing income-tax rate. However, this was based on an estimated elasticity of taxable income (ETI)—which measures how rapidly income falls in response to rising marginal tax rates—that has been criticized as too low. Even Diamond and Saez conceded that the peak income-tax rate—including state and payroll taxes—could be as low as 54%.[23]
Research by conservative economists, such as Martin Feldstein and Lawrence Lindsey, as well as liberal economists, such as Austan Goolsbee and Jon Gruber, has shown a higher responsiveness to tax rates, particularly for upper-income taxpayers.[24] Such responsiveness may result from:
- Income shifting: Upper-income families may respond to higher tax rates by shifting their compensation from wages into tax-advantaged fringe benefits such as retirement accounts and employer-sponsored health care. Some individuals are able to shift compensation into lower-taxed capital gains or corporate income, move income overseas, or engage in more aggressive tax evasion.
- Short-term responses: In response to a sharp increase in tax rates, upper-income workers may have the financial flexibility to reduce work hours, cut back on overtime, and take more unpaid vacations.
- Medium-term responses: Excessive tax rates may cause a spouse or secondary earner to exit the labor force and instead stay home with the kids (especially if his or her income is pushing the family into the higher tax bracket). Entrepreneurs may be less likely to create or expand businesses because the effort and risk are not worth the smaller potential payoff.
- Long-term responses: The next generation of younger workers may shift to less lucrative college majors and career choices because steep tax rates reduce the reward. A medical student who may have been enticed by the salaries of neurosurgery or cardiology may instead opt for general practice. Business students dreaming of riches may shift to other majors.
A broad range of empirical economic research has shown that—while lower-earners cannot afford to be flexible—the highest earners have much more flexibility to respond to exorbitant tax rates.[25] Thus, the revenue-maximizing rate may be anywhere between 50% and 70%, with negative revenue effects growing over time because of the long-term responses described above, as well as the cumulative long-term effect of slower economic growth producing a larger income gap.
Before settling on a revenue-maximizing rate, one additional factor must be considered. As tax rates rise, the revenue feedback effect—the percentage of additional revenue lost—also rises. This is driven not only by individual behavioral responses but also by the spillover economic effects of reduced work, investing, and entrepreneurship. At lower tax rates, the economic distortions are small, so raising revenue is easy. However, as marginal tax rates soar into the 50s and 60s, the economic costs rise and added tax revenue slows. The revenue-maximizing rate is the point at which the economic damage is large enough to cancel out any new revenues—where the feedback losses consume 100% of the potential new revenues from a higher tax rate.
This means that—even if the revenue-maximizing marginal tax rate is 70%—pushing marginal tax rates through the 60s will reduce the amount of new revenue (per percentage point) from $13 billion toward zero. At the same time, the economic damage caused by each additional rate hike accelerates. Thus, most economists agree that it is unwise to push marginal tax rates near the literal peak of the Laffer Curve. In a way, the revenue-maximizing tax rate is like the sun: being in sight of it from a safe distance can provide warmth and energy, but flying directly into it will bring destruction.
After being asked where the Laffer Curve peaked, economist Martin Feldstein explained why that’s the wrong question: “Why look for the rate that maximizes revenue? As the tax rate rises, the ‘deadweight loss’ (real loss to the economy) rises so as the rate gets close to maximizing revenue the loss to the economy exceeds the gain in revenue I dislike budget deficits as much as anyone else. But would I really want to give up say $1 billion of GDP in order to reduce the deficit by $100 million? No. National income is a goal in itself. That is what drives consumption and our standard of living.”[26] Significantly damaging the entire economy in order to squeeze the last 0.05% of GDP in tax revenues is surely self-defeating.
Thus, even if the Laffer Curve peaks closer to 70%—a generous assumption—the plausible peak tax rate is likely about 60%. Any higher would bring little revenue and a lot of economic damage. Given that the current top marginal tax rate is approximately 50%, this suggests that as much as a 10-percentage-point tax hike on wages would raise tax revenues. And using the calculations above, a 10% hike on families in the two top tax brackets (earning at least $462,500) would collect 0.5% of GDP, or $130 billion annually.[27]
Such a 10% tax-rate increase could be enacted either through income or payroll taxes—each is part of the same marginal tax rate. This means that the popular progressive option of applying the 12.4% Social Security payroll tax to upper incomes would leave no room to raise upper-income-tax rates for any other progressive priorities or deficit reduction.[28] While these potential revenues may seem low, given the often obsessive focus on raising upper-income-tax rates when seeking new revenues, the reality is that marginal tax rates are already approximately 50%, and wealthy families receive much of their income in capital gains rather than wages and salaries.
That said, two other categories of reform might collect additional income-tax revenue from high earners: tax enforcement and tax preferences.
Tax Enforcement.[29] President Biden’s Treasury Department estimates that, in 2019, the top-earning 1% of taxpayers underpaid their taxes by $163 billion and that the top 5% underpaid by $307 billion (1.45% of GDP).[30] Much of this tax gap was driven by underreporting income, particularly for pass-through businesses that pay the individual income tax.[31] Closing one-quarter of the upper-income-tax gap would raise $77 billion, or 0.36% of GDP (all measured in the 2019 economy). While this recovery rate may seem underwhelming, it matches or exceeds many current blueprints of what is feasible, given the operational difficulty in closing the tax gap.[32] America’s tax gap is smaller than that of most developed economies,[33] and the marginal cost of enforcement (measured in paperwork mandates, compliance time, and IRS audits) grows rapidly as the tax gap shrinks and the hardest cases remain. Completely closing the gap is no more feasible or desirable than reducing the crime rate all the way to zero—which would require a dystopian, paralyzed, and surveillance-based police state that no one wants. The Treasury Department reports that half the tax gap comes from the bottom-earning 95% of earners, so extending tax-enforcement measures more broadly could bring in additional revenue.
Tax Preferences. Restraining tax exemptions for employer-provided health insurance and retirement incentives could provide some revenue from high earners, but the amount is modest. Tax savings from the health exclusion level off as incomes soar because health-care consumption levels also level off. Tax-advantaged retirement contributions are also capped, and while the wealthy save more dollars from this tax preference (because the exemption shields them from a higher tax bracket), their tax savings decline as a share of income, falling below middle-income earners.[34] However, some abuses, such as “Mega-IRAs,” have grown beyond $10 million.[35] Tightening these upper-income loopholes could save perhaps $10 billion annually, or 0.04% of GDP.
Within itemized tax deductions, CBO estimates that 0.4% of GDP could be raised by their full elimination at all incomes.[36] However, this report’s analysis is limited to the top-earning taxpayers, and their most popular (by far) itemized tax deduction for charitable giving will not be eliminated or even significantly limited.[37] Additionally, the state and local tax (SALT) deduction is now capped at $10,000, and the mortgage interest deduction is limited to $750,000 of home indebtedness (although older, larger mortgages are grandfathered into previous higher levels). Rather than further restrict any deduction, the most realistic reform option would cap their savings at 28% (meaning that those in higher income-tax brackets would have to reduce their itemized deductions). Capping itemized deductions at 28% in value (against the higher tax rates detailed above) would bring in 0.1% of GDP, or roughly $26 billion annually.[38]
Total Revenues: Income-tax rate increases (0.50% of GDP), plus tax enforcement (0.36%), paring back retirement-incentive abuses (0.04%), and capping itemized deductions (0.10%) sum to 1.0% of GDP.[39]
II. Capital-Gains Taxes (0.2% of GDP)
Progressive critics have long argued that investment returns should not be taxed at a lower rate than wages and salaries. Even billionaire investor Warren Buffett has complained that his own capital-gains tax rates—which top out at 20%, or 23.8%, including a 3.8% Net Investment Income Tax (NIIT)—are too low relative to the salary income-tax and payroll-tax rates paid by his employees. However, America’s capital-gains tax rate fits within international norms, and aggressively raising the rate could reduce revenues.
Total Untaxed Income. Over the next decade, CBO projects that an average of 4.1% of GDP ($1.35 trillion) in long-term capital gains will be reported on federal tax returns (short-term capital gains—from investments lasting one year or less—are taxed as ordinary income).[40] CBO also projects that these long-term capital gains will bring in tax revenues of 0.8% of GDP ($260 billion annually). State taxes on capital gains bring in roughly $90 billion as well. Capital gains are overwhelmingly tilted up the income ladder, with 75% of all long-term capital gains reported by the richest 1%, and 85% of capital gains reported by the top 5%.[41] This suggests that there is 2.25% of GDP ($750 billion) in annual untaxed capital gains among the top 1% of earners.
Modeling Revenue from Tax-Rate Increase. CBO estimates that each percentage-point rise in the capital-gains tax rate would add $5.5 billion in tax revenues (or just under $5 billion for high earners) each year over the decade.[42] Given that the capital-gains tax base of $1,350 billion would correspond to $13.5 billion per percentage point in taxes, CBO’s $5.5 billion estimate reflects the reality that most new tax revenue would be lost to a collapsing tax base.
Determining a Plausible Top Tax Rate. Before specifying a range of plausible capital-gains tax rates, it is worth examining why nearly all developed countries tax investments at a lower rate than ordinary income. The primary reason is that investor behavior is extraordinarily sensitive to tax rates, which limits the new revenue that can be raised. Capital gains are taxed only after the investment is sold, and investors can choose—often based on tax rates—when to sell an investment and pay the tax. Furthermore, high investment taxes discourage investments from being undertaken in the first place.
Thus, Congress’s Joint Committee on Taxation (JCT) estimates that a 10-percentage-point rise in capital-gains taxes would lead to a sustained 7% reduction in capital-gains income.[43] And in the short run, capital-gains tax increases have reduced tax revenues by locking investors into extending current investments to avoid the tax (or selling quickly before the new tax rate is implemented).
There are additional reasons for the preferential tax rate. Unlike the income tax, capital-gains taxes are not adjusted for inflation. If an investment value rises from $100 to $200 during an extended period with 50% inflation, the 23.8% tax rate is assessed both on the $50 inflationary growth and the $50 “real” gain—which is equivalent to a 47.6% tax on the inflation-adjusted returns. Nations such as Canada and Australia address the inflation issue by excluding half of investment returns from taxation.[44]
Capital gains also represent a second layer of taxation on corporate income. Corporations directly pay a 21% federal tax rate, and then investors pay a 23.8% tax based on the company’s after-tax income, for a combined tax of 39.8% on corporate income.[45] Investors are typically investing their own after-tax income, bringing a third layer of taxation. Finally, many economists support encouraging investment as a key driver of long-term economic growth, and thus agree that investment should be taxed at a lower rate than consumption.
The current tax rate of 20%, plus the 3.8% NIIT surtax and state taxes that rise as high as 13.3% in California, bring a combined tax rate as high as 37.1%. Yet estimates from the Treasury Department and JCT have typically assumed a revenue-maximizing rate of 28%–32%, while Penn-Wharton economists peg that tax rate at 33%.[46] Thus, New York University’s David Kamin—who served as a top economic advisor to Presidents Obama and Biden—writes that the “current [capital-gains tax] rate is within striking distance of the top of the [Laffer] curve,” and thus “there is relatively little revenue to generate from the highest-income Americans by increasing the tax rate on dividends and, especially, capital gains.”[47] He adds that taxing investments at the same rate as ordinary income is likely to lose revenue relative to the peak tax rate.[48] The Tax Foundation’s tax and economic model also finds that taxing capital gains as ordinary income would reduce tax revenue.[49]
Pushing back on this consensus, Princeton’s Ole Agersnap and Owen Zidar estimate that the capital-gains tax rate can rise to 38%–47% before revenues fall. A study by Natasha Sarin, Lawrence Summers, Owen Zidar, and Eric Zwick suggests that the revenue-maximizing rate could approach 40%.[50]
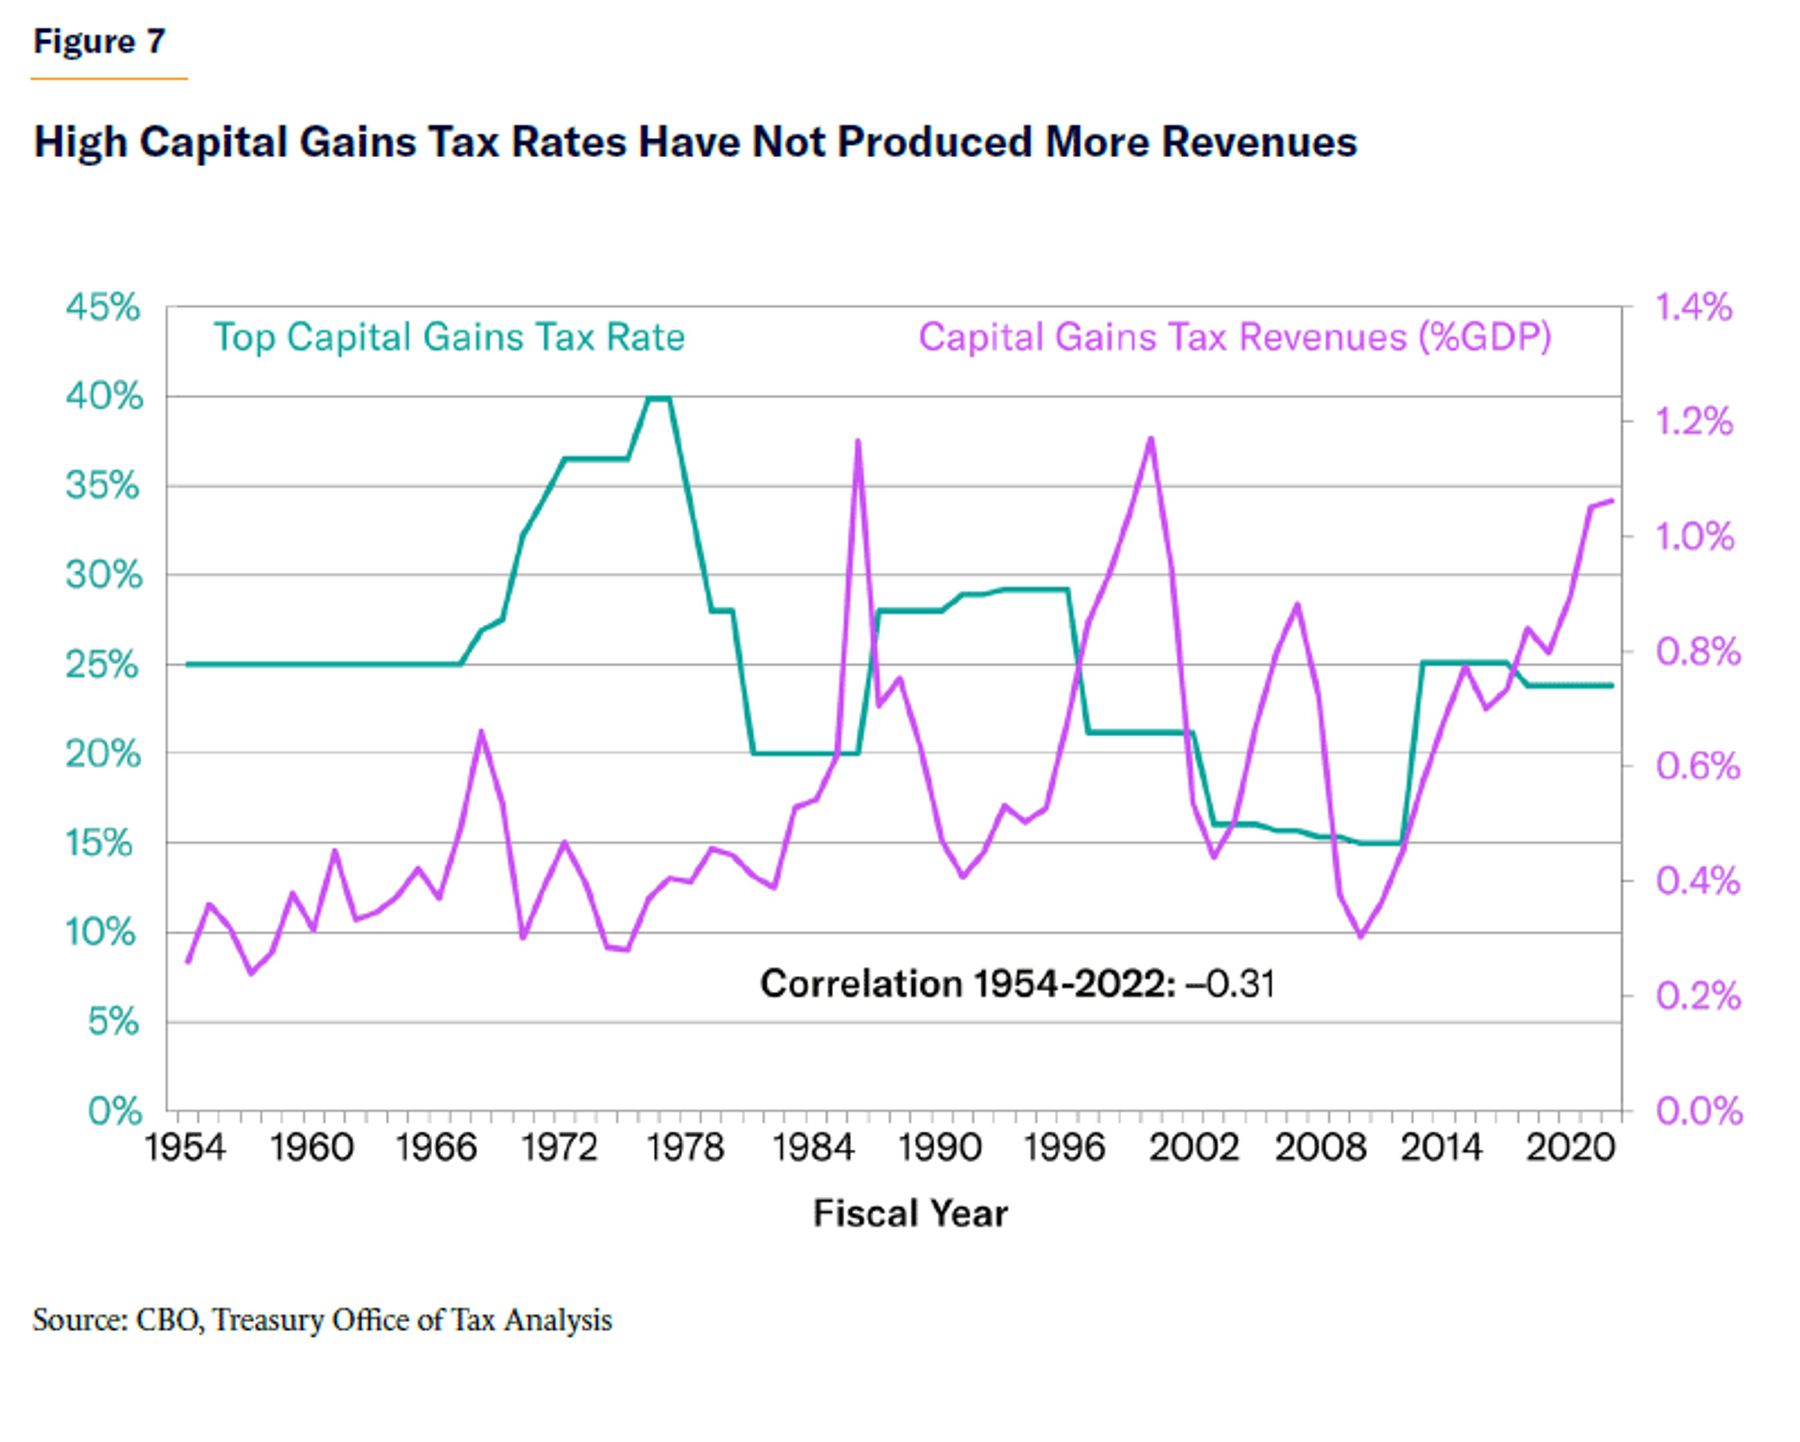
Nevertheless, since 1954 the correlation between capital-gains revenues (as a share of GDP) and the top capital-gains tax bracket has been –0.31, meaning that higher tax rates have generally seen lower tax revenues (see Figure 7). In fact, an 8-point reduction in the capital-gains tax rate beginning in 1997 was followed by a permanently higher level of capital-gains realizations and revenues.[51]
The long-term rise in capital-gains revenues despite lower statutory tax rates is especially striking because from 1965 to 2015, the share of U.S. corporate stock held in taxable accounts collapsed from 84% to 24%.[52] The majority of stock investments are now held by foreigners or in retirement plans that are largely free from capital-gains taxation. Unless policymakers want to start assessing annual taxes on 401(k)s and corporate pension contributions, capital-gains taxes will continue to provide a limited source of revenue.
For all these reasons, raising the capital-gains tax rate—which is already 10 points above the OECD average—would, by itself, likely yield little to no additional revenue.
Taxing Capital Gains at Death. The top capital-gains tax rate is not the only variable affecting capital-gains revenues. In fact, broader reforms would expand the capital-gains tax base and even modestly push up the profit-maximizing tax rate. Currently, investments that are held until death can be passed down to heirs with their entire capital-gain reset to zero (so for an investment whose value had risen from $100 to $300, the inheritor becomes tax-liable only for the future asset appreciation above the $300 level, and the previous $200 gain is never taxed). This policy—known as stepped-up basis—allows substantial capital gains to escape taxation. It also locks in older, wealthy investors, who may resist exchanging a suboptimal investment in order to protect its tax-free status until it is passed down to an heir. Common reform options include either assessing a capital-gains tax at the time of death, or using the original price of the asset to calculate the capital-gains tax paid by the heir when it is eventually sold (in the previous example, assessing taxes from the original $100 price paid rather than the $300 inherited level).
Repealing stepped-up basis would ensure that more capital gains are eventually subject to taxation and reduce investors’ flexibility to avoid higher capital-gains tax rates. Consequently, this policy would increase the revenue-maximizing tax rate to a level estimated at 38% (Tax Foundation), 42% (Penn-Wharton), and 50% (Tax Policy Center).[53]
Mark-to-Market Taxes. Additionally, lawmakers such as Senators Ron Wyden (D-OR) and Elizabeth Warren have endorsed a version of mark-to-market taxation, which taxes investments on their annual appreciation even if they are not sold. The idea is to tax asset appreciation along the way, rather than waiting for a sale, and to avoid the financial gaming that allows some investments to escape taxation altogether.
While the concept has intuitive appeal, nearly all nations have resisted mark-to-market taxation because it is considered largely unworkable.[54] The first challenge is determining the value of assets that have not yet been sold and had their value determined by the market. Stocks and bonds can be valued by current share prices, but half the investments owned by the richest 1% are in hard-to-value assets such as real chart and privately held businesses.[55]
Additionally, taxing the annual growth of investment values would mean sending tax rebates when investment values decline. Taxpayers would surely bristle at the Treasury sending payments to Jeff Bezos, Mark Zuckerberg, and other billionaires during down years. Such payments would create significant pro-cyclical revenue volatility by collecting large tax revenues during boom years and paying out large tax rebates during market declines, which are already associated with recessions and rising deficits.[56] Mark-to-market taxation could create cash-flow challenges for those whose wealth is tied up in illiquid assets like private businesses and who thus may not have the cash on hand to pay annual taxes, which could be in the tens of millions of dollars. Mark-to-market taxation may face constitutional challenges, on the theory that a tax on unrealized gains is not an income tax (which is authorized by the Sixteenth Amendment) and thus constitutes a direct tax that would have to be apportioned among the states in proportion to their population. However, the legal consensus suggests that the policy would likely survive legal challenges.[57]
As long as fewer capital gains escape taxation entirely—such as by taxing capital gains at death—mark-to-market taxation becomes less necessary. If the asset is going to be taxed at some point, mark-to-market taxation just moves up the payment date of the tax.[58] This timing shift may eliminate some windfall to investors and cost to government (on a net present value basis), but that seems hardly worth the administrative burden, revenue volatility, and (possibly) constitutional issues. Thus, the Urban-Brookings Tax Policy Center—though generally supportive of increasing taxes on wealthy investors—strongly prefers taxing capital gains at death instead of attempting mark-to-market taxation.[59]
Lily Batchelder and David Kamin have cataloged other ways in which investment returns escape capital-gains taxation through legal and legally questionable tax-planning strategies.[60] However, economists have not identified loophole-closing policies that would raise significant revenues beyond taxing capital gains at death and mark-to-market taxation.
Total Revenues: President Biden has proposed taxing capital gains and dividends at a top rate of 39.6% for taxpayers with annual incomes over $1 million and taxing unrealized capital gains at death, which his budget estimates will produce revenues of 0.1% of GDP.[61] This would bring the marginal tax rate on capital gains—including the 3.8% NIIT and state taxes—to roughly 50%. In California, top investment-tax rates would exceed 55%. This likely exceeds even the higher revenue-maximizing rate that comes from repealing stepped-up basis. Still, an estimate that generously assumes the full 0.1% of GDP from the president’s proposal, as well as some modest loophole closures, would show 0.2% of GDP in new revenues—approximately $50 billion annually.
Like the income-tax estimate above, this low figure may underwhelm progressives. However, it represents a one-quarter hike over the 0.8% of GDP currently collected in federal capital-gains taxes. Furthermore, the movement of corporate stock ownership into tax-free retirement accounts limits the capital-gains tax base (unless one wishes to begin taxing middle-class retirement contributions). Finally, the historical correlation between capital-gains tax rates and revenues has been weak, and mark-to-market taxation is likely not feasible.[62]
III. Corporate Income Taxes (0.8% of GDP)
Comparing corporate-tax revenues over time and across countries is complicated by a tax base that is rather amorphous. This is the result not only of the government calculating business income differently from how it is calculated under traditional accounting standards, but—more important—the long-term shift of most business income out of the corporate-tax code and into the individual income-tax code. Specifically, the rise of pass-through businesses (such as small businesses, partnerships, and S-corps) that pay individual income taxes creates the misleading narrative that lower corporate-tax revenues must reflect lower overall business taxation. In modeling any plausible new taxes, this section attempts to clear up some of this confusion.
Total Untaxed Income. CBO calculates that corporate profits as defined by typical accounting standards average 11.4% of GDP.[63] However, converting to federal taxable profits requires several adjustments. This includes adjusting for businesses understating income and overstating expenses (subtract 1.8% of GDP from the total), adding gains for sale of property (add 2.2% of GDP), and shifting from measuring income earned by American corporations (domestic or abroad) to income earned within the U.S. by domestic and foreign corporations (subtract 0.6% of GDP). While many of these adjustments net to zero, the most important adjustment—removing the net income of pass-through businesses that instead pay the individual income tax—helps reduce the corporate income subject to the corporate tax to 8.4% of GDP ($2.2 trillion).
At a 21% corporate-tax rate, federal corporate-tax revenues in 2023 are 1.8% of GDP ($475 billion)—similar to the revenue levels before the 2017 tax reforms, which reduced the tax rate from 35% but broadened the tax base.[64] State taxes push the total revenue to approximately 2.2% of GDP. Some after-tax corporate profits are also distributed to shareholders as dividends (which are taxed in the individual income-tax code) and contribute to rising valuations and capital-gains taxes. All these taxes put the actual universe of untaxed corporate income closer to 5% of GDP ($1.3 trillion). However, because the corporate-tax base is based on profits, which can be conceptually amorphous, there can be disagreement on what should be considered taxable income.
Modeling Revenue from Tax-Rate Increases. CBO estimates corporate-taxable income of $2.2 trillion, which would correspond, in theory, to $22 billion in new revenue per percentage-point increase in tax rate. However, CBO estimates that each percentage-point increase in the tax rate would produce only $11 billion in revenues (0.04% of GDP).[65] This smaller figure likely reflects corporate responses to tax increases that reduce the tax base, as well as some offsetting reductions in capital-gains and dividends revenues.
Determining a Plausible Top Tax Rate. Determining a revenue-maximizing corporate-tax rate is a challenge lacking a clear economic consensus. A Congressional Research Service (CRS) report surveyed studies showing a revenue-maximizing rate as low as 30% and as high as 57%, with CRS authors questioning whether a Laffer Curve even exists in corporate taxes.[66] One challenge is that the corporate response to higher tax rates depends on several factors, such as the substitutability between capital and labor, the pretax return on capital, and the tax policies of competing nations. Thus, the highest plausible corporate-tax rate may be determined more by acceptable levels of economic harm than by a revenue-maximizing rate.
As stated above, the 2017 tax reforms reduced Washington’s corporate-tax rate from 35% to 21% but also broadened the corporate-tax base and imposed international reforms, which reduced the estimated revenue loss to 0.1% of GDP on a static basis.[67] President Biden has proposed raising the corporate-tax rate to 28% (which would raise 0.28% of GDP), as well as aggressive tax increases on the foreign income of U.S. multinational firms, which would raise 0.35% of GDP.[68] Biden’s remaining corporate-tax proposals would raise 0.1% of GDP. Relative to the 1.5% of GDP in federal corporate-tax revenues projected by CBO over the next decade, these policies would constitute an approximately 50% increase in corporate taxes paid, or well over $2 trillion over the decade. Such substantial corporate-tax increases likely reach (and possibly surpass) the limit of plausibility in today’s competitive global environment.
Can Tax Rates Go Even Higher? Returning corporate-tax rates to pre-2017 levels (while retaining all subsequent base-broadeners) is broadly considered unrealistic and unwise. The president’s more restrained proposal would nonetheless push federal corporate revenues to approximately 2.3% of GDP, which is significantly higher than the 1.7% of GDP average of recent decades.[69] Yes, corporate-tax revenues would remain below the 3.7% of GDP of the 1960s and 2.6% of GDP of the 1970s—as well as slightly below some of America’s European trading partners (as will be discussed below). However, merely comparing revenue levels across eras and countries fails to account for the movement of more business taxes into the individual tax code, which—at 1.3% of GDP—pushes today’s total federal business taxes to 3.0% of GDP (plus as much as 0.6% of GDP from state taxes).[70]
Additionally, while America’s corporate-tax rates were higher in the 1950s and 1960s,[71] any competitive disadvantage was muted by similarly high tax rates across the world. Furthermore, the decline of corporate-tax revenues since the 1960s was also influenced by a declining tax base due to lower (C-corporation) corporate profit shares.[72] In short, even the same corporate-tax rates can produce wildly divergent revenue levels, depending on the size of the corporate sector, profit margins, and the tax rates of America’s competitors.
Instead, the tax rate faced by corporations is more relevant when assessing the corporate-tax burden across nations and eras. Before the 2017 tax reforms, America’s 39.1% corporate-tax rate (when including state tax rates) was the highest among G20 nations. Even after accounting for corporate-tax preferences, America had the G20’s third-highest average corporate-tax rate and fourth-highest effective tax rate.[73] Tax rates were so high (and America’s corporate-tax code so antiquated) that American corporations began moving their headquarters and even operations overseas.
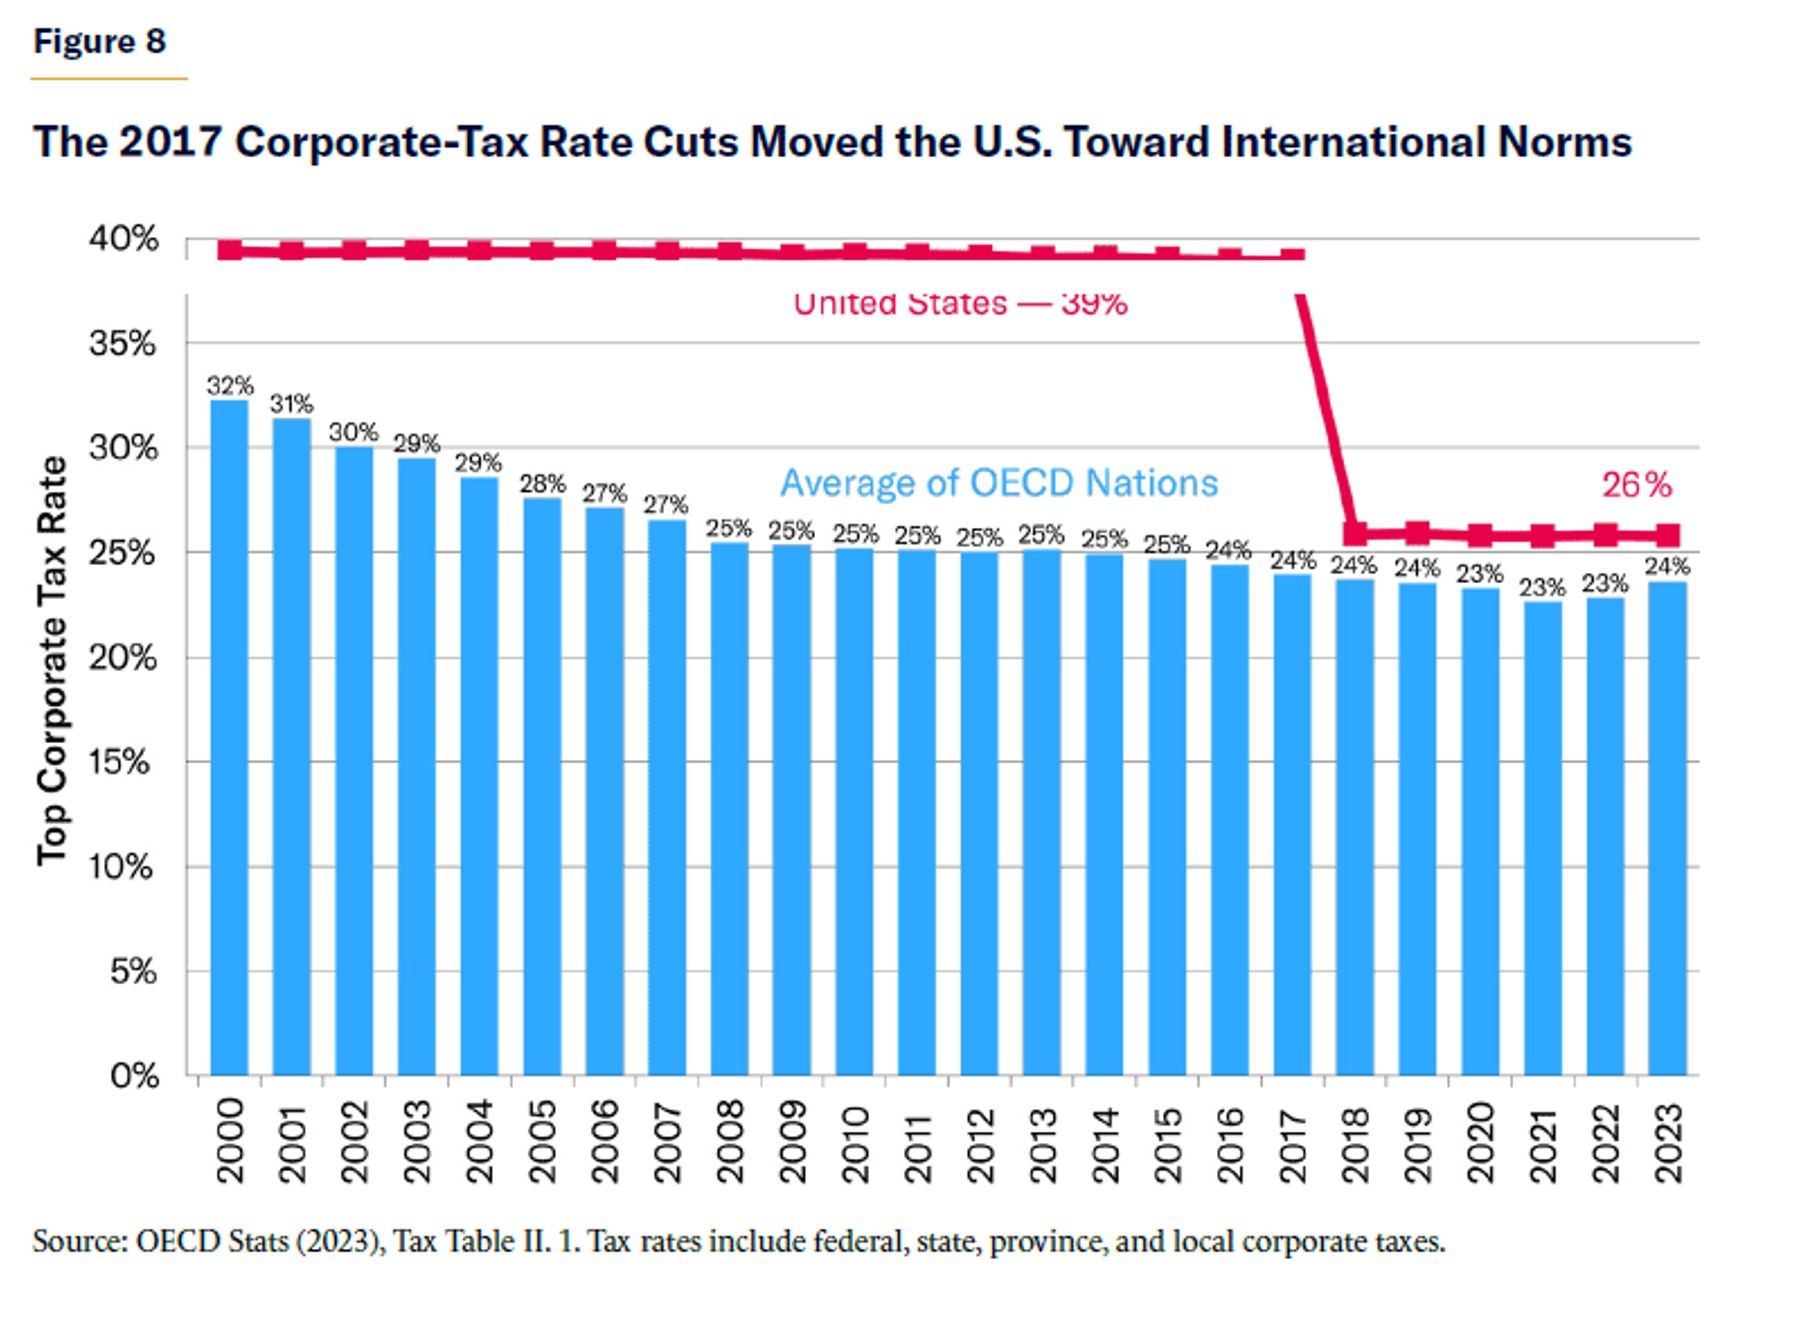
Even after the 2017 tax cuts, America’s current 25.8% corporate-tax rate (including state taxes) is tied for 13th among 38 OECD nations (see Figure 8).[74] America’s effective average corporate-tax rate of 22.3% also exceeds the OECD average.[75] Raising the corporate-tax rate by 7 percentage points—as proposed by President Biden—would push the combined federal and state tax rate to 32.8%, exceeding every OECD nation except Colombia.
In that context, restoring the pre-2017 tax rate of 35% (or nearly 40%, including state taxes) would vastly exceed the rates of competing nations. And it would far exceed the pre-2017 tax burden because it would retain the corporate base-broadeners that companies traded away in 2017 for a lower corporate-tax rate. There was a strong bipartisan agreement in 2017 that the corporate-tax code required modernization; today, there is little congressional support for returning to pre-2017 tax rates while also retaining the subsequent base-broadeners.
In fact, the global trend has been to slash corporate-tax rates. The Tax Foundation notes that “the [global] weighted average statutory corporate income tax rate has declined from 46.52% in 1980 to 25.43% in 2022.”[76] Since 2000, every OECD nation except Chile and Colombia has cut its corporate-tax rate, from an average of 32.3% to 23.6%. These tax-rate reductions were motivated by intense global competition for investment, markets, consumers, and even workers, as well as the desire to build stronger economies with higher wages. And even pushing federal corporate-tax rates back to 35% would provide only 0.3% of GDP in revenues above President Biden’s 28% proposal—and likely less, after accounting for the reduction in global competitiveness.
Additional Reforms. President Biden’s proposals push the limit of revenue-raising through aggressive international tax reforms with higher minimum tax rates, as well as by reducing corporate-tax preferences in areas such as energy and corporate stock buybacks. Additional savings would likely require reducing popular (and pro-growth) tax incentives for research and development, interest expenses, and depreciation of new capital investments—and even those revenue gains would be relatively small.[77] Further crackdowns on corporate-tax evasion (such as understating income and overstating deductions) have also proved operationally challenging. These constraints allow for perhaps $20 billion annually (0.07% of GDP) in potential tax savings beyond President Biden’s aggressive proposals.
Total Revenues: President Biden’s 28% corporate-tax rate (0.28% of GDP), international tax reforms (0.35%), and other tax-preference reforms (0.10%) could combine with various other tax-preference and tax-evasion reforms (0.07%) to produce total corporate revenues of 0.80% of GDP. And even these policies may prove unsustainable in a competitive global economy.
IV. Estate and Wealth Taxes (0.1% of GDP)
Estate Taxes. The federal government currently imposes an estate tax rising to 40%. The first (approximately) $26 million in estate valuation ($13 million if single) is exempt from federal estate taxes, after which the marginal estate-tax rate rises from 18% to 40% across the next $1 million of valuation.
After affecting only 1% of adult deaths through the 1940s, a low eligibility threshold eventually brought 139,000 estate-tax filings in 1976 (8% of all estates), albeit at tax rates as low as 3%. Between 1977 and 1995, Congress passed reforms that raised the exemption to $600,000 ($1.2 million in today’s dollars), and raised rates to 18%–55%, depending on the level of wealth.[78] Increases in the exemption threshold since 2001 have reduced the number of annual estate-tax filings from 110,000 to 4,000 (although not all filings show an estate-tax liability).[79]
A Tax Foundation analysis of IRS data shows that, in 2021, 2,584 taxable returns paid a combined estate tax of $18.4 billion (0.1% of GDP)—an average of $7.1 million in taxes per estate. Nearly 90% of estate-tax revenues came from the 1,234 estates worth $20 million or more. More narrowly, more than 60% of all estate-tax revenues came from 369 estates worth $50 million or more. Half of estate taxes were paid from California, New York, Florida, and Texas.[80] These tax rates and revenues suggest that the remaining untaxed portion of these estates above the current tax threshold is approximately $30 billion, or 0.12% of GDP.
Essentially, the past half-century of tax reformers decided to focus the estate tax on the super-wealthy, and no longer to also require the broader upper class to file estate-tax returns in order to pay 3% tax rates. They also set estate-tax thresholds high enough to protect the inheritors of small businesses and family farms from having to sell the businesses or farms to pay the estate tax. As explained later in this report, America’s estate taxes are generally higher than those of most OECD nations.[81]
In 2020, then-candidate Joe Biden proposed raising the top estate-tax rate from 40% to 45% and lowering the estate-tax exemption to $3.5 million (single) or $7 million (married). This policy, which was in place in 2009 (albeit without a subsequent inflation adjustment), would raise 0.1% of GDP.[82] That option is much more plausible than Bernie Sanders’s proposal to impose a new series of estate-tax rates rising to 77% for estates larger than $1 billion. TPC estimates that Sanders’s tax would raise revenues by 0.14% of GDP (rising to 0.17%), while Penn-Wharton economists put the figure at 0.10% of GDP.[83]
An estate tax as high as 77% is infeasible in the current economy because the wealthiest Americans with access to significant financial-planning resources will not passively surrender as much as three-quarters of their wealth to the federal government. Wealthy Americans will instead move their net worths into tax shelters (trusts, gifts, charitable giving) that almost certainly will not be eliminated. Owners of larger private businesses may convert their businesses into C-corporations that are not subject to estate taxes when the owners die. As a last resort, wealthy people facing overly steep estate-tax rates could opt to rapidly consume (often unnecessary) goods and services rather than invest or grow wealth that can have positive spillover effects in the economy.
Total Revenues: 0.1% of GDP from Biden campaign plan to restore 2009 levels.
Wealth Taxes. The difficulties of substantially taxing the wealthy through income taxes (much of their income comes from investments) and capital gains (in which realizations are extraordinarily sensitive to tax policy) have led many progressive leaders to endorse the more straightforward approach of directly taxing away billionaire net worths. Indeed, Sanders has proposed an annual wealth tax with rates rising from 1% on net wealth over $32 million, all the way to 8% on net wealth above $10 billion (single filers would have the thresholds cut in half). Elizabeth Warren has proposed a wealth tax with a rate topping out at 6% over $1 billion.[84]
The estimated revenues from a wealth tax are often prone to exaggeration. Even seizing all $4.5 trillion in wealth owned by America’s billionaires—every home, car, investment, and business—could finance the federal government one time for just nine months.[85] The Sanders wealth tax has been scored as raising 0.8% of GDP ($2.3 trillion over the decade),[86] and it is quite possible that the resulting reduction in the long-term net worth of the wealthiest Americans would reduce the wealth tax base and thus, over time, the annual tax collections. After all, if billionaire wealth stops growing significantly, so will billionaire wealth-tax revenues.
This type of wealth tax is simply not plausible or realistic, especially at the tax rates proposed by Warren and especially Sanders. The first challenge is that most billionaire wealth is tied up in businesses and the stock market—rather than mansions, yachts, and savings accounts—that may need to be liquidated to pay such a large annual tax. Forcing Jeff Bezos to sell $11 billion in Amazon stock annually, Elon Musk to sell $18 billion in Tesla and SpaceX stock, and other billionaires to unload their investments to pay annual wealth-tax rates rising to 8% would likely take a toll on every American’s 401(k).
An 8% wealth tax would require investments to grow 8% annually just to break even—the equivalent of a 100% tax on such gains. And unlike capital-gains taxes—which tax investment returns proportionally—a wealth tax would impose the equivalent of a lower marginal tax rate on investments earning supernormal returns, which are more likely to be exploiting an economic rent or monopoly power, than on more traditional and modest investments. (For example, a 4% wealth tax would seize all of an investment’s 4% returns but only one-fifth of a different investment’s 20% returns).[87]
Sanders’s proposal includes capital-gains tax rates reaching 62% (not including state taxes), followed by an 8% wealth tax, and then eventually a 77% estate tax. It would produce combined tax rates on investments often exceeding 100%, followed by the seizure of most remaining wealth at death. And if the economy falls into recession or if a market decline shrinks investment portfolios, adding an 8% annual wealth tax could result in total wealth falling by half over a five-year period for some families. Regardless of one’s level of sympathy for billionaires, such an event would significantly reduce investment, further erode 401(k) portfolios, and reduce the tax base for wealth taxes moving forward.
Yet the tax rate is not the only weakness of wealth-tax proposals.[88] Like mark-to-market taxation proposals, wealth-tax proposals present an administrative nightmare of: 1) annually valuing less liquid assets such as privately held businesses and art; 2) tracking wealth over time; and 3) limiting tax avoidance as billionaires shift their portfolios to minimize wealth taxes. Such taxes would dramatically reduce economic investment, which is vital for economic growth and rising wages. Annual tax bills in the tens of millions of dollars would create liquidity challenges for families whose wealth is tied up in their private business or other illiquid assets.[89] Finally—and perhaps most important—a wealth tax would first require a constitutional amendment, as the Supreme Court would likely rule it unconstitutional as a direct tax that is not apportioned among the states in proportion to their population (and not meeting the Sixteenth Amendment exception for income taxes).[90]
Even Europe has largely given up on wealth taxes, where the number of nations with a broad wealth tax resembling American proposals has fallen from 12 to three since 1990 (Colombia has one as well, if examining OECD nations).[91] Wealth taxes were repealed even by left-wing governments because they proved to be expensive to administer, reduced and distorted pro-growth investments, created family liquidity issues, induced wealthy families (and their cash) to move abroad, and—perhaps most important—raised very little revenue. And many of those headaches occurred even at wealth-tax rates approaching 1%.
National Public Radio reported in 2019: “The experiment with the wealth tax in Europe was a failure in many countries. France’s wealth tax contributed to the exodus of an estimated 42,000 millionaires between 2000 and 2012, among other problems. Only last year, French president Emmanuel Macron killed it.”[92]
Verdict: Infeasible. The economic, administrative, and constitutional challenges of a wealth tax are considered insurmountable by economists and legal experts across the political spectrum. This is especially true at tax rates approaching 8% interacting with steep capital-gains and estate taxes. More feasible options include higher investment-tax rates, taxing capital gains at death, and even (the unlikely) mark-to-market taxation.
Total Tax Revenues
The sections above cover the tax categories with the potential to produce significant revenues from corporations and upper-income families. Other categories such as traditional excise taxes (gas, airline, tobacco, and alcohol), financial-transaction taxes, customs duties, and unemployment-insurance trust-fund taxes could not raise enough revenue from the wealthiest taxpayers to merit further analysis in this exercise. Instead, the subtotals are:
- Individual income taxes—1.0% of GDP
- Capital-gains taxes—0.2% of GDP
- Corporate taxes—0.8% of GDP
- Estate taxes—0.1% of GDP
These subtotals sum to a maximum of 2.1% of GDP—nearly $7 trillion over a decade. However, the actual tax revenues produced—particularly if these policies are combined—would likely be well below this total. As discussed above, economic damage builds as tax rates approach their revenue-maximizing level (otherwise the revenue-maximizing tax rates would be 100%). And these economic effects often accelerate when policymakers layer various higher tax rates on top of one another. The revenue estimates detailed above incorporate some basic behavioral responses to higher tax rates but exclude most of the macroeconomic effects of steeply raising taxes.
Economic conservatives have long been guilty of exaggerating the economic drawbacks of modest tax-rate increases. Yet that does not mean that a historic $7 trillion tax increase would represent easy “free money” for the government. Large income taxes reduce incentives to work and be productive. Exorbitant investment taxes deprive the economy of investments in new technologies and business expansions. Significant corporate taxes are not paid out of the CEO’s salary—but rather from higher prices, lower wages, reduced stock values, and depressed investment levels and innovation. A more complicated and invasive tax code also adds significant compliance costs for families and businesses. All these costs affect the entire economy, not just those directly paying the tax.
After all, more left-wing countries like Germany, Sweden, Greece, and Canada did not slash corporate-tax rates out of some cartoonish love for big business; they did so because higher tax rates were strangling their competitiveness and harming workers.[93]
The point is not that tax rates should never rise. Top spending priorities must be financed. However, the broader economic implications of each tax must be weighed and traded off with federal spending goals. Reducing the economy’s annual economic growth rate by 1% of GDP would decrease tax revenues by $3.3 trillion over the decade (and, on the flip side, accelerating economic growth would add that amount of revenues).[94]
UC Berkeley economists David Romer and Christina Romer (also a former top Obama White House economist) have calculated that “an exogenous tax increase of 1% of GDP lowers real GDP by almost 3%,” particularly when the new tax revenues are not going toward deficit reduction.[95] This calculation suggests that the 2% of GDP in tax increases detailed above could reduce economic output by an amount approaching 6% of GDP—which would, in turn, eliminate half the new tax revenues.[96] Conservative economists such as Martin Feldstein of Harvard University also found notable economic losses from steep tax hikes.[97]
A comprehensive tax proposal to move businesses and upper-income families toward revenue-maximizing tax rates across multiple tax categories could—using standard estimates of macroeconomic feedback effects—surrender anywhere from 10% to 50% of all static revenue gains. That would limit the total revenue gained to 1%–2% of GDP.
Total Revenues: Between 1% and 2% of GDP, depending on the macroeconomic response of combining several substantial tax increases. Using the midpoint of that range, raising taxes on the wealthy by 1.5% of GDP ($5 trillion over the decade) and redistributing those funds equally to every American would provide just $1,500 per person annually—certainly helpful, but not a cure-all worth disregarding all other considerations.
Answering the “What Abouts…?”
Advocates of dramatic tax-the-rich policies often answer critics by invoking: 1) Bernie Sanders’s tax agenda; 2) European tax systems; and 3) the 1950s income-tax brackets exceeding 90%, as proof that tax rates can be raised substantially on corporations and wealthy families without serious economic drawbacks. Often framed as “what about…” questions, each of these counterarguments collapses under closer examination.
What About Bernie Sanders’s Proposals?
Progressives often reference Senator Bernie Sanders’s tax agenda as proof that taxing the wealthy can both close the deficit and finance much of a European-style social democracy. Indeed, polls show that a strong majority of Sanders’s own supporters oppose raising their own taxes by even $1,000 to finance the vast socialist spending agenda.[98] Yet Sanders himself acknowledges that taxes must rise across the board to finance his agenda. More important, a review of his tax proposals does not reveal a heretofore undiscovered bounty of tax-the-rich revenues.
Sanders’s 2020 presidential-campaign tax agenda provides the most comprehensive tax-the-rich agenda released by a progressive lawmaker. It pushes—and often exceeds—the realistic boundaries of tax-the-rich policies.[99]
For example, Sanders would increase the top capital-gains rate to 62%[100]—or more than 70%, when including state taxes in such places as California and New York—which is more than triple the OECD average and far higher than what is considered plausible by even progressive economists. Such a tax rate would surely lose revenue relative to current tax rates.
In fact, combining Sanders’s proposed 8% wealth tax with his 70% federal and state capital-gains tax would produce effective tax rates on investment well in excess of 100%. Then, an estate tax as high as 77% would catch any remaining assets. These tax rates would ultimately encourage billionaires to spend down their savings on frivolous items rather than invest in their business, the economy, or the next generation.
Sanders would create a new 52% income-tax bracket on incomes over $10 million and apply the 12.4% Social Security tax (which currently ends around $160,000 in wages) to wages exceeding $250,000. Because the $250,000 threshold would not be annually adjusted for inflation, the annually rising $160,000 threshold would eventually close this doughnut hole. These federal income and payroll taxes, along with state income-tax rates, would produce combined marginal tax rates approaching 80% in some states—surely exceeding the revenue-maximizing level. Sanders would also impose a steep tax on financial transactions and eliminate the 20% deduction for pass-through businesses.
On the corporate-tax side, Sanders would hike the corporate-tax rate from 21% to 35%—or nearly 40%, including state taxes—to the highest level among major economies. Moreover, he would essentially apply a minimum 35% tax rate on the income that American multinational companies earn in other countries. This means that an American corporate subsidiary in England would be taxed at a 35% rate even while it competes against local British companies paying a 25% tax rate, a French subsidiary paying a 26% tax rate, and a Norwegian subsidiary paying a 22% tax rate.[101] In addition to dramatic tax increases on American multinational companies, Sanders would substantially raise business taxes on capital investments, limit their deductions of interest expenses, and end fossil-fuel tax preferences.
According to TPC, these tax hikes would exceed $500,000 per year on the typical family in the top 1%.[102] Overall, these tax-the-rich policies would raise 4% of GDP in tax revenues in a scenario that does not account for the economic effects or the full behavioral responses of imposing tax rates well beyond revenue-maximizing levels. Consider:
- The 8% wealth tax (0.83% of GDP) is widely considered unworkable and likely to be ruled unconstitutional.
- Economists broadly agree that investment-tax rates exceeding 60% and even 70% (0.22% of GDP, before incorporating economic losses) would surely reduce tax revenues.
- Marginal income- and payroll-tax rates approaching 80% (0.56% of GDP before economic adjustments) also exceed the revenue-maximizing levels.
- A 77% estate-tax rate (0.14% of GDP) would bring significant tax avoidance that limits revenues.
- More than doubling corporate taxes (1.9% of GDP before economic adjustments) and forcing American companies to pay nearly double the tax rates of their competitors in other nations is virtually guaranteed to restrain America’s global competitiveness and reduce economic activity.
Moreover, the cumulative effect of layering these taxes on top of one another—producing combined income-tax rates approaching 80% and investment-tax rates exceeding 100%—would produce additional economic losses that exceed the individual effect of each tax policy. Applying the broader economic consensus of revenue-maximizing tax rates and economic feedback effects (as well as the constitutionality of wealth taxes) suggests that the Sanders tax-the-rich proposals would raise, at most, 2% of GDP in tax revenues. And there is considerable downside risk because extraordinary new taxes on investment—across the corporate, capital-gains, estate, and income taxes—could drive the economy into a recession and produce long-term economic stagnation. Not even Europe’s most progressive social democracies are considering anything close to Sanders’s policies.
For a reality check, Lily Batchelder and David Kamin—who have served in top economic policy roles in the Obama and Biden White Houses and Treasury Departments—released a study in 2019 mapping out a bold, progressive, tax-the-rich agenda. Their table of standard tax-the-rich measures totaled 1.6% of GDP, while the report added that a wealth tax or an accrual tax (similar to mark-to-market taxation of investments) could add significant revenues if the administrative and constitutional challenges could be overcome.[103] Batchelder and Kamin’s results are well within the range of this report, even as they seem more optimistic about wealth and mark-to-market taxes.
Sanders’s agenda is not limited to taxes on corporations and wealthy families. The campaign also proposed to partially finance Medicare-for-All through 4.6% of GDP in new tax revenues from broad-based payroll taxes and tax-preference eliminations (within health care). However, even if one uses the inflated revenue figure of 8.6% of GDP (4.0% from the wealthy and 4.6% from broad-based taxes), it still falls far short of financing Sanders’s spending promises. Sanders proposed $23 trillion in new taxes over the 2021–30 period, yet also proposed a $30 trillion Medicare-for-All plan, $30 trillion government job guarantee, $16 trillion climate initiative, and $11 trillion for free public college tuition, full student-loan forgiveness, Social Security expansion, housing, infrastructure, paid family leave, and K–12 education. That is $87 trillion in spending promises, on top of a baseline budget deficit that, at the time, was forecast at $13 trillion over the decade.[104] Even the rosiest revenue estimates of Sanders’s tax policies would cover only a small fraction of his spending promises (see Figure 9).
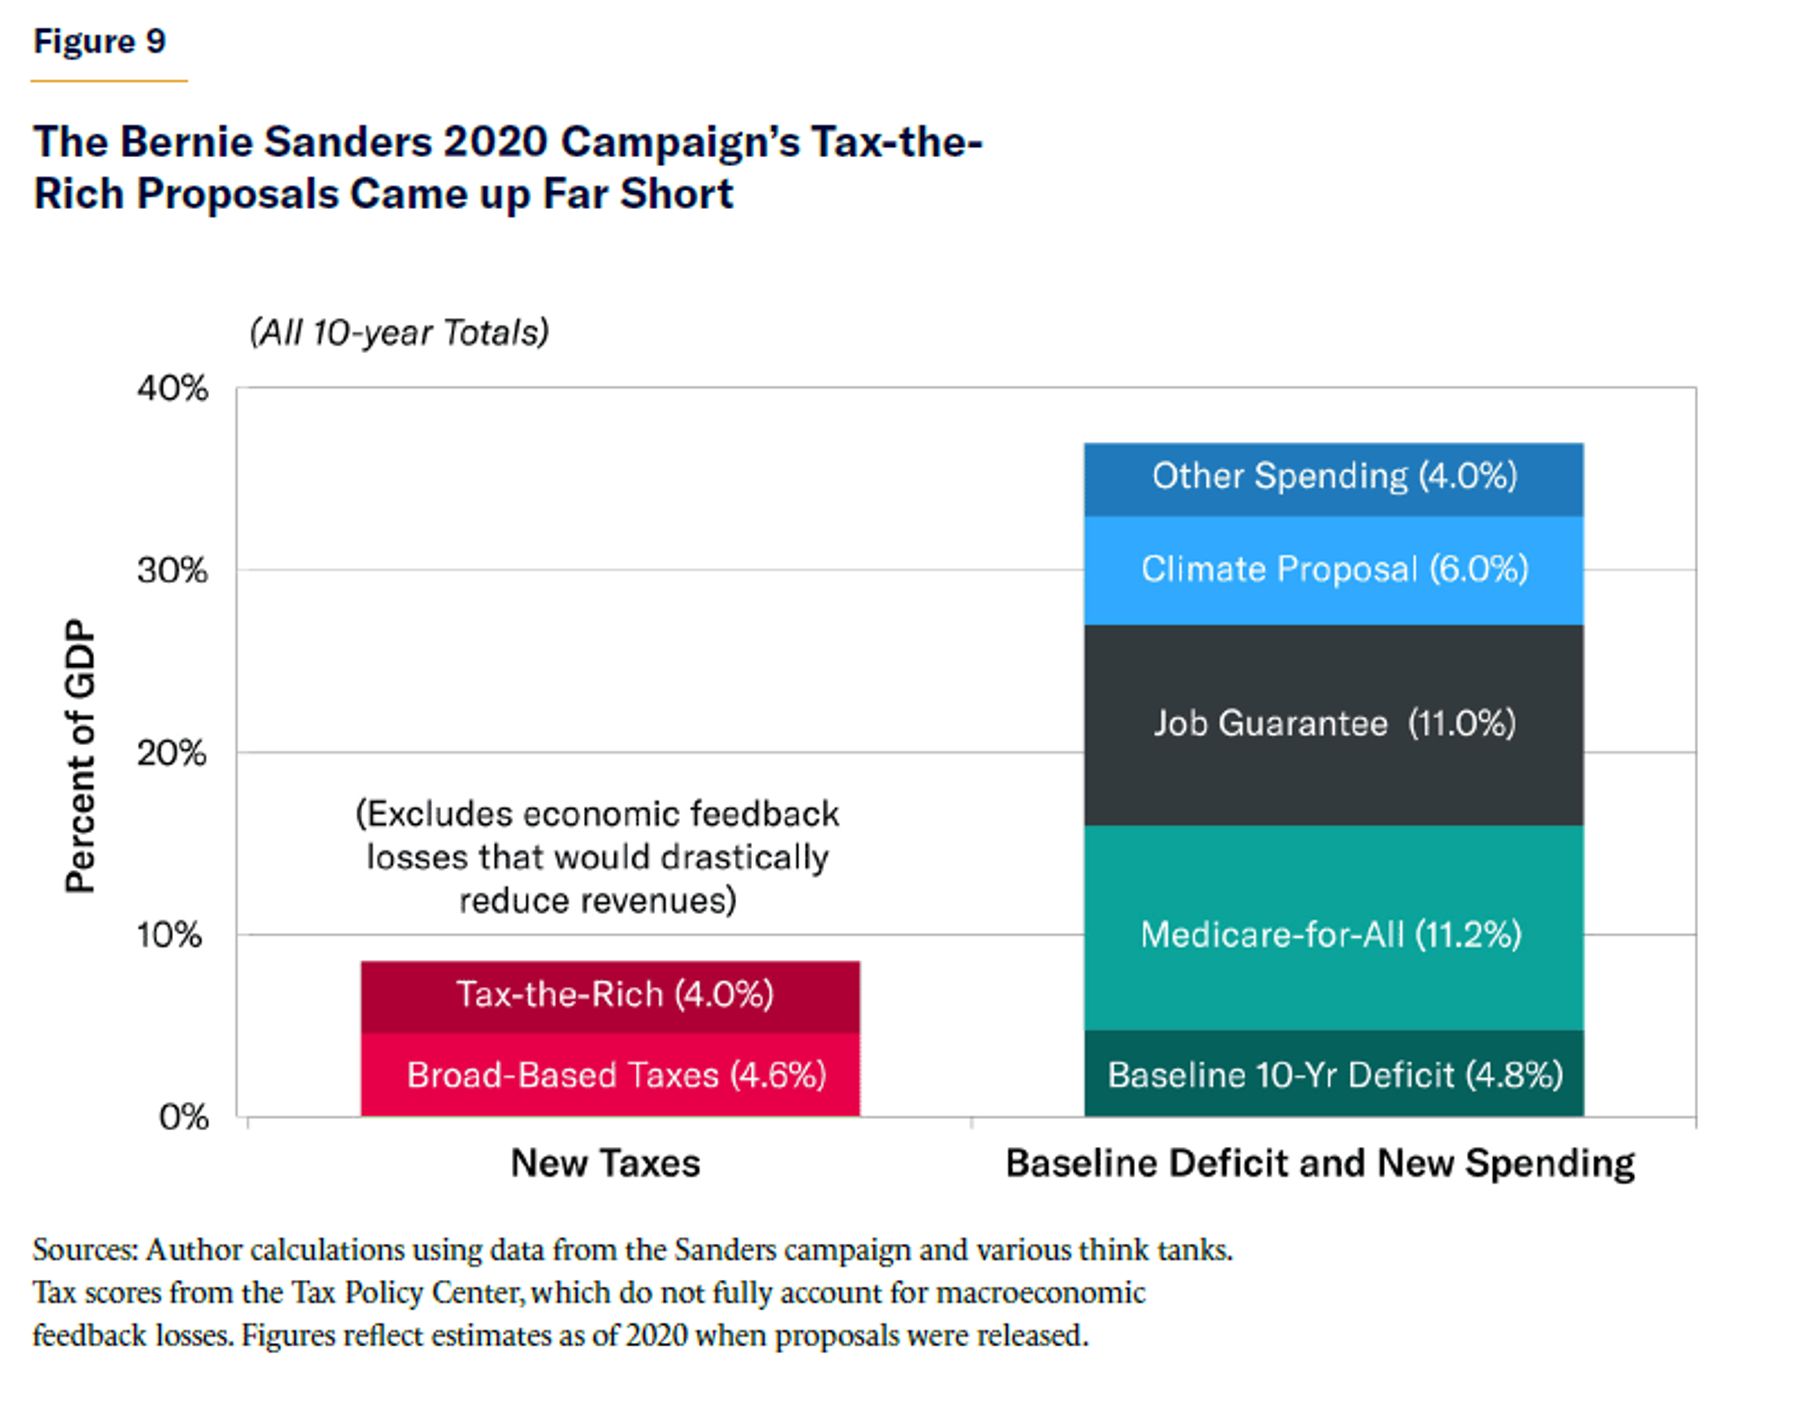
At the same time, Sanders has obfuscated the funding shortfall by: 1) regularly claiming that his tax policies can cover all his spending promises, even as official scores show otherwise; and 2) proposing most spending increases separately, in order to make each one appear individually affordable within his broader tax agenda.
Summary: Some progressives suggest that Bernie Sanders has identified extraordinary potential revenues from taxing the rich. However, his proposed tax increases on corporations and wealthy individuals show revenues of 4% of GDP—and that is before accounting for constitutional challenges and unrealistic tax rates that far exceed the consensus of revenue-maximizing rates. Given behavioral and economic responses, the total potential tax revenues are (at most) 2% of GDP, and possibly far less. Indeed, leading progressive tax officials assume plausible tax rates and revenues far below those of Sanders’s proposals. Even assuming Sanders’s full static revenue estimate and including his steep middle-class tax proposals would not come close to paying for his spending agenda. The contention that Sanders has unlocked an enormous tax-the-rich revenue source is false.
What About Europe?
American progressives often hold up Europe—and especially the Scandinavian social democracies of Denmark, Finland, Norway, and Sweden—as successful tax-the-rich utopias that the U.S. should replicate. In reality, European tax systems do not fit the American progressive stereotype, as their higher revenues are overwhelmingly raised through steep income, payroll, and consumption taxes on the middle class.
Yes, Finland, Norway, and Sweden collect an average of 42.6% of GDP in taxes, versus 26.6% from America’s federal, state, and local governments.[105] However, 14.5 percentage points of this 16-percentage-point overage comes from higher payroll taxes and VAT, which broadly hit the middle class. These nations’ individual income-tax revenues exceed those of the U.S. by just 0.8% of GDP, while their 3.5% of GDP advantage in corporate-tax revenues is overwhelmingly driven by Norway’s steep corporate-tax revenues from its massive oil and gas industry (by contrast, Finland and Sweden exceed the U.S. by 1% of GDP). These nations’ remaining taxes combine to collect nearly 3% of GDP less than those of America (see Figure 10).[106]
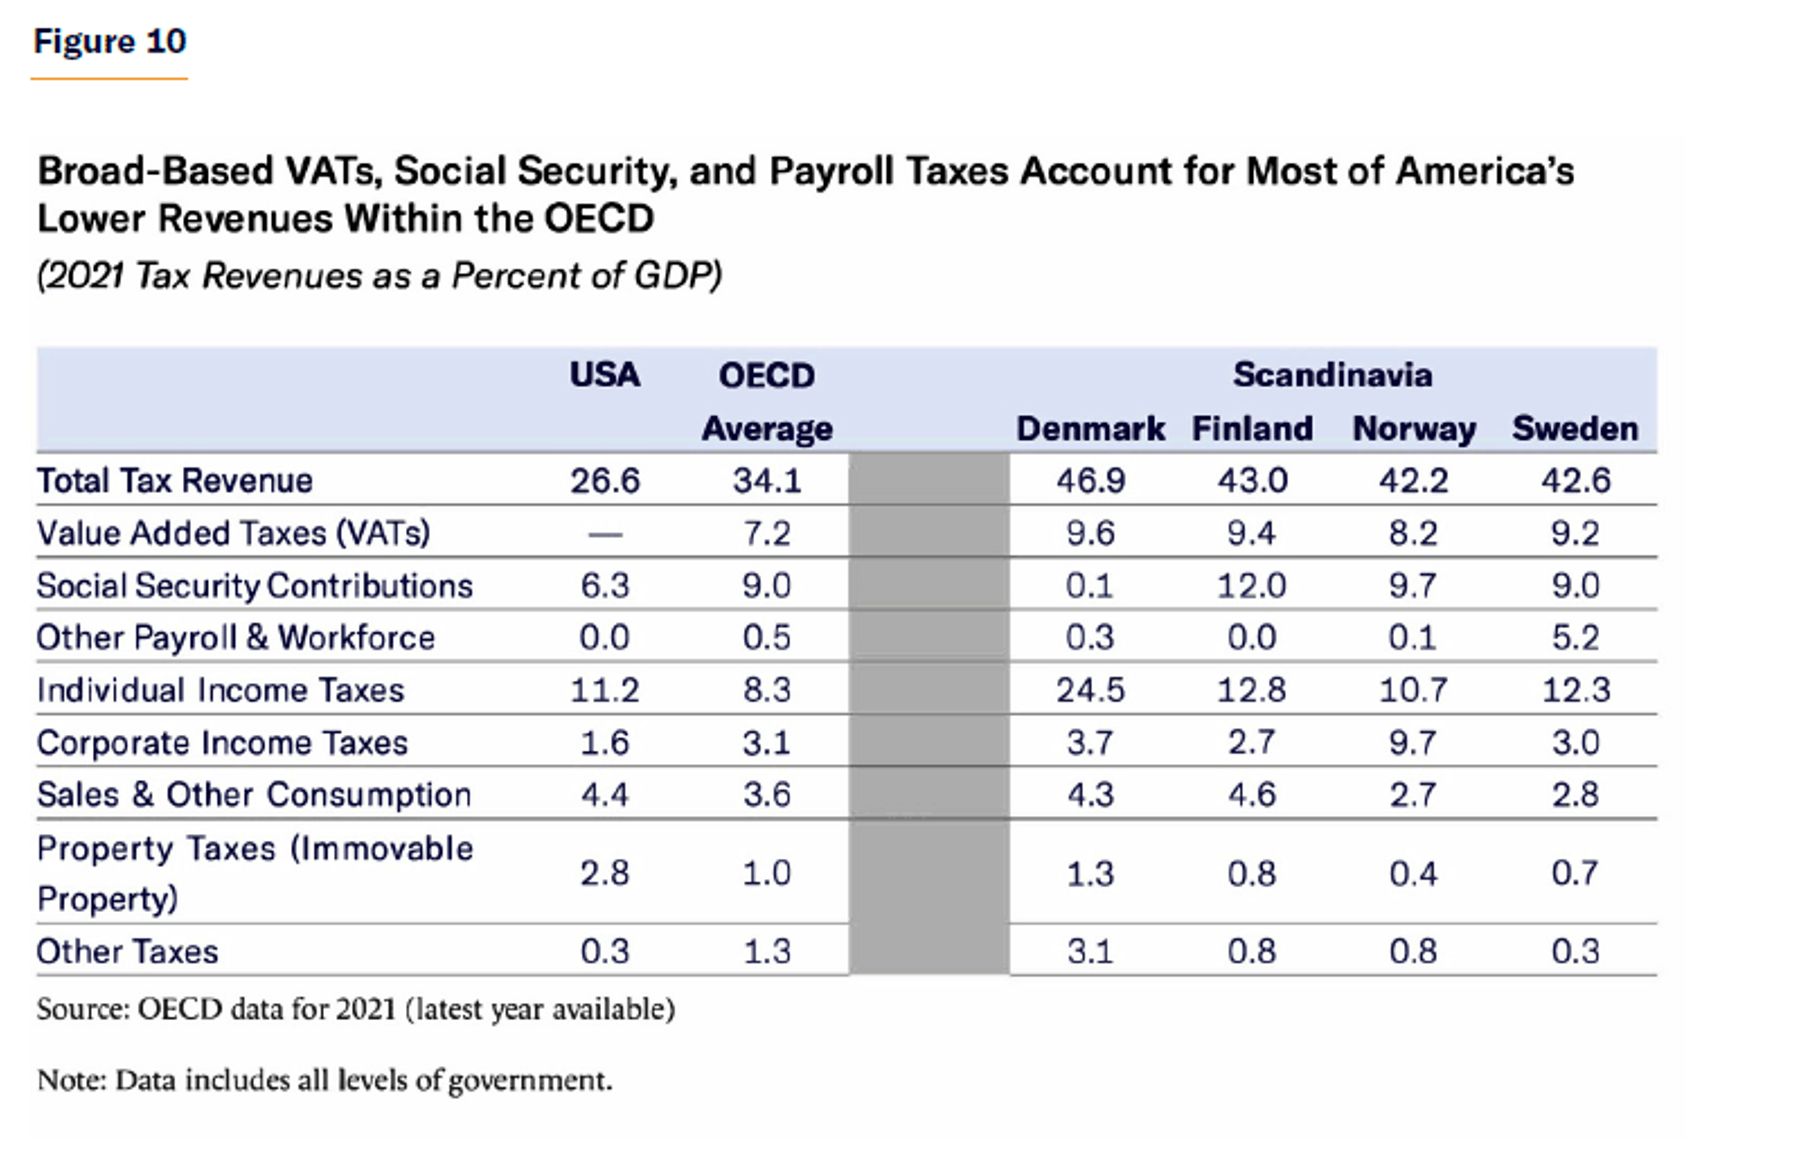
A similar dynamic holds when comparing the U.S. with the other 38 OECD nations, which collect an average of 34.1% of GDP in tax revenues, compared with America’s 26.6%. Yet VAT revenues—which average 7.2% of GDP in OECD versus none in America—account for nearly the entire difference.[107]
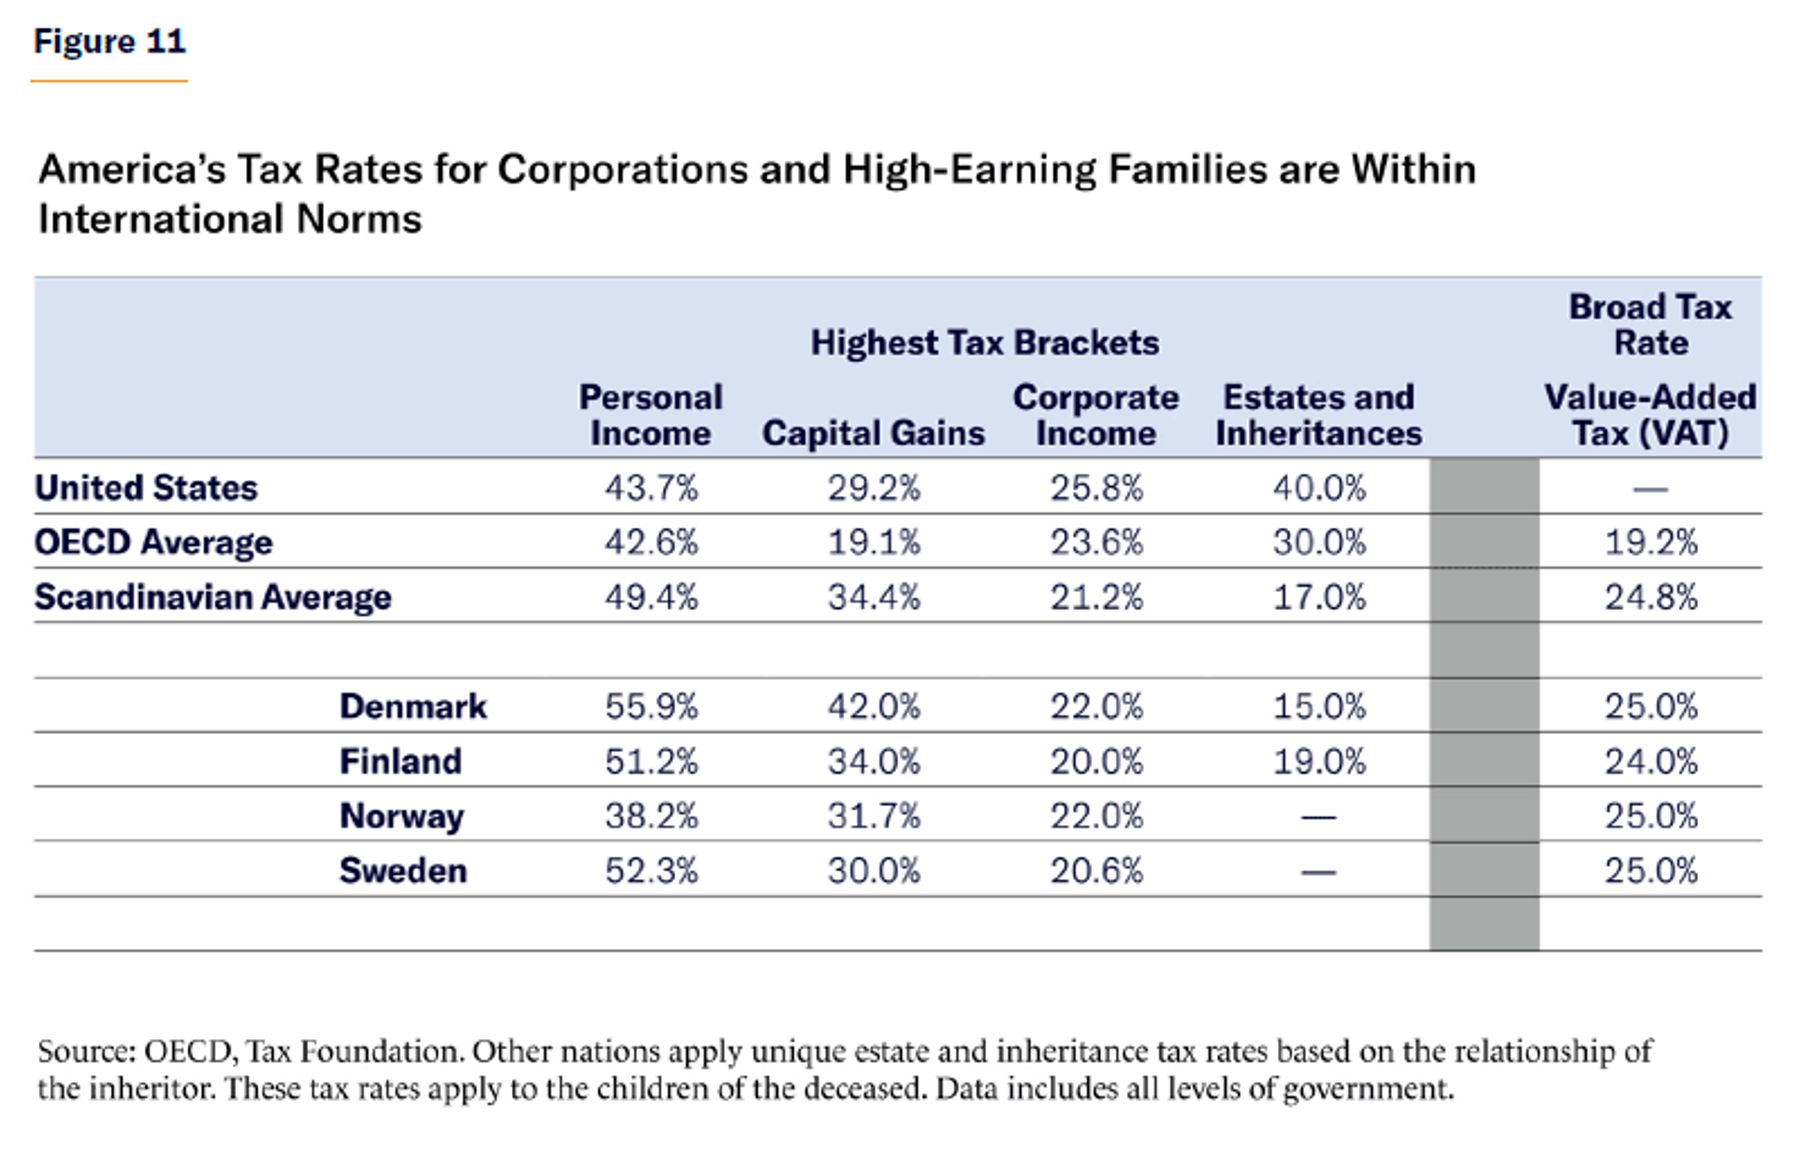
Specifically, the section below shows that VATs, payroll taxes, and middle-class income-tax rates are much higher across Europe and other developed nations than in the United States. Yet America’s current upper-income, corporate, capital-gains, and estate-tax rates (as well as its lack of a wealth tax) mostly align with international norms—and progressive proposals would far surpass even Scandinavian tax rates (see Figure 11).
Value-Added Taxes. A total of 37 of the 38 OECD nations—all except the U.S.—impose VATs at rates ranging from 5% (Canada) to 27% (Hungary).[108] The average VAT rate is 19.2%, and OECD nations collect an average of 7.2% of GDP in VAT revenues.[109] The Scandinavian nations of Denmark, Finland, Norway, and Sweden each have rates of about 24%–25% that collect an average of 9.1% of GDP, or roughly one-fifth to one-quarter of their total tax revenues. VATs (and, to a lesser extent, payroll taxes)—which are not particularly progressive—drive the vast majority of Europe’s tax-revenue advantage over the United States. Mimicking Scandinavia’s 9.1% of GDP in VAT revenues would require American taxes of $2.4 trillion per year, or nearly $18,000 per household.[110]
Broadening out to all consumption taxes (including American-style sales and excise taxes) shows revenues of 4.4% of GDP in the U.S. versus an OECD average of 10.8% of GDP, including 11%–14% in Scandinavian nations.[111] If America wants to tax like Europe, it will need to impose substantial broad-based consumption taxes.
Payroll Taxes. The U.S. collects 6.4% of GDP in Social Security and payroll taxes—compared with 9.5% of GDP across the OECD, and a 12.0% average across Norway, Sweden, and Finland. (Denmark has no traditional payroll tax, instead relying on higher income-tax rates.)[112] While different tax structures make cross-country comparisons challenging, Sweden assesses a payroll-tax rate of 31.4%, and Norway’s rate is about 20% for most employees.[113] The combination of high income-tax and payroll-tax rates produces significantly higher taxes on salaries and wages in Europe than in America, particularly at middle incomes.
Income Taxes. The U.S. collects 11.2% of GDP from income taxes at all levels of government, which exceeds the OECD average of 8.3%. U.S. income-tax revenues slightly trail those of Finland (12.8% of GDP) and Sweden (12.3%) and slightly exceed those of Norway (10.7%), Germany (10.5%), and France (9.5%).[114] America’s figures are pushed upward by the 1.3% of GDP in income-tax revenues paid by pass-through businesses (which, in turn, pushes down America’s corporate-tax revenues).[115]
However, other nations rely much more on middle-class income taxes. America’s top income-tax rate of 43.7% (in the typical state) exceeds that of Norway (38.2%) and modestly trails those of Sweden, Denmark, and Finland, which have top tax rates of 51%–56%. Yet Nordic income taxes are much less progressive, as those top income-tax brackets begin at about 160% of the average wage (or the American equivalent of $96,000).[116] By contrast, America’s effective federal income-tax rates are just 2% for the middle-earning quintile and 6% for the second-earning quintile, and the top federal tax bracket does not apply until incomes reach $578,125 (single) or $693,750 (married).[117] America’s substantially lower income-tax rates for the middle and upper middle class drive its slightly lower income-tax revenues relative to Sweden and Finland—and still exceed those of Norway.
Capital-Gains Taxes. America’s 29.2% capital-gains tax rate (including typical state taxes) far exceeds the OECD average rate of 19.1%. The U.S. rate exceeds that of Canada and Germany and is slightly below the rates of Sweden (30%), Norway (31.68%), and Finland (34%). Denmark’s 42% capital-gains tax rate tops the OECD.[118] Nevertheless, progressive proposals to tax capital gains at the same rate as ordinary income would push America’s top rate to 46.2% (or higher, if income-tax rates also rise)—leading all nations and more than doubling the OECD average rate. The U.S. currently tops nearly all OECD nations in capital-gains tax revenues as well.[119]
Chris Edwards of the Cato Institute notes that—when using both corporate and capital-gains taxes to examine the total rate on corporate equity—America’s 46% tax rate exceeds the OECD average by 10 percentage points.[120]
Corporate Taxes. When including state taxes, America’s 25.8% statutory corporate-tax rate is tied for the 13th-highest among 38 OECD nations—and exceeds all four Nordic nations, which range from 20% to 22%.[121] Returning to the pre-2017 corporate-tax rate of 39% (including state taxes) would top all other OECD nations, and even President Biden’s proposed hike of 7 percentage points would leave America trailing only Colombia. The OECD average corporate-tax rate is 23.6%—or 25.8%, if weighted by GDP.[122] Additionally, America’s composite effective average tax rate of 22.3% exceeds that of the OECD average and all Scandinavian nations.[123]
Despite average tax rates, America’s current 1.8% of GDP in corporate-tax revenues slightly trails the 2%–3% of GDP collected by Germany, France, Finland, Sweden, and the United Kingdom.[124] However, the U.S. figure rises to 3.0% of GDP when including the taxes paid by pass-through businesses, which are processed through the individual income-tax code.[125]
The long-term global trend has been for nations to reduce corporate-tax rates in order to attract investment, enhance competitiveness, and raise wages. As stated earlier, the Tax Foundation notes that, since the 1980s, the average worldwide corporate-tax rate has fallen from 40.1% to 23.4% (or from 46.5% to 25.4%, when weighted by GDP).[126] Within OECD, the average corporate-tax rate since 1980 has fallen by half, from 47% to 23.6%—yet corporate-tax revenues have increased by 0.5% of GDP among the same group of nations.[127] Extending the period to between 1965 and 2019 shows OECD corporate-tax revenues jumping from an average of 2.1% to 3.0% of GDP, despite (or perhaps driven by) substantial reductions in corporate-income-tax rates.[128] All in all, America’s corporate-tax rates and broad business-tax revenues (including pass-through businesses paying the individual income tax) are comfortably within the European and OECD consensus.
Estate Taxes. Just 24 OECD countries impose an estate or inheritance tax. Such taxes have been abolished by Australia, Austria, Canada, Czech Republic, Israel, Mexico, New Zealand, Norway, Slovak Republic, and Sweden, while Estonia and Latvia never levied them in the first place.[129] America’s 40% estate-tax rate ranks as OECD’s fifth-highest in most inheritor categories. For estates inherited by the children of the deceased, Japan’s 55% estate-tax rate is OECD’s highest (yet still well below Sanders’s 77% proposal).[130] America’s estate-, inheritance-, and gift-tax revenues slightly exceed the OECD average.[131]
Wealth Taxes. As described earlier, Europe has largely abandoned wealth taxes because of their administrative challenges, economic damage, and disappointing tax revenues.[132] While 12 European nations had wealth taxes in 1990, only Norway, Spain, and Switzerland still broadly tax high-wealth families with parameters comparable with American wealth-tax proposals, while four others impose narrow wealth taxes on selected assets.[133] The Tax Foundation notes that, among OECD nations with broad or limited wealth taxes, “revenues made up just 1.5% of total revenues on average in 2020.”[134] Thus, America’s lack of a wealth tax is no outlier.
Summary: There are legitimate arguments to support significantly raising tax rates on corporations and wealthy Americans. Yet claims that progressive tax proposals would simply adopt the tax-the-rich policies of Europe (and, in particular, Scandinavia) are false and based on a caricature of Europe’s middle class–heavy tax systems.
What About Those 1950s Tax Rates?
Progressives—and even many non-progressives—regularly assert that mid-twentieth-century income-tax rates that exceeded 90% showed how such tax rates can raise substantial revenues without damaging the broader economy. As with the European example, a closer examination reveals this narrative to be false.
The highest marginal income-tax bracket was temporarily raised to 77% during World War I, before falling to 25% in the 1920s. After an elevation to 63% in 1932 and then 79% in 1936 (for taxable incomes over $110 million in today’s dollars), the top bracket was pushed up to 94% to fight World War II, before settling at 91% for most of the 1950s and early 1960s. Beginning in 1964, the top bracket was gradually reduced to 70%, where it remained until President Reagan persuaded Congress to slash it to 50% and then 28%. Since then, the top federal tax rate has fluctuated between 28% and 39.6%.[135]
While the highest marginal tax rate has steeply fallen over the past 80 years, federal income-tax revenues have risen as a share of the economy. Referring back to Figure 6, the 1950s era of 91% tax rates produced only 7.2% of GDP in income-tax revenues. As rates fell in the 1960s and 1970s, income-tax revenues rose to 7.6% and then 7.9% of GDP. Since the top tax rate was drastically reduced beginning in 1981, federal income-tax revenues have averaged 8.1% of GDP.[136]
Simply put, Washington collects more income-tax revenues (as a share of GDP) today with a top bracket of 37% than it collected in the 1950s with 91% tax brackets. In fact, since 1950, the correlation between the highest income-tax bracket and federal income-tax revenues as a share of the economy is –0.25%, meaning that higher top tax rates are correlated with lower income-tax revenues.[137]
Focusing too much on raising the highest marginal tax rate ignores other factors that heavily influence tax revenues. This includes the income thresholds for every tax bracket, tax preferences that shield families from higher tax rates, incentives for tax avoidance (such as reclassifying income as capital gains or corporate income), tax evasion, and—most important—broader economic growth rates. Those seeking to significantly raise tax revenues from the wealthy might wish to consider tax reforms to those factors, as well as account for how they might offset the revenues from marginal tax-rate increases.
Tax data compiled by leading progressive economist Gabriel Zucman reveal that the average income-tax rate (including state taxes) of the highest-earning 1% of taxpayers was actually lower in the 1950s (14.1%) than in the 2010s (19.6%).[138] CBO data show that—even as the highest federal income-tax bracket fell from 70% to 37% between 1980 and 2019—the average income-tax rate paid by the top 1% remained at 23%.[139] IRS data show that only 1% of tax returns in 1958 were in federal income-tax brackets above 35%,[140] and since 1962, the share of tax returns in a tax bracket above 28% has gone down only slightly, from 4% to 3%. In short, the highest tax brackets reveal little about tax revenues and the actual tax rates paid by families.
A Case Study of 91% Tax Rates. A review of IRS records from 1961 shows that the highest tax brackets raised virtually no significant revenues.[141] That year, the famous 91% income-tax bracket applied to taxable incomes above $400,000 for a married couple—the equivalent of $4.1 million in today’s dollars. Yet just 446 tax returns—or one in every 137,891 returns filed—paid income taxes in the 91% bracket. The $61 million in total tax revenue collected from this tax bracket (the current equivalent of $3 billion in today’s GDP) constituted just 0.1% of all income-tax revenues, or 0.01% of GDP.
Next, let’s broaden the analysis to all tax brackets over 50%. Back then, the income-tax code included 42 marginal tax brackets—25 of which exceeded 50% on the way to 91%. Yet these 25 tax brackets combined to include just one in every 292 tax returns and accounted for just 6.1% of all income-tax revenues, or 0.48% of GDP.[142] That is the current equivalent of $125 billion per year.
However, counting all income-tax revenue collected from those marginal tax brackets exaggerates their effect because much of that revenue would have also been collected had the marginal tax rates been capped at 50% rather than rising toward 91%. In 1961, $4.0 billion in taxable income was reported in tax brackets between 52% and 91%. An income-tax code with a maximum tax rate of 50% would have collected $2.0 billion from this income. Instead, Washington collected $2.6 billion—or an extra $600 million from these higher tax rates. That comes to just 0.11% of GDP, or the current equivalent of $29 billion in today’s GDP.[143]
In short, all the additional revenue from those old 52% to 91% tax brackets would—adjusted into today’s economy—finance the current federal government for a day and a half.
Had income-tax rates been capped at 50% in 1961, federal income-tax revenues would have totaled 7.45% of GDP rather than 7.56% (see Figure 12). The revenue from the higher brackets was barely a rounding error.
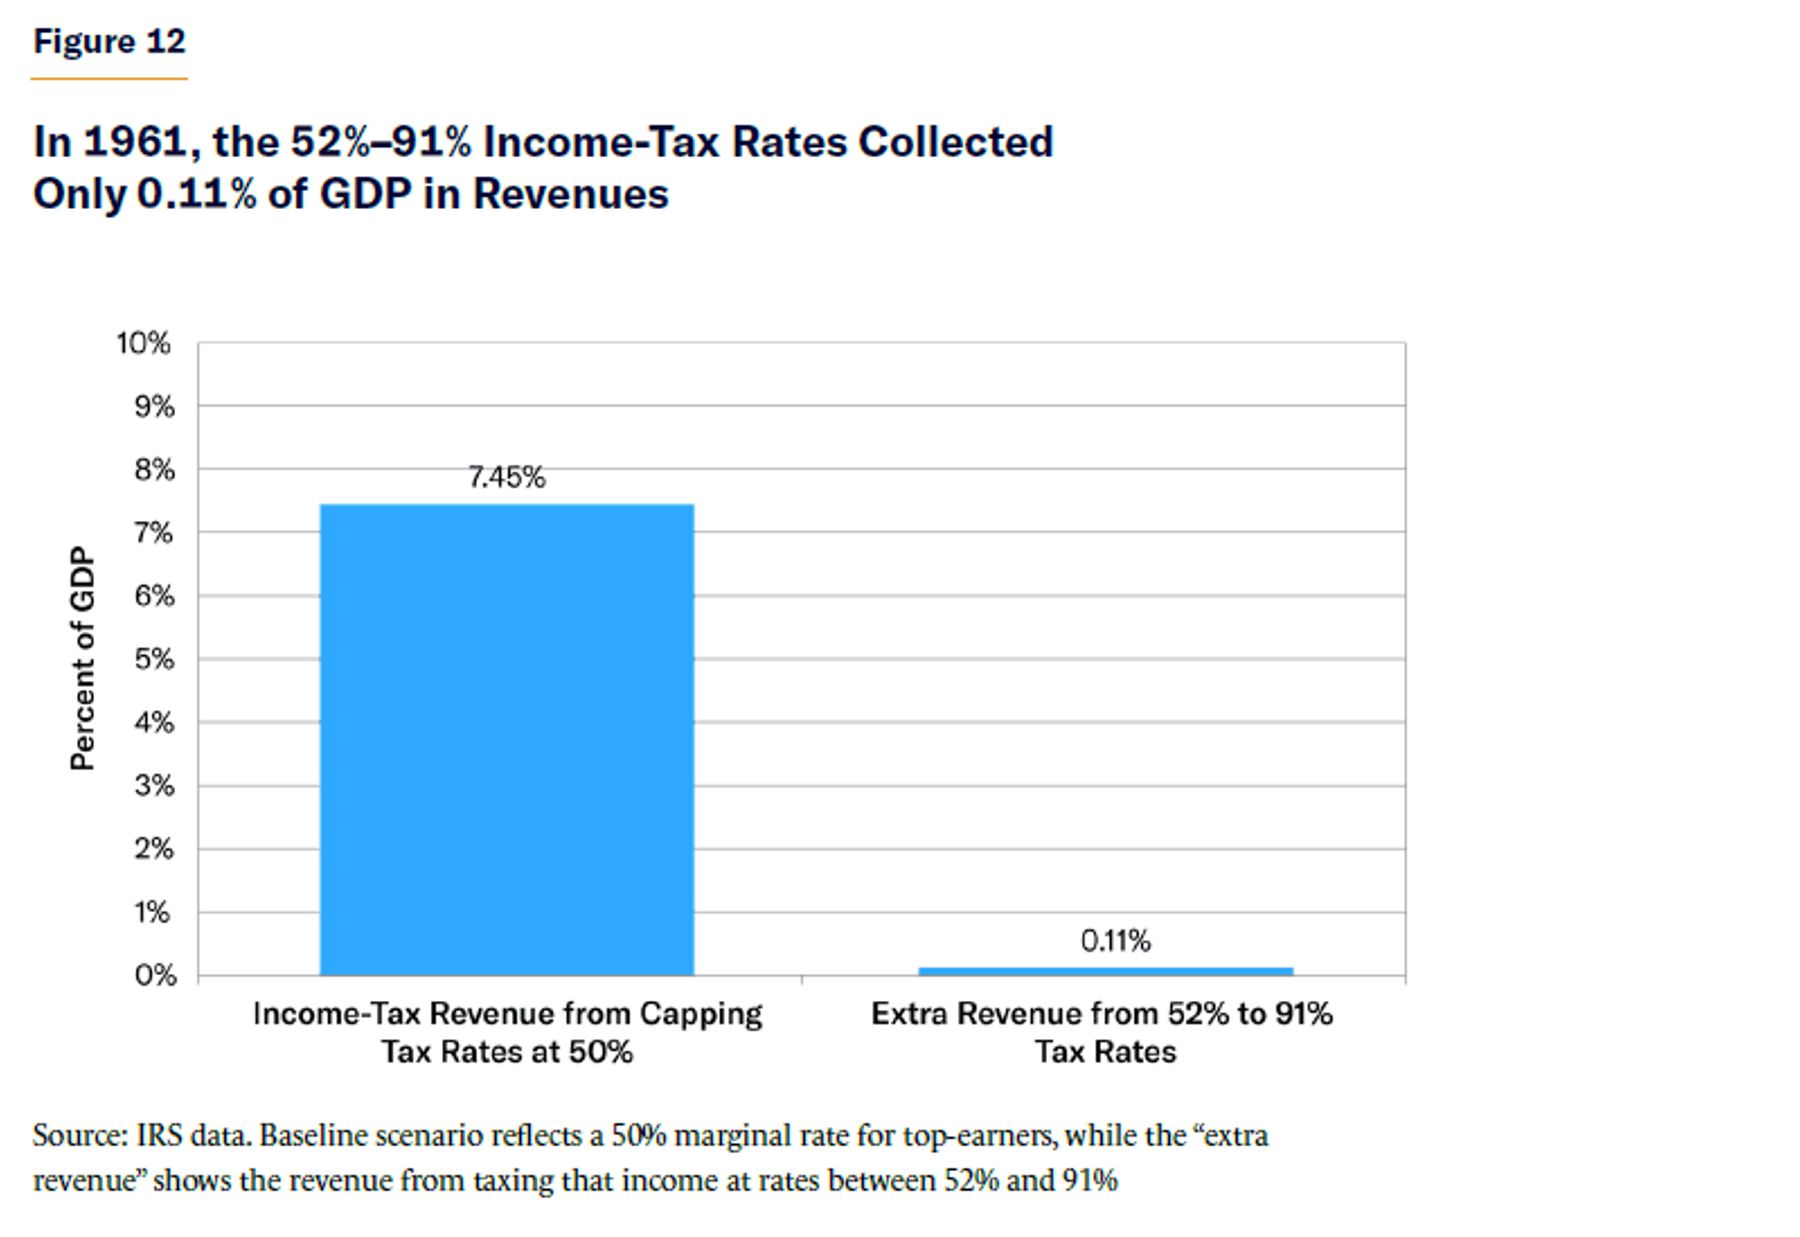
That’s not all. Virtually all economists agree that tax rates at these levels reduce incentives to work, save, and invest (even if they disagree on the size of these economic losses). If several decades of excessive tax rates slowed long-term economic activity enough to shave even 0.5 percentage points off the total GDP, that would mean that these tax rates actually lost revenue, compared with having that extra economic activity to tax.[144]
Summary: During the 1950s and early 1960s, when marginal tax rates went into the 90s—and even through the 1970s era of 70% income-tax rates—Washington collected less income-tax revenue (as a share of the economy) than in the post-1980 period of lower top tax rates. In 1961, the total income taxes from all tax brackets above 50% collected just 0.48% of GDP—or 0.11% GDP more than would have been collected from capping tax rates at 50%. And even a minuscule reduction in economic activity from such inflated tax rates would mean that they actually reduced tax revenues.
Since 1979, effective tax rates on the richest 1% have remained steady, even as the top marginal tax rate fell nearly in half, because factors such as tax preferences and tax income thresholds also affect taxes paid. Perhaps today’s policymakers can better design tax increases that minimize the pitfalls of the older policies (even as tax planning grows more sophisticated and income becomes more mobile). However, the claim that the 1950s and 1960s prove that 90% tax brackets can raise significant tax revenues with minimal economic damage is simply false.
Conclusion: Seeking Revenues Without Sacrificing Economic Growth
Long-term tax rates will surely face increasing upward pressure from federal budget deficits projected to top 10% of GDP within the next three decades, as well as Washington’s voracious appetite for additional spending. Such tax increases can—and should—begin with the wealthy. However, an aggressive package of new taxes on corporations and the wealthiest 1% or 2% of households could raise, at most, 2% of GDP in revenues—and likely far less, depending on the economic consequences of layering multiple new taxes on top of one another. America’s tax code is more progressive than that of most of the developed world because Washington taxes corporations and upper-income families within the range of international-consensus rates—but taxes lower- and middle-income families at rates far below those of other nations. Most of America’s income is earned by the non-wealthy, and, like Scandinavia and most of Europe, the U.S. will need to tax those families considerably to meet any ambitious revenue needs. Taxing the rich cannot even cover baseline deficits, much less finance the progressive spending agenda.
The point is not to offer personal sympathy for Amazon, Microsoft, or the billionaire class. Rather, it is to acknowledge—as Europe eventually learned the hard way—that exorbitant tax rates on corporations and wealthy families are not an economic free lunch. The value of additional tax revenues must be balanced against the economic costs of reduced work, savings, investment, innovation, and job creation—all of which ultimately harm families at all income levels (not to mention scaling back the new tax revenues). In particular, taxes on business investment, capital gains, and wealth are often considered the most economically damaging taxes because they limit the investment that produces the innovations, business expansions, and jobs of tomorrow. Even the economists at OECD—not known for being free-market advocates of big business—acknowledge that “corporate income taxes are the most harmful for growth as they discourage the activities of firms that are most important for growth: investment in capital and productivity improvements.”[145]
Revenue can be raised from the wealthy in a less damaging way by (modestly) raising their individual income-tax rates, scaling back their individual tax preferences, and eliminating special-interest corporate-tax breaks.
For additional savings, progressive lawmakers should also consider paring back spending programs that benefit upper-income families. Specifically, nearly $1 trillion could be saved over the next decade by scaling back farm subsidies for large agribusinesses, as well as trimming Medicare subsidies and Social Security benefits for those retirees with (nonhousing) net worths in the millions.[146] Such policies would achieve progressive redistribution goals without the broader economic harm of steep tax-rate increases.
More broadly, America cannot redistribute its way to prosperity. Aggressively raising taxes on the wealthy by 1.5% of GDP ($5 trillion over the decade) and redistributing those funds equally to every American would provide just $1,500 per person annually. Certainly helpful, but no substitute for the rising incomes produced by strong economic growth.
Thus, revenue-seeking policymakers must prioritize economic growth, which is the real free lunch. A 1-percentage-point increase in the annual economic growth rate would save Washington $3.3 trillion over the decade. That is as much revenue as a 1% GDP tax increase but—unlike those tax hikes—also brings more jobs and higher incomes.[147] On the flip side, a tax package that reduces annual economic growth rates by 1 percentage point would, in turn, reduce tax revenues by $3.3 trillion over the decade—likely canceling all static tax-revenue gains while also costing jobs and reducing incomes.
In other words, tax-the-rich advocates cannot afford to ignore economic considerations. Raising every upper-income-tax rate to its revenue-maximizing level—the point at which the economic damage cancels out any additional revenues—is a recipe for economic stagnation, job losses, and declining incomes. Tax-raising lawmakers should tread carefully and ensure that they do not strangle the corporate and individual incomes whose taxes they wish to depend on.
About the Author
Brian Riedl is a senior fellow at the Manhattan Institute, focusing on budget, tax, and economic policy. Previously, he worked for six years as chief economist to Senator Rob Portman (R-OH) and as staff director of the Senate Finance Subcommittee on Fiscal Responsibility and Economic
Growth. Riedl also served as a director of budget and spending policy for Marco Rubio’s presidential campaign and was the lead architect of the 10-year deficit-reduction plan for Mitt Romney’s presidential campaign.
During 2001–11, Riedl served as the Heritage Foundation’s lead research fellow on federal budget and spending policy. In that position, he helped lay the groundwork for Congress to cap soaring federal spending, rein in farm subsidies, and ban pork-barrel earmarks. Riedl’s writing and research have been featured in the New York Times, Wall Street Journal, Washington Post, Los Angeles Times, and National Review; he is a frequent guest on NBC, CBS, PBS, CNN, Fox News, MSNBC, and C-SPAN.
Riedl holds a bachelor’s degree in economics and political science from the University of Wisconsin and a master’s degree in public affairs from Princeton University.
Endnotes
Photo: niphon/iStock
Are you interested in supporting the Manhattan Institute’s public-interest research and journalism? As a 501(c)(3) nonprofit, donations in support of MI and its scholars’ work are fully tax-deductible as provided by law (EIN #13-2912529).