The Lifetime Fiscal Impact of Immigrants

Photo: Peter Zelei Images / Moment via Getty Images
Executive Summary
This report estimates the lifetime fiscal impact of immigrants, of various ages and educational attainment, to the United States. It offers a methodological upgrade over similar analyses and estimates and evaluates the fiscal impact of various proposed immigration reforms.
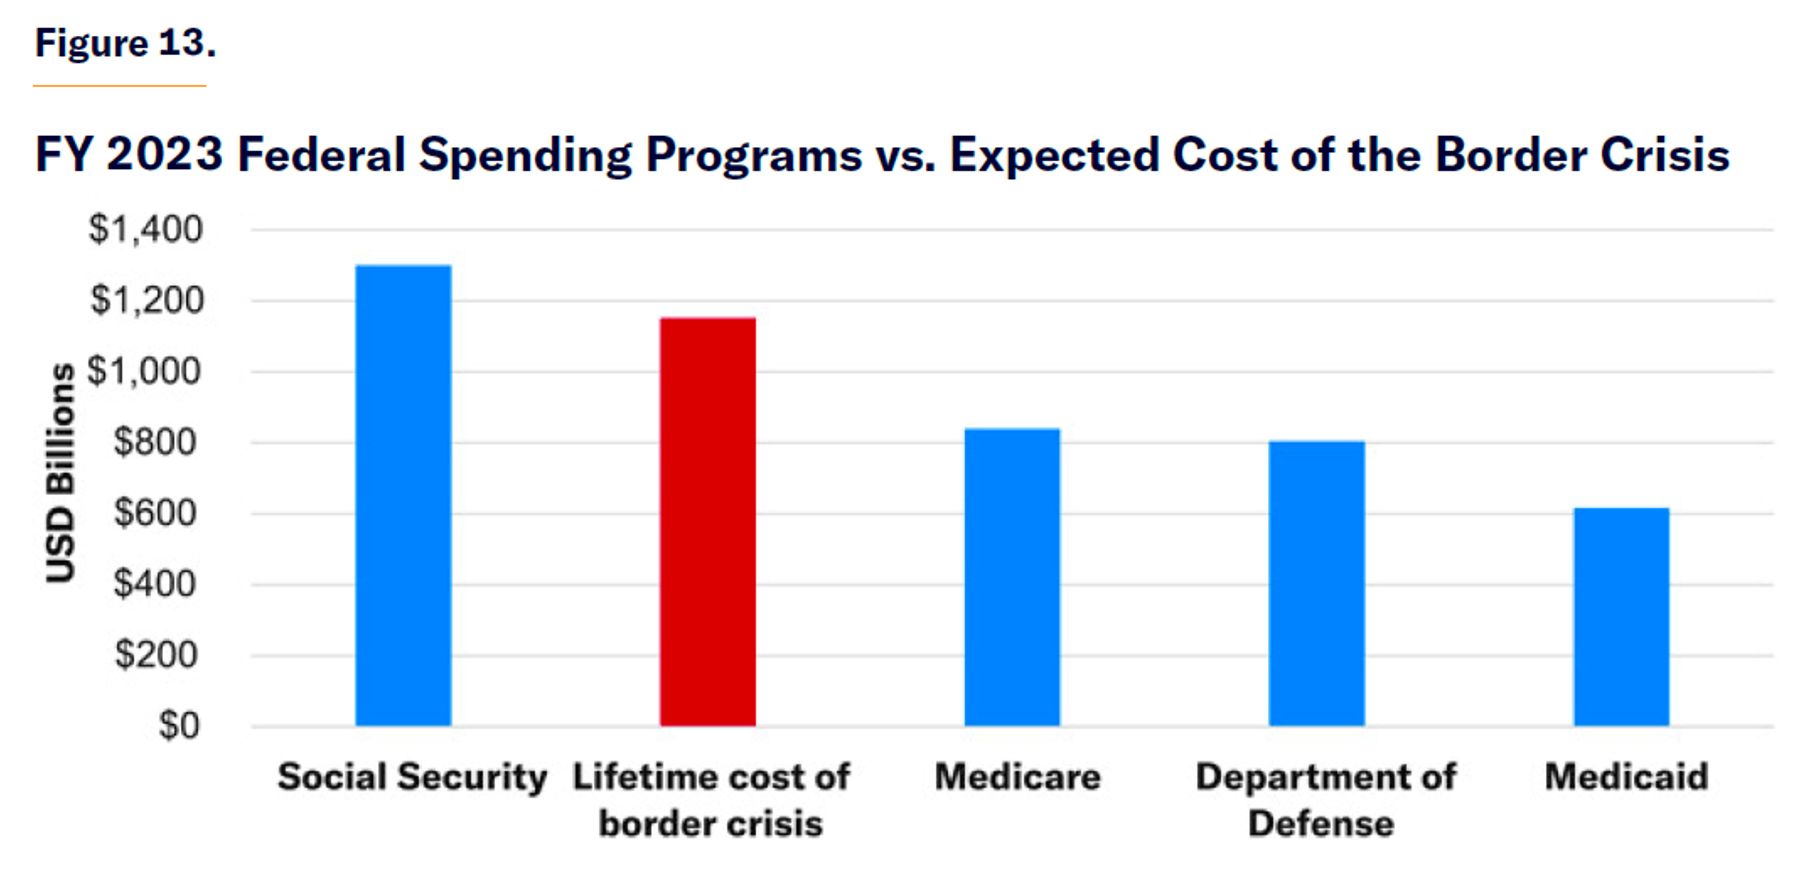
A clear picture of the fiscal cost of immigrants is particularly important, given the ongoing border crisis. The Congressional Budget Office estimates that the border surge will number 8.7 million unlawful immigrants between 2021 and 2026. The original analysis in this report finds that the border crisis will cost an estimated $1.15 trillion over the lifetime of the new unlawful immigrants—a cost larger than the entire U.S. defense budget and almost equal to the cost of Social Security in 2023.
Looking at immigrants more broadly, this report shows that the average new immigrant (lawful or unlawful) has a positive fiscal impact and reduces the federal budget deficit by over $10,000 during his lifetime. For comparison, the average native-born citizen is expected to cost over $250,000 to the federal government. Despite the average immigrant reducing the budget deficit, immigrants without a college education and all those who immigrate to the U.S. after age 55 are universally a net fiscal burden by up to $400,000. The large positive fiscal impact of young and college-educated immigrants pulls up the overall average. Each immigrant under the age of 35 with a graduate degree reduces the budget deficit by over $1 million in net present value during his lifetime.
Therefore, for policymakers considering the fiscal impact of immigrants to the U.S., the characteristics of people seeking entry into the country are crucial. Certain immigrants are fiscally beneficial; others are fiscally detrimental.
This report quantifies the fiscal impact of common immigration reform proposals:
- Mass deportations would significantly reduce the national debt over the long run, but a policy of selective legalization, coupled with mass deportations, would be even more fiscally beneficial, reducing the debt by about $1.9 trillion.
- Given the education, age, and earnings of H-1B visa recipients, doubling the number of H-1B visas for just one year would reduce the budget deficit by $70 billion over the long run—and by another $70 billion each year thereafter.
- The most beneficial immigration policy change would be to exempt STEM graduate degree holders from green-card caps, increasing immigration by some 15,000 people per year and reducing the visa backlog; this would reduce the deficit by $150 billion in the first year and $25 billion each year thereafter.
- Eliminating refugee resettlement and permanent immigration by parents of U.S. citizens would reduce the debt by a combined $40 billion in net present value every year.
- Congress could upskill the existing immigration flow by eliminating the diversity visa category and increasing the visas available to the top employment-based categories, and requiring immigrants to have earned a high school diploma to be eligible for a family visa, reducing the national debt by over $60 billion per year.
By enacting a selectionist immigration policy—which requires securing the border from unlawful immigration, reducing low-skilled immigration, and expanding high-skilled immigration—the U.S. could reduce future federal debt by trillions of dollars over the long run. This report proposes a legislative package that provides over $2 trillion in net present value during the first year and over $200 billion each subsequent year, without accounting for the additional productivity growth resulting from high-skilled immigration. Furthermore, under these reforms, the annual number of immigrants who are new permanent residents decreases by about 15% after a temporary legalization program and a partial clearing of the employment-based visa backlog. Over the long term, annual legal immigration decreases under this plan from approximately 1 million in FY 2019 to approximately 860,000.
Introduction
There are radical disagreements about the fiscal impact of immigrants in the U.S.—i.e., whether they represent a net burden or net contribution to the coffers of the federal government. Some argue that immigrants will rescue Social Security from insolvency by joining the workforce and paying taxes.[1] Others argue that immigrants, particularly those who entered the country illegally, burden taxpayers by receiving welfare and paying little in taxes.[2] In June 2024, the Congressional Budget Office (CBO) released budget projections that assume that immigration stemming from the ongoing border crisis will bolster tax revenues much more than spending, at least in the short term.[3]
The primary purpose of this report is to resolve this debate by providing policymakers, legislators, scholars, and the public with a detailed analysis of the fiscal impacts associated with immigrants, differentiated by age at arrival and educational attainment. This analysis aims to reveal the lifetime effect on the federal budget of admitting immigrants with specific characteristics.
At first glance, whether immigrants reduce or expand the federal budget deficit is not obvious. Most analyses offer only a snapshot of the fiscal contributions of immigrants, rather than examine immigrants’ lifetime fiscal impact on the United States. While it is true that most immigrants are of working-age now, immigrants are not necessarily net contributors to the federal budget over their whole lives. The fact that immigrants are generally workers merely reflects the current demographic composition of more workers relative to retirees and children. Past analyses also do not address the potential long-term impacts of altering immigration policies to favor immigrants with particular characteristics.
The crucial question that policymakers and researchers should try to answer is: What is the net fiscal impact of immigrants over their lifetime? A selective immigration policy should aim to welcome immigrants who will pay more in taxes than they receive in benefits, in order to reduce the U.S. deficit and thus the debt that future generations will carry. An indiscriminate approach to immigration could spell economic disaster by admitting large numbers of immigrants who pose a net fiscal burden or by rejecting the most productive immigrants who are net fiscal contributors.
A major study published in 2017 by the National Academies of Sciences (NAS)[4] attempted to measure the lifetime net fiscal impact of immigrants based on their education and age at arrival. As expected, it found that immigrants with college degrees who arrive at a young age contribute significantly more in taxes than they receive in benefits, amounting to net positive contributions in the hundreds of thousands of dollars. Conversely, those without college degrees who immigrate at older ages impose fiscal burdens of a similar magnitude. However, the NAS study’s broad age grouping—from 25 to 64 years old—oversimplifies the variance in potential fiscal contributions within this group. The study also limits its calculation of fiscal impact to 75 years. This means that the retirement entitlements of immigrant children go partially unaccounted for. Subsequent analyses by the Cato Institute, while informative, do not go beyond 30 or 75 years.[5]
This report goes beyond the NAS study by making the following major methodological improvements:
- Differentiate immigrants into more specific age-at-migration categories, for a total of 35 age-education groups.
- Expand the lifetime impact calculation from the age of immigration until age 100, accounting for mortality and emigration, as NAS does.
- Adjust immigrant mortality downward because immigrants live longer than native-born Americans and therefore pay more in taxes but are also more likely to collect old-age entitlements for longer.
- Adjust Medicare and Medicaid spending by recipient education because the U.S. government estimates that highly educated enrollees spend less per capita, likely because of better health.
- More accurately distribute the burden of new debt among different categories of immigrants, based on their expected lifetime fiscal impact relative to the average native-born American such that immigrants are responsible for future indebtedness proportional to their primary budgetary impact.
Unlike the NAS study, this report focuses solely on the impact of immigrants on the federal budget, not state finances. Showing the impact of immigrants on the average state is not useful for policymakers because the impact of immigration varies widely by state and no state is “the average” state. A state with progressive taxation and generous welfare like California will face consequences very different from the ones faced by a state without an income tax and more limited welfare like Florida. The interstate movement of immigrants complicates these calculations because the state residency of immigrants changes over time.
This report also excludes the impact of second-generation Americans and later—the native-born children and grandchildren of immigrants. The fate of these later generations matters in the long term but only for calculating the fiscal impact of immigrants who move while they are still of childbearing age. Since the descendants of immigrants tend to look more like the average American over time and with each passing generation,[6] including the impact of future generations should only slightly attenuate the differences between educational groups in this report.[7] The inclusion of the second generation is also not as important because of the high discount rate for contributions and benefits paid so many years into the future.
Part I of this report outlines the methodological framework to calculate the net fiscal impact of immigrants by age at arrival and education level. Part II describes the main fiscal-impact scenario and explains with examples. Part III discusses the fiscal-impact estimates and results based on the scenario described in Part II. Part IV discusses the policy implications. After the conclusion, an appendix offers five alternative scenarios.
Part I. Methodology and Assumptions
Unit of Analysis: The Individual Immigrant
The first methodological choice is whether to analyze the tax payments and benefits received by immigrants as households or as individuals. This report treats immigrants as individuals in order to avoid treating households of married native-born and immigrant residents as half-immigrant and half-native. As is done in the NAS study, this report treats the children of immigrants born in the U.S. as native-born Americans, not immigrants. The economics literature is divided on this matter, partially because the U.S. tax unit is households, not individuals. When someone files taxes, he pays as a single, married, or head of household, and the incomes of all members of the household are combined on the tax return. This makes the household a reasonable unit of analysis but does not resolve how to treat mixed households of native-born and immigrant individuals.
Another advantage of choosing individuals as the unit of analysis is that the fiscal-impact calculation is done over a lifetime analysis, and households suffer compositional changes over time. Children are born and then leave the household, older family members are cared for and die, and couples join and sometimes separate. The main estimate for this report is the lifetime fiscal impact of an immigrant, so it makes more intuitive sense to treat them as individuals rather than to combine them with their native-born spouses or children.
This report uses the allocation of household tax payments to individuals done by the Current Population Survey (CPS).
Time Period: 2015–19
Ideally, we would have data that follow immigrants over time from the moment they first arrive in the U.S. until they leave the country or die, but this ideal data set does not exist. To approximate the fiscal impact of an immigrant, this report uses census data from CPS and selects the cross-sectional samples of 2015–19. I selected this period because it is the most recent five-year period that excludes the Covid-19 pandemic, which affected CPS data collection and could bias the results and lead to unprecedented and temporary government spending and tax changes. All monetary values are then adjusted to January 2024 dollars by the Consumer Price Index.
The use of this most recent period of analysis is an improvement over the NAS study, which uses the nearly 20-year period from 1994 to 2013, because more recent data are more likely to approximate the current and future impact of immigration. Today’s economy has different returns for education and work experience, and today’s welfare and entitlement programs are different from those of the 1990s and even 2013. The Affordable Care Act subsidies did not exist in the NAS period of study, Medicare Part D was created only in 2006, and tax rates changed over that period. The 2015–19 period includes years before and after the Tax Cuts and Jobs Act (TCJA) of 2017 went into effect, so it approximates a fiscal situation where tax rates are a mix of pre- and post-TCJA tax cuts. This is a reasonable assumption for our analysis because tax rates are scheduled to increase in 2025 as the TCJA expires.[8] Also, the deteriorating fiscal situation[9] in the U.S. could lead the average tax rate to increase, even if rates do not increase back to full pre-TCJA levels.
Categories of Immigrants
I divide immigrants into 35 age-education groups, based on their age when they first immigrated to the U.S. and their ultimate educational achievement. Then I create a representative immigrant for each group and measure his income, tax payments, and receipt of government benefits from the average year each age group arrives. Tax payments and benefits are measured beginning at the average age at immigration of each age group. For example, for the groups of immigrants who came to the U.S. before turning 18, the average age at immigration was 11. That means that the calculations for this group begin at age 11.
The age-education groups are based on the combinations of the following age and education groups:
Age at Time of Migration
Up to 17 years old
18 to 24 years old
25 to 34 years old
35 to 44 years old
45 to 54 years old
55 to 64 years old
65+ years old
Educational Attainment
Less than high school diploma
High school graduate
Some college, including associate degree
Bachelor’s degree
Master’s, PhD, and professional degrees
For example, to calculate the fiscal impact of allowing an additional immigrant with a bachelor’s degree who is 25–34 years old when he first immigrates, I assume that the earnings and employment likelihood of this immigrant will be the same as other immigrants with college degrees at each age, adjusted by projected productivity growth and likelihood of death and emigration, and discounted to net present value. Income taxes, payroll taxes, and Social Security benefits grow with productivity; but excise tax revenue, Medicare, and other spending do not grow with productivity, since they are expenditures independent of wages. Instead, discretionary spending is assumed to grow at the government’s projected rate. This is explained in more detail in the following sections.
Discount and Productivity
The discount rate assumed for this report is the same rate used in the NAS report: 3%, which is slightly more than the projected 10-year real Treasury yield, according to CBO,[10] but probably close to what the 75-year real risk-free yield would be if there were an actual U.S. government bond of that term. I assume a 1.4% annual increase in productivity, as the CBO projects, from 2024 through 2044. I extend that rate for all years following 2044 as well.
Life Expectancy
Life expectancy has significant implications for fiscal-impact calculations because it determines how long someone pays taxes and collects old-age entitlement benefits. Immigrants live longer than native-born Americans,[11] and new evidence shows that the gap is widening. A 2021 paper using data from the National Center for Health Statistics with all deaths in the U.S. from 1990 to 2017 found that the life-expectancy edge of immigrants has grown over time.[12]
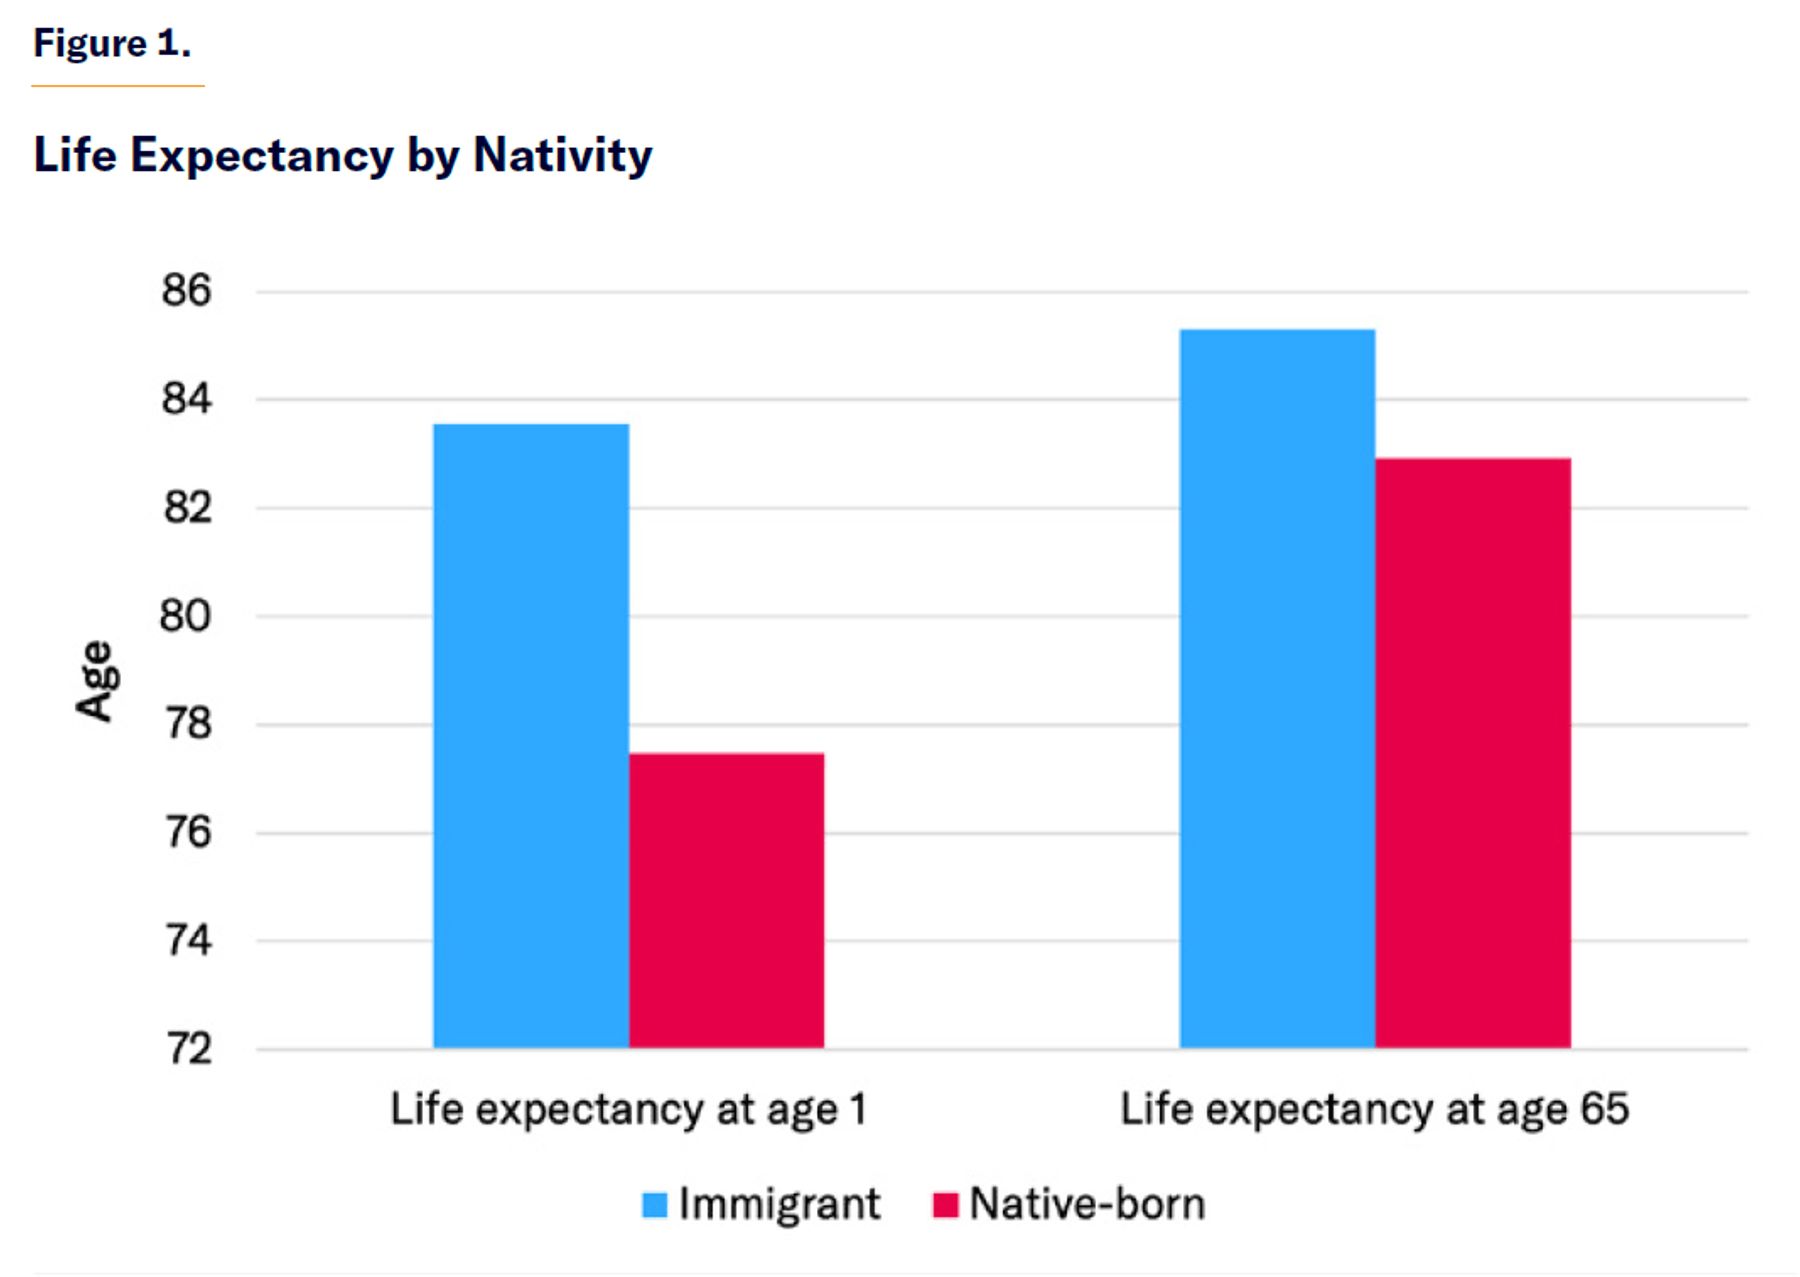
By 2017, a one-year-old immigrant boy was likely to live past age 81, while an average one-year-old U.S.-born boy was not expected to reach the age of 75—a 6.5-year age gap, or an 8.7% longer life expectancy for immigrant men.[13] The life-expectancy edge of immigrants is smaller among women, with immigrant women expected to survive past age 85 and native women expected to reach almost exactly 80 years old—a 5.5-year age gap, or a 7.1% edge for immigrant women.
Almost all the immigrant life-expectancy edge is due to mortality differences among prime-age individuals, i.e., after they reach their teens and before they reach their sixties. One 2016 study found that after age 65, immigrants still lived longer than native-born adults but to a lesser extent than was expected one year after birth.[14] Higher survival rates during prime-age years could be due to a less sedentary lifestyle among immigrants and better diets[15] or lower homicide rates (immigrants constitute about 15% of the U.S. population but just 8% of homicide victims).[16] Other factors, including “deaths of despair” (i.e., suicides and drug overdoses) and accidental deaths from car accidents, could be major contributors as well.
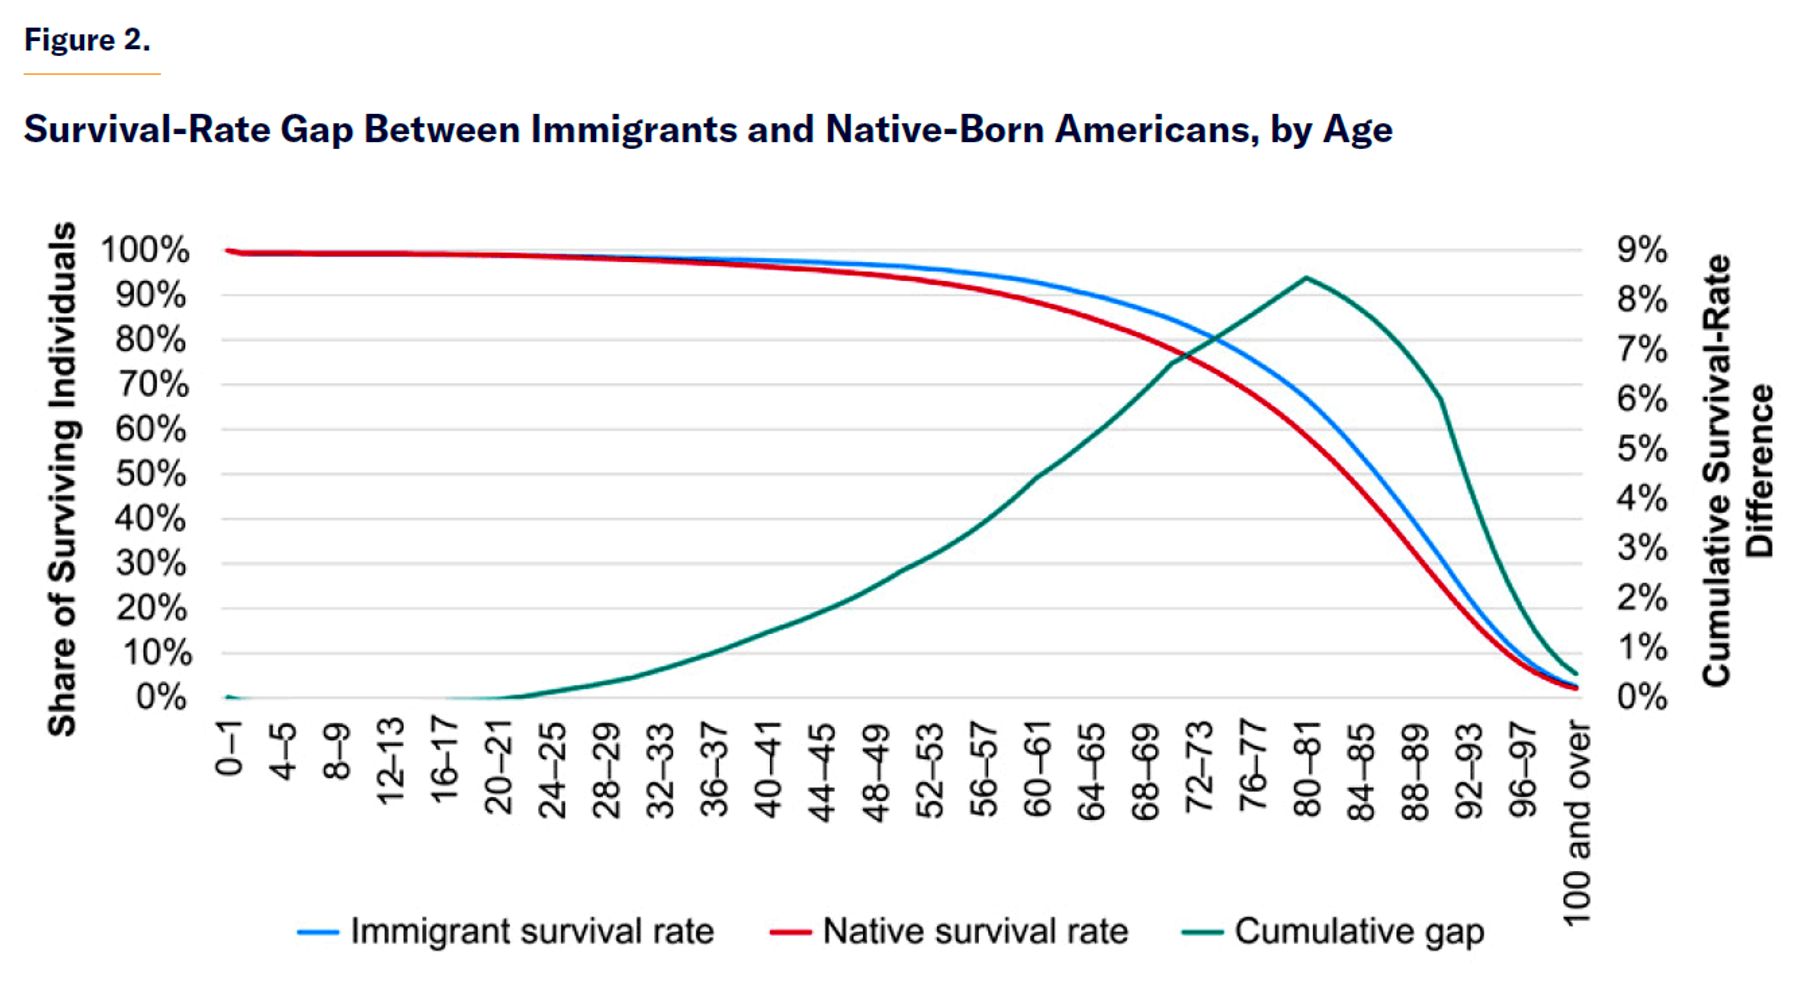
A 2021 study by Arun S. Hendi (Princeton University) and Jessica Y. Ho (University of Southern California) found that the mortality gap peaks around age 35, with more than 2.5 times higher risk of death for natives than immigrants, and then falls back but never converges completely (Figure 1).[17] While one may be concerned that the large gap between immigrant and native mortality is explained by selective emigration from the U.S. (i.e., perhaps unhealthy immigrants return home), the authors found no increase in old-age emigration in the period of study, despite the growing life-expectancy gap. The gap may be due to positive selection of immigrants entering the U.S., but because it is not due to selective emigration once in the country, the life-expectancy gap does not affect this model’s assumptions on emigration and mortality.
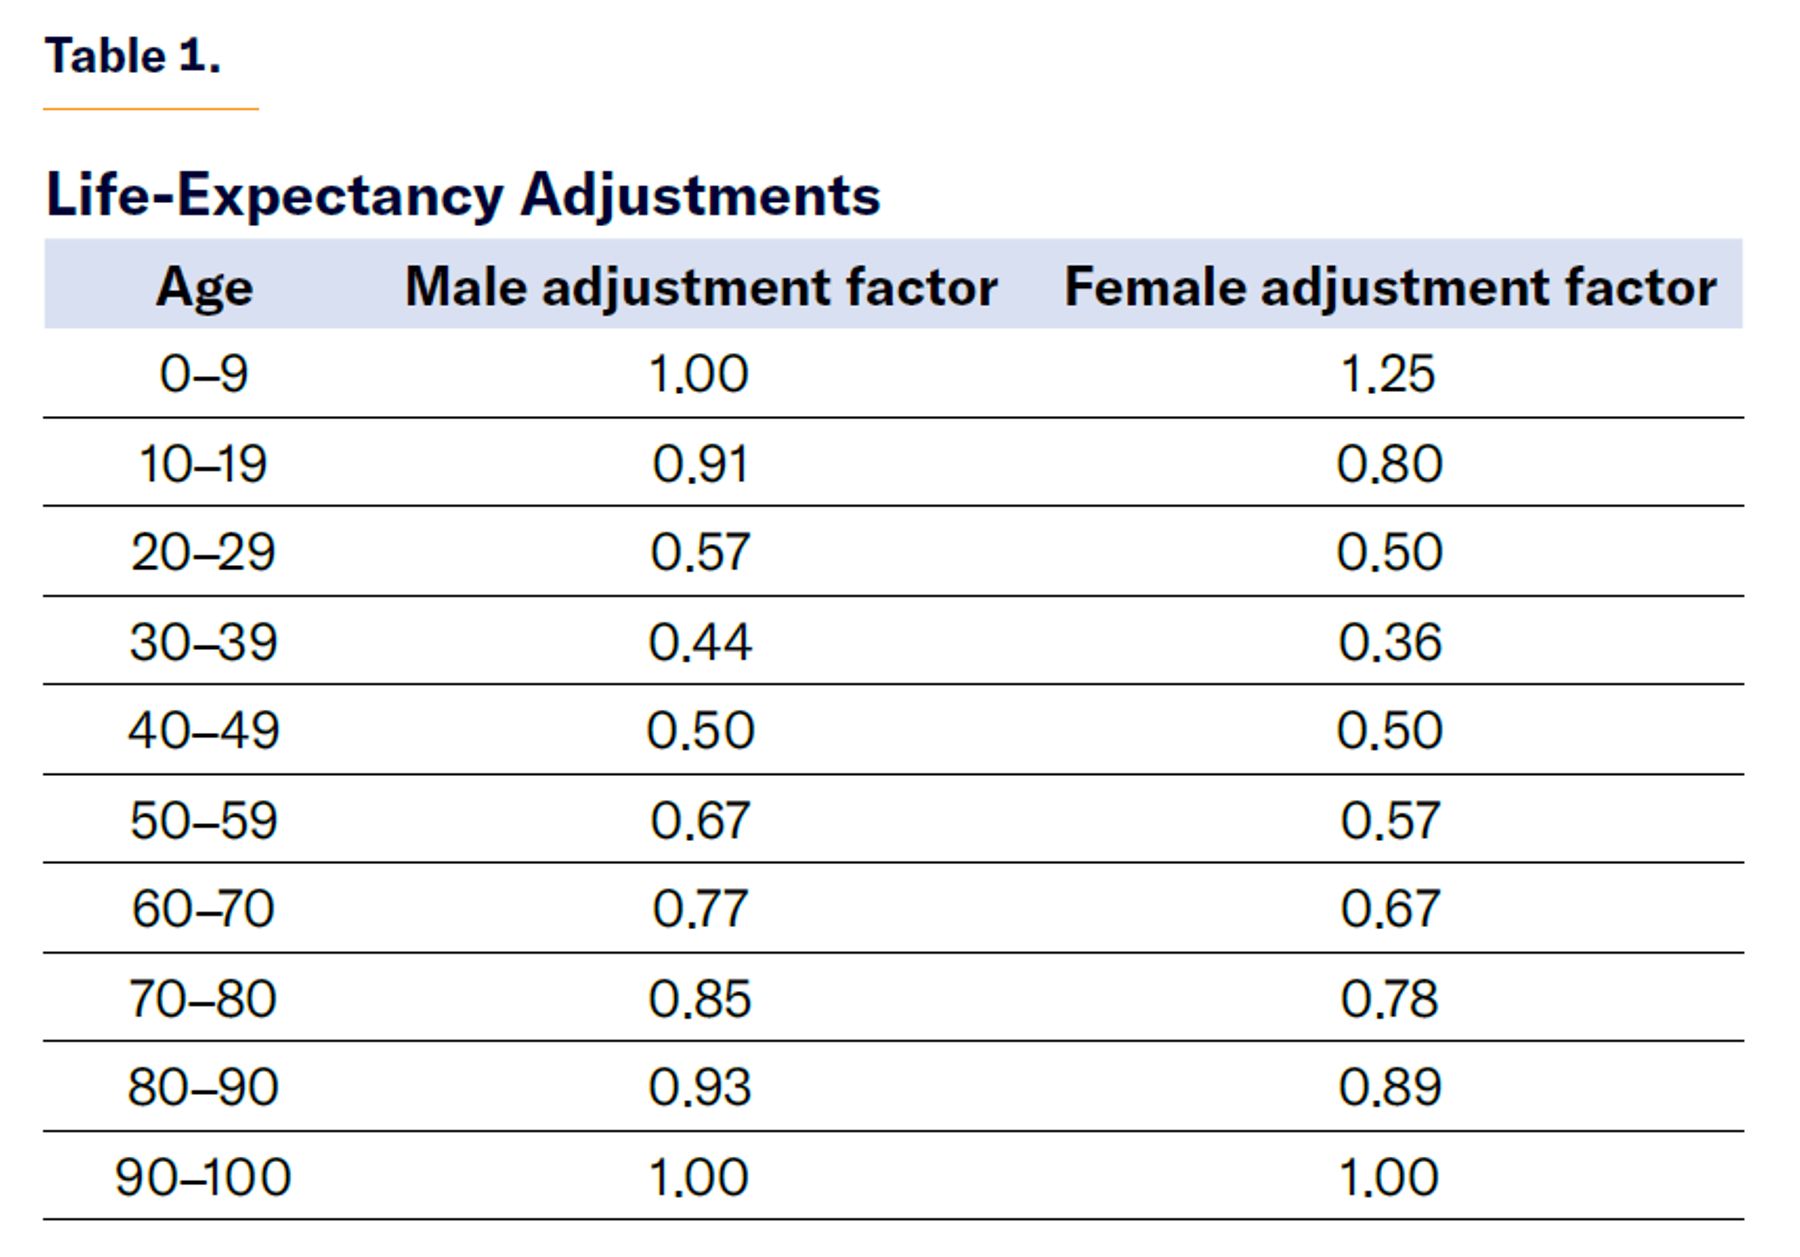
Life expectancy is an area where this report makes an important departure from NAS. The NAS study assumed equal life expectancy for immigrants and native-born Americans, while this report adjusts for differences in life expectancy. Specifically, I use the Centers for Disease Control and Prevention’s (CDC) 2019 age-specific mortality estimates[18] and correct for the native-immigrant mortality differential in Hendi and Ho (2021) with decade-specific multipliers until age 70 (Table 1 and Figure 2). I assume that, after age 70, native and immigrant death rates converge linearly until the age group of 90–100, the age after which CDC mortality data assume death risk is 100% due to the small number of living centenarians.
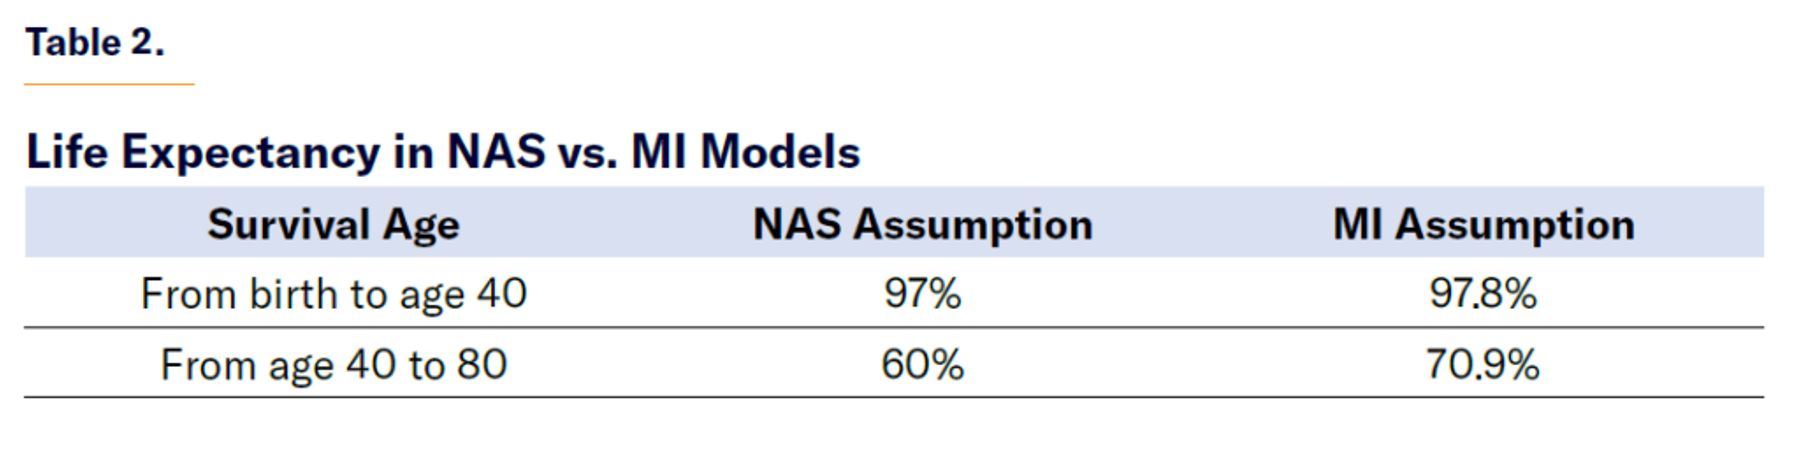
These adjustments for this Manhattan Institute (MI) paper result in higher average survival rates than those of the NAS study for immigrants, as shown in Table 2.
Emigration
I keep the same emigration assumption of the NAS study with the following probabilities of emigration by time since arrival:
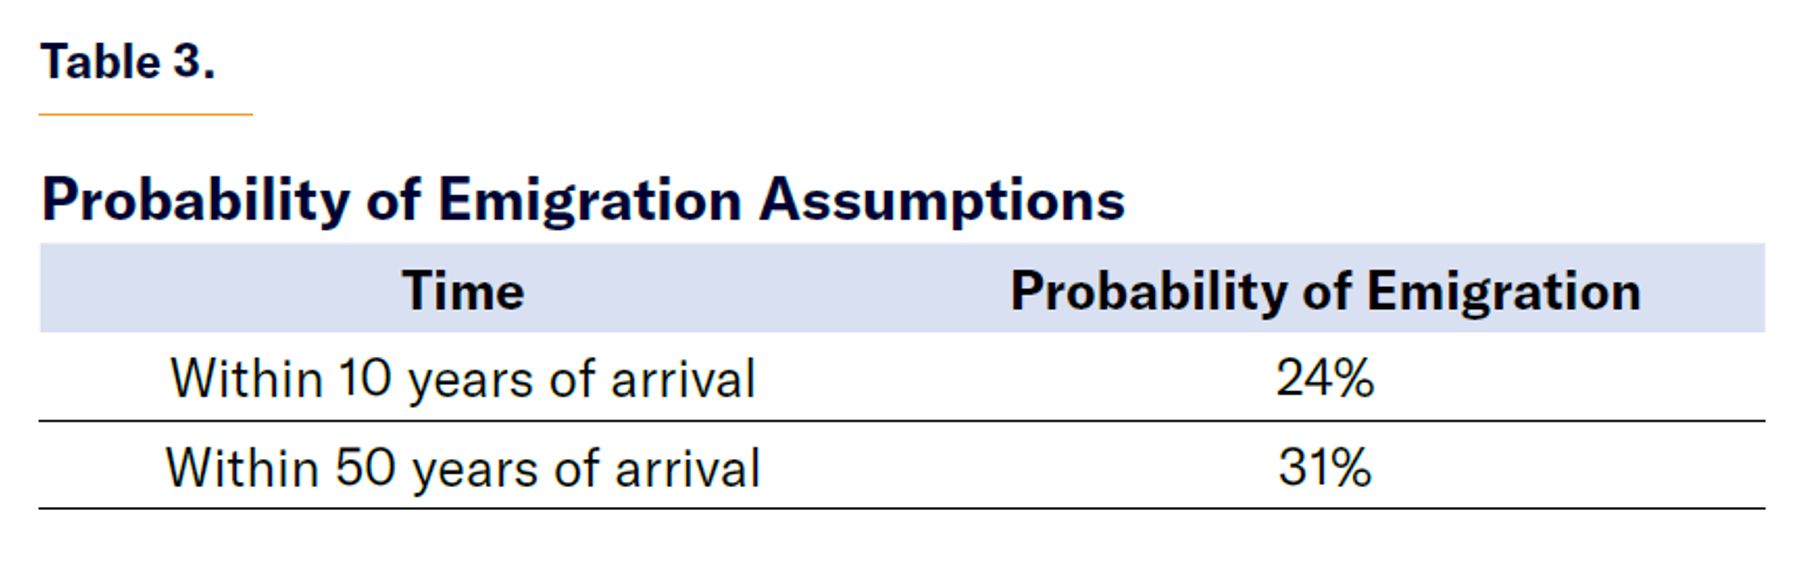
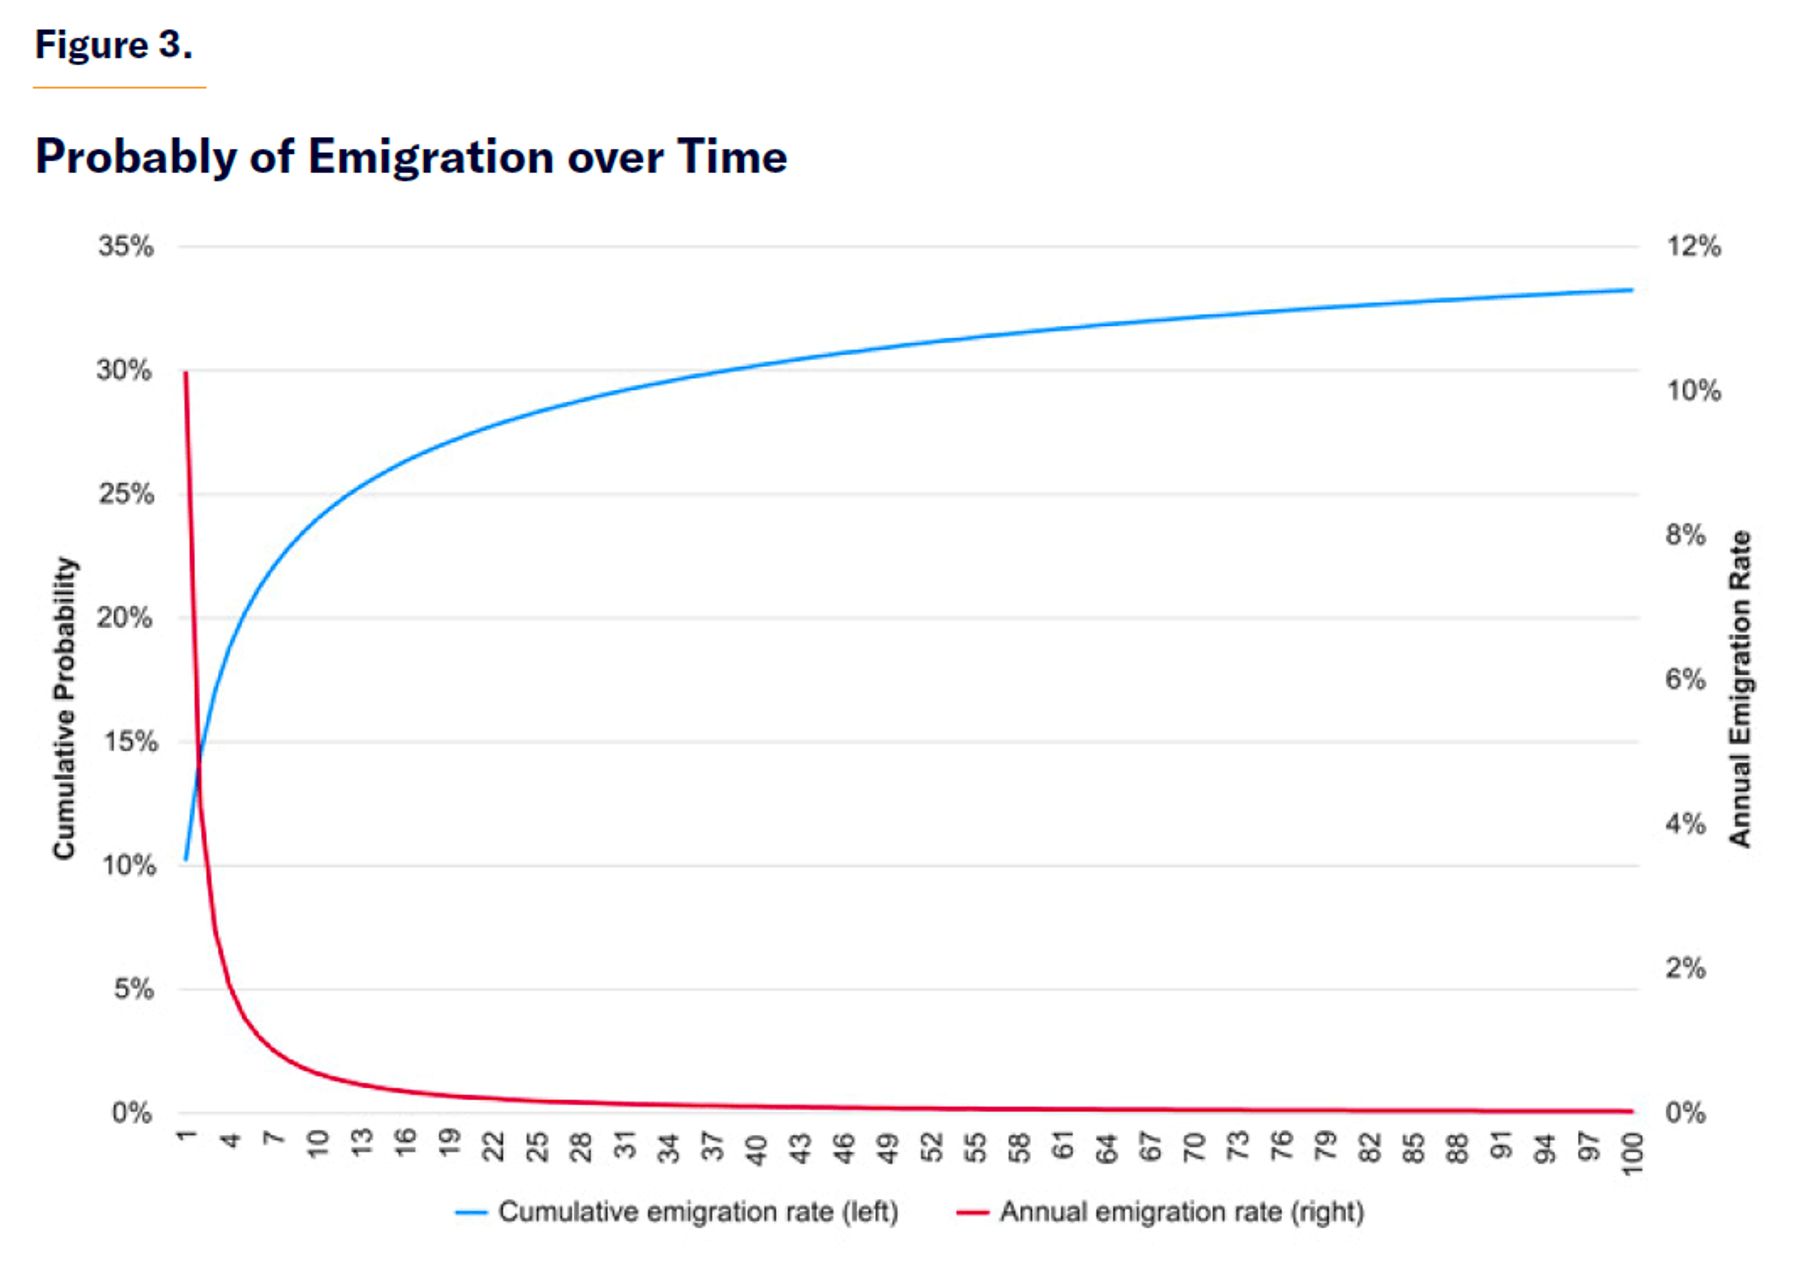
To apply these rates by year, I construct the following function, which matches the cumulative probabilities of emigration at 10 and 50 years since arrival:
Et = AtB
Where Et is the probability of emigrating just at year t since arriving in the U.S. such that the cumulative probability of emigration at year t is equal to:

I solve for the parameters such that  and the function is monotonically increasing, meaning that cumulative emigration probability increases every year
A = 0.102498884
B = –1.267738271
This creates a smooth and reasonable probability-of-emigration function with new immigrants having a high probability of leaving within the first year (10%) that quickly falls over time and approaches, but never reaches, zero, as shown in Figure 3.
Public Education
Most public education spending occurs at the state and local levels, but the federal government contributes a substantial portion of funding, too, which we must consider for immigrants who arrive as minors. The average federal contribution to revenue per pupil among all U.S. public schools between the academic years 2014–15 and 2018–19 (prior to the pandemic-related temporary aid) was $1,442.33 in adjusted 2024 dollars.[19] For simplicity, I assume that all immigrants, despite their different geographical distribution, derive this same federal subsidy. I also assume that all immigrant and native children who are enrolled in school attend a public school. This is not accurate but is the same assumption made by NAS and is more reasonable than assuming differential rates without surveys to support those assumptions.
While children who go on to obtain more education might be more likely to be enrolled in private schools because they might come from richer families, children from wealthy families are also more likely to go to better-quality and—crucially—better-funded public schools, which might operate at greater costs for the federal government. In light of these counteracting factors, it is reasonable to assume equal costs across education groups.
Taxes
Most of the tax data used for this analysis come directly from the self-reported information in the census Current Population Survey, which directly reports what people say that they paid in income and payroll taxes (which I adjust to include the employer share). However, I make several assumptions that differ from those of the NAS study.
Like the NAS study, I assume that payroll taxes (both the employer and employee share) are paid entirely by workers, just as with the federal income tax. I also add unemployment-insurance tax to each worker, in the same way as the NAS model. Empirical evidence indicates that the true share of payroll taxes borne by workers is high but not quite 100%.
However, unlike NAS, I do not allocate corporate tax revenue in this analysis at all, for three reasons. First, it would be inconsistent to assume that the payroll tax burden is entirely borne by workers but the corporate tax burden is not entirely borne by capital owners. Second, people are both workers and capital-owners, so allocating corporate tax revenue accurately would require knowing what share of immigrants, natives, and foreign-based investors own C-corp assets. Third, and most important, corporate taxes are paid regardless of the location of the investor, so whether an immigrant who owns shares in a C-corp lives in the U.S. or elsewhere does not affect his corporate tax liability, as the corporation is headquartered domestically.
Finally, I allocate excise tax revenue based on a different and more complete regression of the 2019 Consumer Expenditure Survey (CES)[20] by education and age groups. The NAS study relied on data only from tobacco, alcohol, and gas expenditure and then extrapolated the rest of excise tax revenue based on those three categories of taxed goods.
To make the excise tax analysis more complete, I added a fourth category: “public and other transport” spending in order to approximate airline excise tax revenue, which is as large as tobacco excise tax revenue. This category includes spending on airline tickets but also subway and bus fares. Still, the public and other transport spending category is a good proxy because it includes airline ticket spending and is positively correlated with income, since wealthier and more highly educated people tend to live in more urban areas with better public transportation systems, in addition to purchasing flight tickets more often.
Table 4 shows the rounded result in predicted annual tax revenue from all excise taxes by education and current age group.
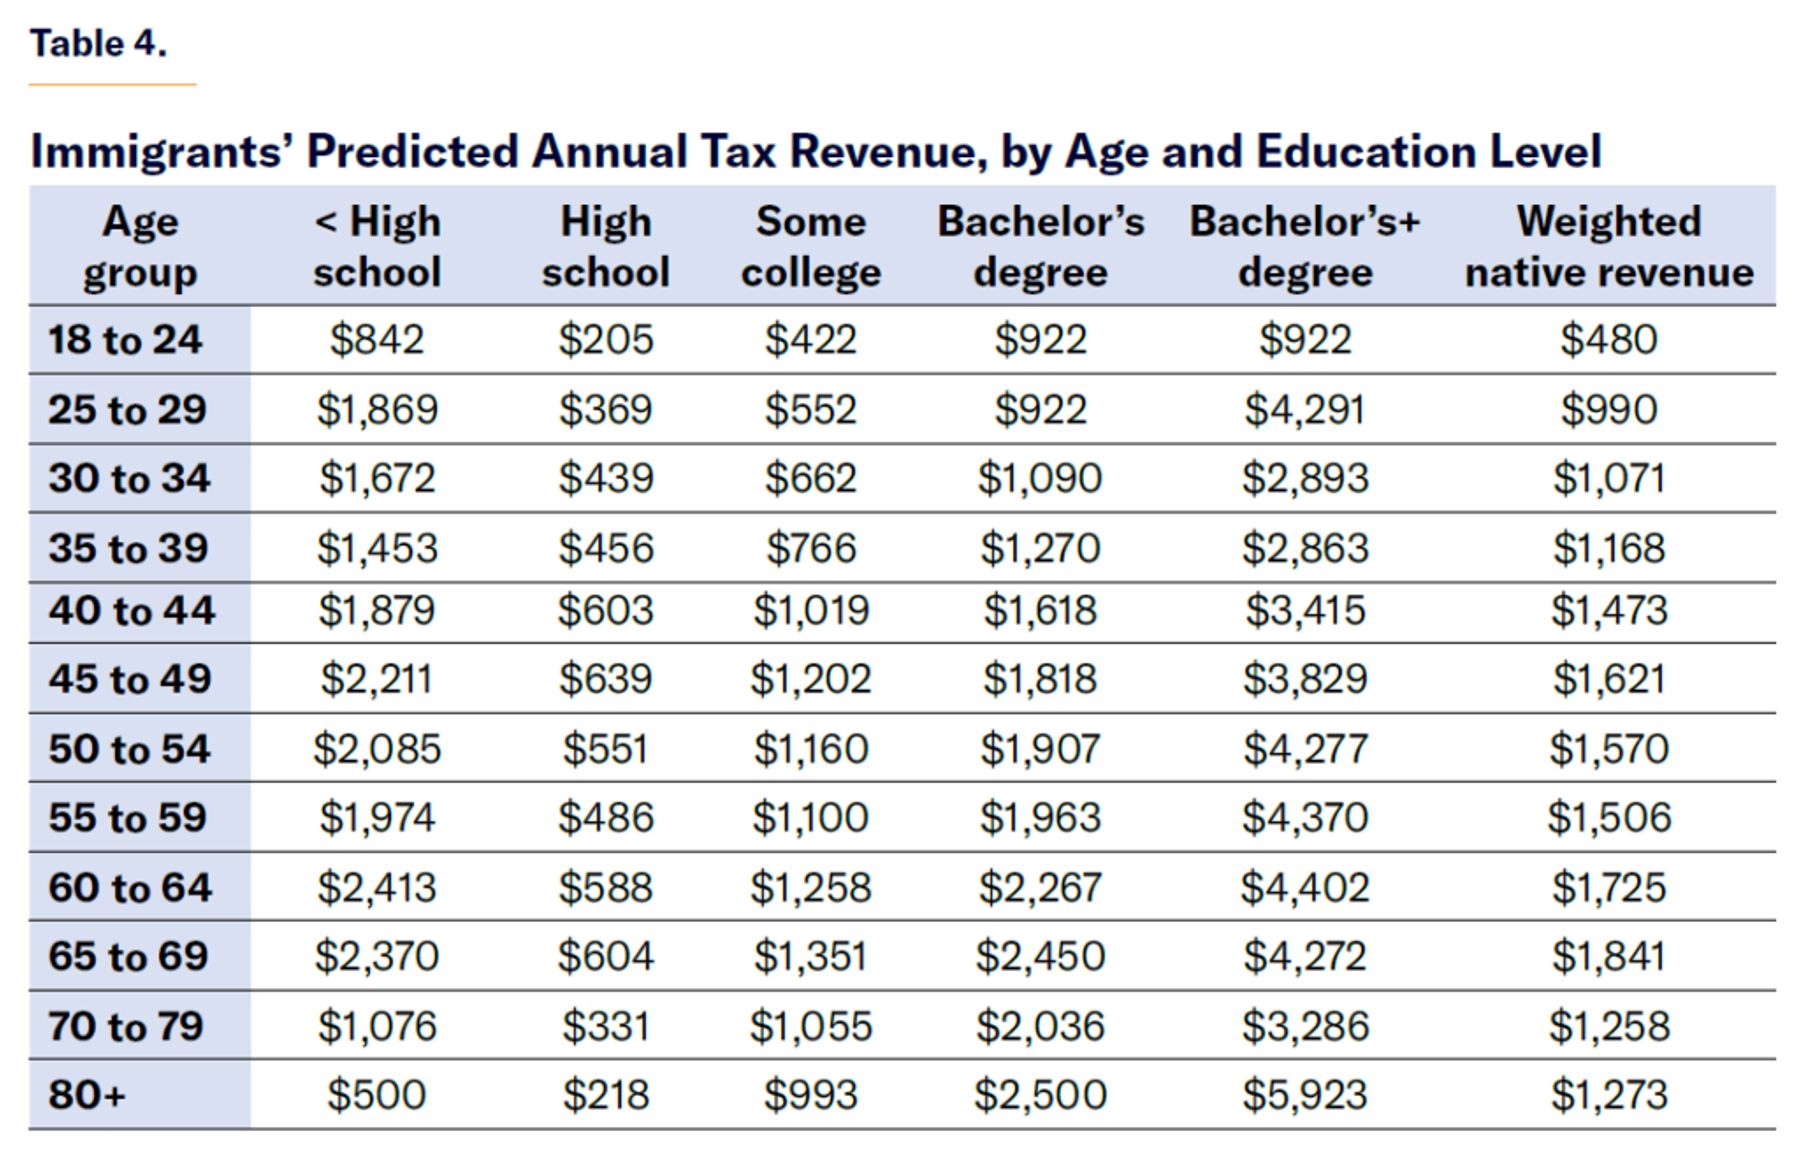
I assume that income and payroll revenue grow with productivity, but not excise tax revenue, which I assume stays constant in inflation-adjusted terms by age and education group.
Social Security, Medicare, and Medicaid
The three major nondefense spending programs in the U.S. are Social Security, Medicare, and Medicaid. Social Security benefits are determined by a formula that depends on wages earned. The program’s benefits grow with wages (and therefore productivity). In this report, I adjust upward current Social Security benefits by productivity growth for future retirees. But unlike Social Security benefits, Medicare and Medicaid are not proportional to current or past wages. Since high earners pay higher Medicare premiums and poverty declines with economic growth, these programs should become less generous with higher productivity growth. Therefore, I assume that Medicare and Medicaid spending per enrollee does not grow with productivity.
The Kaiser Family Foundation (KFF) found that per-enrollee Medicare spending in the last 10 years of available data grew by just 2.4% annually,[21] right around the rate of Personal Consumption Expenditures inflation over that time of 2.1%.[22] This per-enrollee growth does not take into account that the average Medicare enrollee is growing older, so part of this increase in per-enrollee spending reflects aging rather than rising costs. This is why I assume that the current costs per Medicare enrollee by age will remain constant in real terms, growing about 2% annually with inflation.
Similarly, for Medicaid, I assume that the current cost by age of beneficiaries will remain constant in real terms. Rising productivity should result in a smaller share of Americans eligible for Medicaid, but I assume constant enrollment, which should offset any potential increase in Medicaid costs that I am not considering. Additionally, for simplicity, I assume that the federal government pays 71.3%[23] of Medicaid in all cases, although different states, population groups, and different categories of spending have different federal matching rates, and these matching rates even vary from year to year.
Medicare and Medicaid enrollment rates are reported by CPS respondents and imputed by the Census Bureau in the survey, based on household characteristics. Spending per enrollee and by age are reported by KFF and adjusted by the education level of recipients proportionally, based on the latest available educational breakdown of the Centers for Medicare & Medicaid Services (CMS) from 2009.[24] This is another improvement over NAS methodology, which does not account for different health costs of individuals by their educational attainment. Therefore, I assume that college-educated Medicaid and Medicare recipients cost less than enrollees without a high school diploma.
Immigrants Who Arrive as Children
This report’s model treats immigrants who arrive in the U.S. as minors differently from the NAS model. The NAS study assumed that children of parents with a certain level of education will behave similarly to the children of other immigrant parents of the same level of education, regardless of the education level reached by the children themselves. The NAS approach is useful because it intuitively makes sense and it might be the best approach if the government is selecting independent immigrant children, or considering children to decide the admission of the parent. However, it is not common for unaccompanied minors to enter the U.S., unless they are entering unlawfully.
An example is the best way to explain the disadvantage of the NAS approach. Imagine two pairs of immigrant parents. Imagine the children of each pair were born outside the U.S. and all the parents have bachelor’s degrees—but 20 years later, one of the kids earns a college degree and the other does not. In this case, the NAS study assumes that there is a chance that each child will end up as a college graduate, or that each child will not earn a college degree at all. The NAS model assumes that a college graduate and a non-college graduate would behave the same way because all the immigrants in the parents’ generation have the same education. But if one child earned a degree and the other did not, is it likely that both immigrant children will have behaved the same by the time they are 21? Likely not. Instead, one child will likely have worked more than the other, they may have earned different grades, and they may even have different criminal records.
My model assumes that each of these hypothetical immigrants who entered the U.S. as minors behaved as the level of education that they ultimately reached suggests, rather than the education predicted by their parents’ education. In this way, we should have a more accurate reflection of their past.
To calculate this, all values of taxes and benefits are averaged for those younger than 18 and then adjusted by the differences between education groups at their prime ages (25–54). For example, if college-educated immigrants pay 50% more in payroll taxes between the ages of 25 and 54 than immigrants who did not complete high school, I assume that these higher-educated immigrants also pay 50% more in payroll taxes before they turned 18. This exercise is repeated for all non-directly observed or parent-dependent benefits for immigrants aged 18–24 with some college education and higher. Every child, both native and immigrant, is assumed to pay no taxes until reaching age 15.
The only two benefits not based on the ratios among adults of the same education level are the Free or Reduced-Priced Lunch (FRPL) program and the Children’s Health Insurance Program (CHIP) since only children receive both. To account for this, I assume that children who never graduate high school receive greater FRPL and CHIP benefits in the same ratio that they receive more cash welfare benefits in adulthood, relative to other education groups. For example, if the combined value of Supplemental Security Income (SSI), welfare such as Temporary Assistance for Needy Families (TANF), Supplemental Nutrition Assistance Program (SNAP), Women, Infants, and Children (WIC) nutrition program, and heating subsidy benefits are 10 times larger among immigrants aged 25–54 without a high school diploma than among similar-aged immigrants with a college degree, I also assume that the former received 10 times more FRPL and CHIP benefits than the latter when they were under 18.
Public Goods and Government Spending
All other government spending that is not directly received by people is considered a public good in this report. The major categories of spending included in this group are military spending, government investment in roads, research, and spending on services such as international representation or government corporations, such as the post office. The NAS study considered two scenarios regarding the impact of immigration on public goods: one in which immigrants do not consume public goods; and one in which immigrants consume public goods at the same rate as native-born citizens. It would be reasonable to assume that one additional immigrant would not strain or increase public goods spending, but if immigration grows the population by, for example, 10% over one century, then transportation, military, research, and other forms of spending that are not a direct benefit will likely grow.
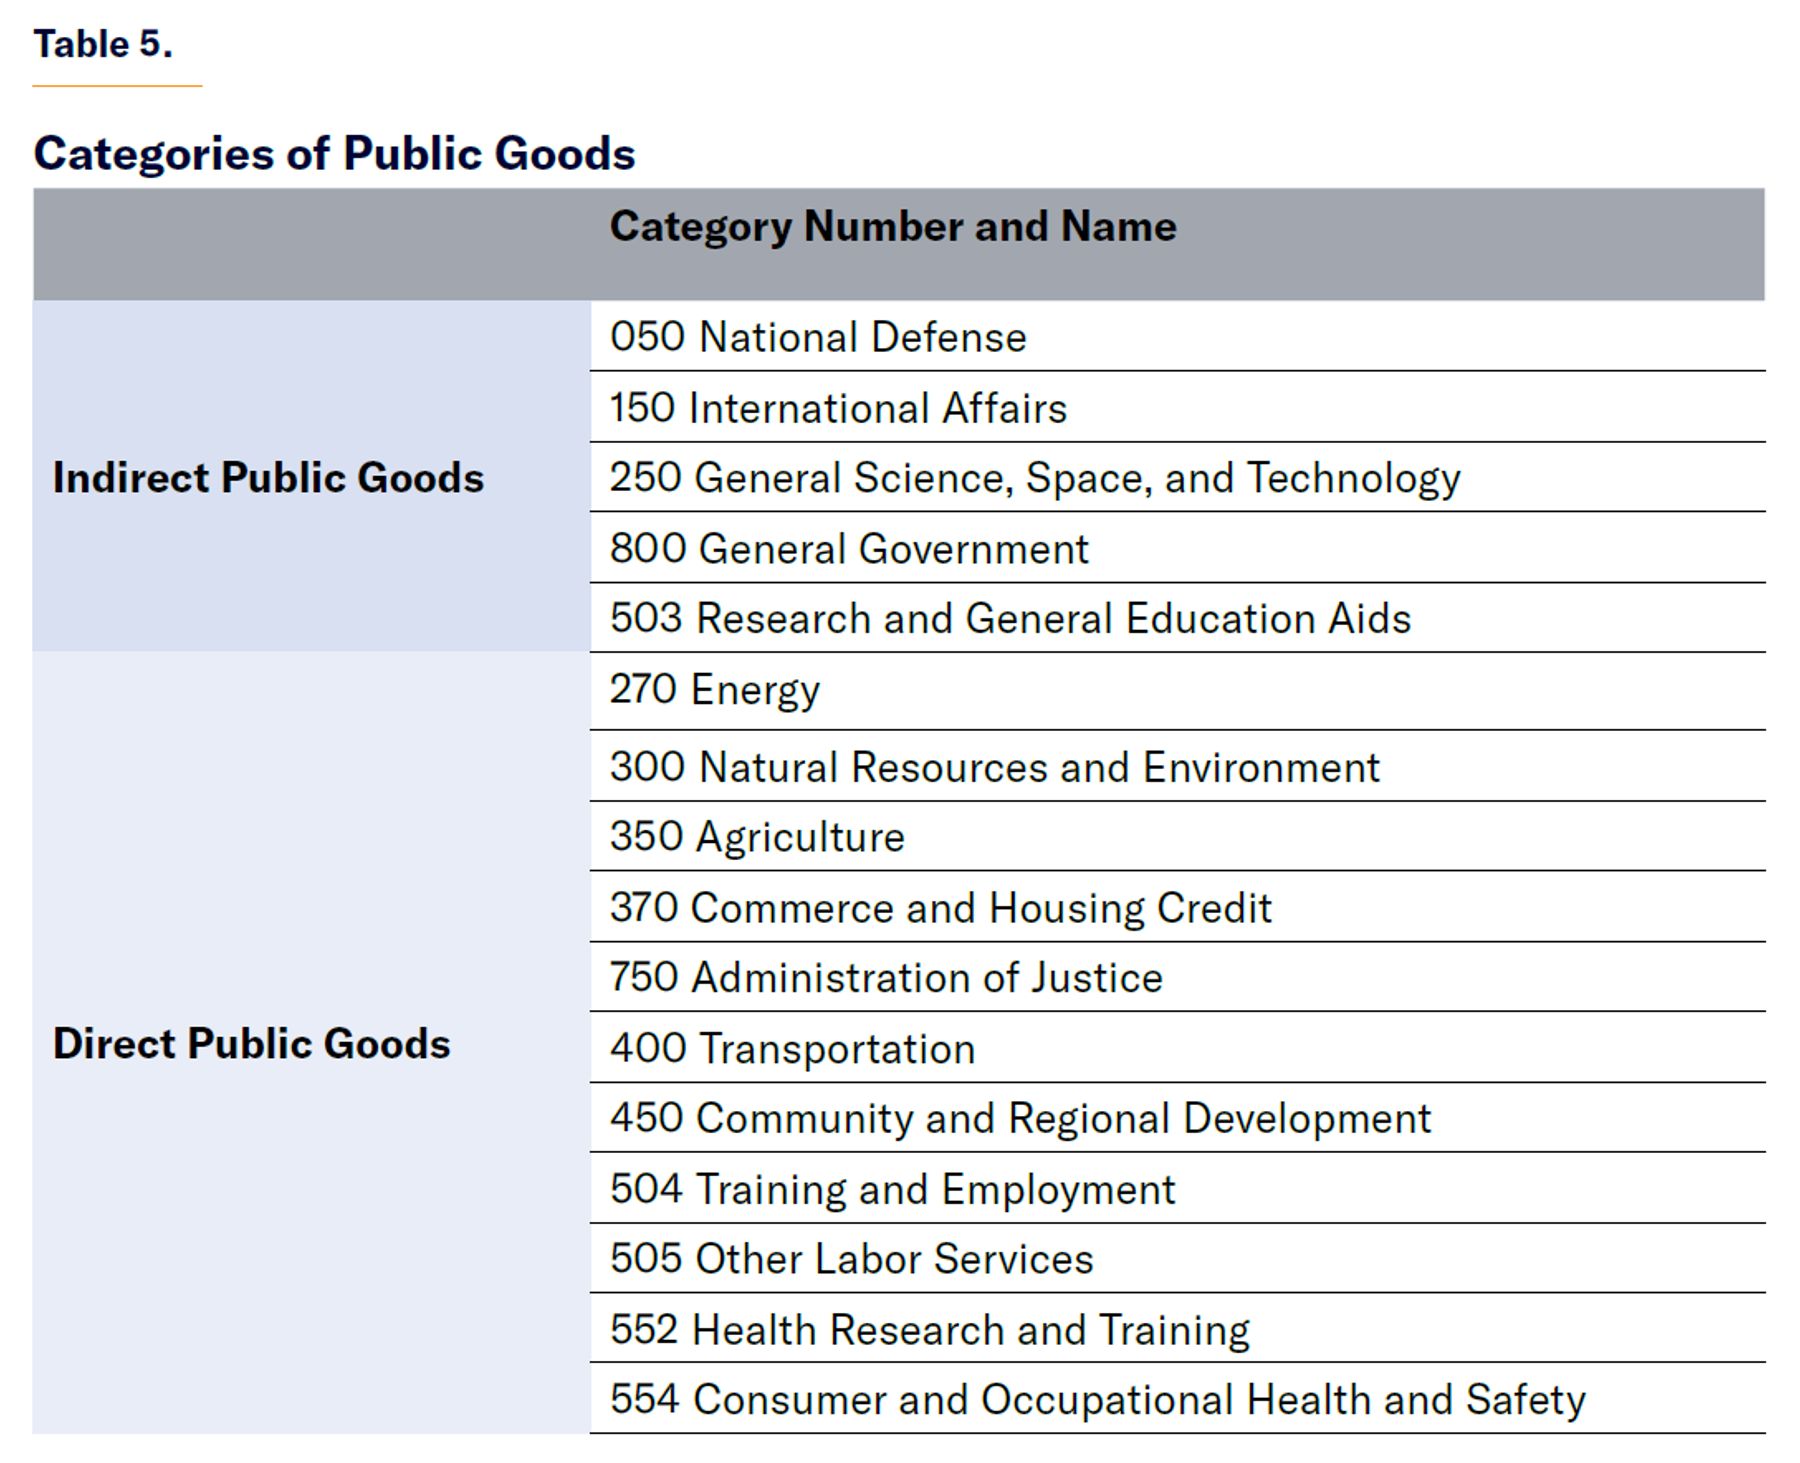
For the purposes of simulating different scenarios, this report separates public goods spending into two categories: direct public goods; and indirect (or “pure”) public goods. (For more definitions, see Appendix A.) Direct public goods are those likely to be congestible, meaning that as more people consume a good, it eventually becomes more difficult for others to consume it as well. Direct public goods include highway trust-fund spending, labor training programs, community development grants, and even the administration of justice such as federal judges. Indirect public goods are those not likely to be congestible, such as national security provided by the U.S. Department of Defense and diplomatic representation abroad.
In all my scenarios that include public goods spending, immigrants consume direct public goods at the same rate or average rate of natives. However, when it comes to indirect public goods, immigrants in some scenarios consume indirect goods at half the rate of natives; in other scenarios, immigrants consume all public goods at the same rate as natives.
Table 5 lists the categories for each type of public good. Based on the Office of Management and Budget’s analysis of the Federal Budget.[25]
Net Interest on the U.S. National Debt
The most consequential difference between this analysis and the NAS study when it comes to the national debt is simply that the MI analysis uses updated data, including the updated CBO economic outlook. I use CBO’s most recent outlook, which has a much worse debt picture because deficits have been larger than expected—partly because of the Covid-19 pandemic and recession spending and because of higher-than-expected interest rates. CBO’s outlook ends in 2054 with a debt-to-GDP ratio of over 166%.[26] Interest on the debt reaches almost $3 trillion (in 2024 dollars) that year, or 6.4% of GDP. If debt were to continue growing at the projected rate beyond 2054, the U.S. would eventually reach a debt-to-GDP ratio never seen in modern times, and interest on the debt would reach unsustainable and unrealistic levels by the end of the century of over a tenth of GDP.
To ensure reasonable estimates beyond 2054, I assume that the share of GDP that goes to paying interest on the debt freezes at the extremely high level of 6.3% in 2054 and beyond because interest rates, I assume, fall from the projected 3.8% to 3.55% over 2054–60. This allows interest as a share of the economy to stabilize because of real GDP growth, which I assume stays constant at 1.6% annually beyond 2054.
As in the NAS study, natives pay the full cost of debt while immigrants pay only the cost of new debt, meaning that new immigrants are not responsible, for purposes of this estimate, for the interest on debt incurred before they immigrated to the United States.
I further improve upon the NAS study by adjusting the interest that each immigrant category is responsible for proportionally by their primary budgetary impact—the taxes they pay minus the non-interest spending they are responsible for. In this way, highly educated and young immigrants who pay more in taxes than they receive in benefits end up being allocated negative interest, since they help pay down the debt, while immigrants with low levels of education and who immigrate at older ages are responsible for more interest than an average person, at least since their arrival.
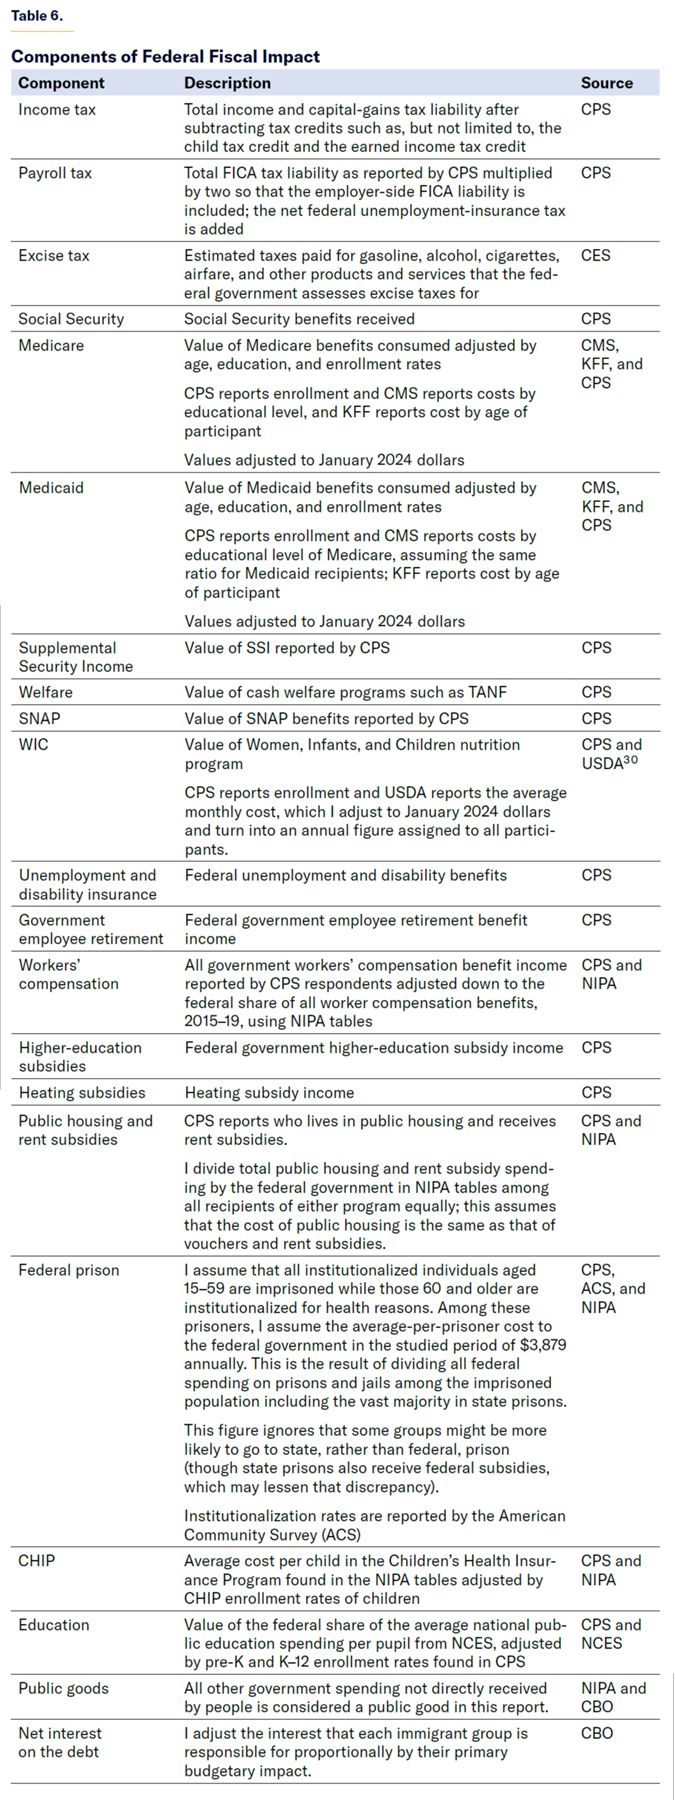
Economic Growth and Redistribution
This analysis provides a first-order effect of immigration on the federal government’s finances (the components of which are listed in Table 6) but does not fully capture the economic impact of immigrants. Increasing the size of the labor force has short-term and long-term impacts on the wages and the size of the capital stock. While the academic literature shows mixed effects on wages of other workers in the short and long term, it is a consensus view that these effects are small and concentrated on other recently arrived immigrants rather than natives.[27] Over the long term, however, increasing the size of the labor force induces more investment and a proportionally larger capital stock, which should increase tax revenue from capital income. Additionally, highly educated immigrants, especially those focused in STEM areas, are likely to innovate and increase productivity at least during part of their lifetime.[28]
CBO estimated[29] that about one-third of the net fiscal benefits of immigrants over a 10-year period come from indirect or economic growth effects unrelated to the taxes that they pay. Therefore, immigrants with slightly negative fiscal impacts could have some positive effect. The positive fiscal impact of young and highly educated immigrants is likely underestimated by this report.
However, this report also ignores the redistributive effects of immigration. A large wave of immigrants without a high school diploma is likely to harm some existing residents and native-born Americans who also lack a high school diploma, even if it benefits the rest of the population. A large immigration wave of college-educated individuals is likely to harm some existing college-educated residents (though this may be offset by productivity gains) and benefit less educated existing residents.
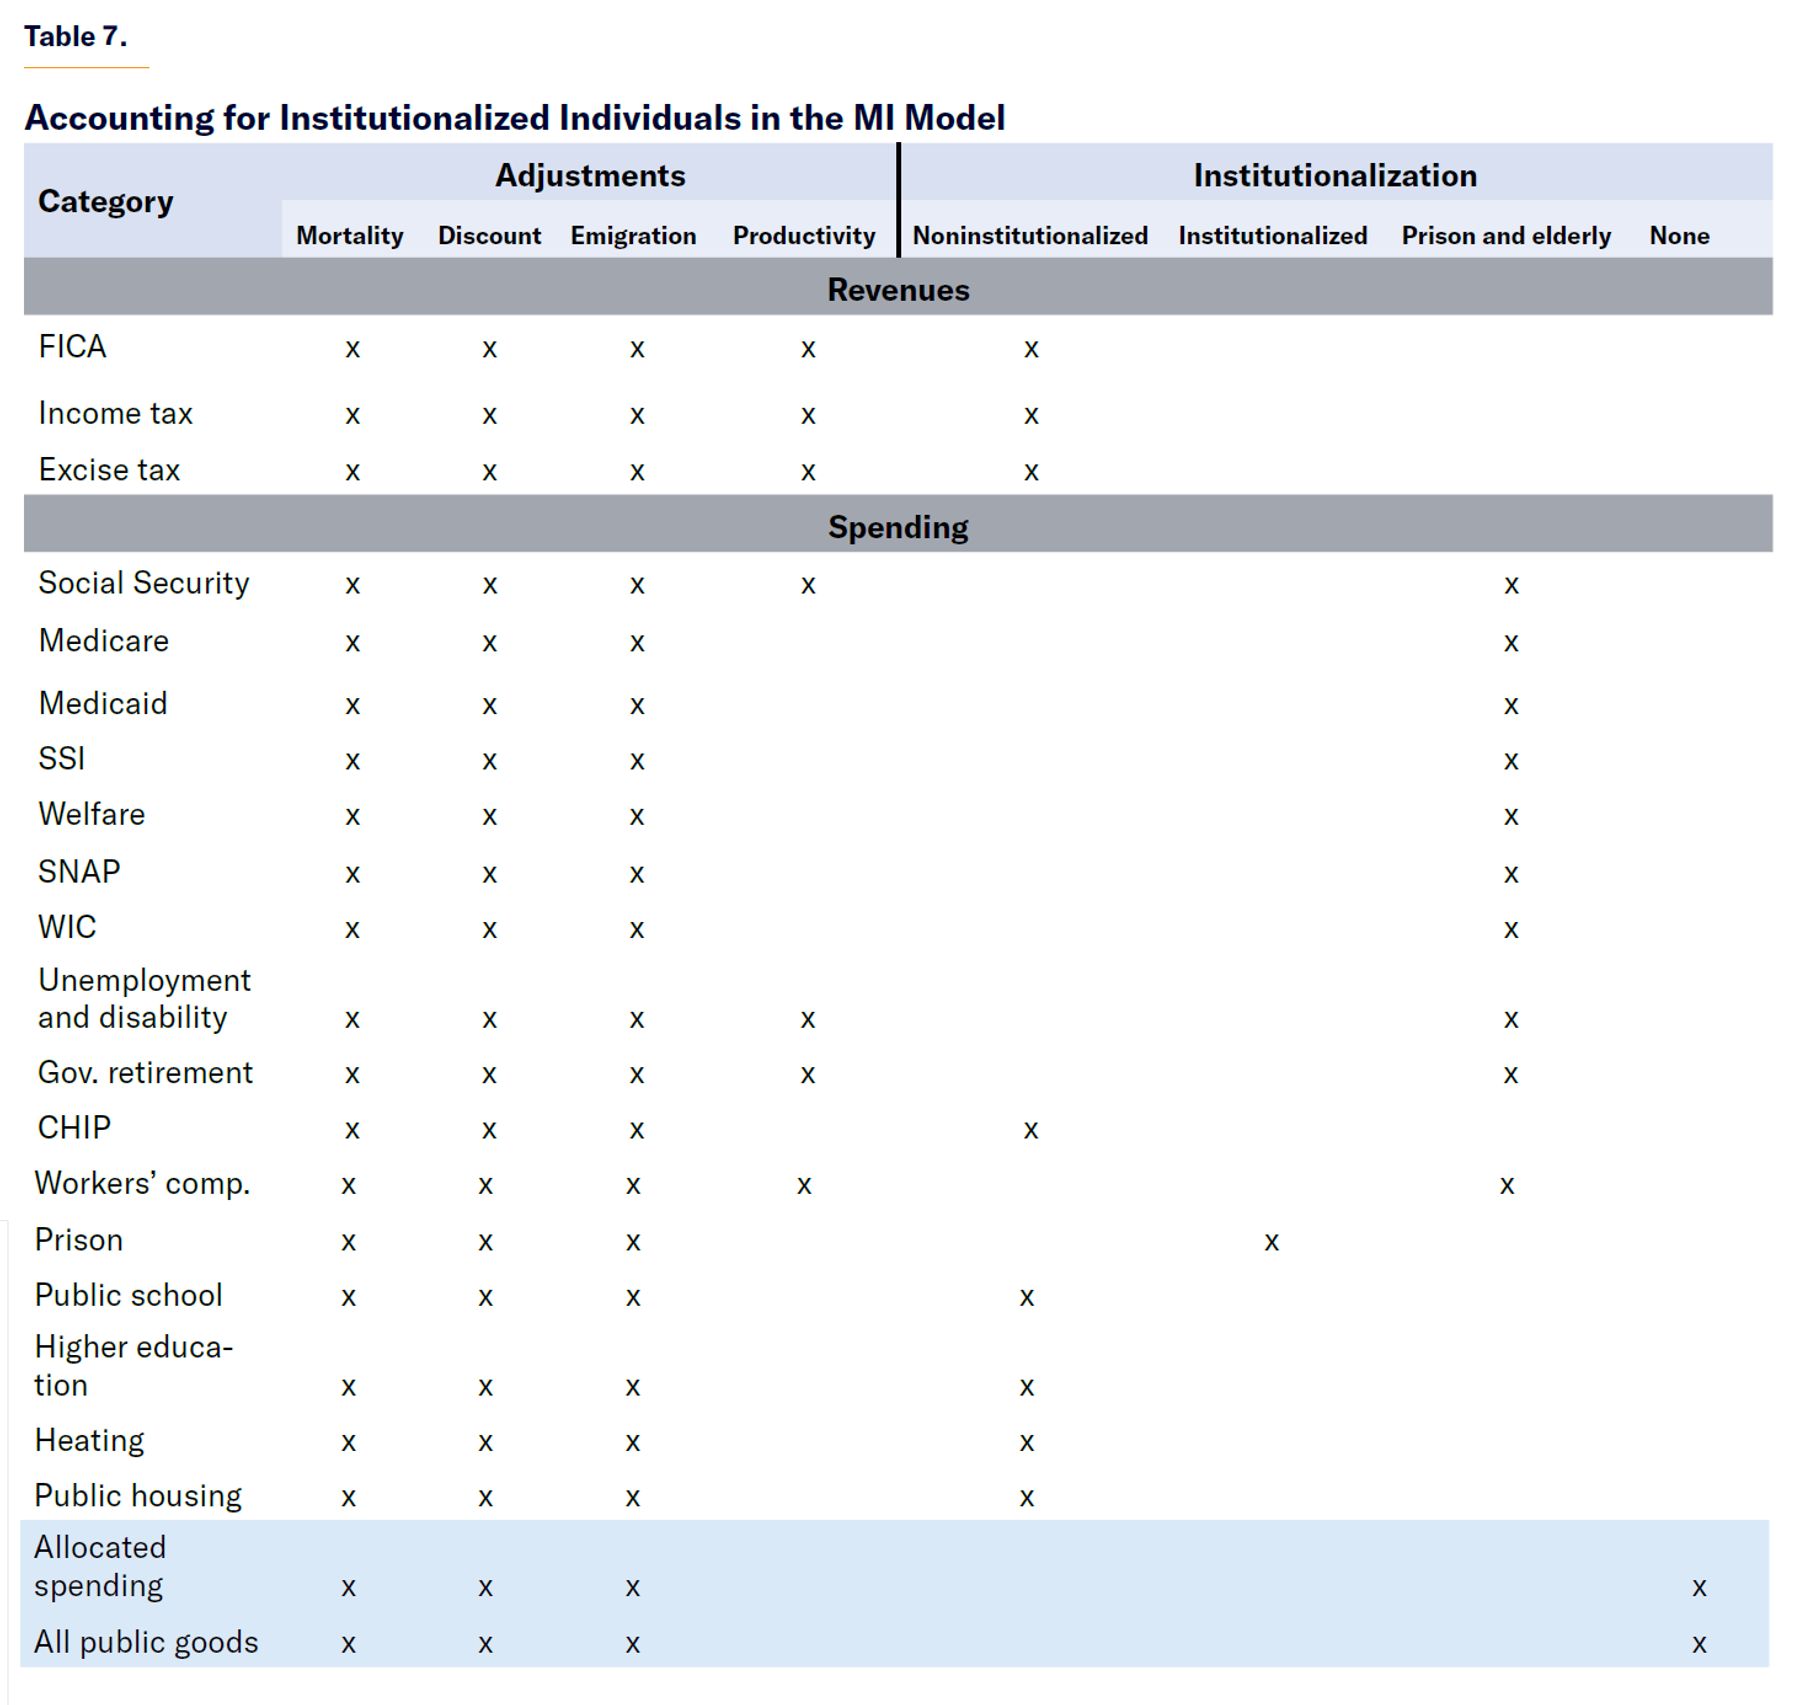
Institutionalization
Most values are adjusted downward or upward, based on the institutionalization rate of the population because CPS surveys only the noninstitutionalized population. The institutionalized population is assumed to be in a nursing home or health-care facility if they are under the age of 15 or over the age of 60, while those 15–59 are assumed to be imprisoned. Therefore, the average taxes paid must be adjusted downward by 1% if, for example, 1% of the population is institutionalized. This is because I assume that institutionalized individuals do not pay taxes (or receive most benefits, unless they are retired and do receive entitlements). Other benefits, such as Medicare, are adjusted upward by the institutionalization rate over the age of 60 but downward under 60, since nursing-home residents can receive Medicare but prisoners cannot. Table 7 shows which benefits are adjusted by each measure.
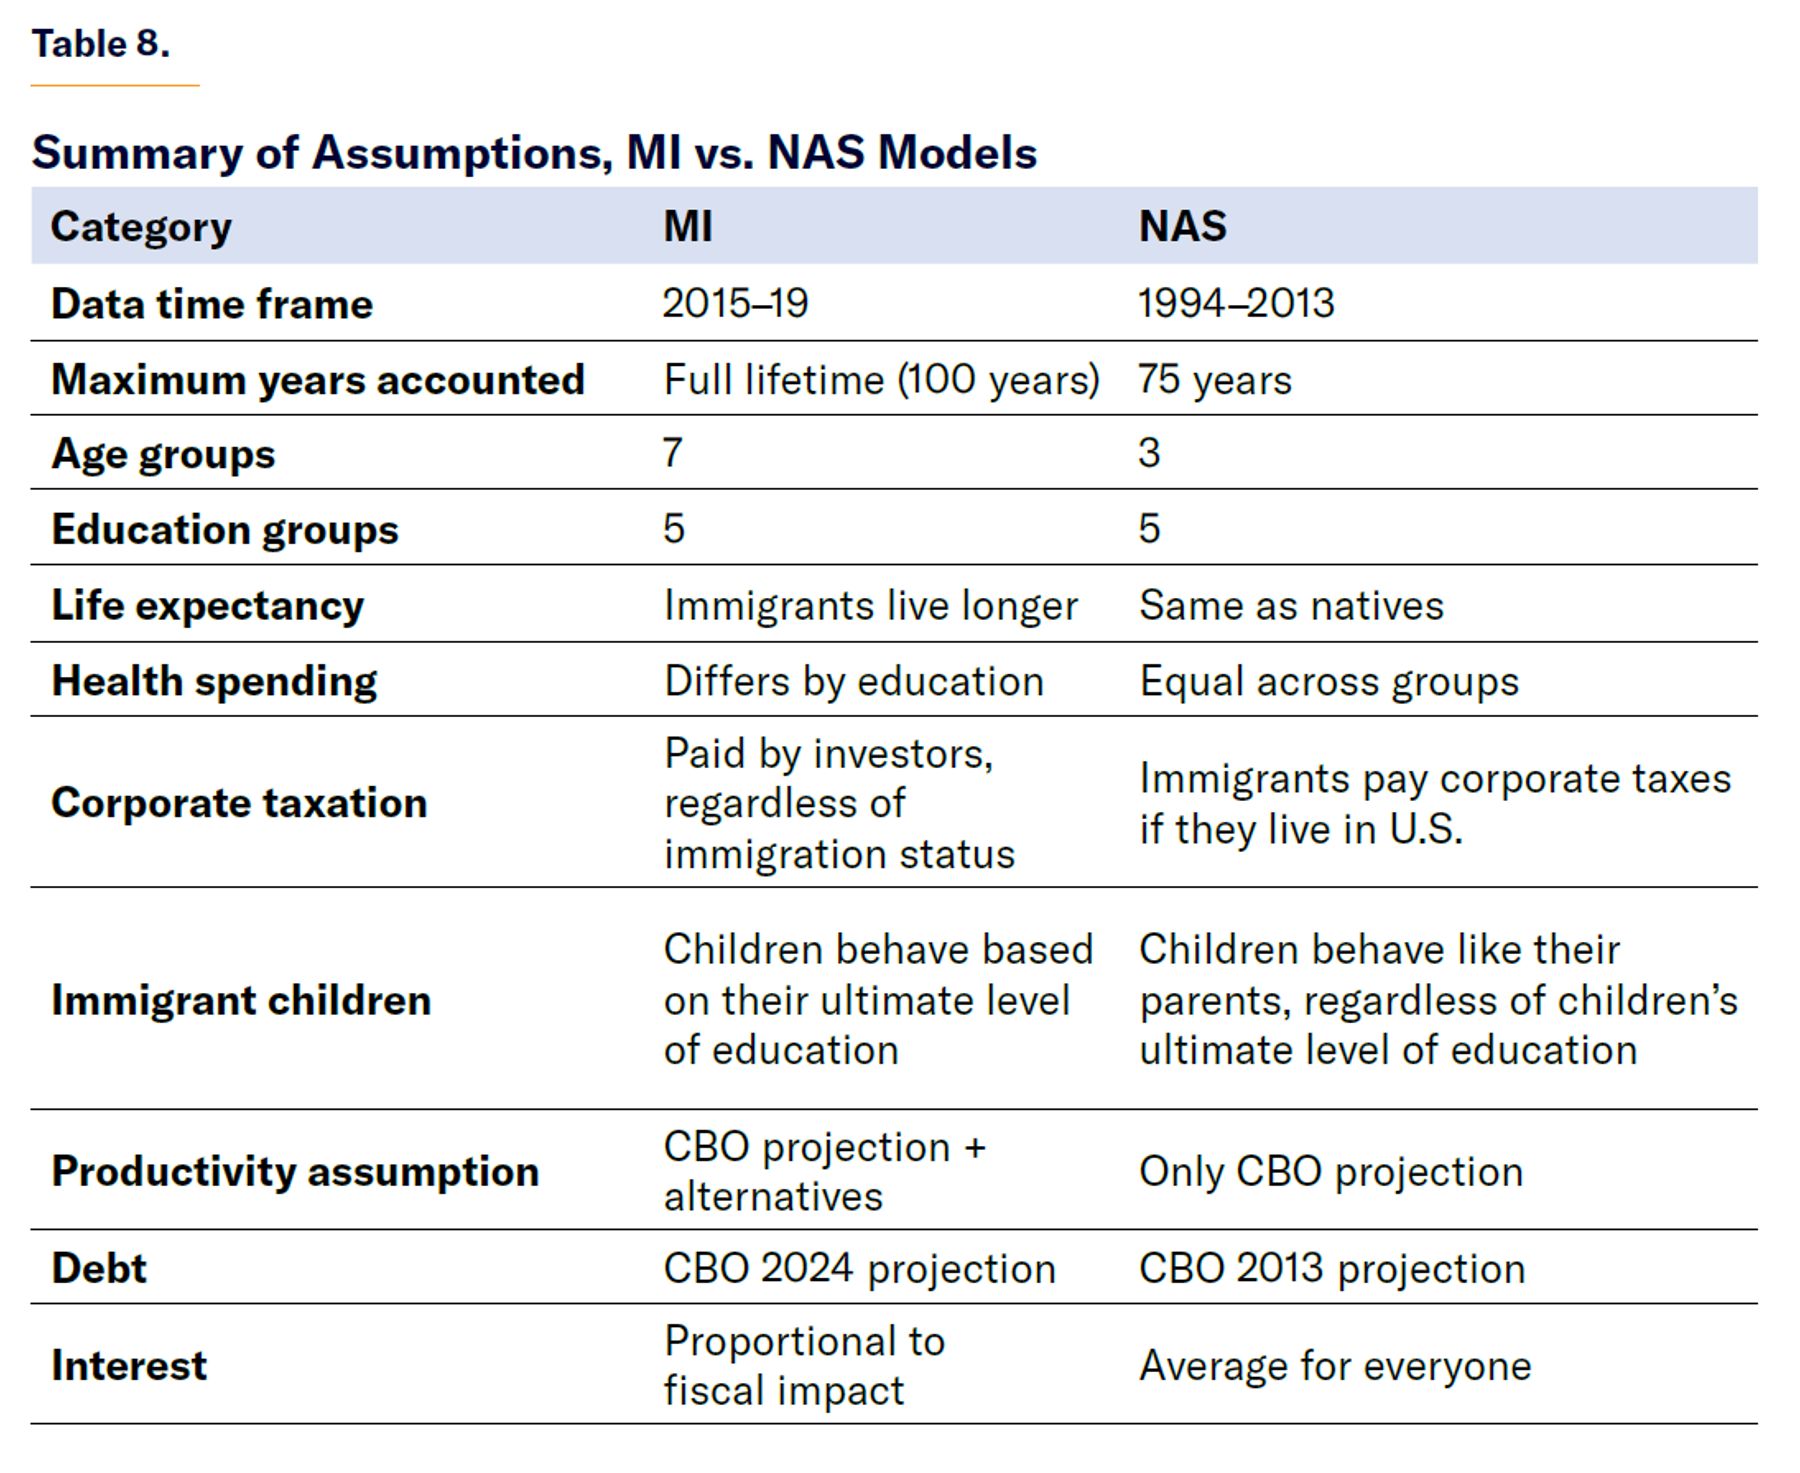
Summary of Assumptions
In conclusion, Table 8 presents a snapshot of the various methodological assumptions made by this report and the earlier NAS model.
Part II. Main Scenario Description and Example
The preferred scenario in this report for estimating the long-term impact of immigration assigns the average cost of public goods to immigrants. This is the best method because a new immigrant (or, for that matter, an American-born child) will not lead to increased national defense spending or research spending immediately; but over time, he will enable the federal government to grow this spending simply with a larger labor pool and economy. Other scenarios are included in Appendix B.
For example, given military recruitment struggles, we may reasonably assume that if the eligible pool of citizens expanded, more recruits would fill the ranks; and that would eventually result in increased military spending. This is desirable from the perspective of the U.S. government but does represent a fiscal cost. Real military spending per capita is higher[31] today than during the 1980s before the Cold War ended, despite a larger population and the defeat of the Soviet Union. Other measures of military investment have also grown in real terms per capita.[32]
Moreover, this assumption does not imply that the government grows as a share of the economy with larger populations; it implies that it stays constant in real terms per person as the population grows. With faster productivity growth or immigrants who expand the per-capita income of the U.S., government spending on public goods will fall as a share of the economy under this maximalist assumption.
This analysis also already discounts future revenues and spending by the emigration rate. Therefore, when an immigrant leaves the U.S., his cost of public goods is also reduced to zero.
To see how the assumptions laid out in the main fiscal-impact scenario work in practice, I consider the following two examples.
Example Calculation 1
Education: Bachelor’s degree
Age at entry: 25–34
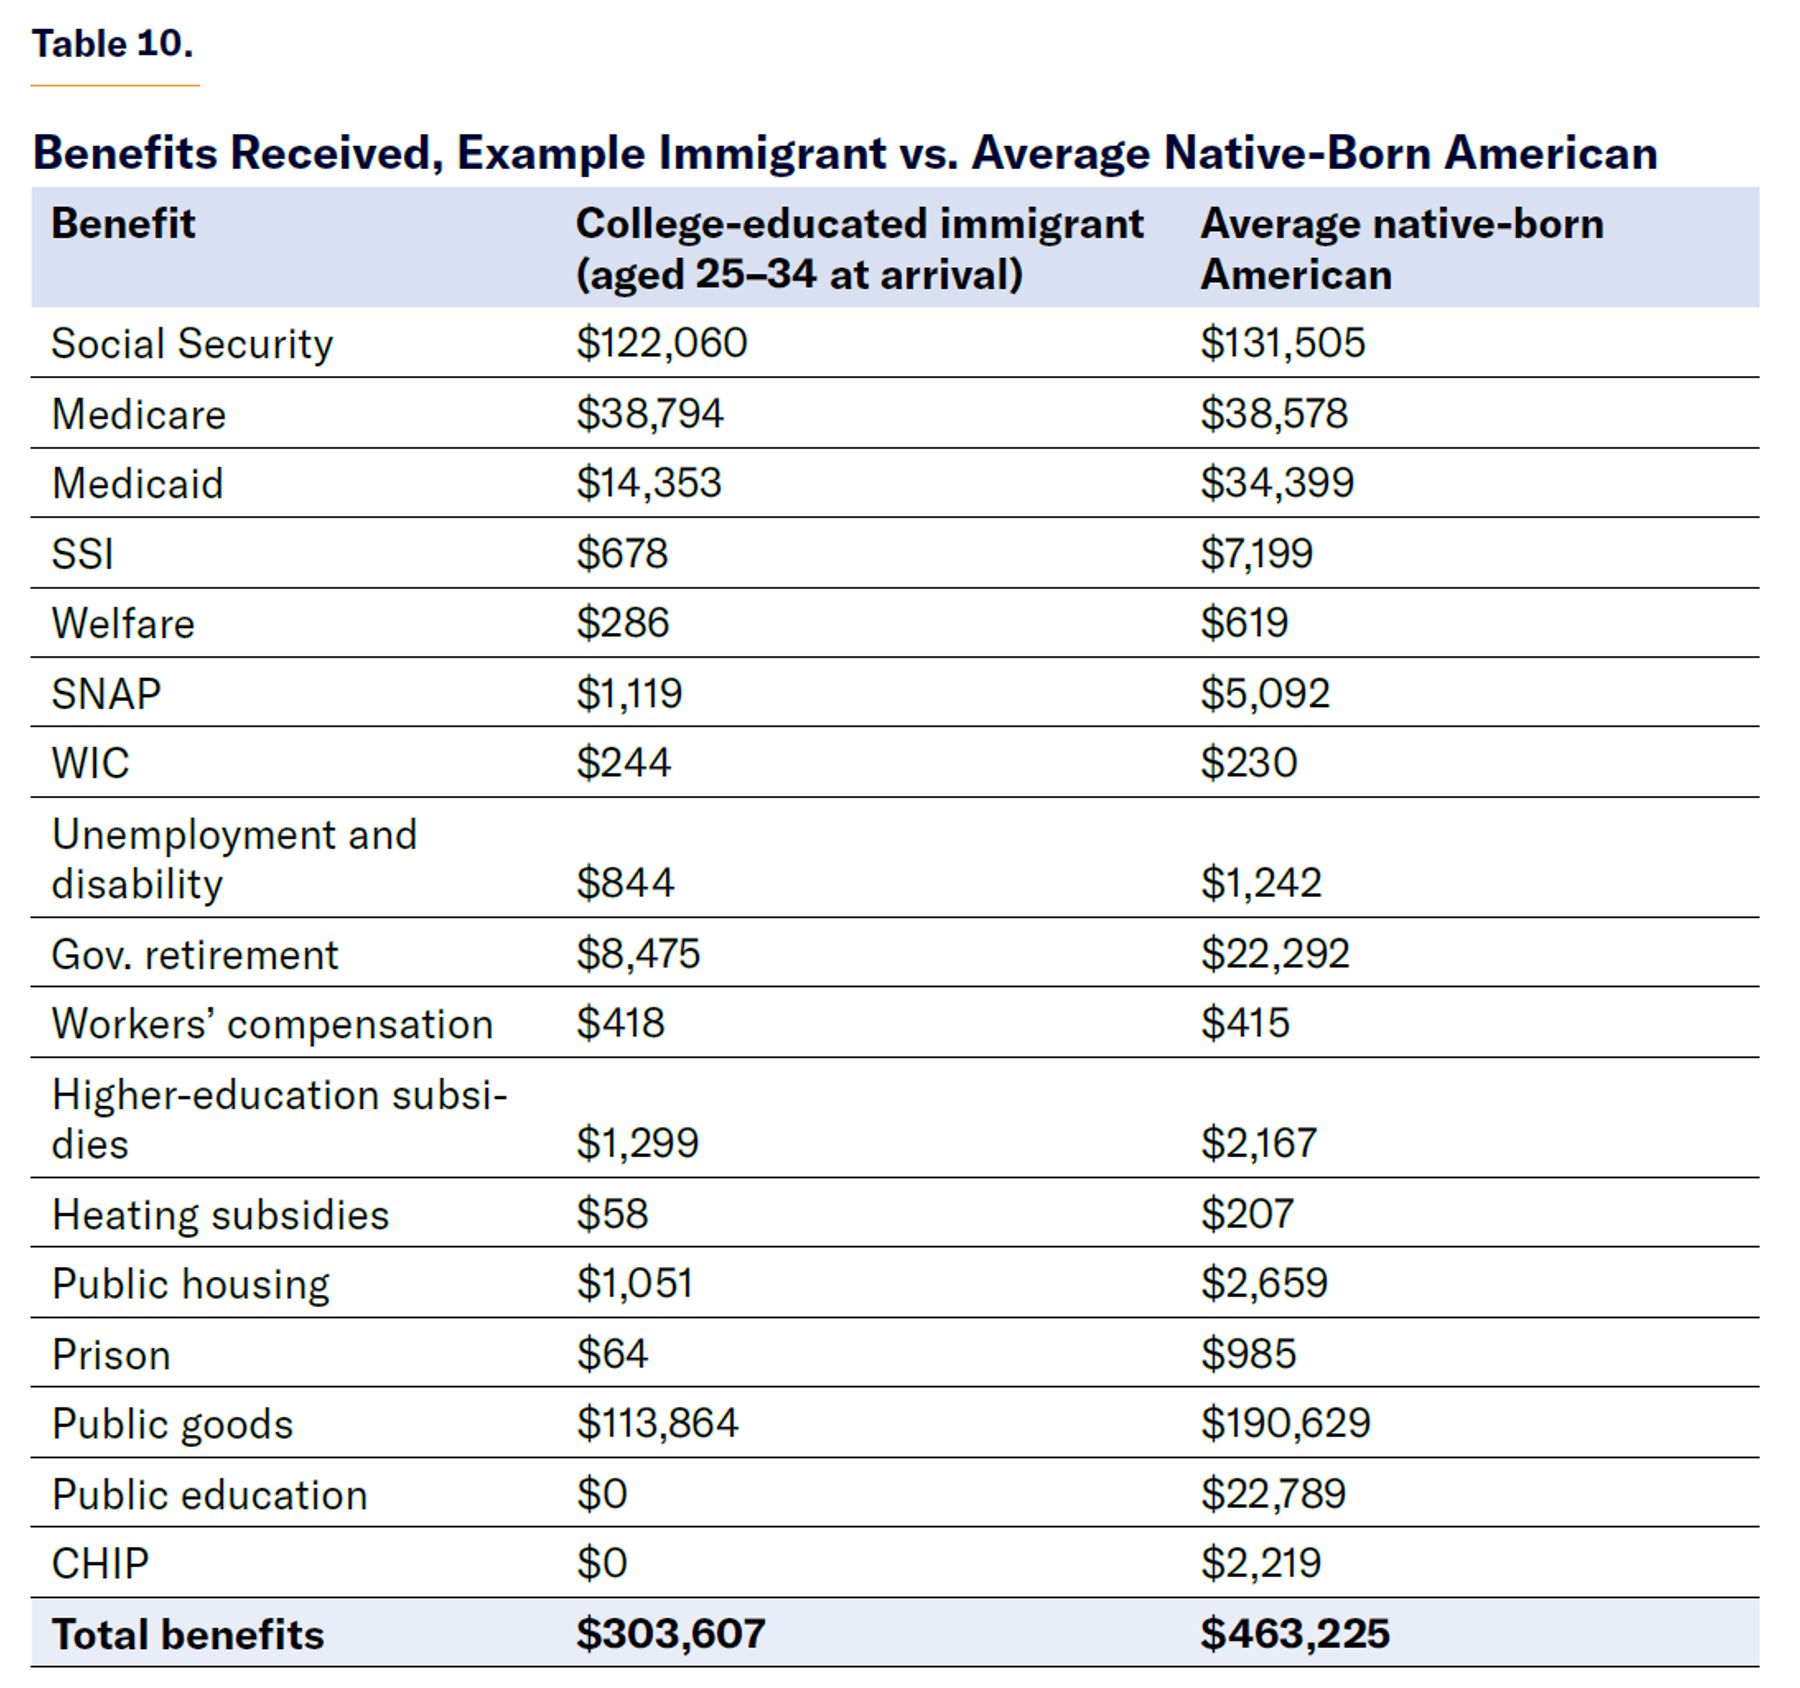
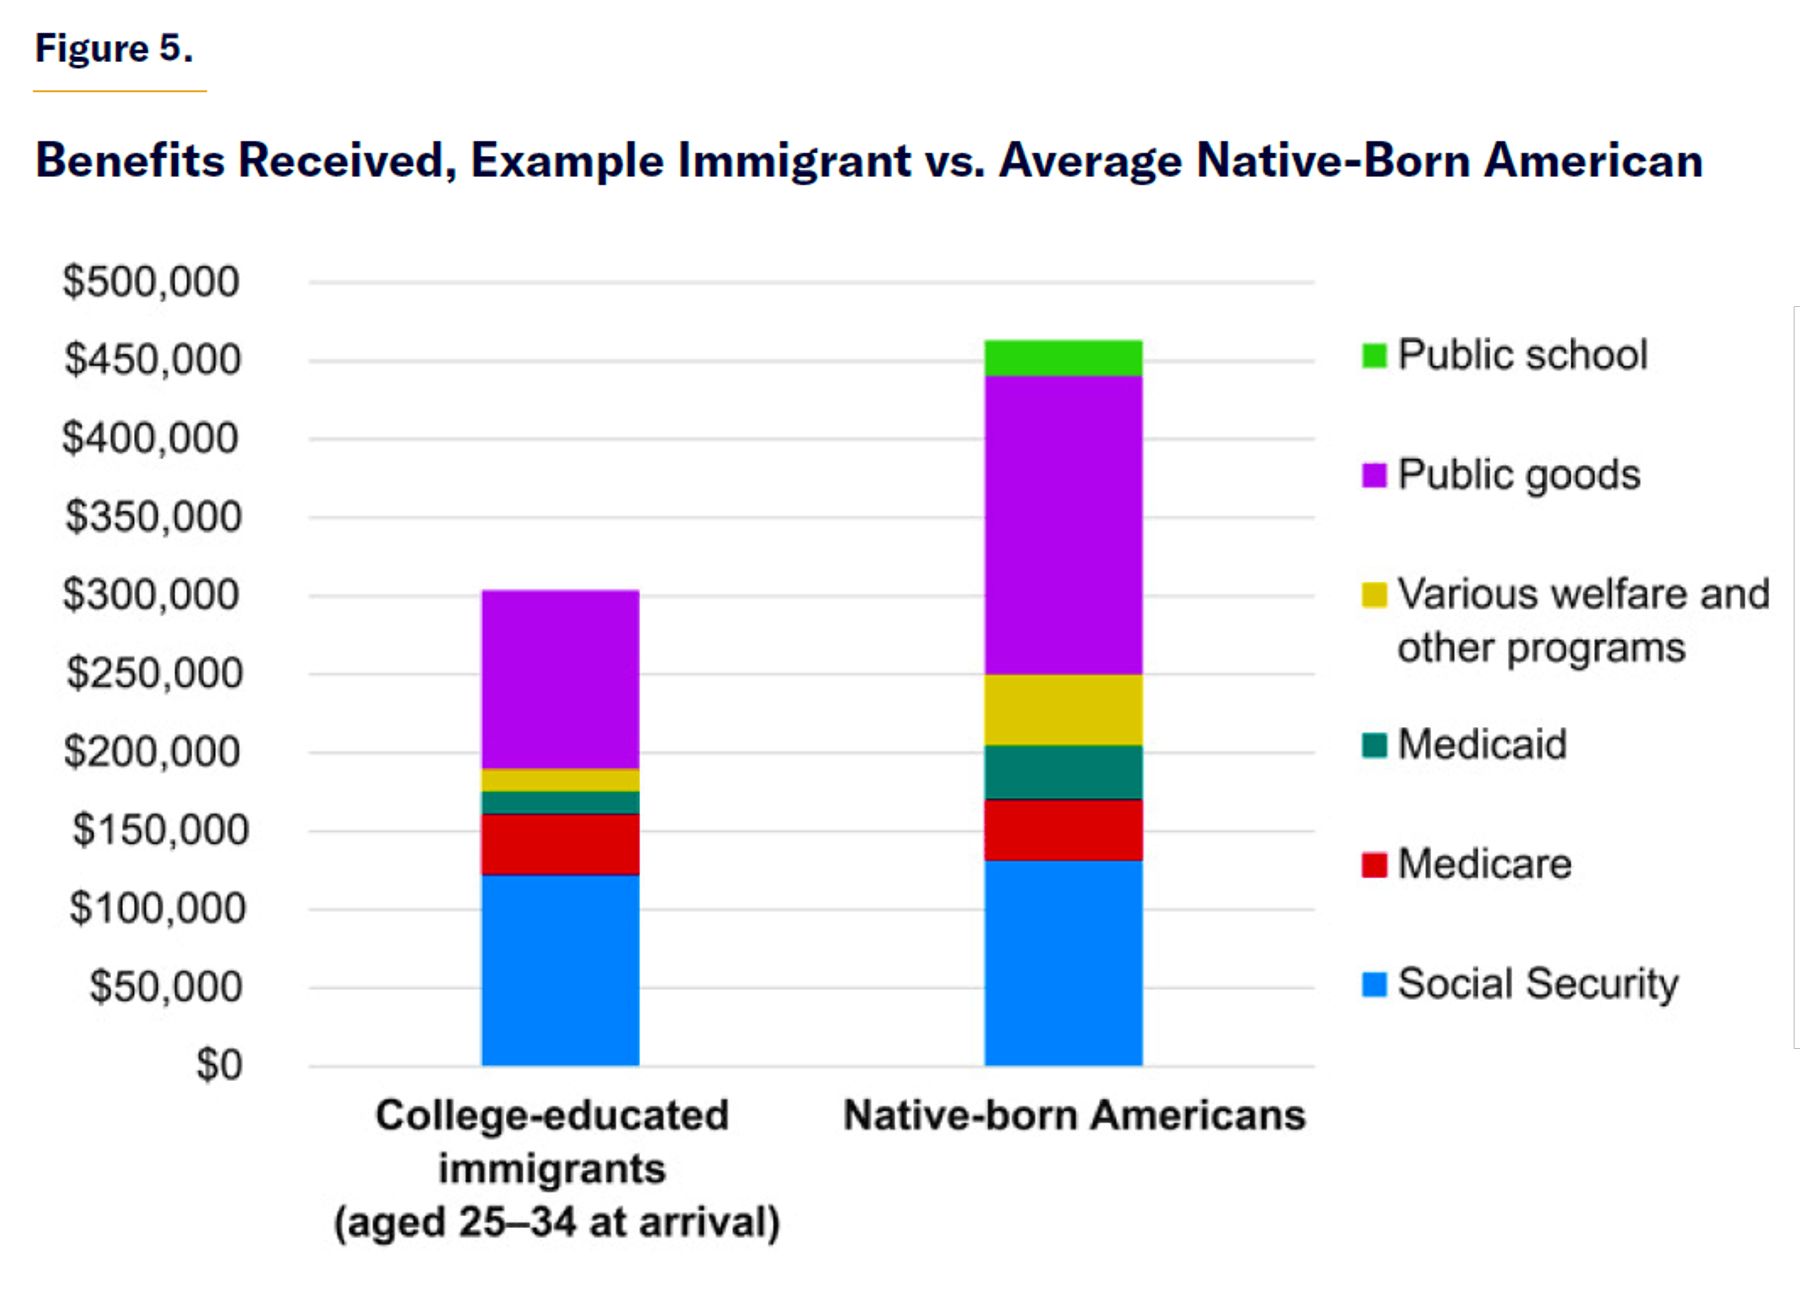
The group of immigrants who have a college education and arrive between the ages of 25 and 34 is a typical profile for an employment-based (EB) immigrant visa applicant or H-1B visa applicant. They are at the beginning of their working years and have already obtained an education abroad, so they do not use any U.S. K–12 public education. Their bachelor’s degree allows most of them to earn an above-average salary throughout their career, which keeps their use of means-tested programs such as Medicaid and SSI to a minimum. The average immigrant in this group arrived in the U.S. at the age of 29. Table 9 and Figure 4 show the tax revenue paid by the representative immigrant and an average native-born citizen, while Table 10 and Figure 5 show the benefits paid out by the government.
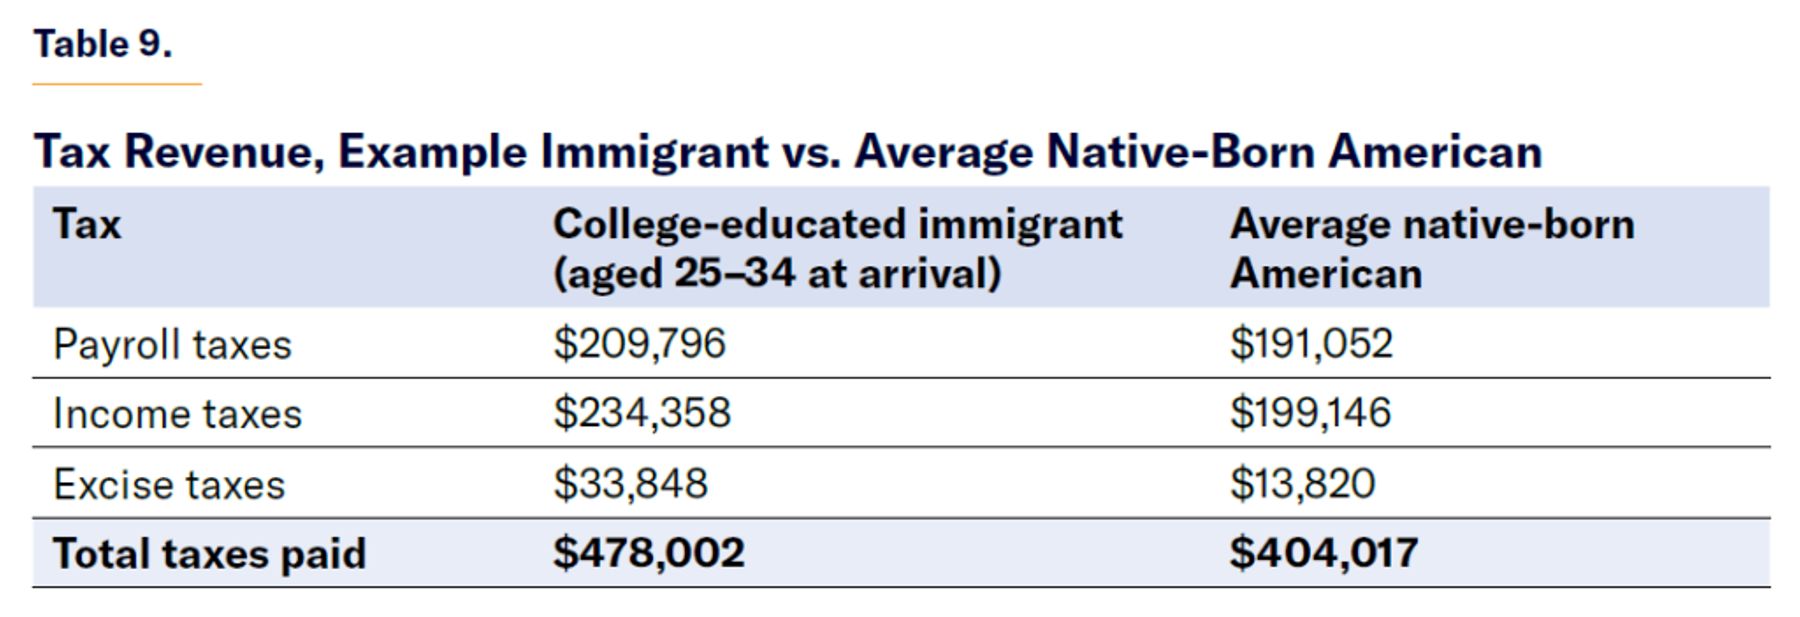
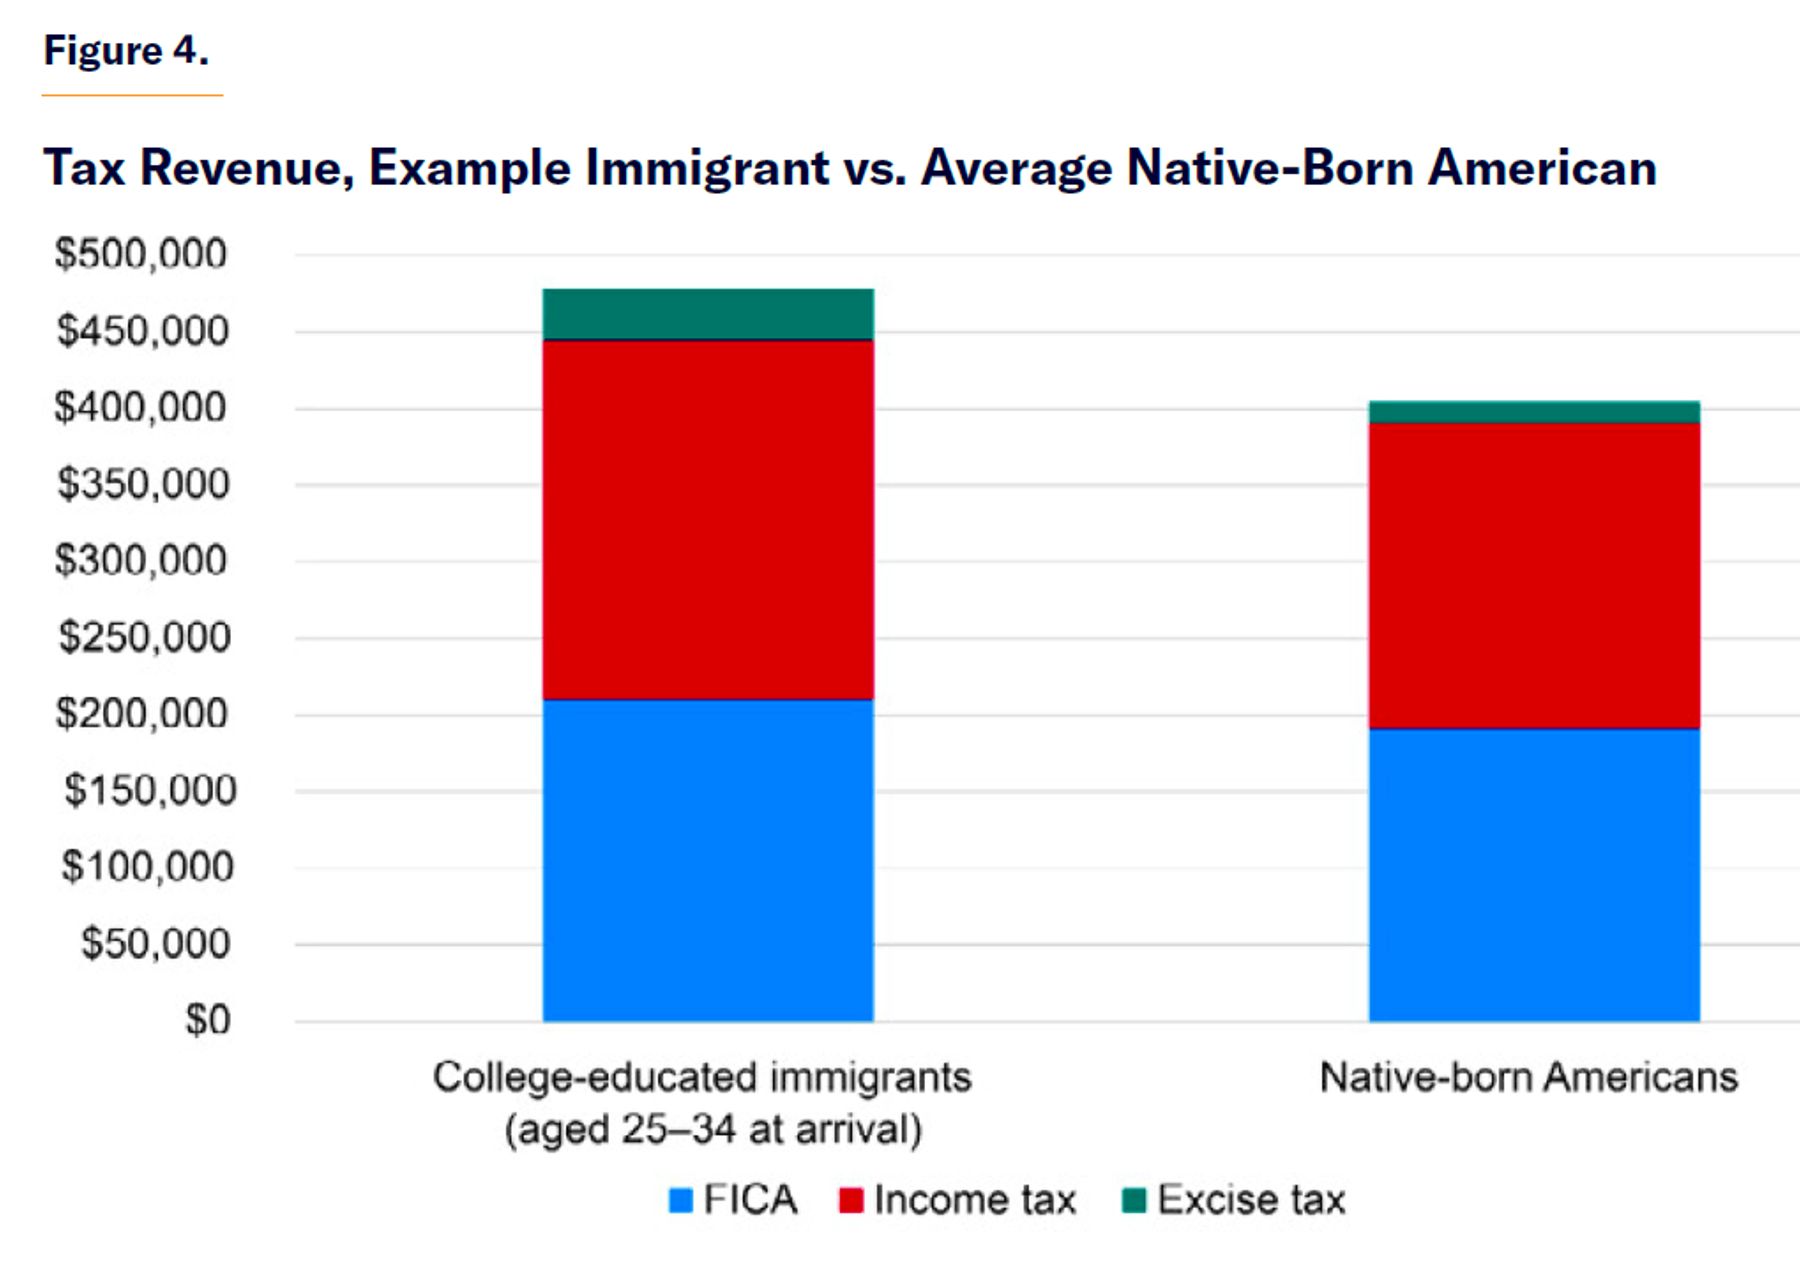
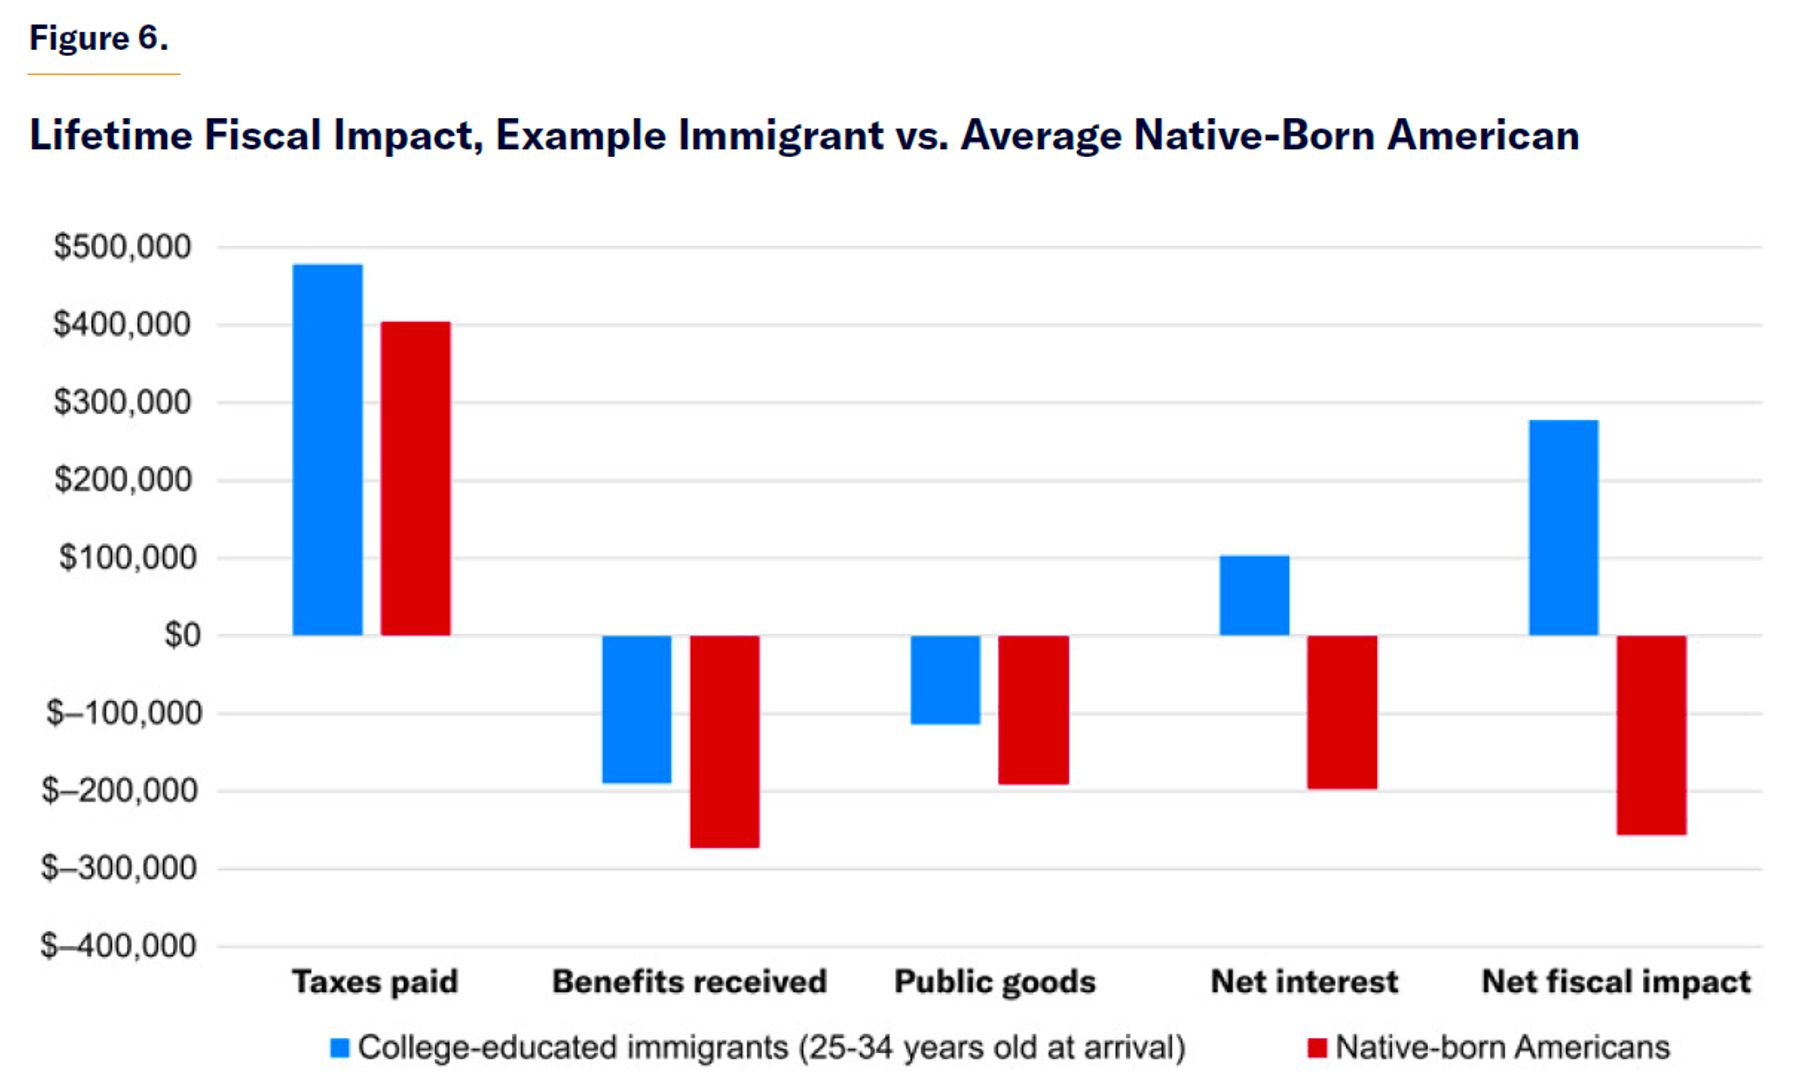
This immigrant, representative of his age and education group, generates a primary surplus of over $174,000 in net present value with which the federal government can avoid issuing additional debt and therefore save on interest. By comparison, the average native-born American (inclusive of all education levels) from birth to death generates a primary deficit in net present value terms of over –$59,000.
Benefit spending drives most of the difference in fiscal impact between these groups. While immigrants in this example do remit larger tax payments than the average native (since not all natives have a college degree), this is just $74,000 in total out of a fiscal-impact difference of about $233,000 ($174,000 – (–$59,000)). The reason this immigrant group receives fewer government benefits is that they come to the U.S., on average, at the age of 29, so they never receive any public education or CHIP, and by having higher earnings, they are much less likely to be on Medicaid or receive SNAP and other welfare benefits. They also consume fewer public goods than natives because they lived for about a third of their life outside the United States.
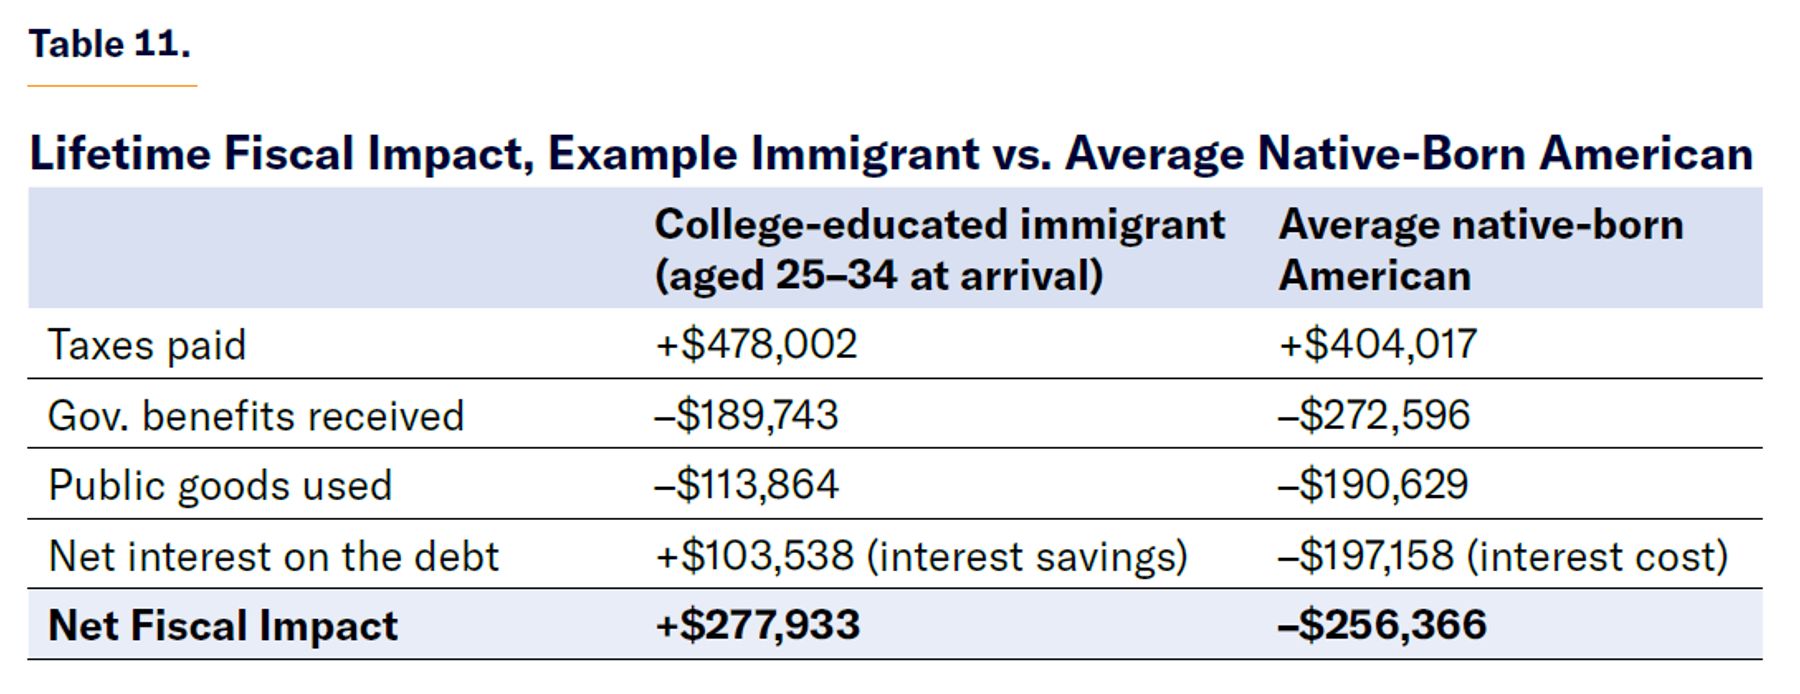
To account for the full costs and benefits of an immigrant and a native person, we must add the cost of the national debt (Table 11 and Figure 6). While natives bear the full burden of past debt and new debt, immigrants bear the burden of new debt only from the year in which they arrived (preventing their entry would not change the current debt level). However, because this immigrant group generates a primary surplus for the government, the average immigrant of this group helps pay down debt, generating negative interest payments that increase their positive fiscal impact.
Example Calculation 2
Education: Less than a high school diploma
Age at entry: 18–24
Now I will consider the group of immigrants most commonly represented among immigrants who entered the country unlawfully: immigrants without a high school diploma who arrive in the U.S. between the ages of 18 and 24. Their low level of education means that their earning potential is, on average, very small; but because they are young adults, the U.S. government will not need to pay for their education. Additionally, since many immigrants in this category entered the country unlawfully, they might not be eligible to receive most government benefits. Immigrants who did not complete high school are also much more likely to work than native-born citizens of the same level of education, so that may compensate for their lower earnings.
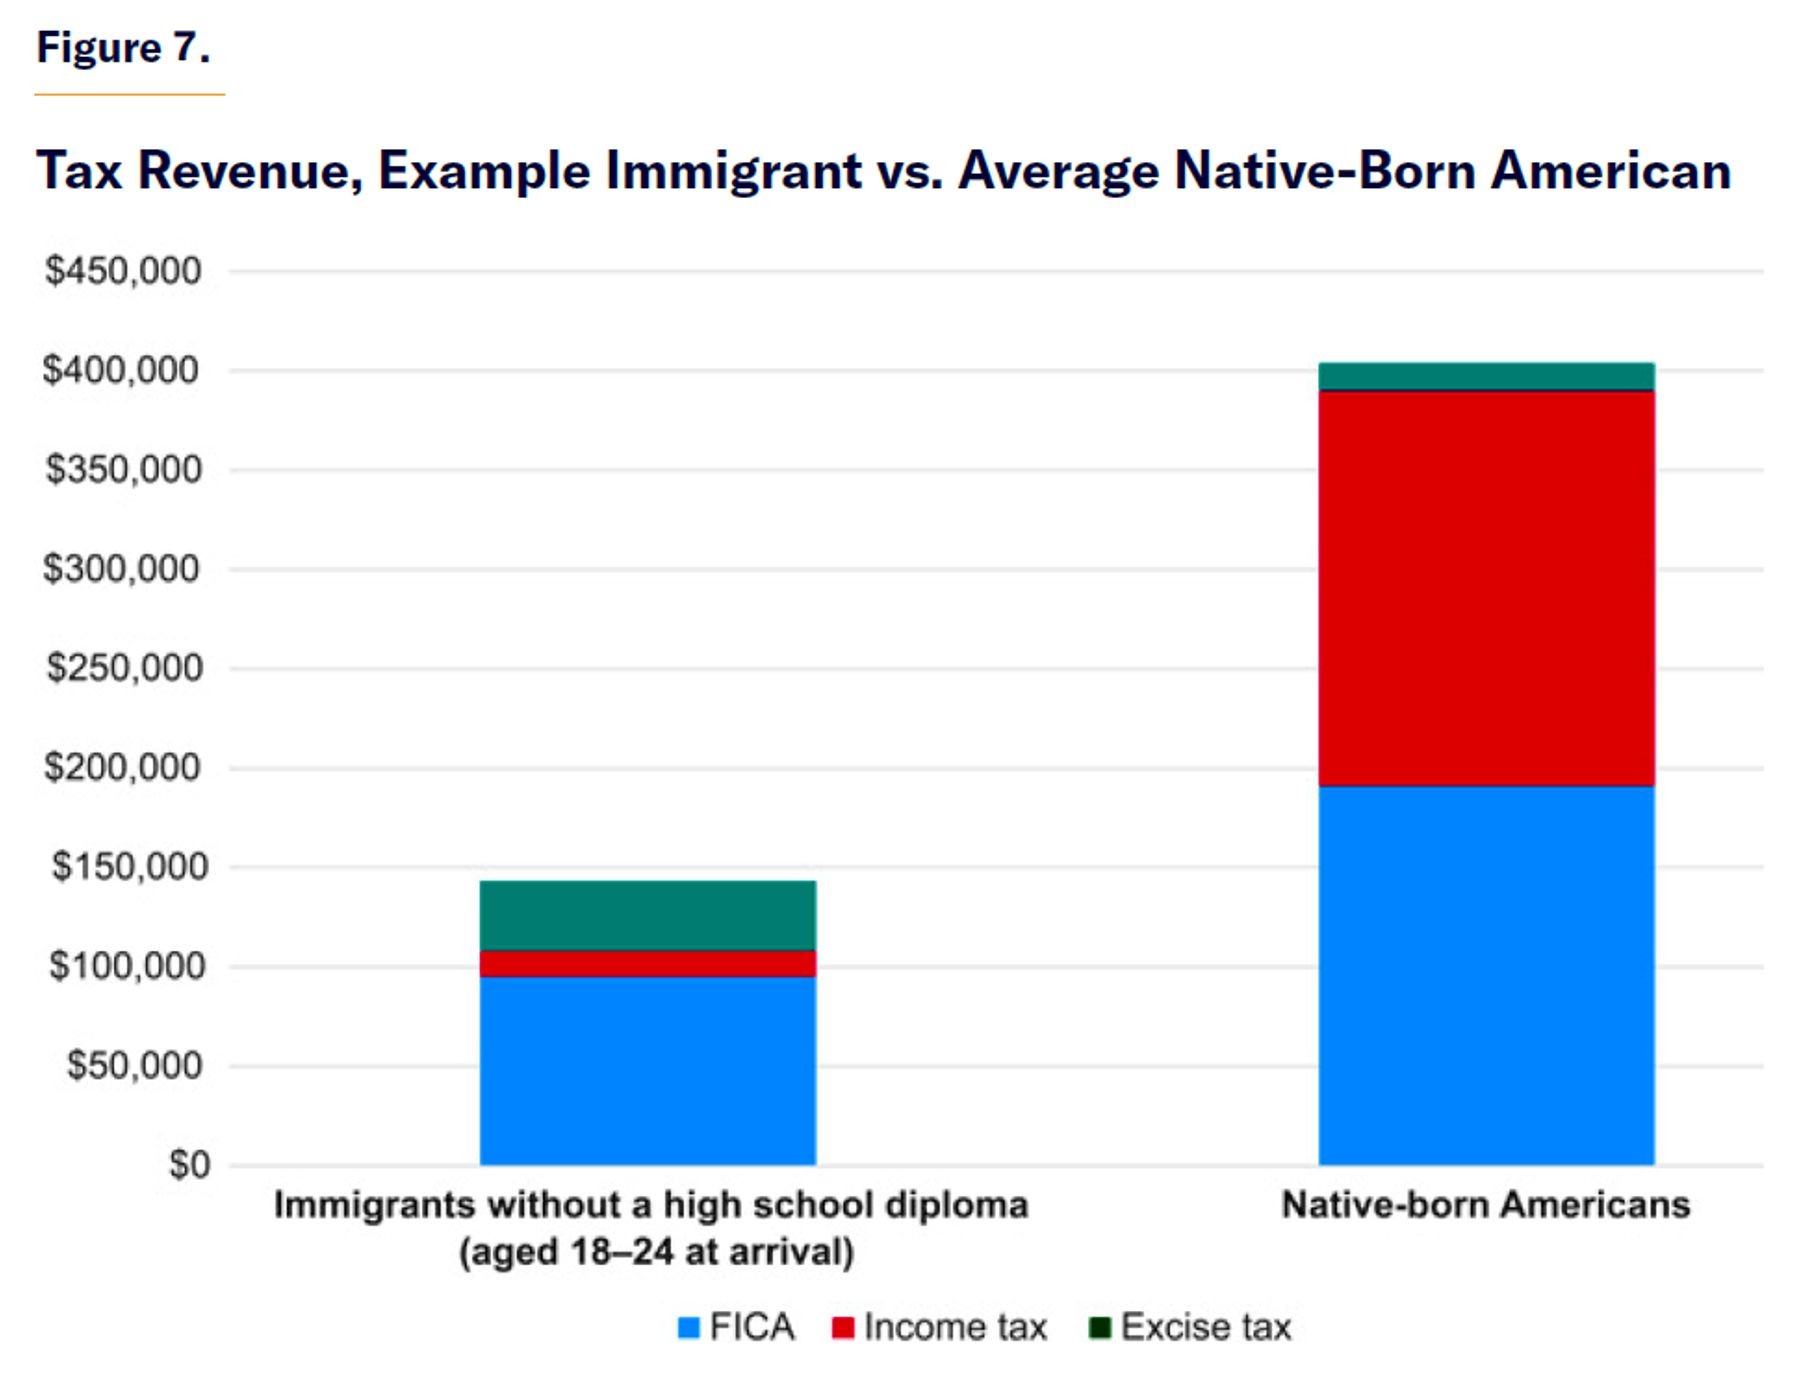
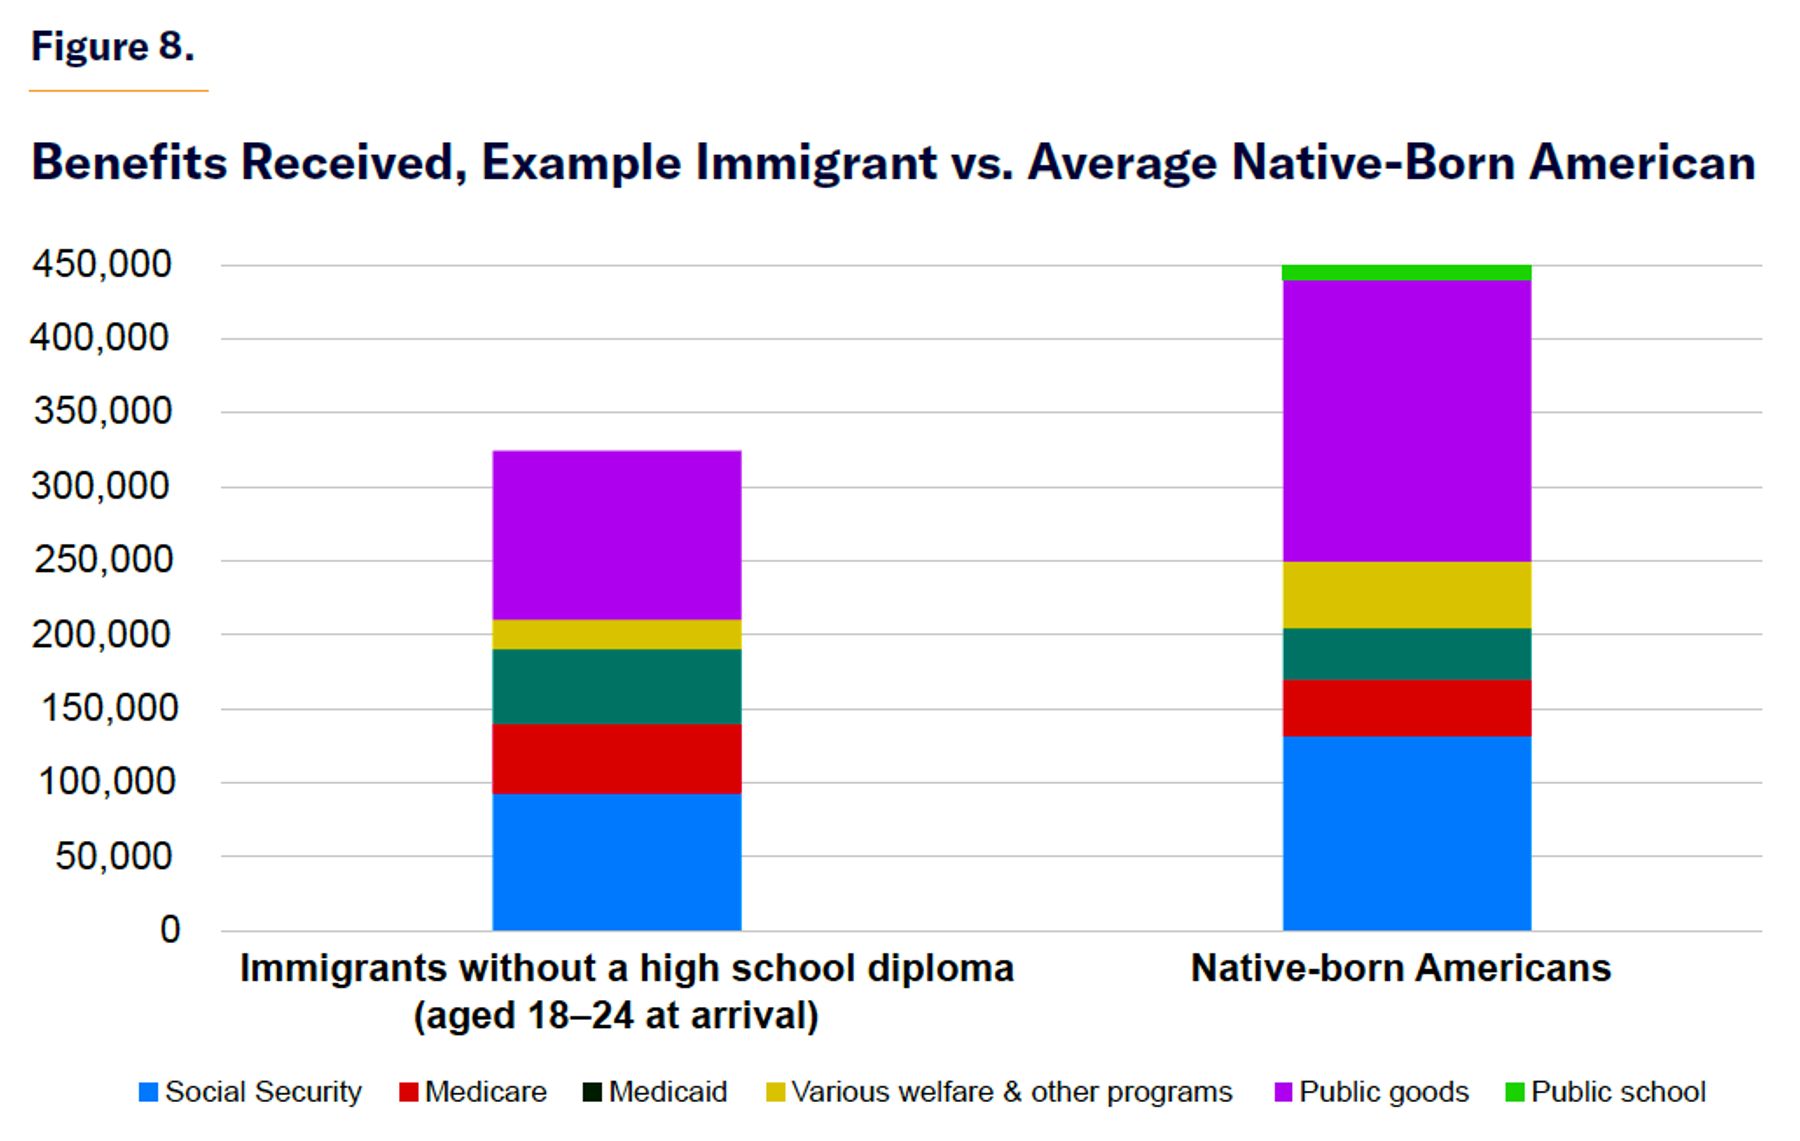
Table 12 and Figure 7 show the tax revenue paid by the representative immigrant of this group and average native-born citizen. Table 13 and Figure 8 show the benefits paid out by the government.
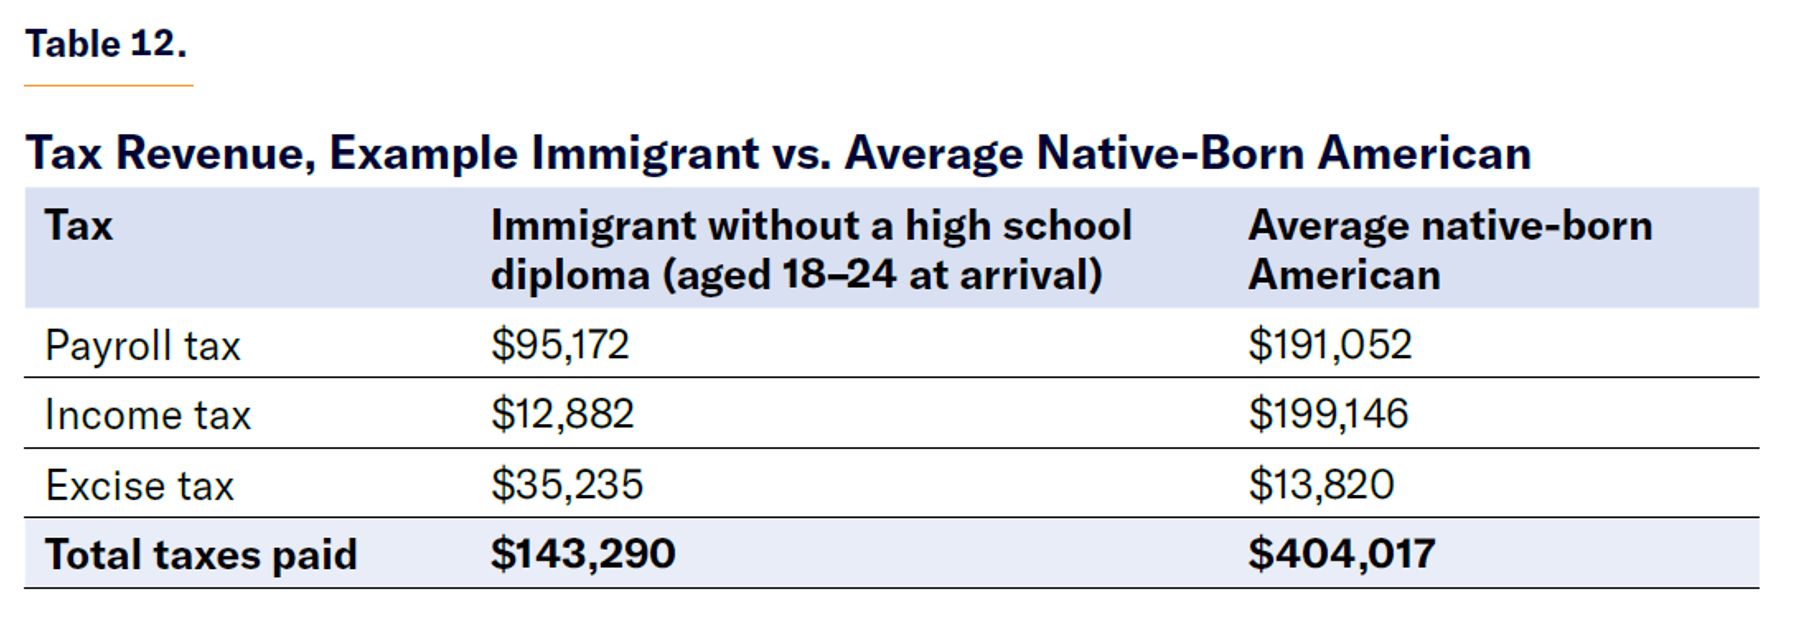
This immigrant group pays barely more than a third of what an average native pays in taxes over his lifetime. However, these immigrants pay more in excise taxes. This is because, on average, people with lower levels of education purchase more alcohol and tobacco products,[33] paying more to the federal government in “sin” taxes.
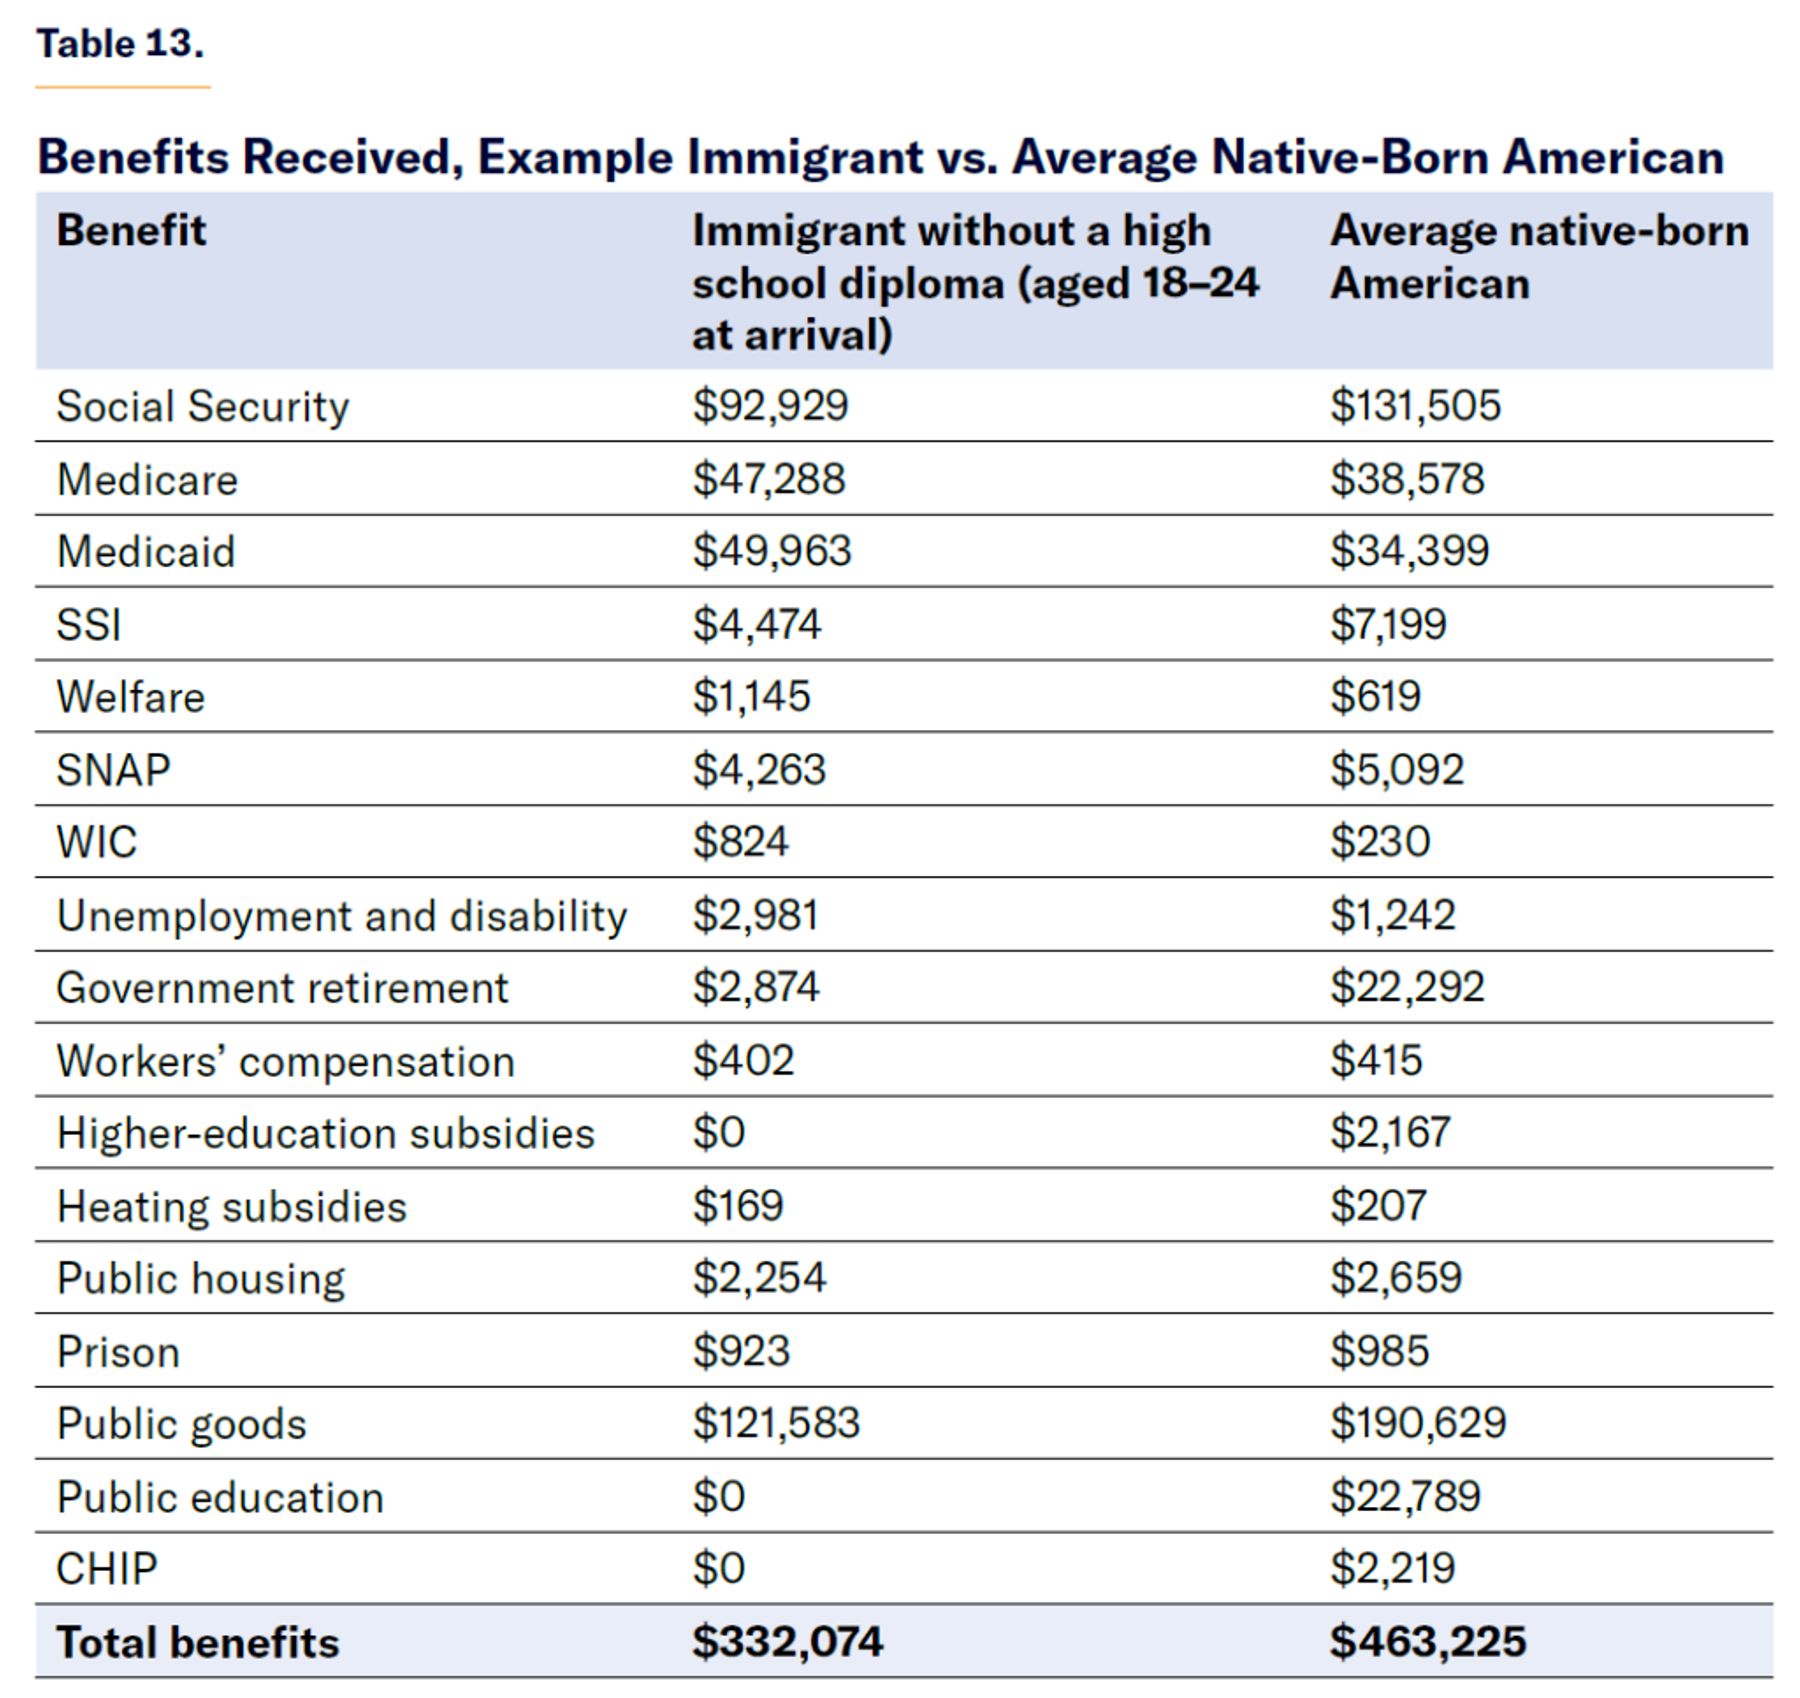
Even low-skilled immigrants cost less to the government over their lifetime than native-born Americans, likely because of eligibility reasons and because low earnings also result in lower Social Security benefits.[34] In this case, an average immigrant with less than a high school diploma who enters the U.S. at age 21 receives $332,000 in benefits, including public goods, relative to the $463,000 that an average native-born American receives.
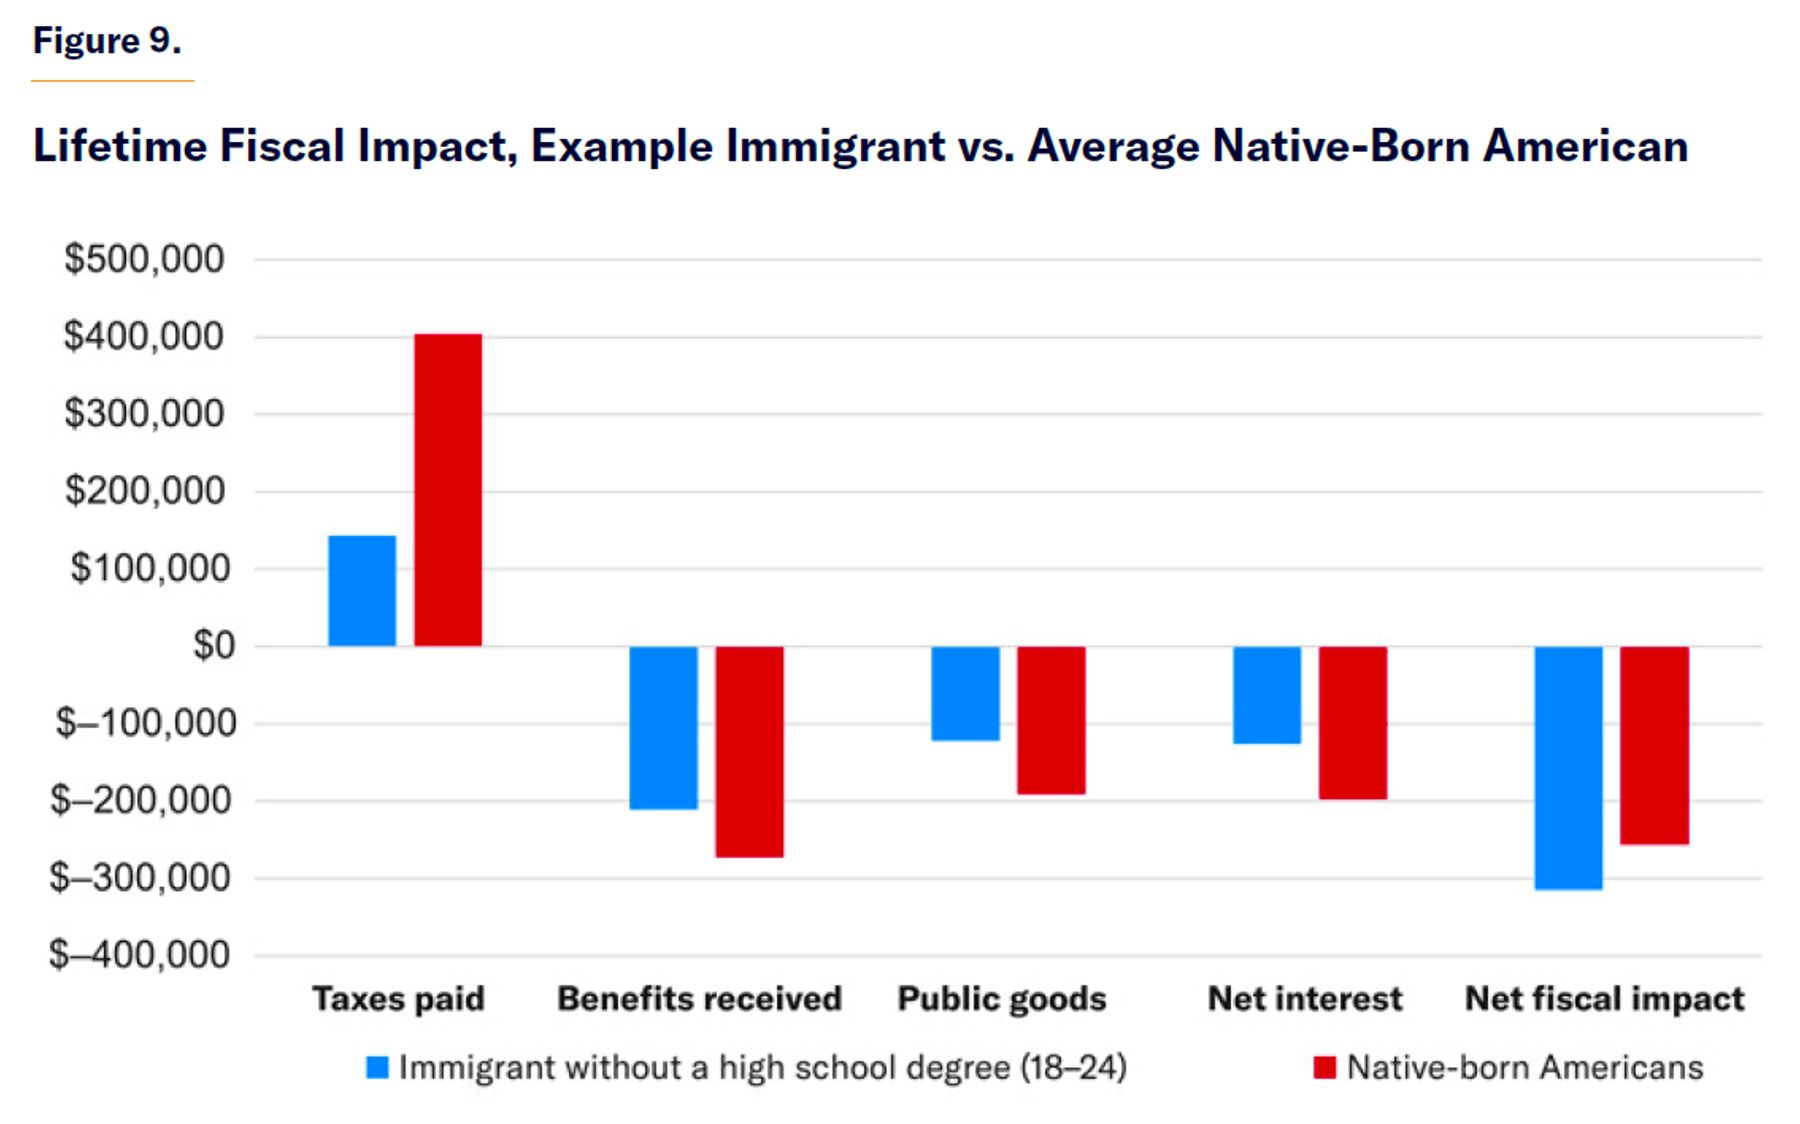
But the immigrants in this group also pay much less in taxes and expand the budget deficit by much more than a native-born person (Table 14 and Figure 9). Consequently, when we add interest on the debt, they accrue more interest than other immigrant groups (though still not as much as the native-born, who are held responsible for past debt).
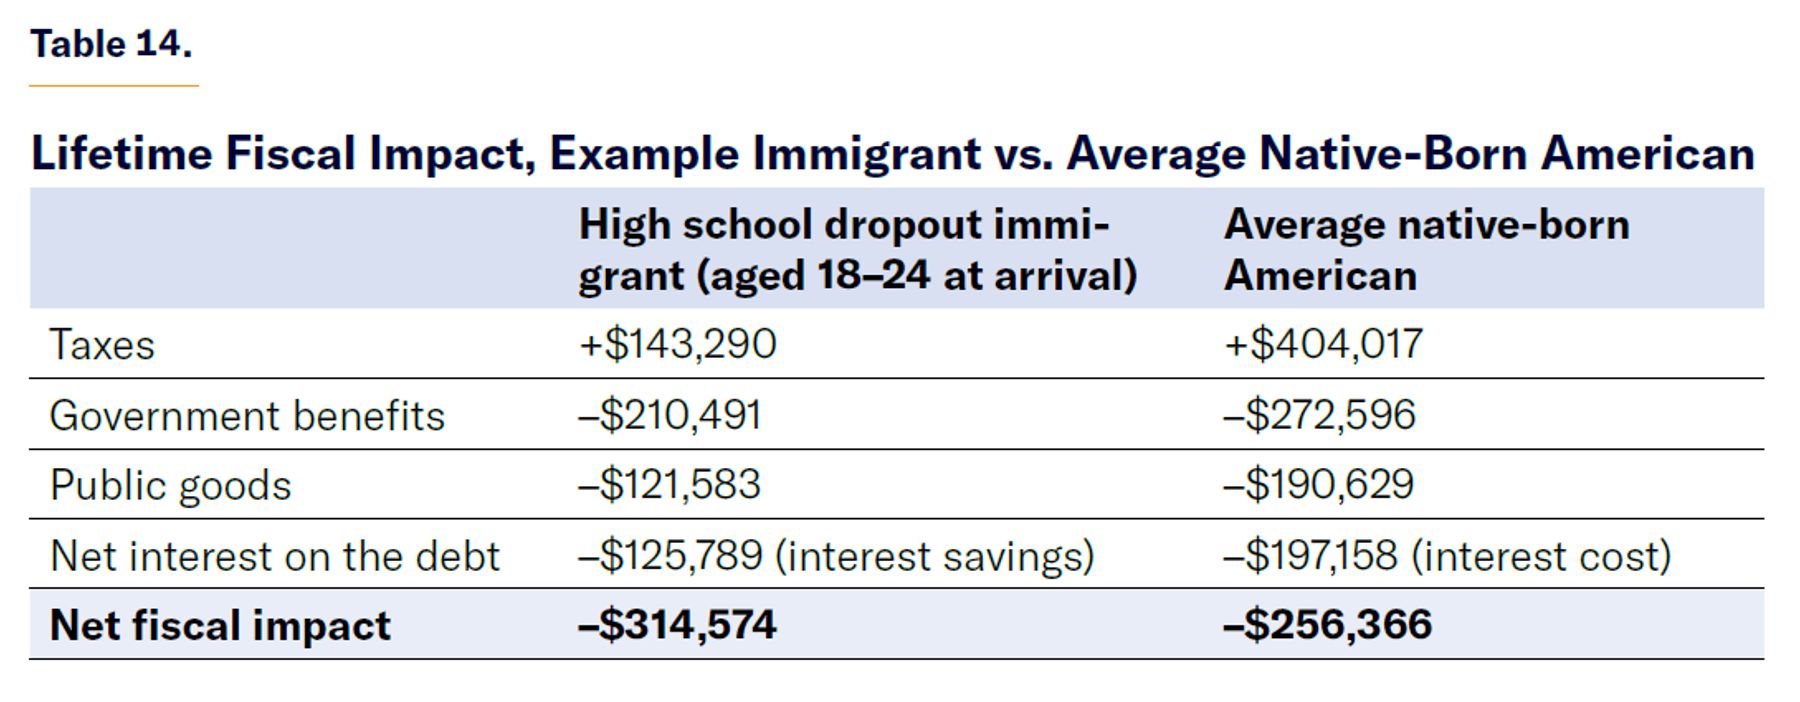
After accounting for interest on the debt, the average immigrant who came to the U.S. aged 18–24 without a high school diploma costs the federal government over $314,000 over his lifetime, while the average native-born person costs a net $256,000 over his lifetime.
Therefore, despite legal restrictions on benefits for legal immigrants and outright bans for unlawful immigrants, the large difference in taxes paid between native-born Americans and immigrants without high school diplomas, even those of a very young age, results in a net fiscal cost—i.e., every additional immigrant aged 18–24 without a high school diploma is expected to worsen the fiscal outlook of the United States.
Part III. Fiscal Impact Estimates
Next, I describe the fiscal impact of the preferred scenario calculated for this report, as described in Part II. The “absolute impact” tables below show the actual fiscal impact of each person or category; the “impact relative to natives” tables show the difference between the absolute impact of each immigrant group and the absolute impact of the average native-born person. The average immigrant is the weighted average of each immigrant category based on the 2015–19 adult immigrant population.
As we will see, younger and more educated new immigrants pay more in taxes and receive fewer government benefits than immigrants who are older when they first arrive in the U.S. or receive less education. But this principle does not hold for every age group. Immigrants aged 18–24 are more fiscally beneficial than those who came to the U.S. as children. This is because of the effect of being in the U.S. for fewer nonworking years (using fewer public services, especially as minors); and because of coming to the U.S. at the start of their prime working years, which get discounted at a lower rate.
Among education groups, the only case in which more education means a more detrimental fiscal impact is for the elderly. Among immigrants who first come to the U.S. after age 65, those with a bachelor’s degree have a more negative impact on the country’s fiscal health than those with only some college education. CMS estimates that those with just some college education (but no degree) have the lowest cost for government health programs; thus these immigrant retirees cost less than those with a college degree. Additionally, because they earned less income in the little time they worked, they also qualify for lower Social Security benefits, outweighing their slightly smaller tax payments.
Under the absolute impact scenario (Table 15), most immigrants cost the federal government hundreds of thousands of dollars. All immigrants who did not complete high school cost the federal government $300,000 or more, and all immigrants without a bachelor’s degree have a negative fiscal impact. Yet the average immigrant is still a net fiscal contributor by $10,000 because some immigrant groups, the so-called high-skilled immigrants, reduce the deficit by much more than the increase caused by the low-skilled immigrants.
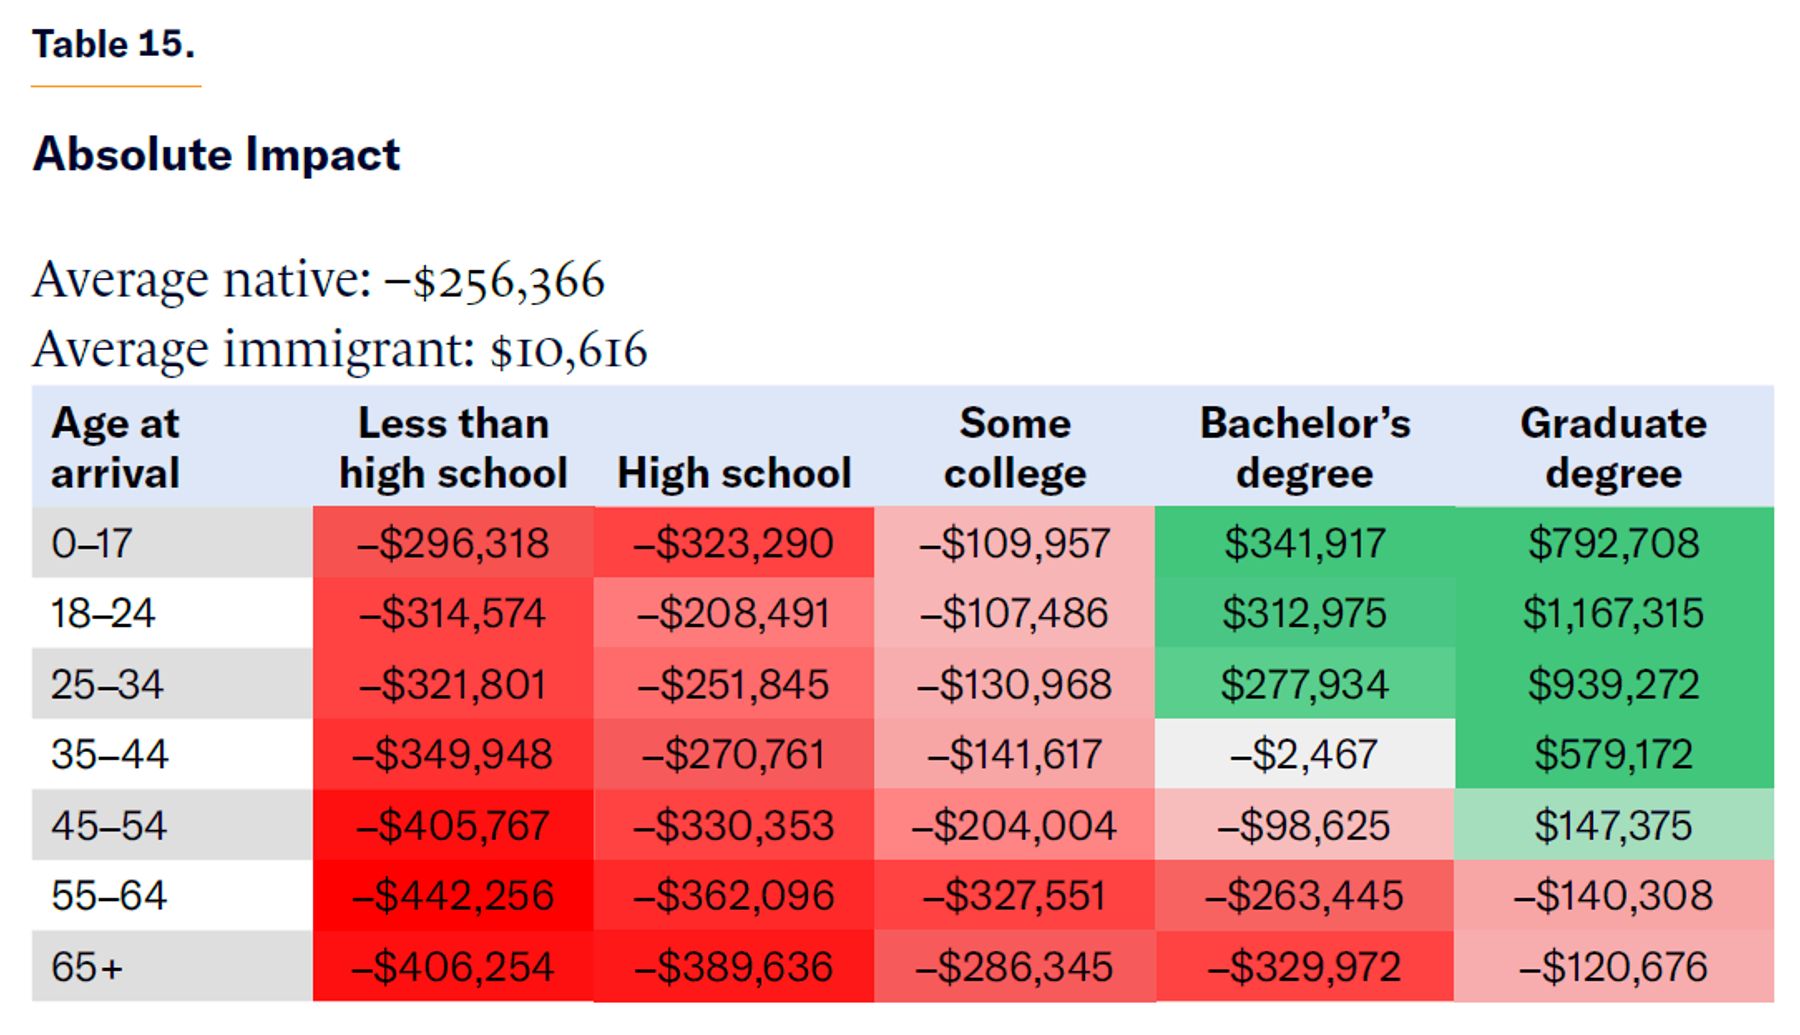
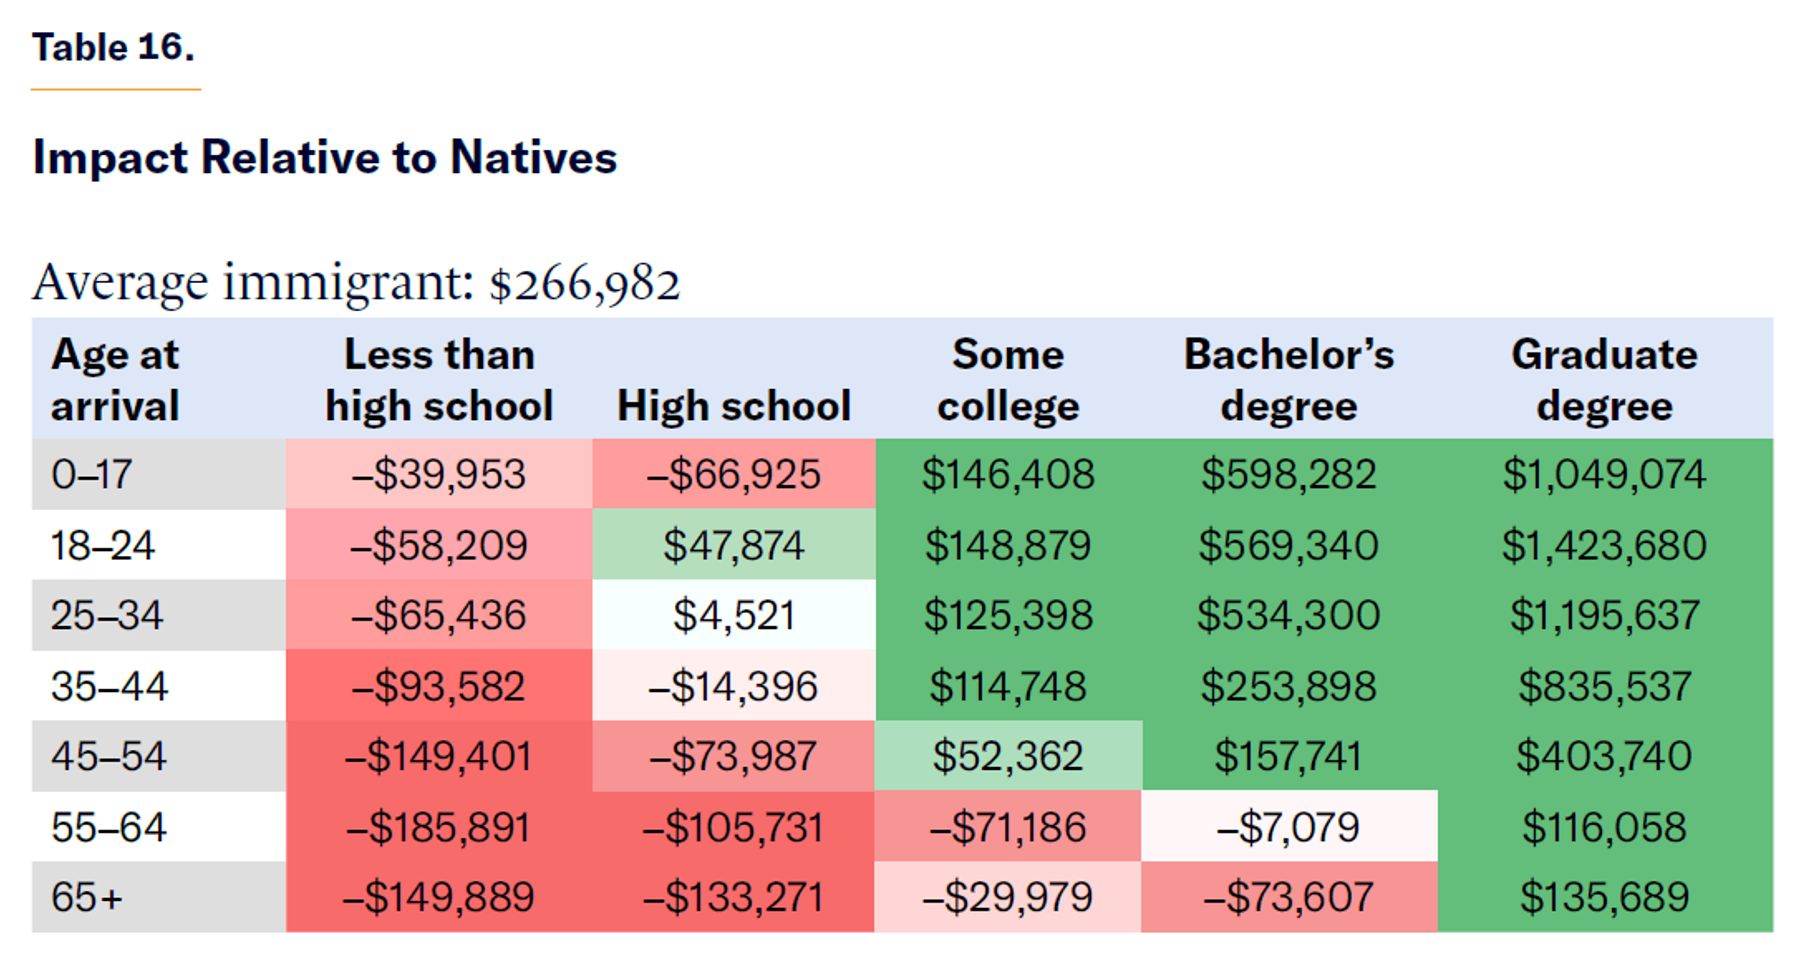
Yet since the fiscal impact of native-born Americans is also severely negative, at over $250,000 underwater, the relative fiscal impact of immigrants is not as negative as the absolute calculation might suggest. Relative to the native-born, all immigrants with a graduate degree, even the elderly, are net fiscal contributors, and all immigrants with some college and more education who arrive before turning 55 are also net fiscal contributors.
It is not an entirely rosy picture. Immigrants of any age who never obtain a high school diploma are net fiscal burdens costing $40,000–$150,000 to the federal government over their lifetime, relative to a native-born person. Critically, all immigrants without a graduate (beyond a bachelor’s) or professional degree who come to the U.S. at age 55 or older are also net fiscal burdens even when compared with natives.
The question remains of how to interpret the absolute and relative fiscal impact of immigration policy. One way to think about it is that the absolute calculation assumes that immigrants pay taxes and consume benefits, but they do not expand the size of the economy, while the relative calculation assumes that they expand the economy at the average rate of a native-born person. Neither estimate is totally right; every immigrant category will expand the economy to some degree. Therefore, the absolute impact overestimates the costs of immigration but the relative impact underestimates the costs of immigrants for all but the highly skilled. In fact, the college-educated and young immigrant groups likely expand the economy more than the average native-born person, so their positive fiscal impact is underestimated.
To get around this issue, I develop a third alternative based on a likely “labor GDP multiplier,” based on the net present value of all the wages earned by the average immigrant in each category over his lifetime. If the immigrant earned half of what the average native-born person does over his lifetime, then his correspondent economic expansion is half of it and the relative impact is calculated subtracting only half the impact of a native.
For example, the absolute fiscal impact of a native-born person is –$256,000, and that of an immigrant without a high school diploma who arrives as a child is –$296,000. The net present value of all the lifetime wages of this immigrant group is just 30% of that of the average native-born person. The final fiscal impact under this calculation becomes (–$296,000) + (0.3×$256,000) = –$219,200 instead of about –$40,000, as in Table 16. But the fiscal impact of a bachelor’s degree holder who immigrated aged 25–34 becomes nearly $560,000, more positive than in the relative impact scenario because the net present value of the lifetime earnings (and thus economic expansion) of this immigrant group is 10% greater than the earnings of the average native-born American.
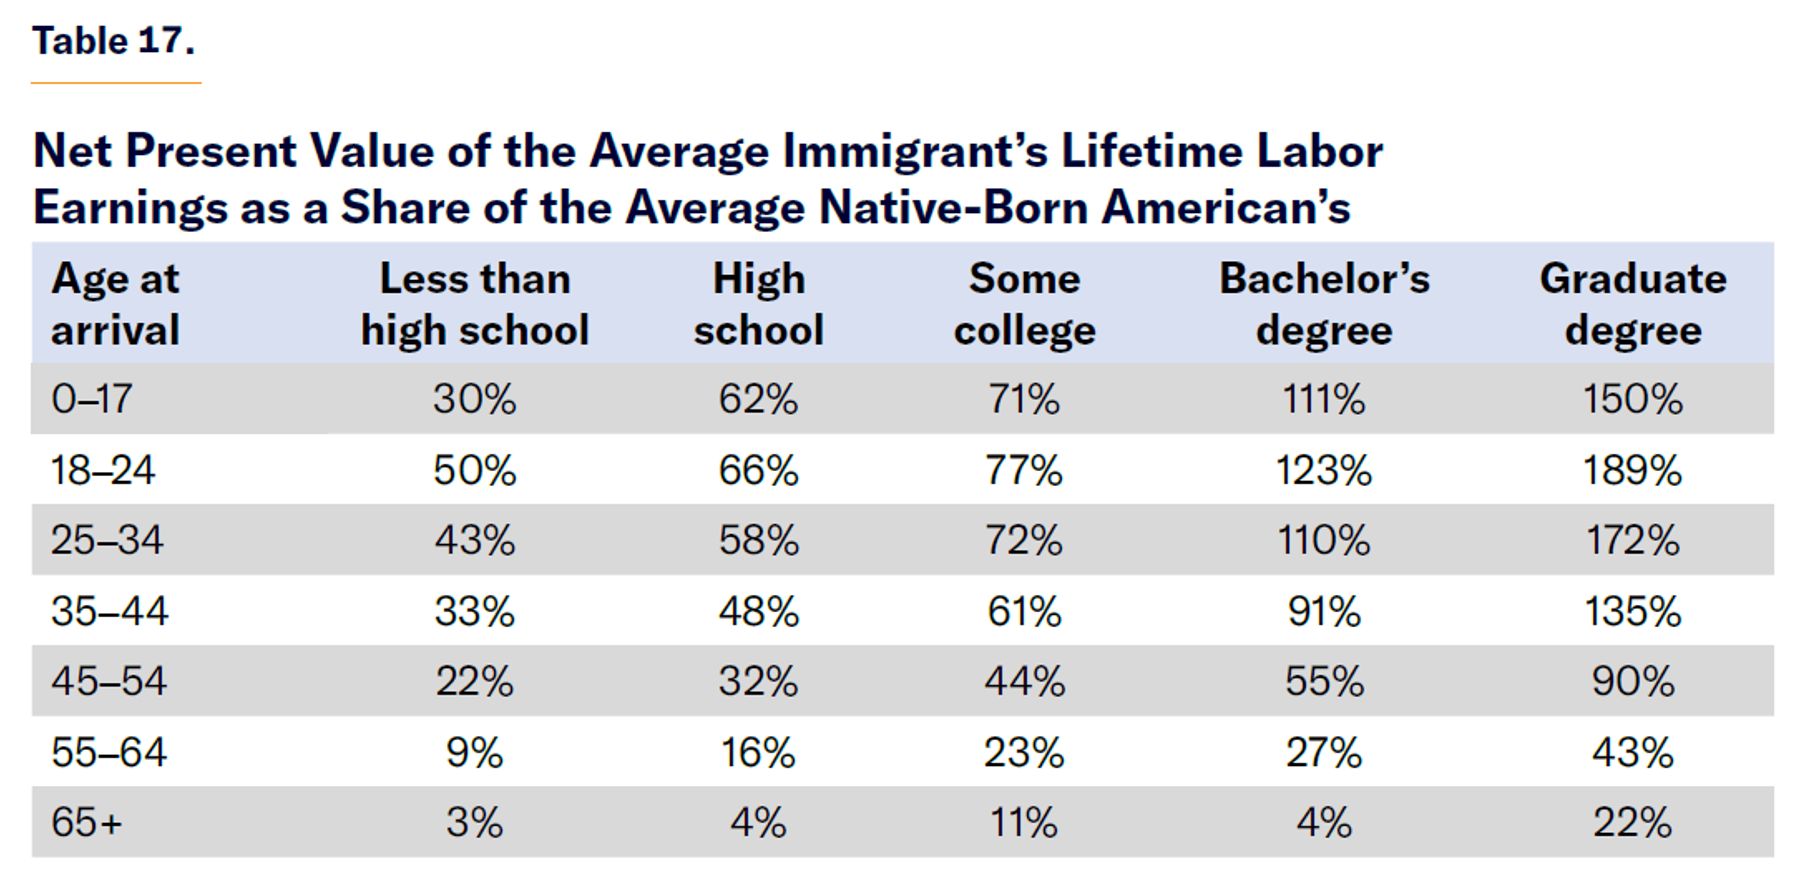
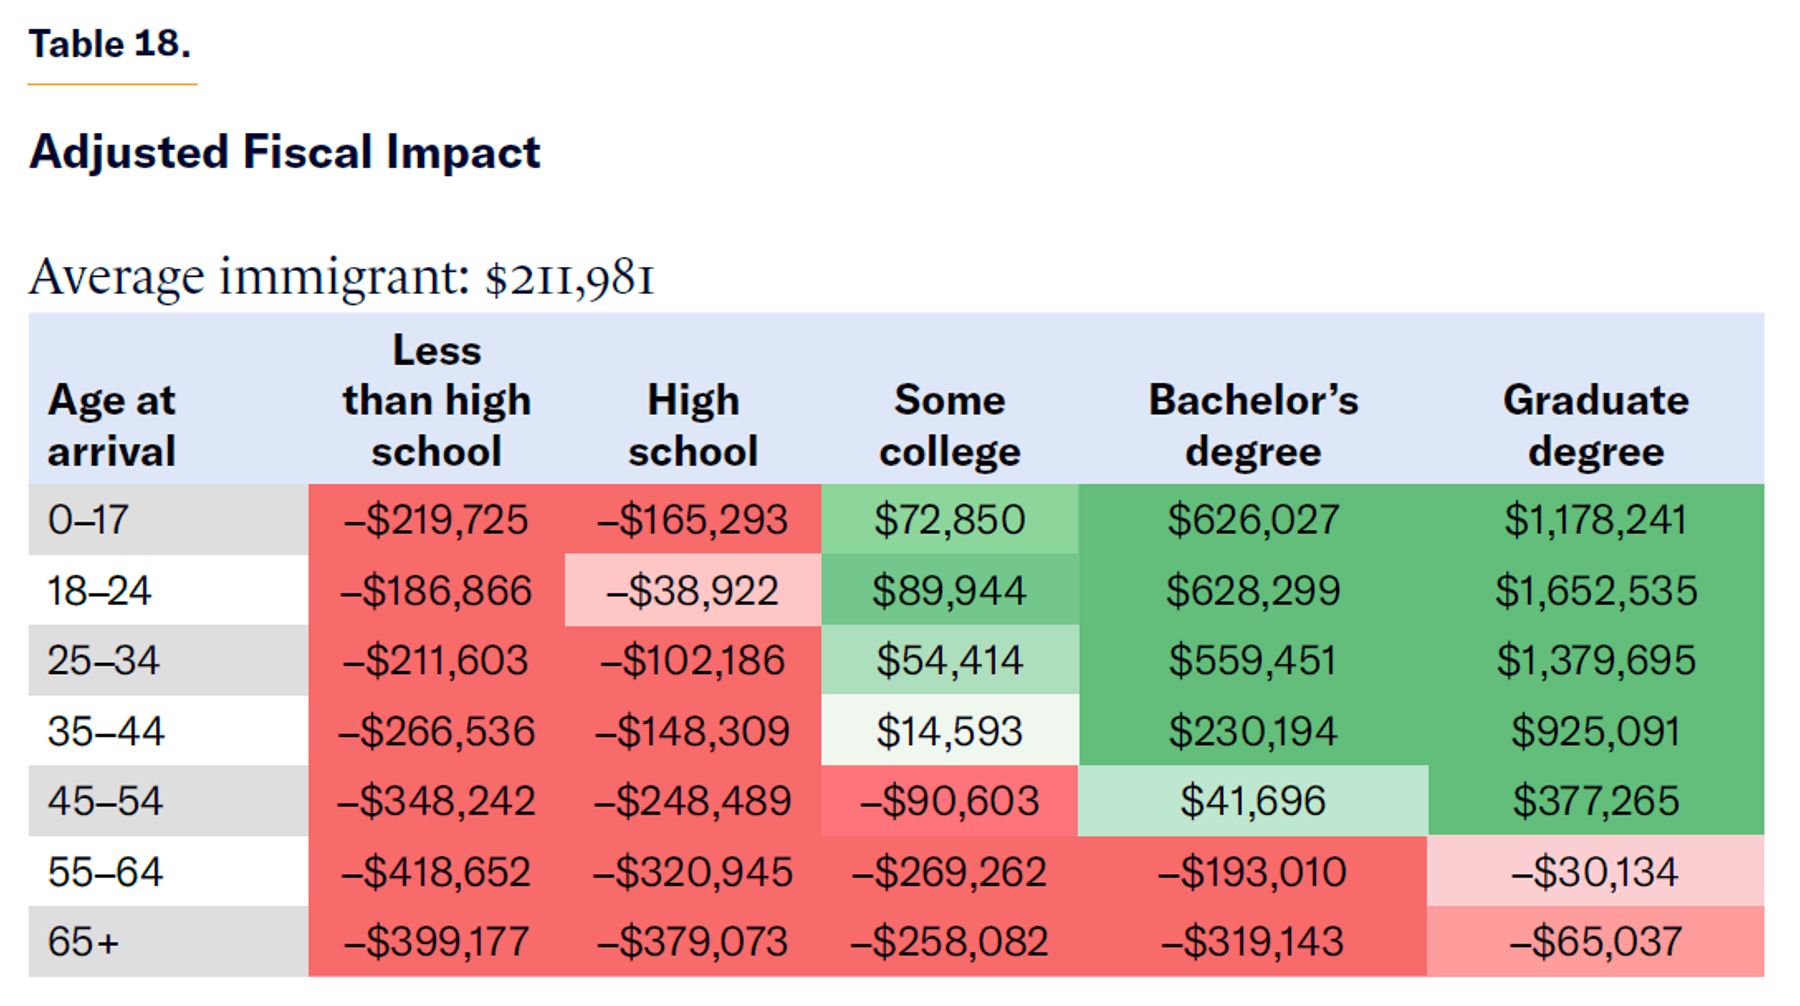
Table 17 shows a more realistic shows a realistic picture of the net fiscal impact of immigrants to the U.S. going forward.
All new immigrants with only a high school diploma or less education are expected to cost hundreds of thousands of dollars over their lifetimes to the federal government. Immigrants of all educational levels who come to the U.S. after age 55 are also expected to be a net fiscal burden. On the other hand, young college-educated immigrants are expected to reduce the debt by over half a million each over their lives here. In other words, the U.S. is allowing hundreds of thousands of immigrants into the country each year who will end up costing billions to taxpayers, yet severely restricting the legal avenues for immigrants who are net fiscal contributors that could reduce the debt and benefit all Americans.
None of these estimates is perfect, but they provide a useful range of possibilities for policymakers to approximate the impact of their immigration policy changes on the federal budget. The adjusted fiscal-impact scenario is especially realistic in that it accounts for the fact that immigrants do expand the economy, though at different rates based on their earnings and remaining years in the workforce.
The Average Immigrant
A different way to visualize the fiscal impact of immigrants is to look only at the average by group. Table 19 displays the share of immigrants in each age-education category considered in this report.
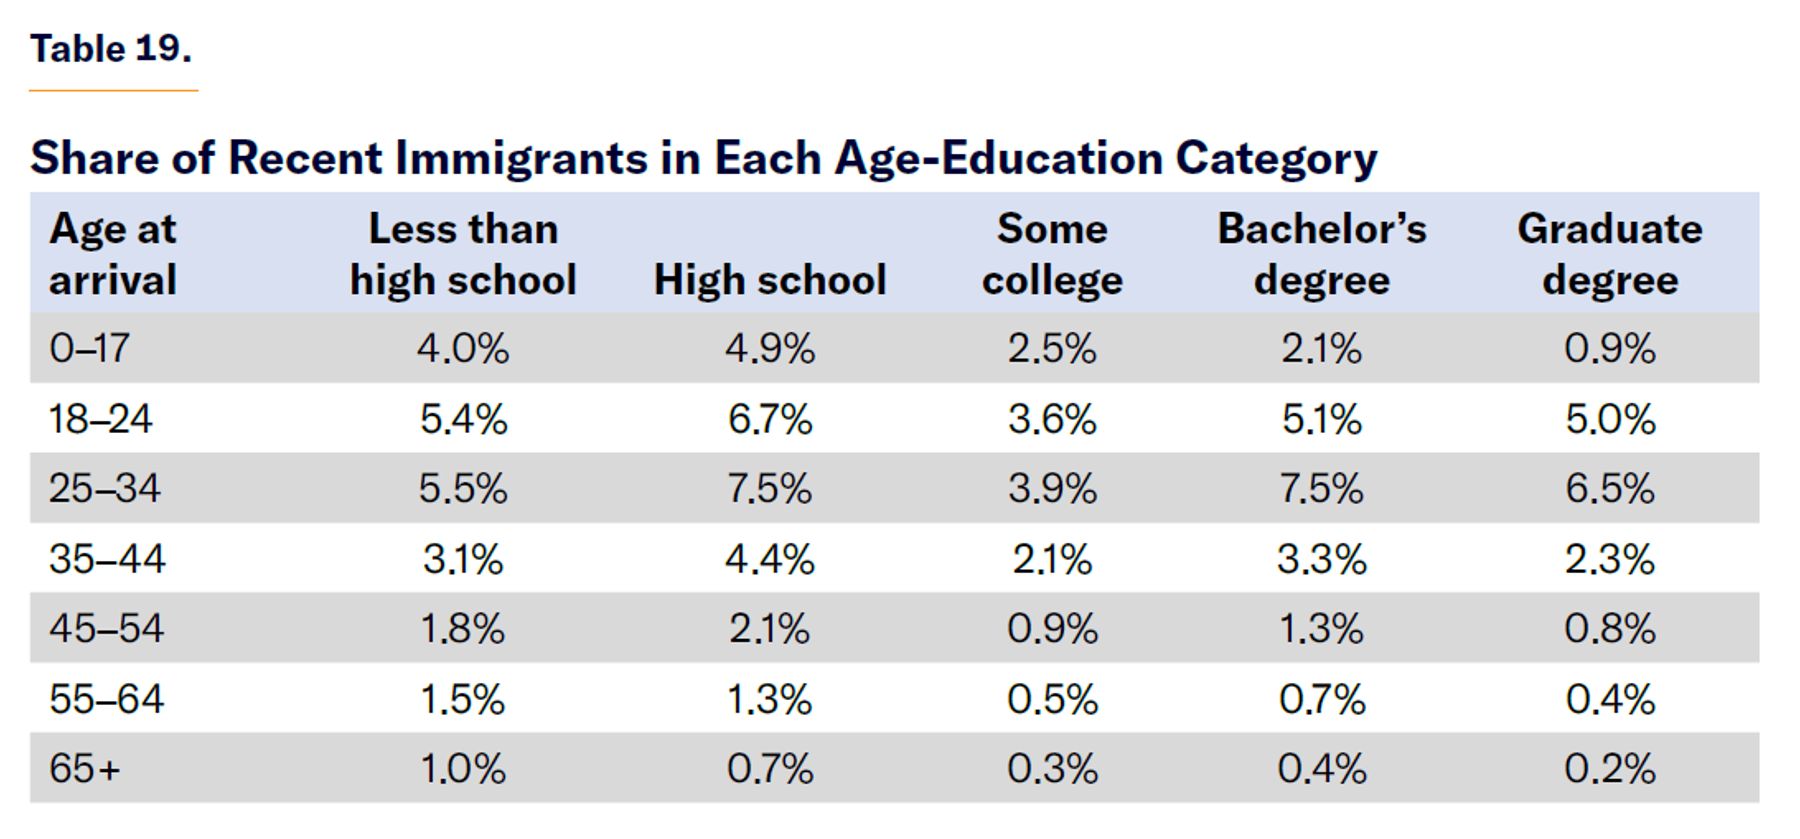
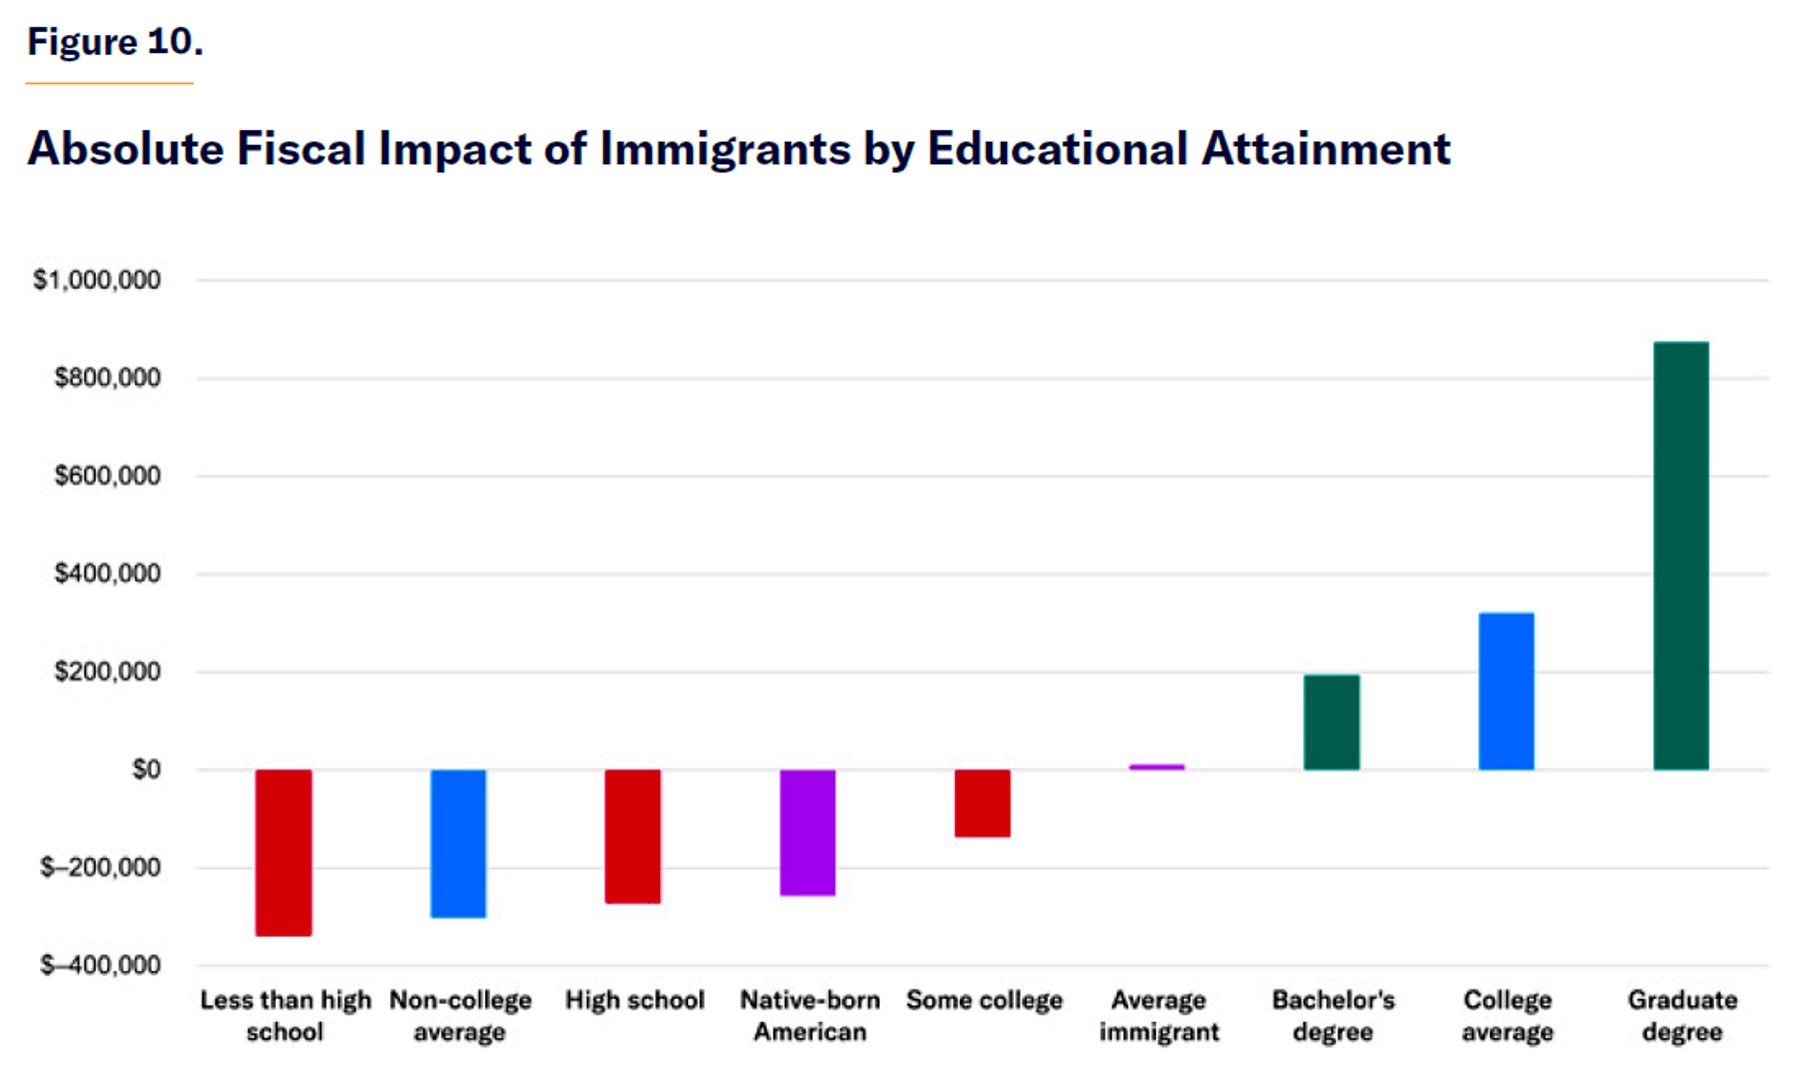
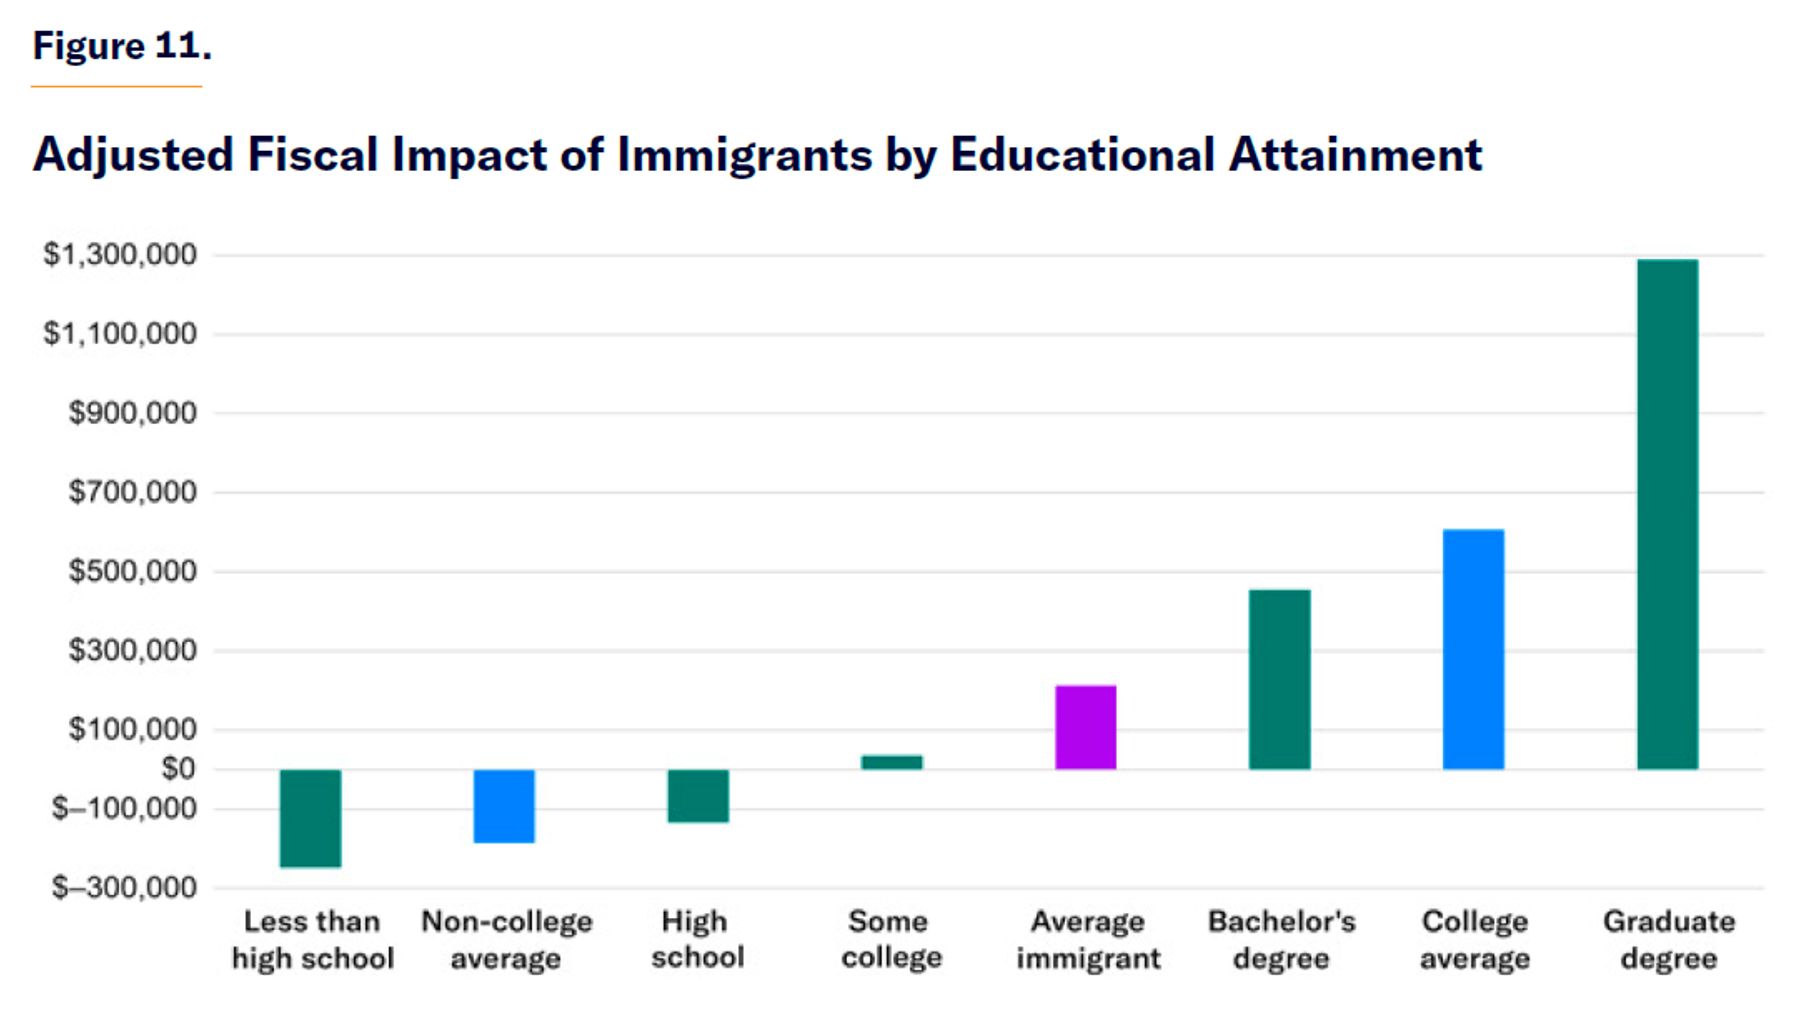
The weighted average of the information in Table 19 and each of the fiscal scenario tables generates the fiscal impact of the average immigrant, displayed in Figure 10 for the absolute impact and Figure 11 for the adjusted fiscal impact. These figures summarize the fiscal impact of immigrants by educational attainment of all ages.
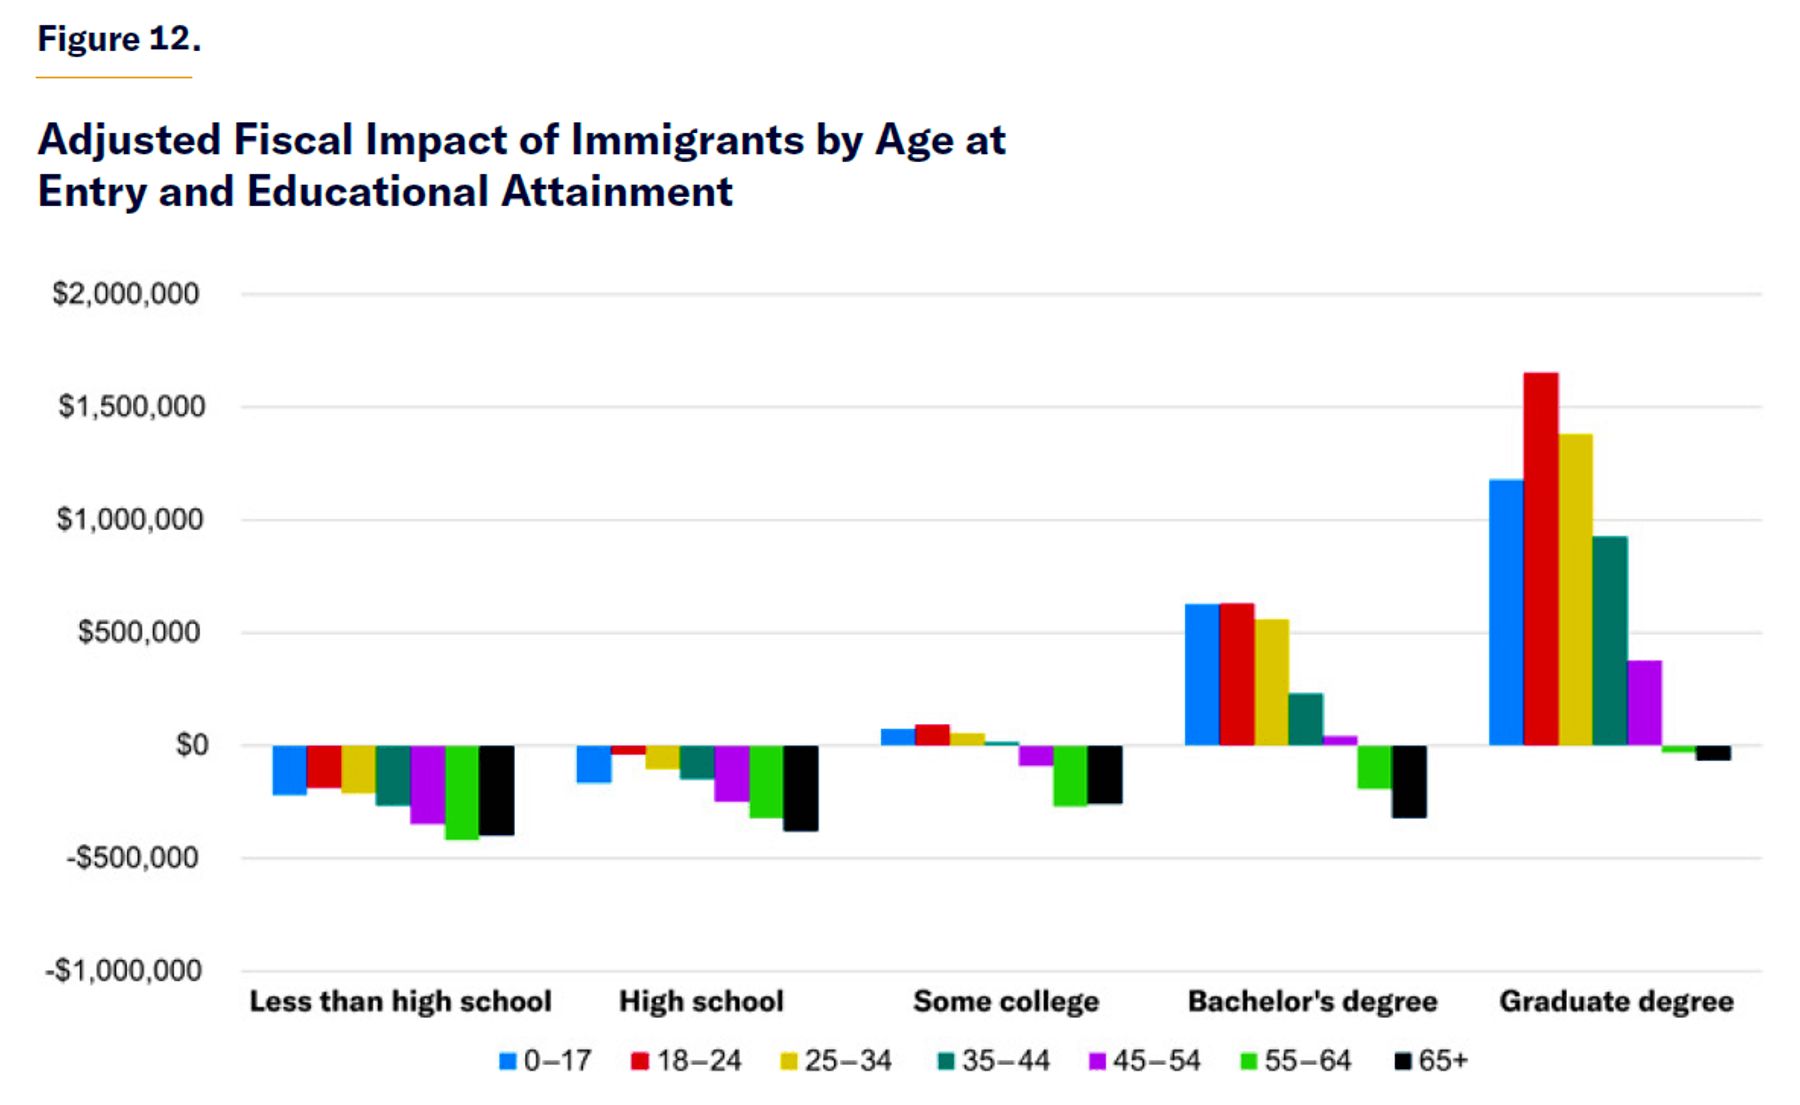
Figure 12 is a detailed version that distinguishes both by age and educational attainment.
In these summarized figures, each education and age-at-arrival group are weighted by their actual ages of arrival, so part of the results represents age and not education effects. This does not have a large impact, however, because the mean age at arrival is 29–31 for all education groups.
While the absolute fiscal impact will tell us how much the debt will change in today’s dollars over the lifetime of the immigrant, it does not tell us what it will do to the size of the debt relative to the size of the economy. Comparing immigrants with natives’ fiscal impact would not answer this question because immigrants of different ages and educational levels add to the size of the economy at different rates than do natives.
Figure 11 fixes this issue and illustrates what the likely fiscal impact of immigrants of different characteristics would be relative to the size of the economy based on the data in Table 18.
As observed in Figure 10, the average fiscal impact of all immigrants is net positive because of the very positive impact of college-educated immigrants, which offsets the negative fiscal impact of the rest of the immigrant population. In fact, most immigrants have a negative fiscal impact, and the average immigrant without a college degree is more costly to the federal government than the average native-born American.
Part IV. Policy Implications
Mass Deportations
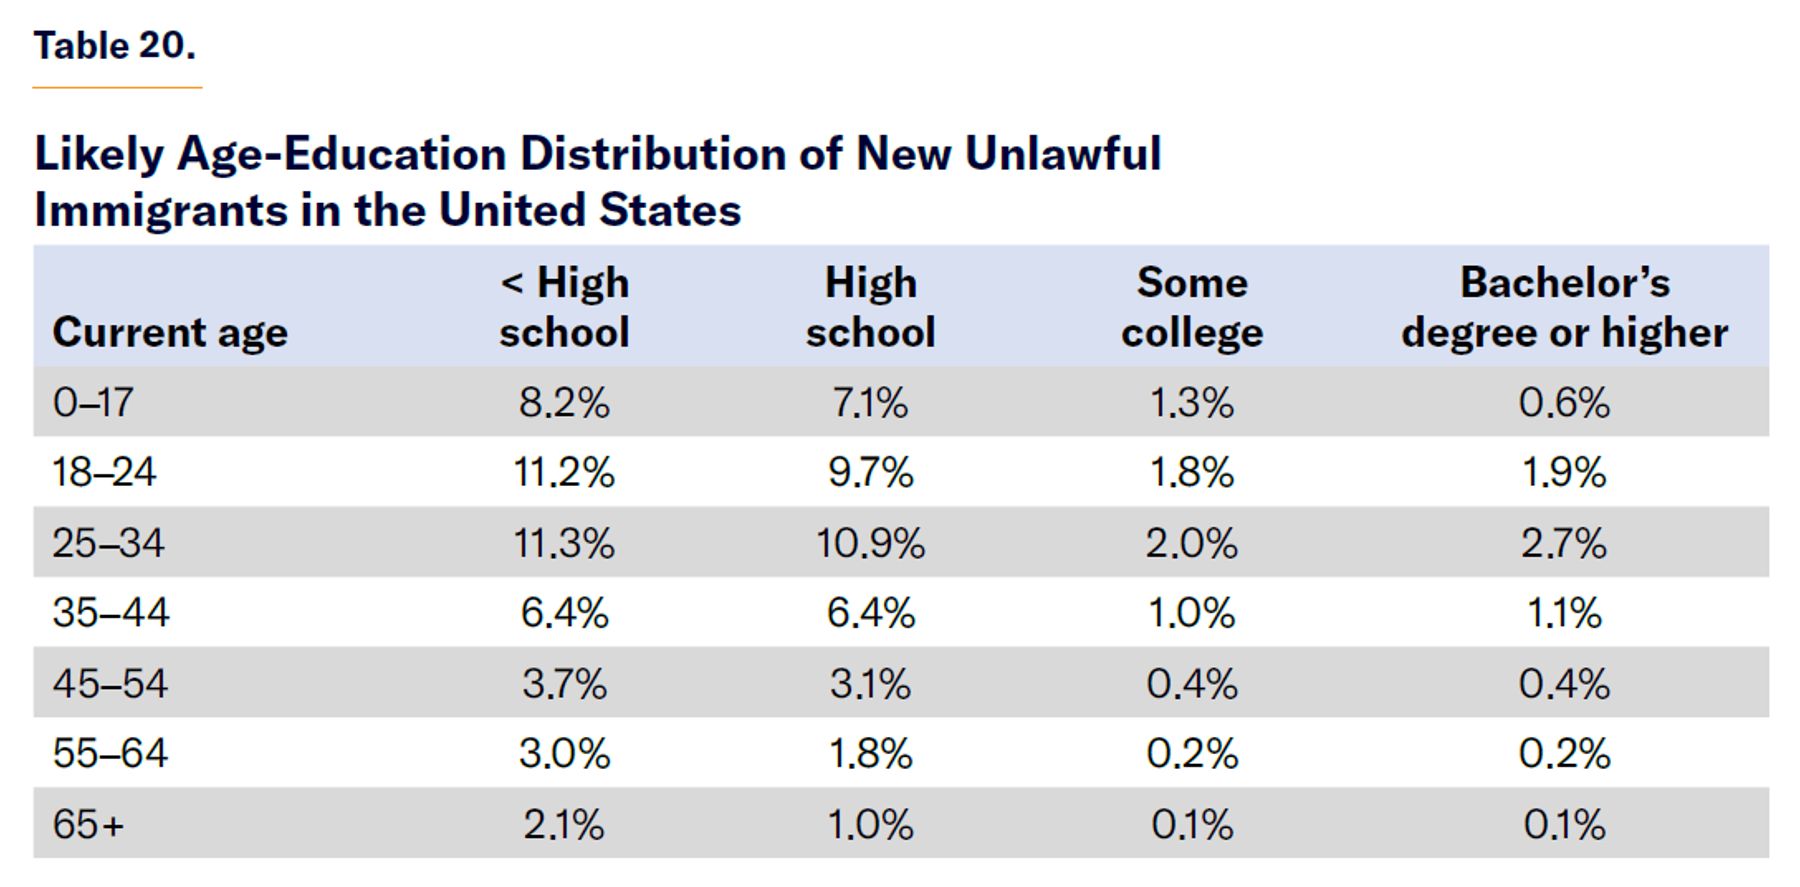
The Cato Institute found that, for adult immigrants who came to the U.S. in 2015, nearly half the immigrants who entered unlawfully did not have a high school diploma and another 40% had just a high school diploma; just 14% had some college or more education.[35] Consequently, assuming that unlawful immigrants come to the U.S. at similar ages as the rest of the immigrant population, my model finds the age-education distribution of the unlawful immigrant population in the U.S. as displayed in Table 20.
The average newly arrived immigrant who entered the country illegally is expected to have a net fiscal burden of about $130,000 in adjusted terms, so preventing future unlawful immigration is important. The CBO estimates that the border surge will number 8.7 million immigrants between 2021 and 2026 who either crossed the border unlawfully, were paroled, are in Temporary Protected Status, or received asylum.[36] Under the adjusted fiscal-impact estimate, the border crisis is expected to cost $1.15 trillion over the lifetime of the new immigrants who entered the country unlawfully, overstayed a visa, or were paroled. This estimate accounts for future voluntary emigration and deportation of a sizable share of these migrants. Even if one argues that these immigrants will not receive any Social Security benefits, they would still represent a net fiscal burden of nearly $1 trillion in today’s dollars.
To visualize just how costly the border crisis will be, Figure 13 compares the lifetime cost of the border crisis with the largest budget items in the FY 2023 federal budget. Shockingly, even if, as CBO assumes, the border crisis ends completely by 2026, it is expected to cost so much that it is almost equal to last year’s entire Social Security benefits, and it is larger than the entire defense budget. And keep in mind that these estimates exclude the cost borne by states and cities that are giving benefits to unauthorized immigrants.
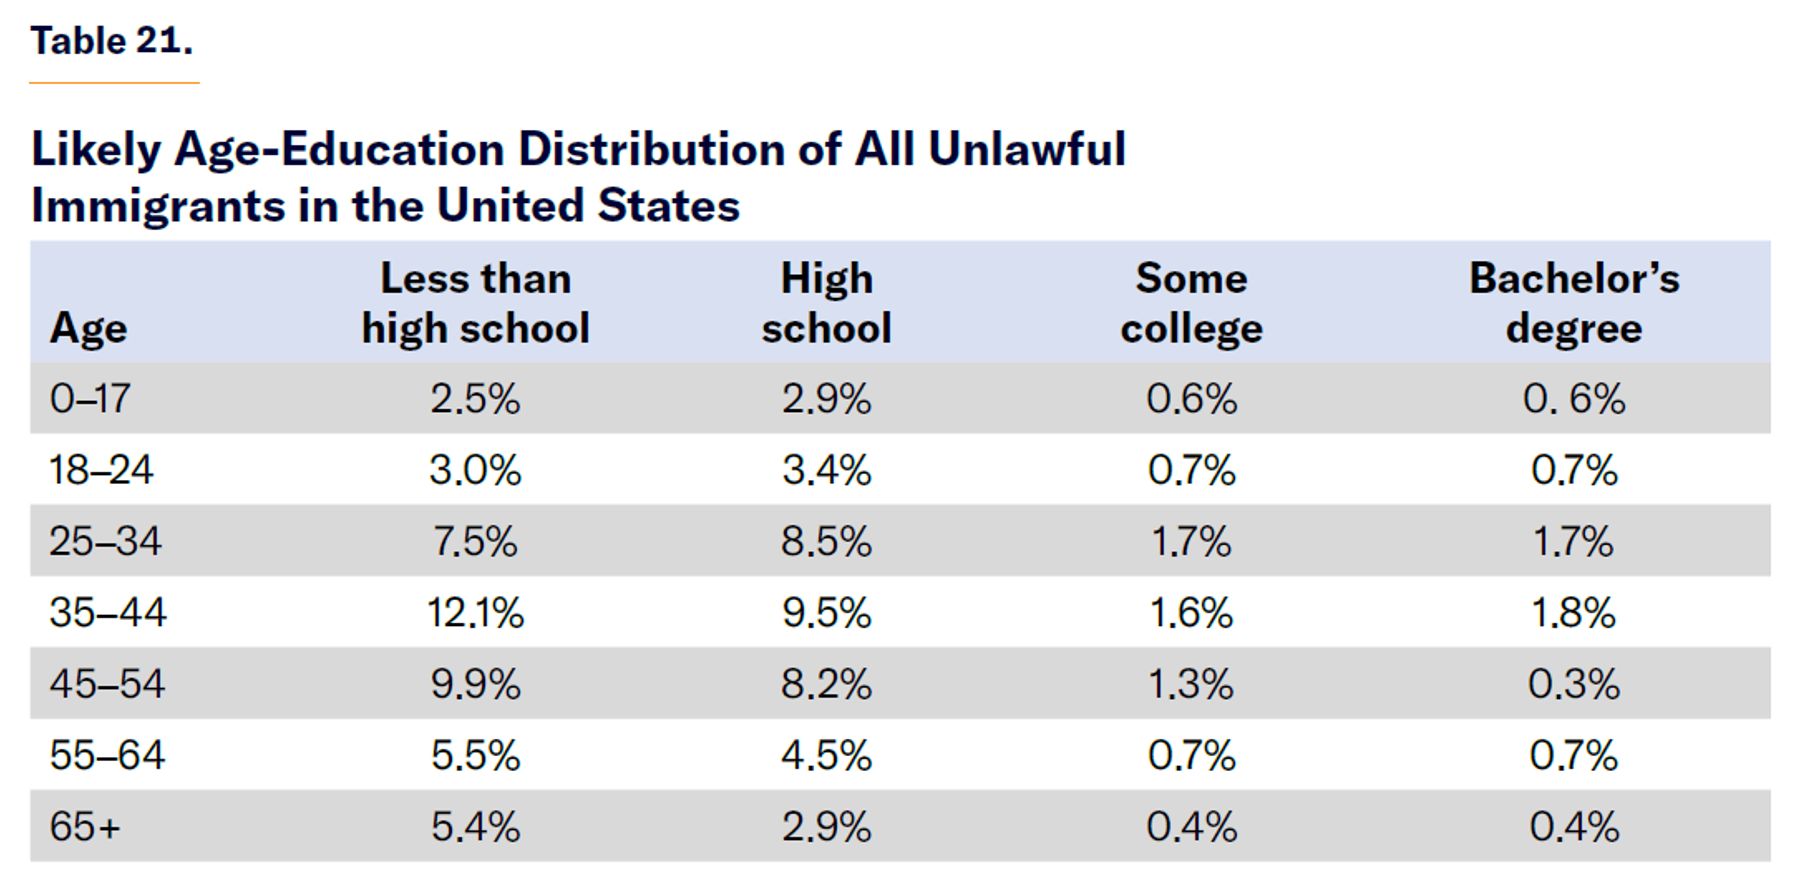
But the average unlawful immigrant already in the U.S. today is not the same as those who are coming now; they are older and are each expected to exact a net cost to the federal government of over $196,000, on average. This is because we are looking at immigrants’ current age, rather than their age of entry. These numbers likely overestimate the costs of unlawful immigrants, since the CPS data do not distinguish by legal status and unlawful immigrants cannot claim Social Security, Medicare, and most federal welfare benefits; but some end up obtaining legal status later, and others fraudulently claim and receive more emergency Medicaid, so this should be viewed as an upper limit of the net costs of unlawful immigration at the federal level.
To estimate the current age distribution (Table 21), I assume that unlawful immigrants have similar ages to legal immigrants and that they all came to the U.S. after the 1986 immigration legalization bill. I use ACS data to observe the current age and education of all immigrants who came to the U.S. since 1986 and then weight the education of each group to match Cato Institute estimates of educational attainment of unauthorized immigrants. For unauthorized immigrants under 25, I assume that they eventually reach similar educational levels as those of the 25–34 age group.
Even if unlawful immigrants have a net cost to the federal government, deportations cost thousands of dollars, too. The Center for American Progress estimated that, in 2015, each deportation had an average cost of over $10,000[38] (over $13,500 in today’s dollars). U.S. Immigration and Customs Enforcement (ICE) is tasked with enforcing immigration laws and handling deportations. The agency’s FY 2023 budget totaled $9.3 billion[39] and removed just 142,580 noncitizens[40] from the U.S. interior, with an average cost of about $65,000 per removal.
Some of the budget was dedicated to activities unrelated to identifying, detaining, and removing noncitizens, but separate deportation cost estimates have similar results. A 2015 deportation cost estimate from the American Action Forum resulted in over $46,000 per deportation—or over $62,000 in today’s dollars.[41] There are also likely increasing marginal costs for deportations or removals, which means that each additional removal costs more than the previous one because search costs become greater and detention capacity must be expanded. Therefore, this report will use $65,000 as the likely estimated cost in the case of a large-scale deportation operation.
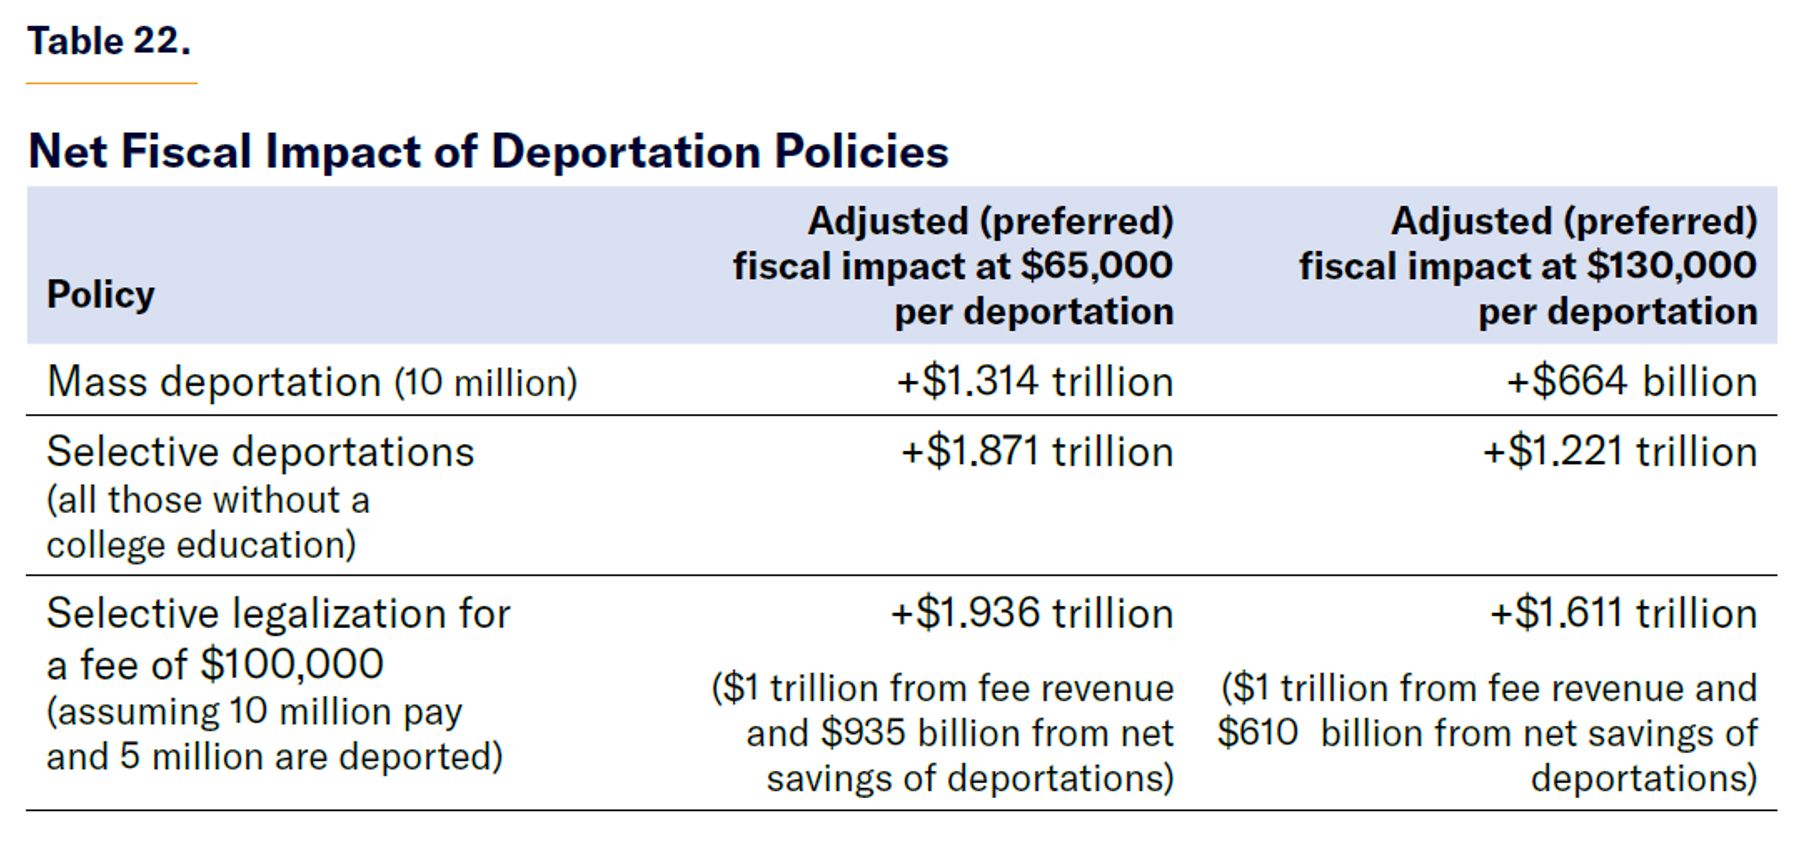
Despite the high cost of deportations, mass deportations would reduce the national debt as a share of the economy in the long run. Specifically, deporting a random 10 million unlawful immigrants could reduce the national debt by over $1.3 trillion under the adjusted fiscal-impact scenario.
But if deportations were targeted at adults without any college education (80% of the unauthorized population), the policy would be even more financially fruitful. Allowing everyone who arrived as a child and who is seeking or earned a college degree to receive permanent residency—as different versions of the DREAM Act would do—or even permitting all those with some college education to remain would allow authorities to focus on the remaining 80% of the unauthorized population who are most costly. Deporting 10 million of the adult unlawful population without any college degree while allowing those with some college education to remain would save the federal government a net amount of nearly $1.9 trillion, some $600 billion more than an unselective deportation policy.
On the other hand, allowing unlawful immigrants to regularize their status would likely increase their wages and tax payments but would also make them eligible for most entitlement and welfare programs, surely increasing the deficit.
Another fiscally responsible solution would be to create an intermediate status under which immigrants who entered the U.S. unlawfully could work legally but not receive benefits or full legalization and charge immigrants a fee based on their expected fiscal impact. This fee could be set at $100,000 for all or have a schedule differentiated by age and education. The fee could also be paid over time, with interest. Unfortunately, the high fee is unlikely to be paid by many of those who meet the criteria. I assume that 10 million unlawful immigrants participate, including all those with a college degree; and that a remaining 5 million unlawful immigrants without any college are unable to take advantage of the policy and are subject to deportation. With these assumptions, the fee in the policy of selective legalization would raise $1 trillion, and deportation for the remainder would save $936 billion, reducing the debt by over $1.9 trillion, more than the previous two options under the adjusted fiscal-impact calculation.
Table 22 summarizes the policies of mass deportation and selective legalization. For illustrative purposes, I add a second column assuming that deportations are double the estimated costs, in order to simulate rising marginal costs of removal.
Reducing Refugee Resettlement
Refugees are outside the U.S. and are selected by United Nations and U.S. State Department officials. Refugees are different from asylum seekers, who arrive in the U.S. and then request asylum status. While refugees are even less educated on average than unlawful immigrants, they are the youngest immigrant category among legal immigrants (Table 23).[42]
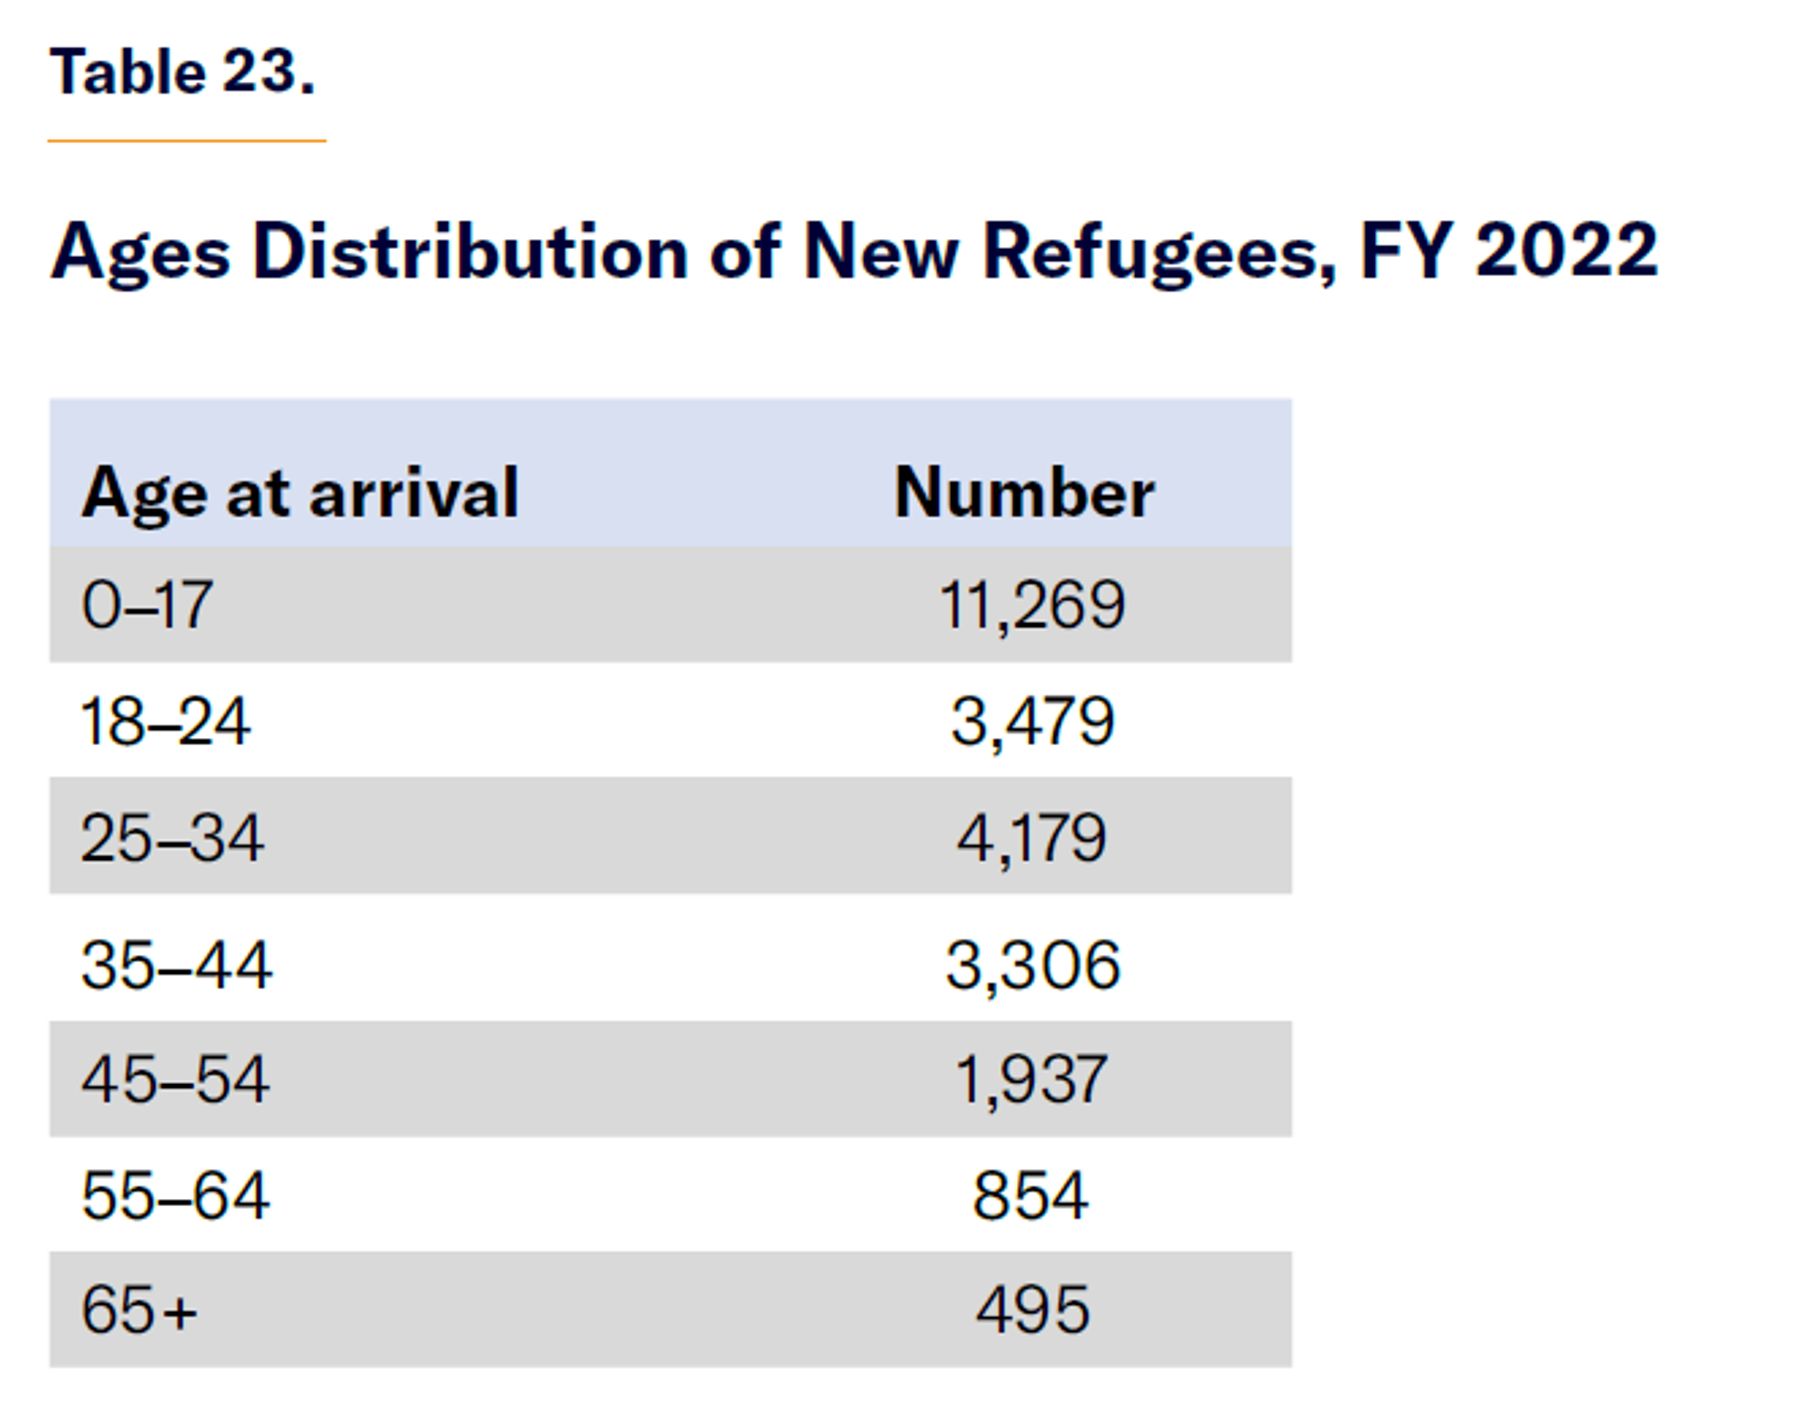
Of refugees and asylum seekers in 2015, the Cato Institute estimates that 46% lack a high school diploma, 44% completed high school, and just 10% have at least some college education.[43] I assume that half of those with some college have a four-year degree and that none has a graduate degree. Assuming that the educational distribution of refugees and asylees is equal by age yields the age-education distribution in Table 24.
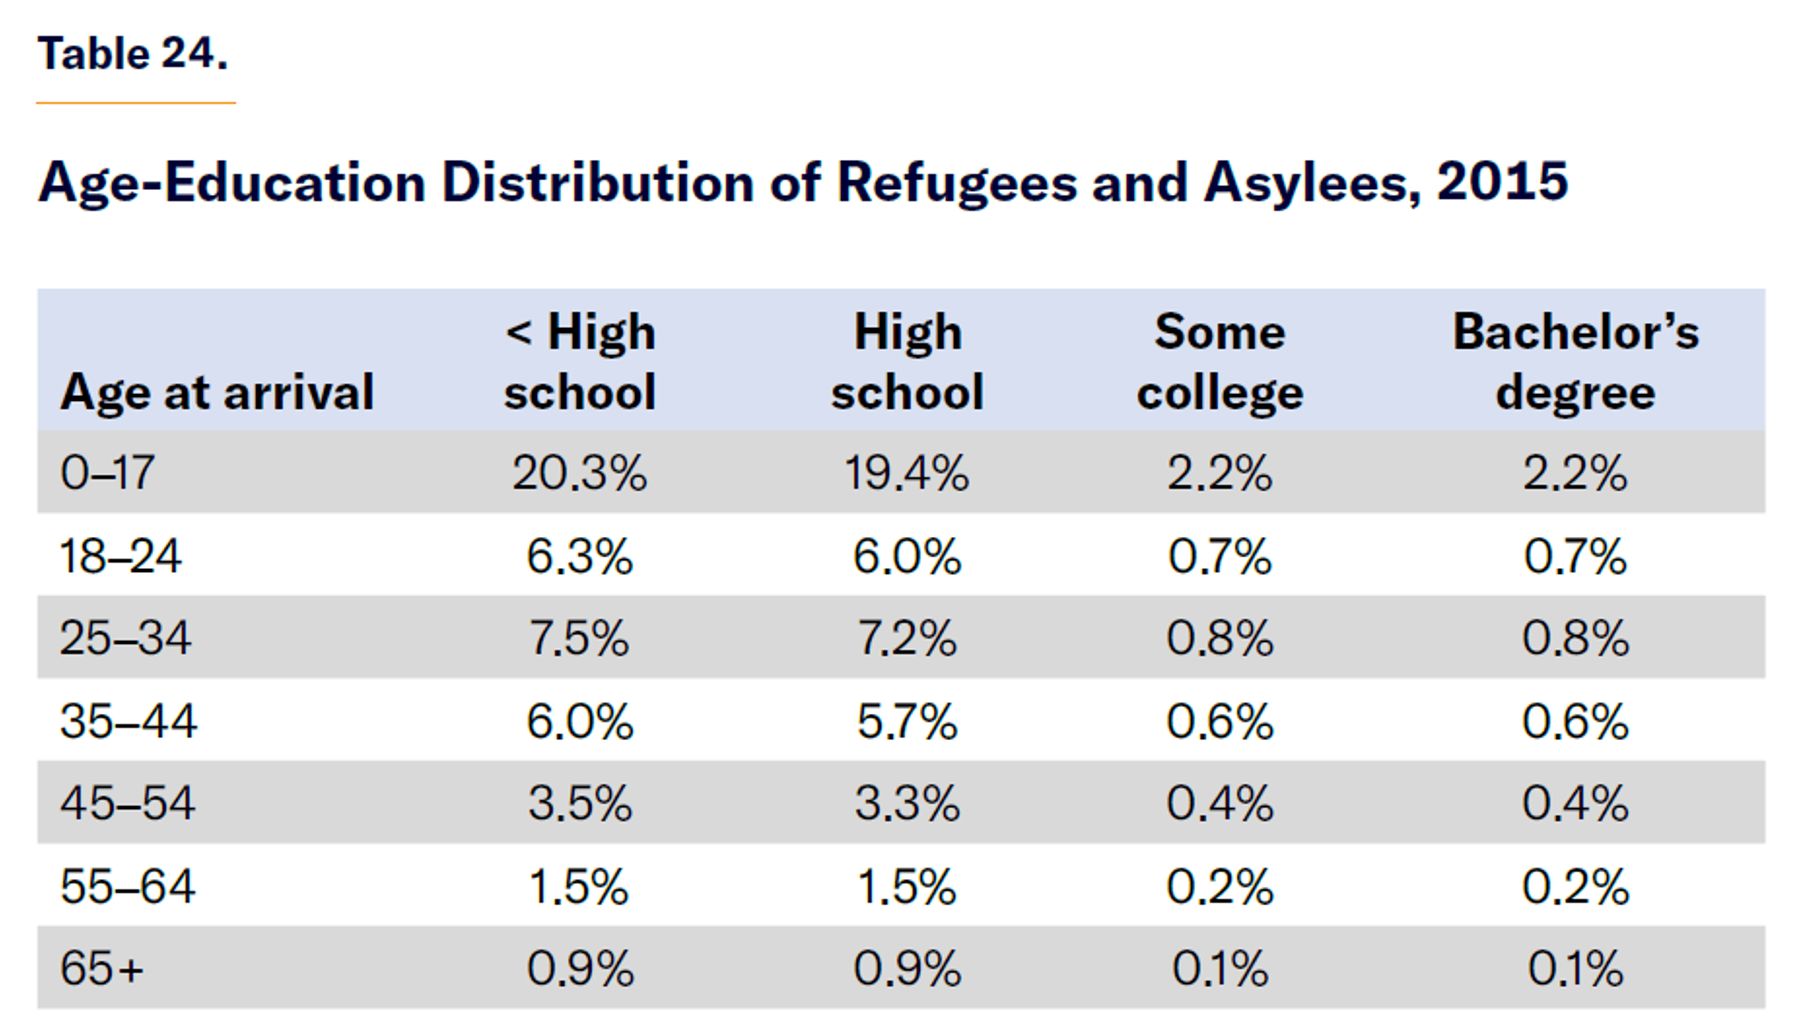
Using these figures, every refugee in FY 2022 is expected to increase the federal budget deficit of the U.S. by nearly $152,000 over his lifetime. Therefore, the 25,500 refugees admitted in that fiscal year will increase the budget deficit by nearly $3.9 billion over their lifetime. In FY 2023, the number of refugees reached more than 60,000.[44] If they had a similar age structure to past years, their expected fiscal impact will cost the U.S. $9.1 billion.
It makes sense that refugees cost much more to the federal government than immigrants who entered the country unlawfully because they are less educated but mostly because they are eligible for more federal welfare and entitlement benefits. Since the CPS data set used for this estimate does not distinguish by legal status, the net cost of refugees should be considered an underestimate due to their enhanced eligibility for federal benefits, relative to all other legal immigrants and especially relative to unlawful immigrants.
Eliminating Green Cards for Parents of U.S. Citizens
Americans can sponsor their foreign parents to become permanent residents if the sponsoring children are over 21 years old. Therefore, most parents of U.S. citizens are likely 50 or older. Some parents of U.S. citizens obtain residence because they gave birth in the U.S. and then returned to their home country until their child was old enough to act as a sponsor. But most are likely the parents of past employment, family, and diversity immigrants who waited three to five years as permanent residents to become citizens. The Department of Homeland Security releases data on the age of all immediate relatives approved to come to the U.S. but includes parents with spouses and minor children of U.S. citizens.[45]
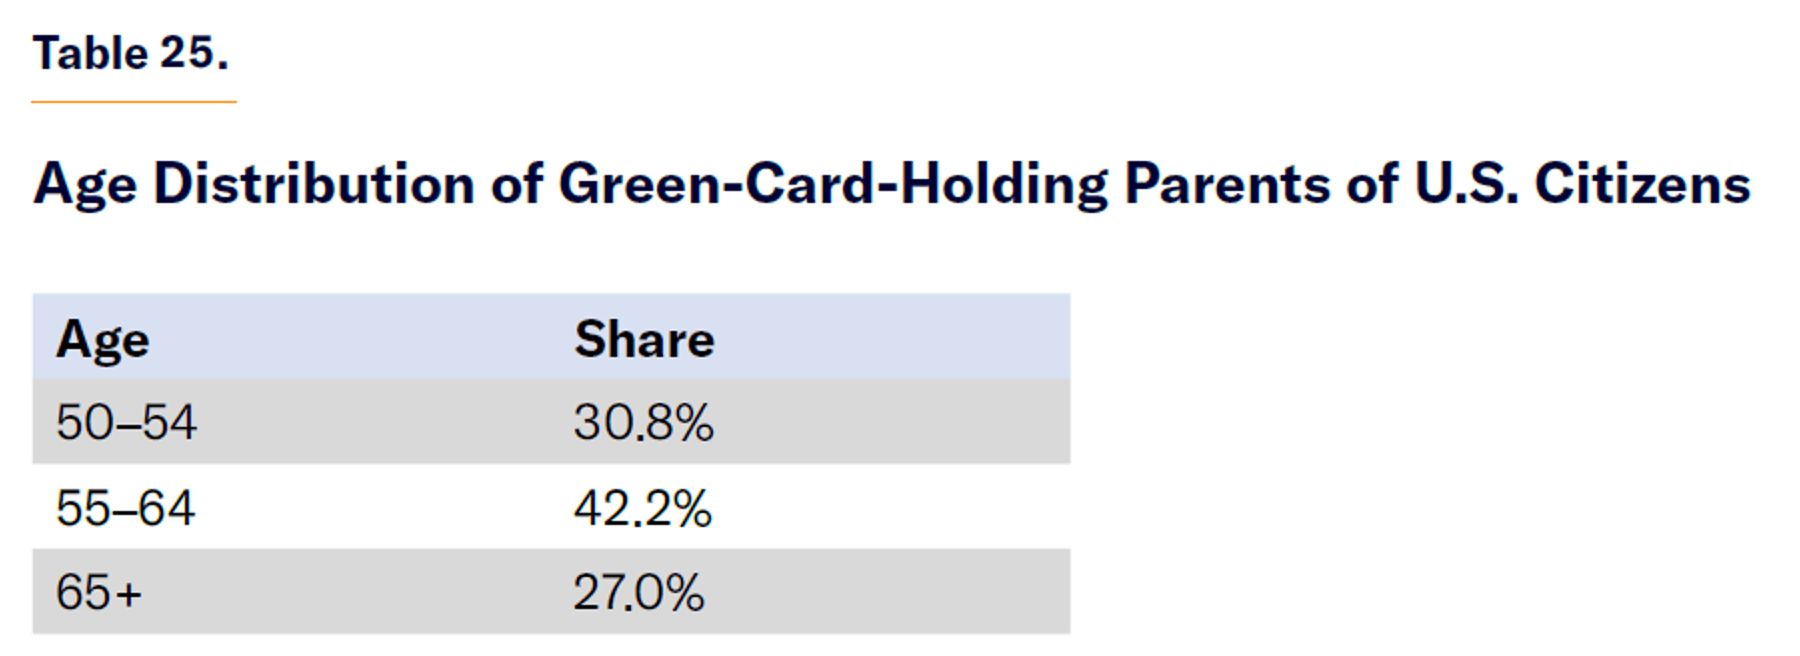
In Table 25, I assume that the parents in this category are all 50 or older and equally distributed across sub-age groups.
Using Cato Institute estimates of education among family- and diversity-immigrants, I create an age-education distribution, assuming equal educational distribution by age group (Table 26).
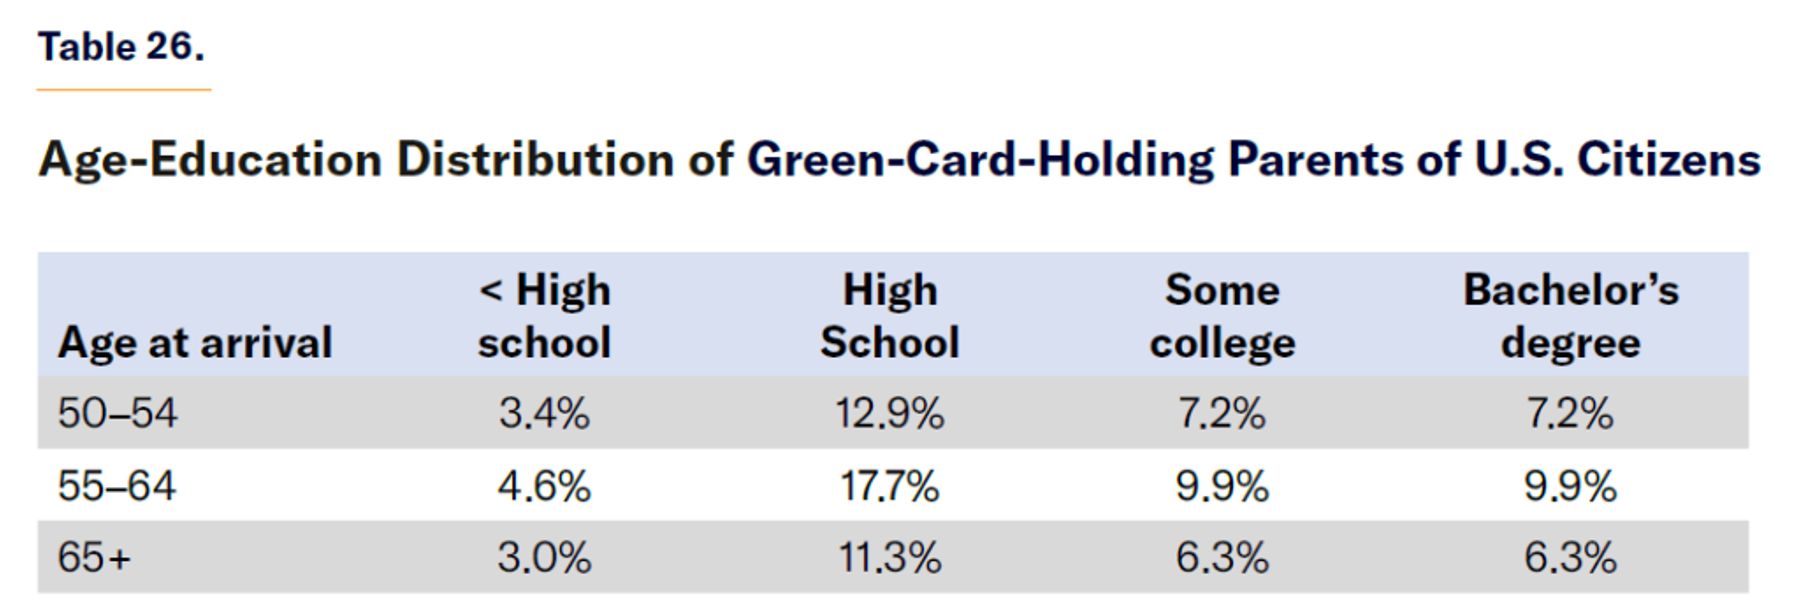
Given their age and educational characteristics, parents of U.S. citizens have an average fiscal impact of approximately –$260,000 during their lifetime, and therefore expand the national debt relative to baseline. Since 132,505 parents of U.S. citizens were admitted in FY 2022[46] (and this is a category that is increasing in number over time), we can assume that eliminating it would reduce immigration by some 130,000 people annually and reduce the budget deficit by nearly $34 billion in net present value over their lifetime every year.
Alternatively, U.S. Citizenship and Immigration Services (USCIS) could ask U.S. citizen sponsors to pay a fee to maintain their right to sponsor their parents as immediate relatives. A fee of approximately $260,000 per parent or proportional to their age and education level would raise substantial revenue but also reduce the number of Americans able to sponsor their parents and, as a consequence, reduce costly immigration and the budget deficit.
Requiring a High School Diploma for a Family Visa
Another potential area of upskilling in the immigration system is to require all non-immediate family members seeking to immigrate, who are subject to the cap of 226,000 per year,[47] to hold a high school diploma to qualify. These family-based (FB) categories of immigrants and the number of visas issued in 2022[48] for each category are:
- F1. Unmarried children aged 21 and older of U.S. citizens: 17,763
- F2. Spouses and children of green-card holders and unmarried adult sons and daughters of green-card holders (and their children): 89,856
- F3. Married adult sons and daughters of U.S. citizens and their spouses and children: 17,449
- F4. Siblings of U.S. citizens aged 21 and older and their spouses and children: 40,973
The 166,041 visas for these FB categories in 2022 are under the legal limit due to processing issues, leading to more EB visas being issued the next year. But if their number limits were met as in previous years and as is likely to happen in the future, the total number would rise to 226,000. The age structure of this population in 2022 is in Table 27:
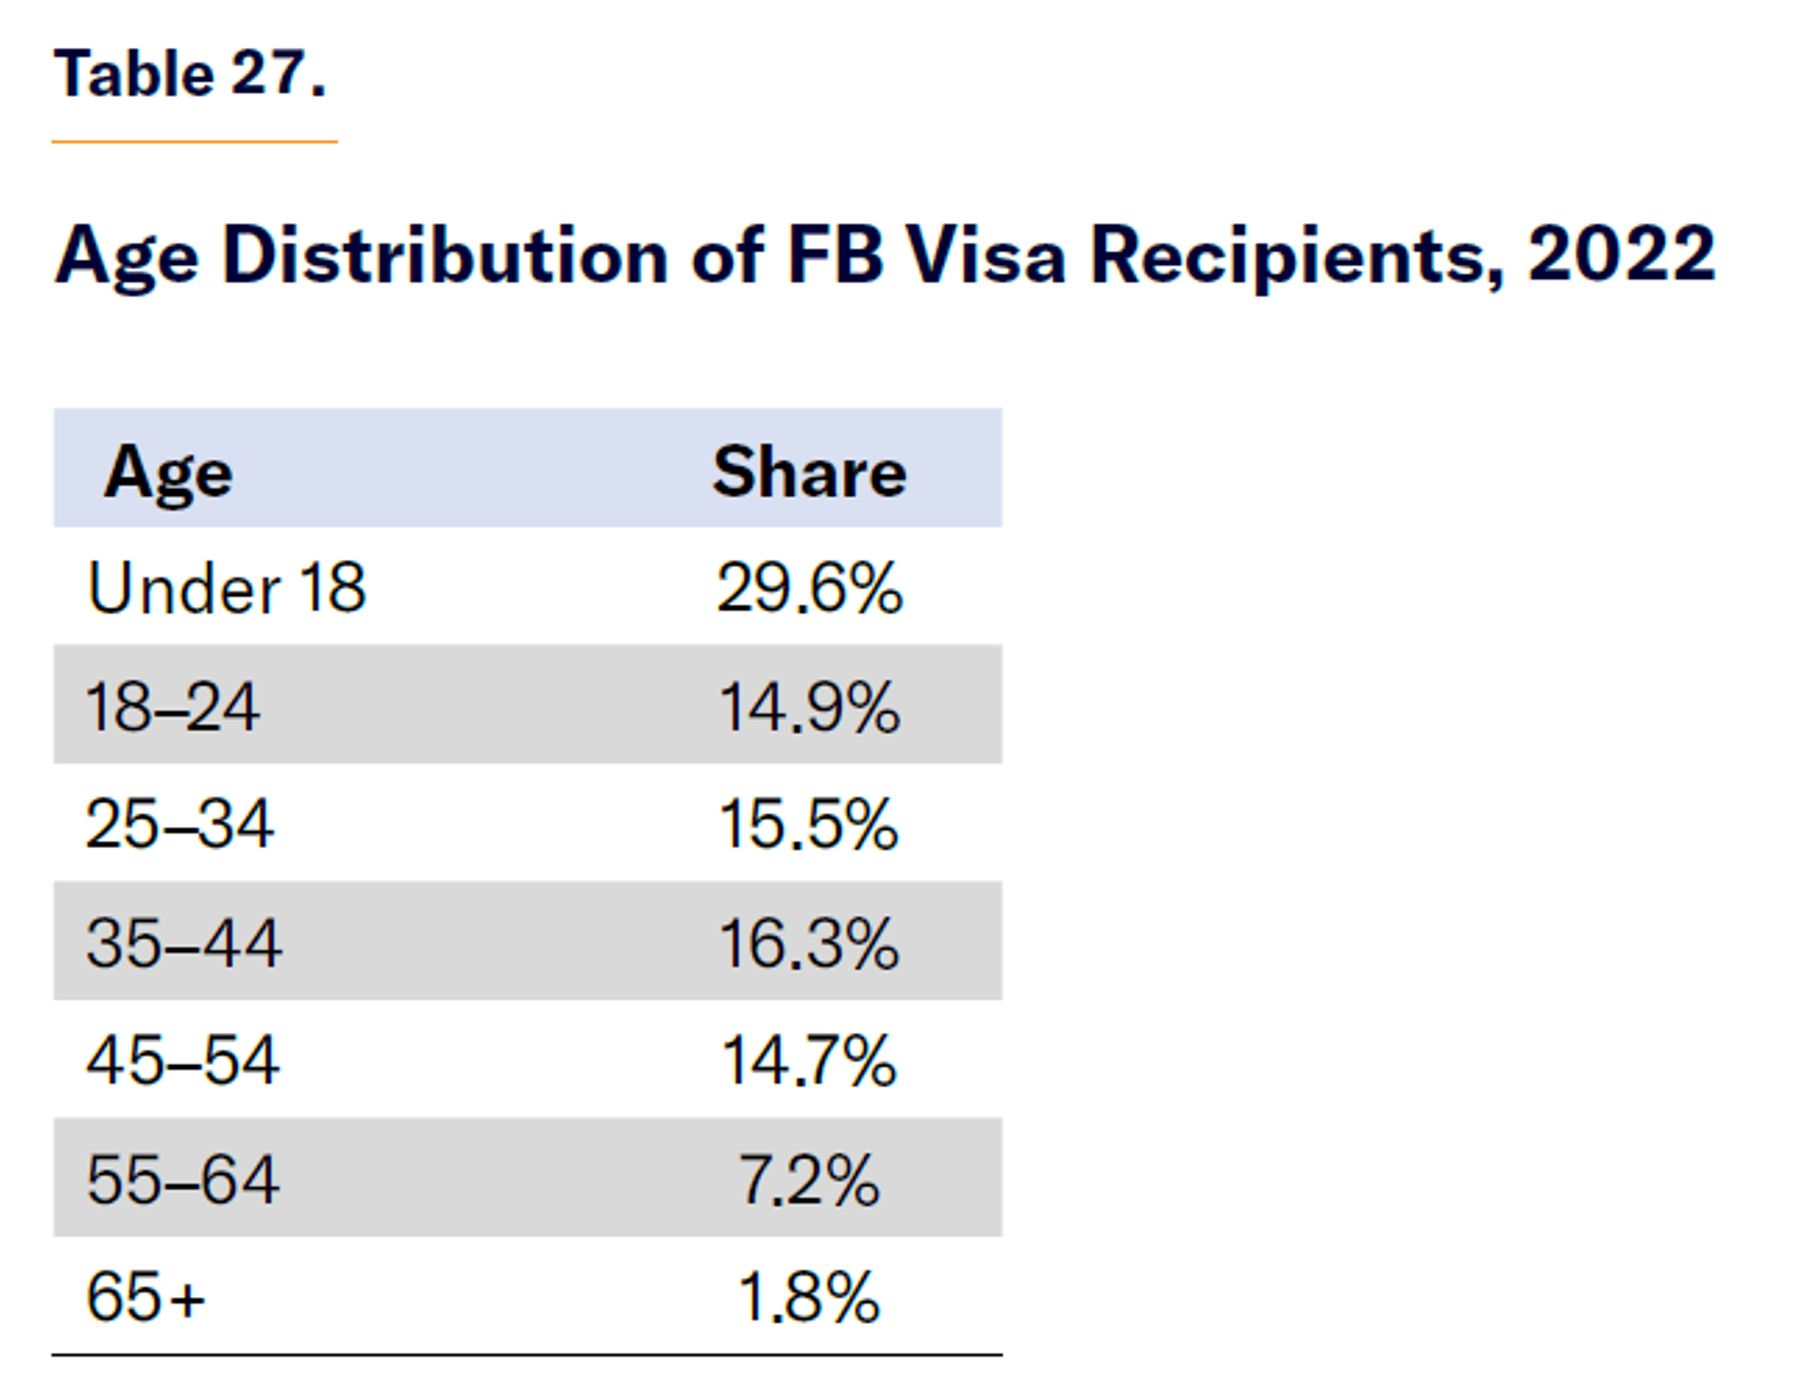
Assuming the Cato Institute’s estimates of legal immigrant education, the age-education distribution of FB immigrants is shown in Table 28.
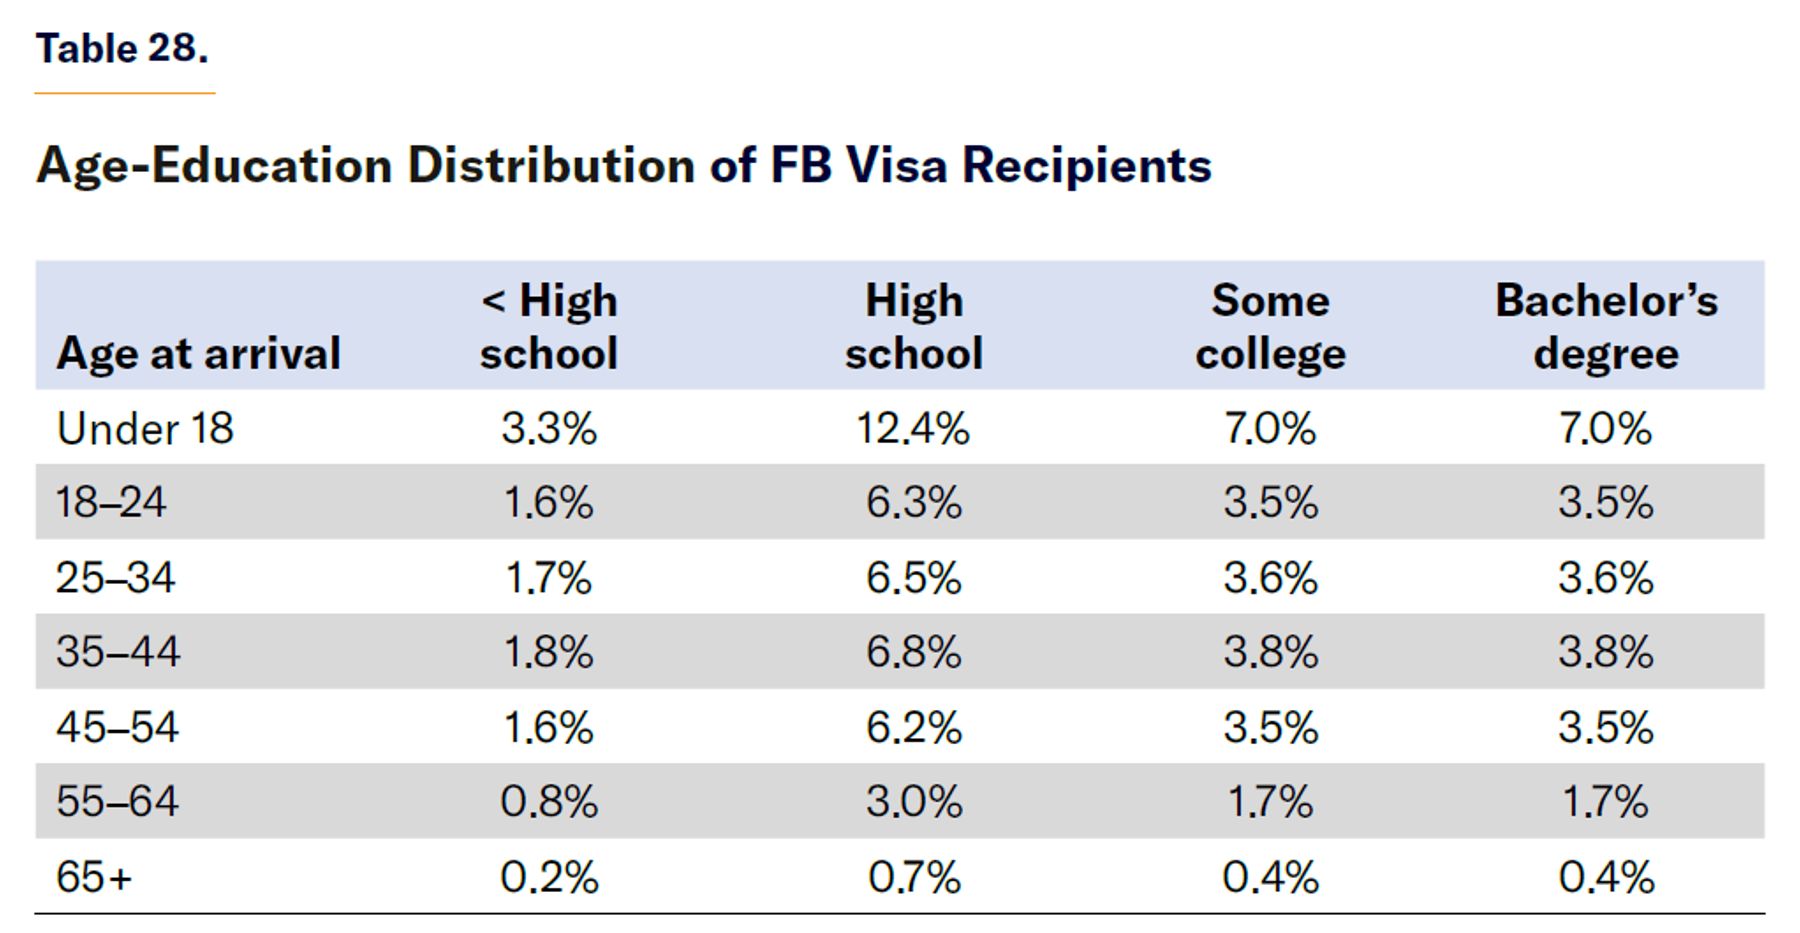
To simulate the final education of minors, I assume that they reach the educational level of their parents and fit the FB immigrant educational distribution. Among those with a college education, I assume that half have a four-year degree and half have some college education or a two-year degree and no one has a graduate degree (the same assumptions I made for the parents of U.S. citizens, refugees, and unauthorized immigrants).
Currently, all family categories are backlogged, and no applicant can immediately receive a visa but must wait in line in the order that their application was received and based on their country of birth to be precise. The U.S. government could use this backlog to shuffle for more fiscally beneficial immigrants. For their application to be approved, applicants can be required to hold a high school diploma. Applicants with that qualification can be moved in front of applicants without it. This change would encourage immigrants to obtain high school diplomas and also shift visas from those without a high school diploma to those who have earned a diploma or completed some higher education. In Table 29, I assume that one-third of those without a diploma will obtain it and the rest will lose their positions in line. Because I do not have data about the age distribution of the backlog, I cannot estimate how this change would affect the age structure of the immigrant inflow.
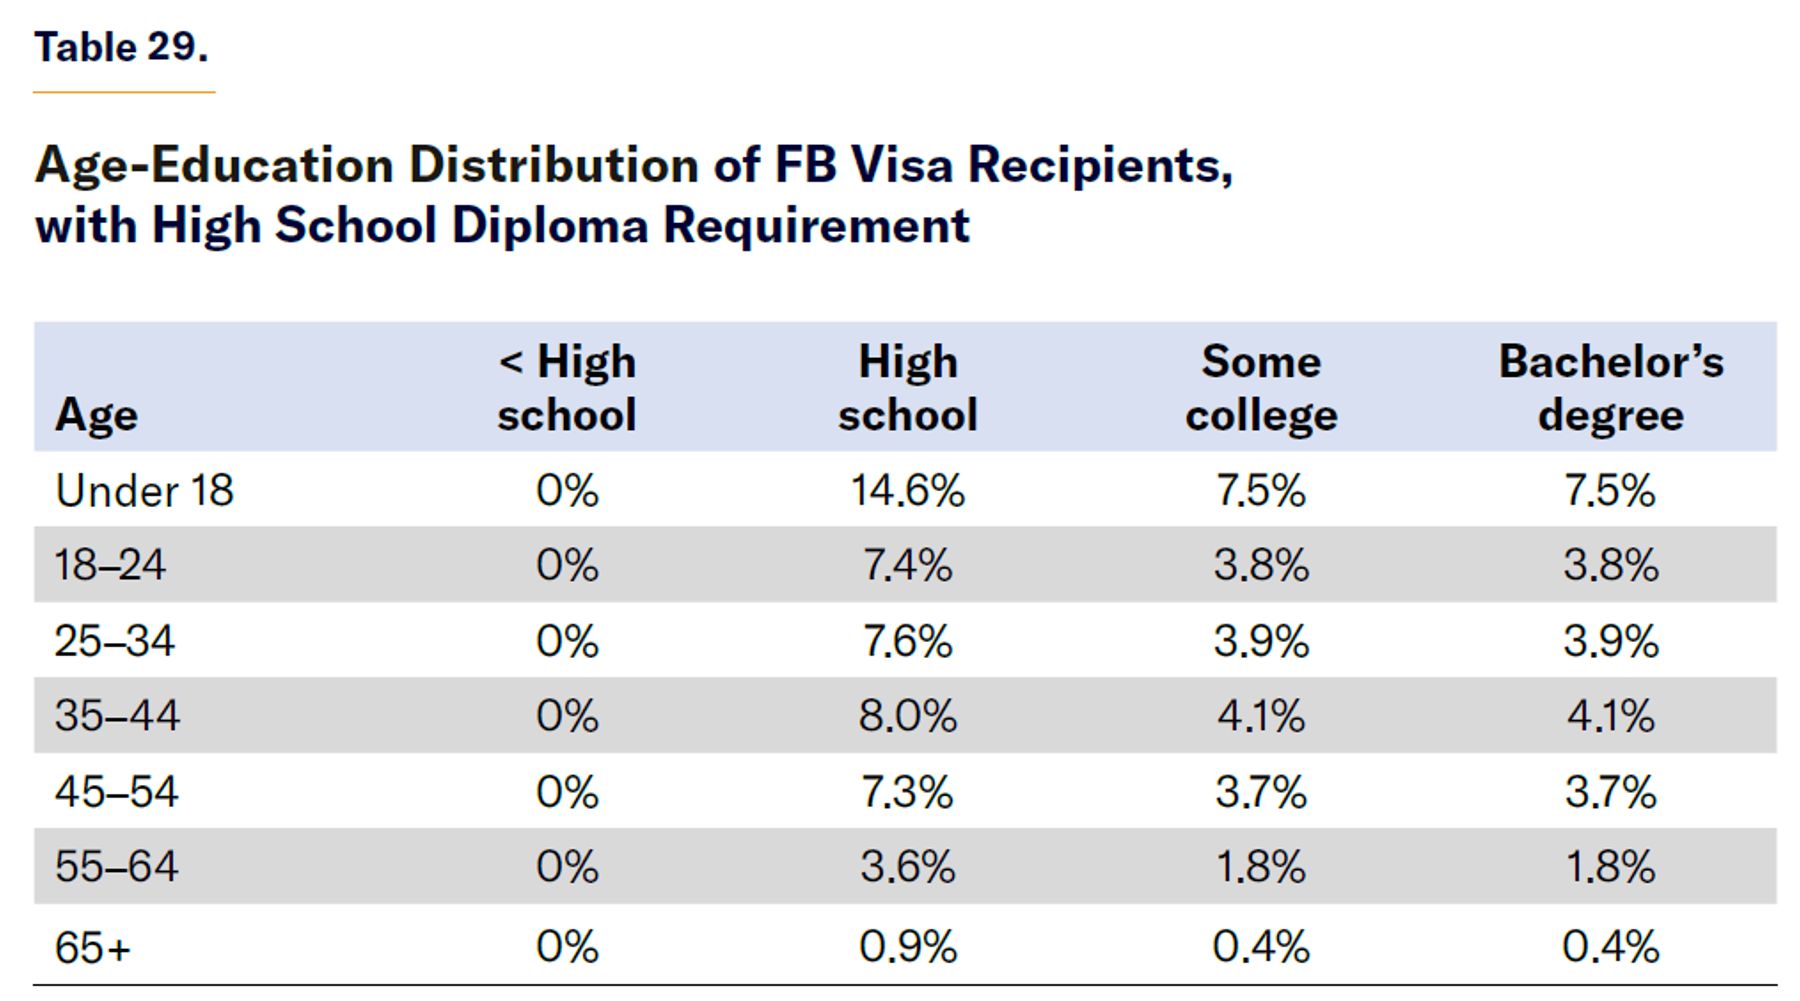
With this change, the average adjusted fiscal impact of an FB immigrant rises from –$2,100 to nearly $22,000. As there are 226,000 FB immigrants annually, this results in a positive net fiscal impact of over $5.4 billion.
Convert the Diversity Lottery into EB Visas
This policy would transfer the 55,000 annual green cards from the diversity visa (DV) lottery to the EB-1 and EB-2 categories, increasing the educational attainment of the legal immigration flow.
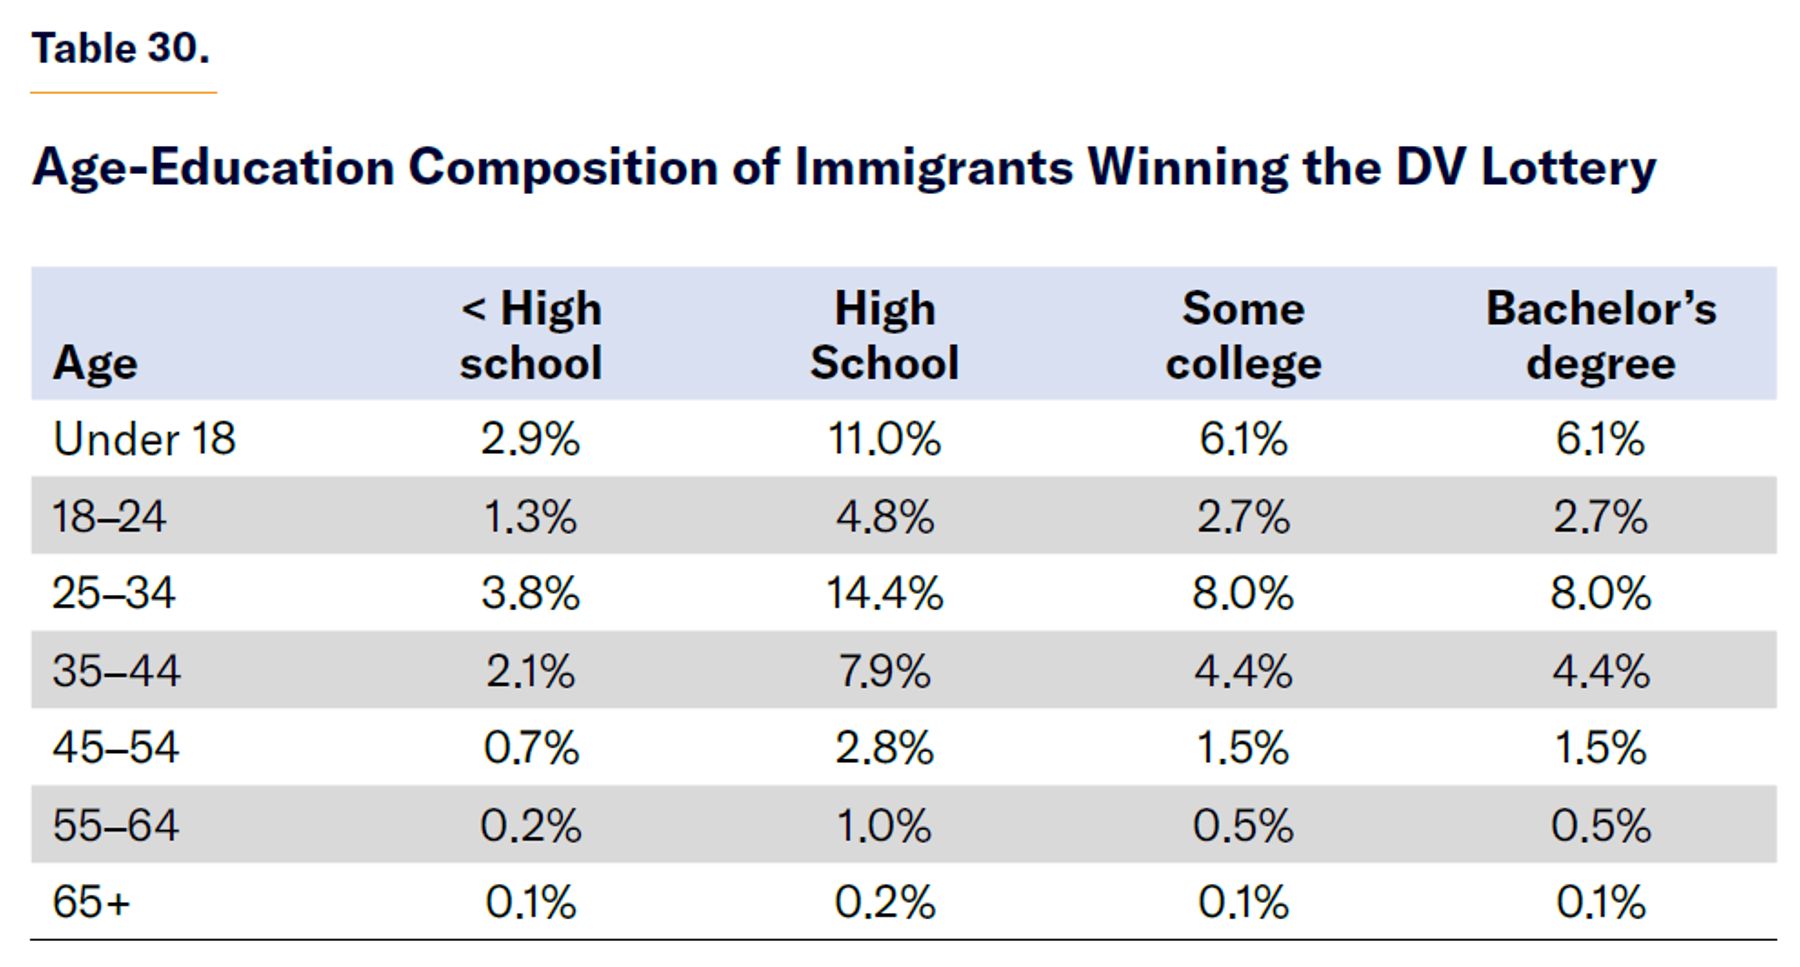
The average expected fiscal impact of DV immigrants is positive by over $34,000 over their lifetimes because about half of them have some college education and tend to be young or have families with children (Table 30). But Table 31 shows the age distribution of the EB-1 and EB-2 immigrants, all of whom have graduate degrees and have an average positive fiscal impact of over $1 million.
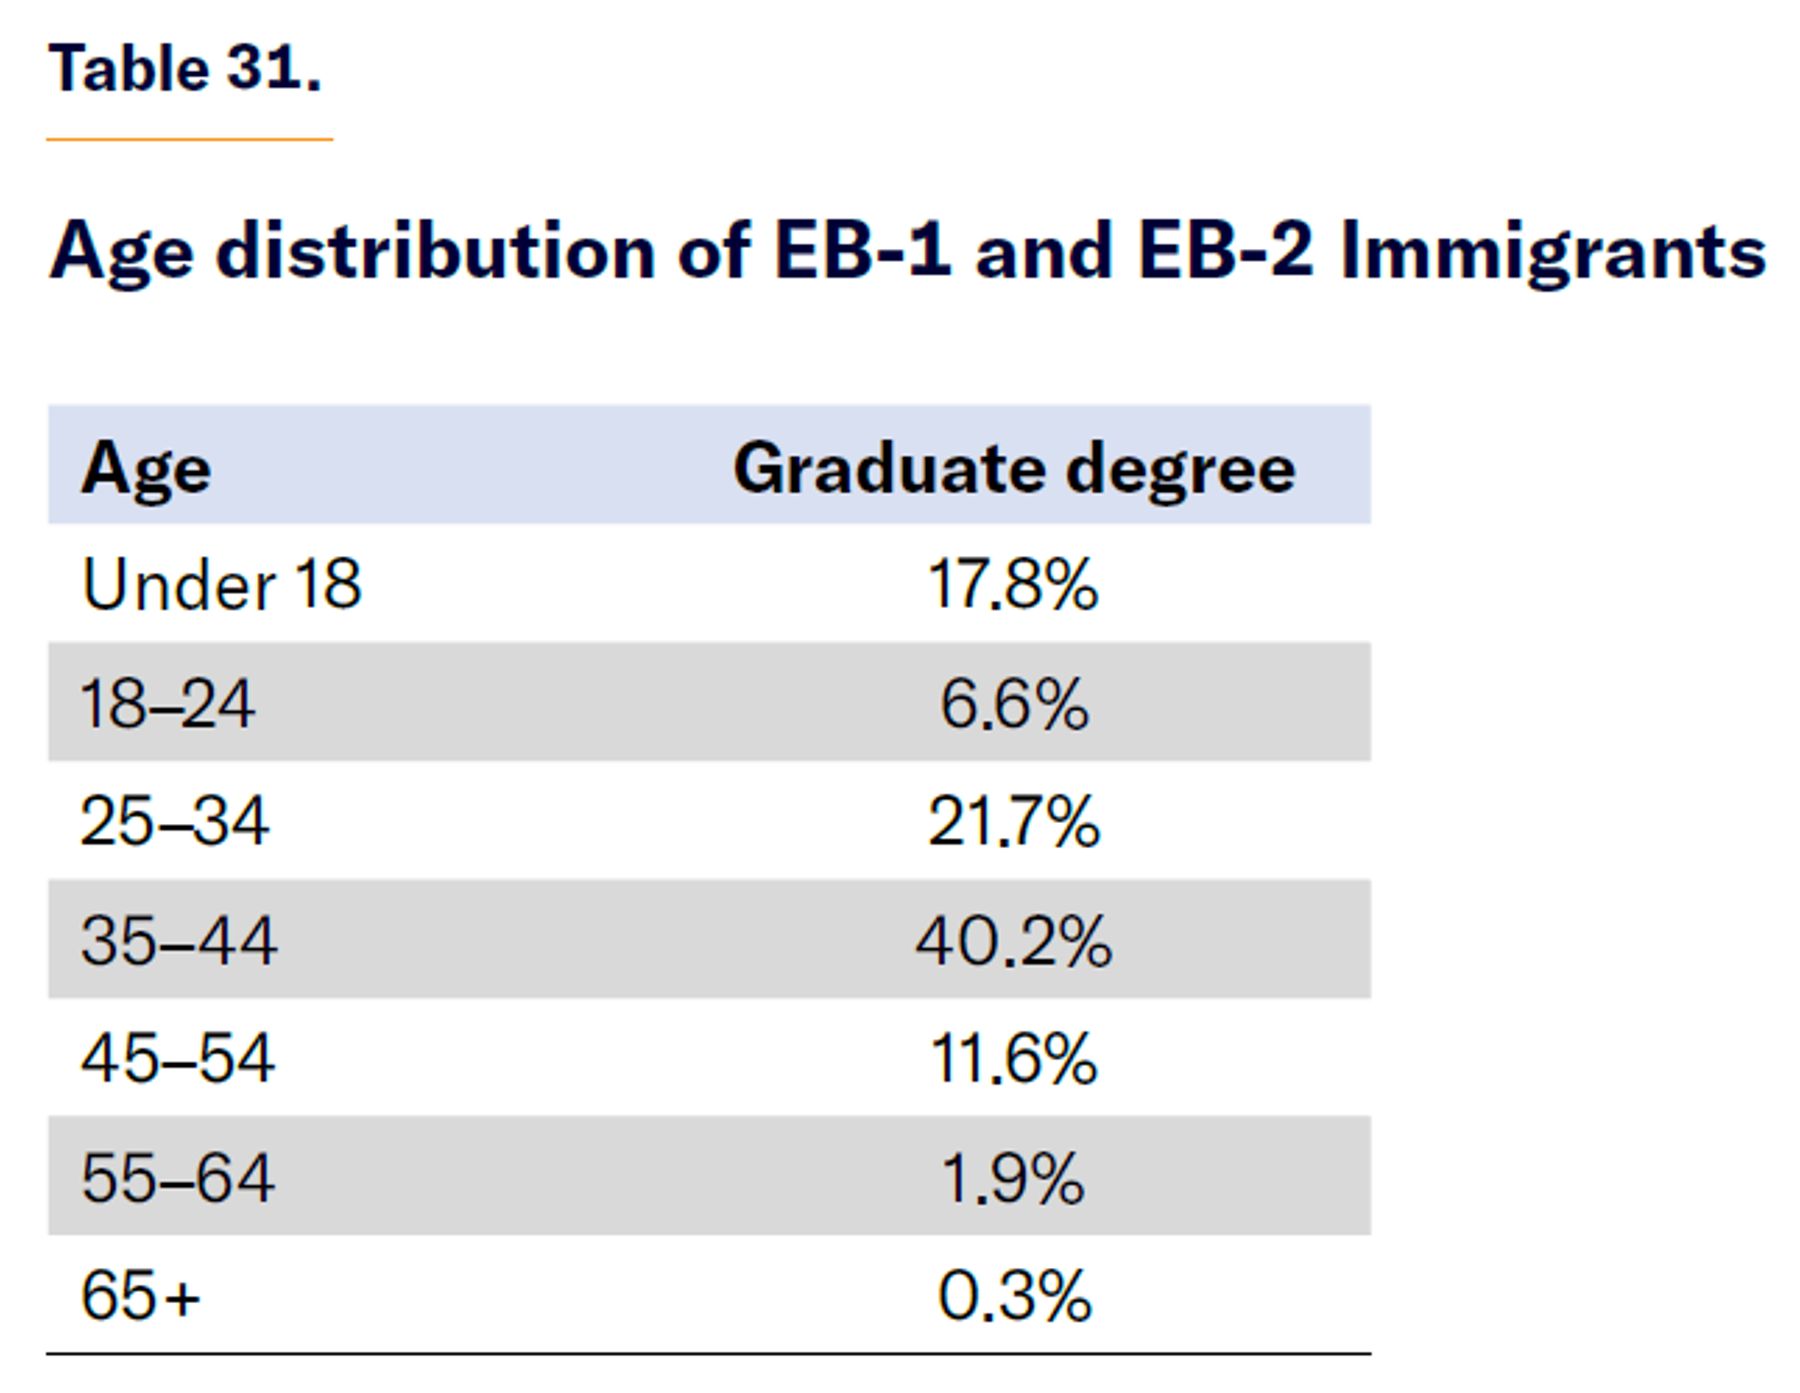
Therefore, transferring 55,000 visas per year from the DV to the EB-1 and EB-2 categories would reduce the federal debt in net present value terms by nearly $55 billion per year.
Doubling the H-1B Visa Cap
The H-1B visa cap is set at 85,000 for cap-subject organizations; colleges and research institutions can sponsor eligible noncitizens without limit.[49] More than 500,000 individuals have applied in the last cycle, who are accepted or rejected by a lottery.
The Department of Homeland Security releases annual reports with the characteristics of all and new H-1B visa holders.[50] The age and education distributions of new or initial-employment H-1B visa recipients approved in FY 2023 are in Table 32.
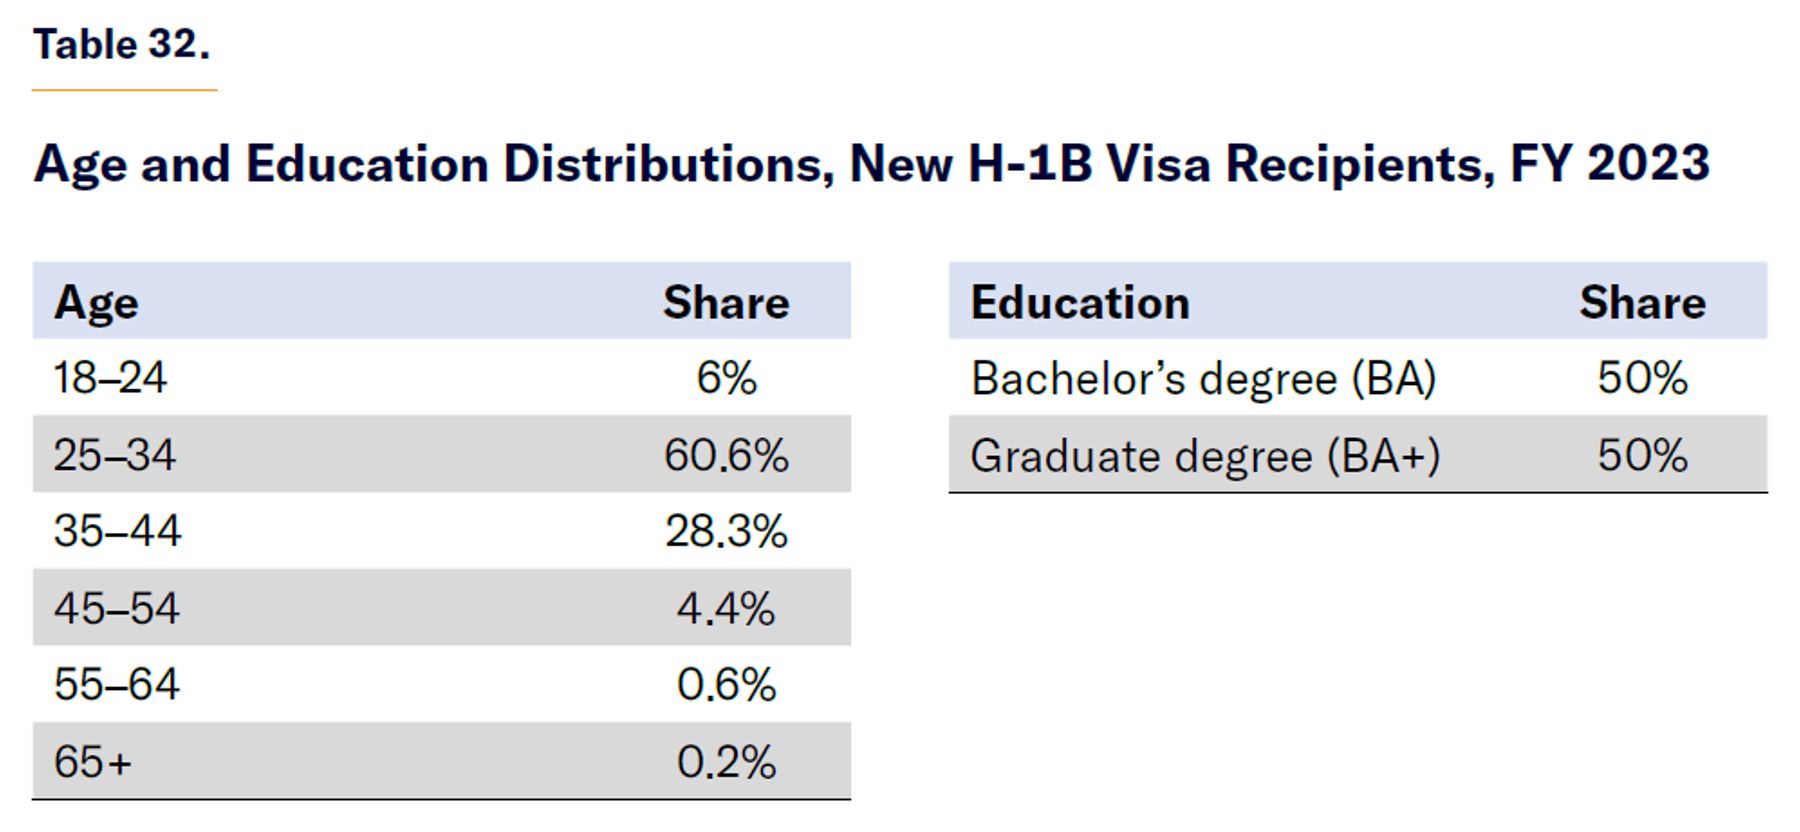
For the age distribution, I assume that the very few individuals whose ages are unknown were proportionally distributed across age groups. The share of unknown education level was high, at 27%. I assume that these are also equally distributed. Additionally, I assume that the cap-subject and cap-exempt petitioners are of similar ages and education.
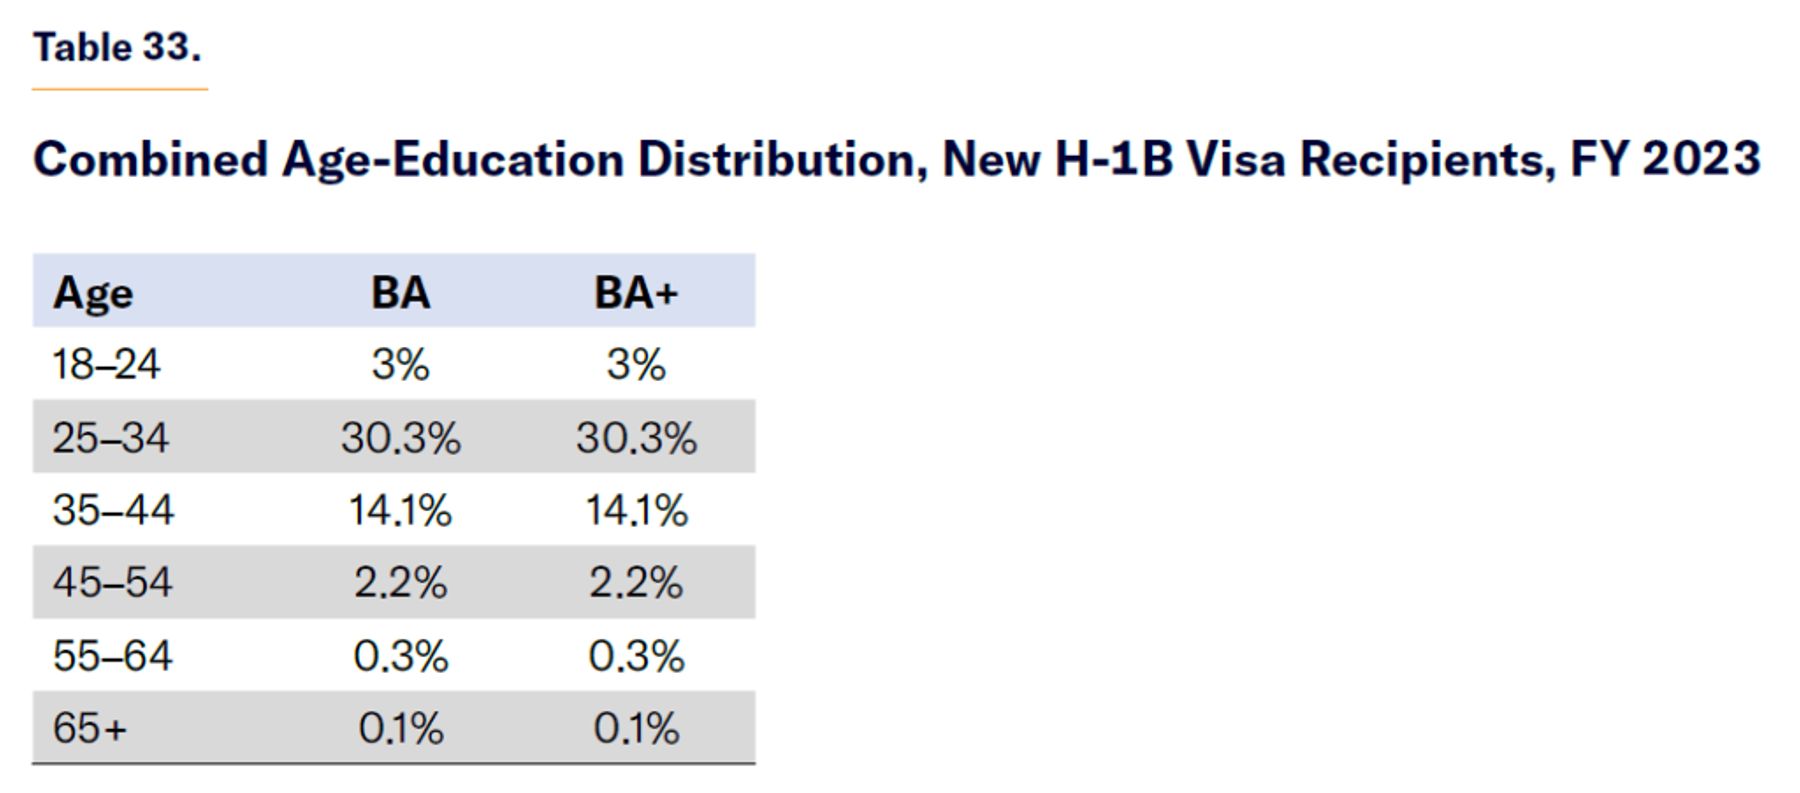
In order to obtain a combined age-education distribution (Table 33), I simply assume all age groups just as likely to have each education level. While this is unlikely and could overestimate the positive fiscal impact if the more highly educated turn out to be older, I am also implicitly assuming that none of the bachelor’s degree holders seek further education, which introduces a compensating negative bias to the ultimate fiscal impact of the policy.
This estimate assumes that the emigration rates of H-1B holders are the same as the average immigrant population, with about one-third of these immigrants leaving by the end of their lifetime and 10% within one year. Since most H-1B visa holders end up in the immigrant visa backlog or receive a green card, it’s reasonable to assume that most will stay.
The resulting fiscal-impact estimate is that each additional H-1B visa issued reduces the deficit by over $827,000 over the lifetime of the immigrant in net present value. Thus, doubling the H-1B visa cap would reduce the deficit by over $70 billion in net present value terms every year that the higher cap is in place.
Furthermore, the expansion of the H-1B visa cap could be paired with an elimination of the lottery system, awarding visas by wages offers instead, and adjusted by the age of the immigrant and the location’s wage average, as proposed in a previous MI report.[51] This would ensure that those selected are even more highly paid and thus have a more positive fiscal impact.
Exempting Graduate Degree Holders from Visa Caps
A recent popular proposal in Congress would be to exempt immigrants who have earned a master’s degree or PhD in a STEM area from a U.S. university from all visa caps, specifically from green-card caps.[52] This would benefit immigrants waiting mainly for EB-1, EB-2, and EB-3 visas, mostly from India but also from China and other countries. By exempting certain immigrants from the cap, others waiting in the backlog for visas would benefit from a shorter wait time, increasing legal immigration. This policy would benefit some FB and EB-4 and EB-5 prospective immigrants who have graduate degrees in a STEM areas, too.
To determine the impact of this policy, we must first know how many individuals in the backlog have graduate degrees in a STEM area from a U.S. university. Currently, 436,000 international students are enrolled in all master’s and doctoral programs in the U.S., but not all will graduate this year, not all are in STEM, and not all are interested in or qualified for an existing U.S. visa.[53]
Perhaps the best proxy for how many immigrants would potentially benefit is the number of approved international student applicants for USCIS’s Optional Practical Training Extension for STEM Students (STEM OPT) program, which allows graduates of U.S. universities to work for an additional two years after the one year of work postgraduation that all international students can perform. An approved STEM OPT application is a good indicator of the desire to remain, and the number of approved applications has been increasing from fewer than 100 in 2008, when the program began, to more than 11,000 in fiscal year 2022.[54]
Additionally, thousands of immigrants waiting for a visa in the current visa backlog would be allowed to adjust their status to permanent resident. While the number of beneficiaries in the backlog is large, many of these immigrants would have stayed in the U.S. regardless of this policy under a perpetual H-1B visa status, and many new applicants would have stayed as well.
According to USCIS,[55] most EB-2 applications are from STEM applicants—about 72% of all EB-2 applications from FY 2018 to FY 2023. I will assume that the same STEM share of applications holds true for EB-1 and EB-2, that all EB-1 applicants have a graduate degree, and that approval rates for petitions are equal across STEM and non-STEM categories.
One could think of this policy as reducing the emigration rate and consequently increasing the number of immigrants. If the emigration rate is reduced to zero, the positive fiscal impact of the average graduate degree holder who entered the U.S., aged 18–24 (most international students), increases by $860,000, from $1.65 million to $2.51 million.
While I could assume that this policy will lead to just half the impact of a new, similarly qualified immigrant, this is likely true only of immigrants stuck in the existing backlog and would not apply to new applicants. Reducing the wait required to obtain a green card from decades to no time at all would encourage more applications, increasing immigration. I will assume that granting each immigrant in the EB backlog a green card has the impact of approximately half an immigrant ($860,000) while each additional future green card has the impact of a new full immigrant.
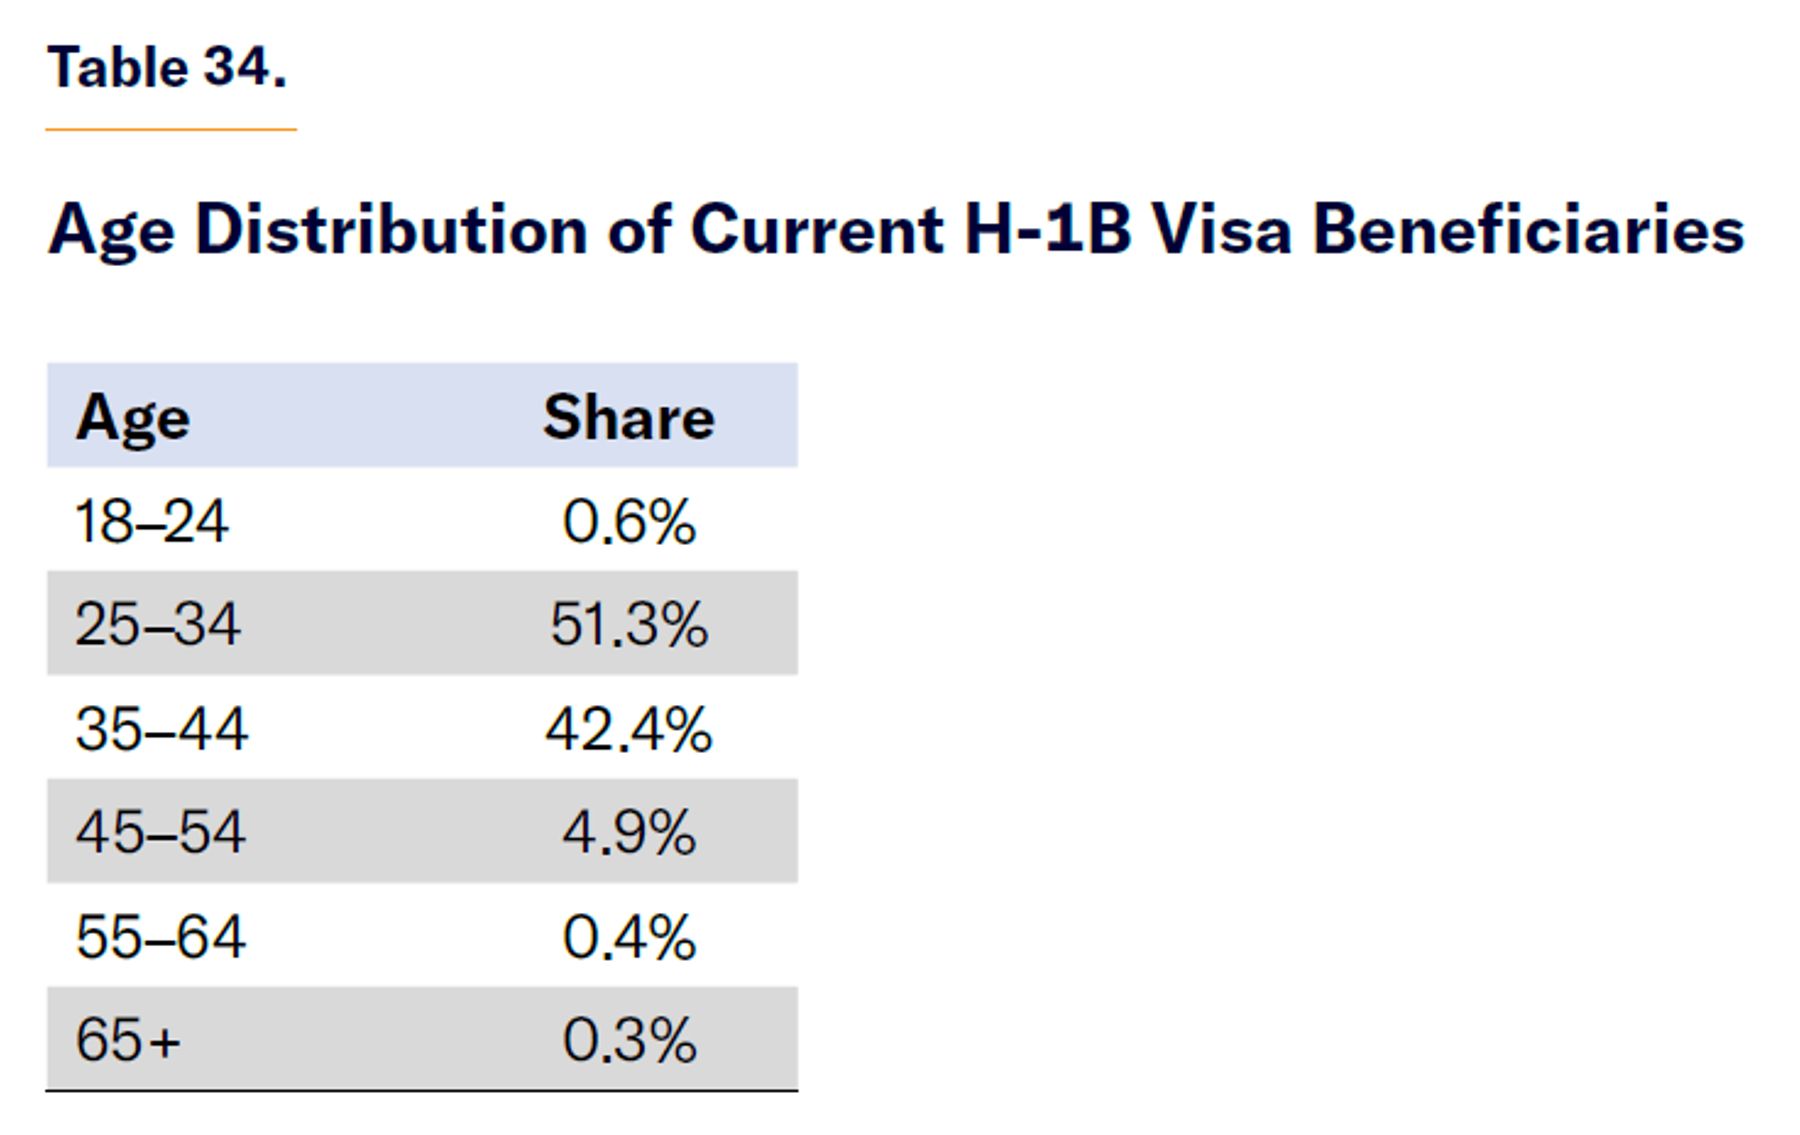
If backlogged EB applicants are just as likely to have a STEM degree as new ones (Table 34), potentially 585,000 people (the number of backlogged EB-1 and EB-2 applicants and family in STEM fields as of Q2 of FY2024)[56] would immediately be eligible for green cards as a result of this policy and therefore will not be as likely to emigrate. Since not all the backlogged immigrants have a U.S.-based degree, I will provide a range of fiscal-impact scenarios for the first year and for every following year, depending on the share of the backlog that consists of immigrants with U.S. STEM degrees. The first-year impact includes the impact of clearing the backlog plus the first year of new visas, while the perpetual annual impact is the impact of only new visas. Additionally, backlogged individuals are assumed to have the age structure of all continuous H-1B visa petitioners[57] (those who have been on an H-1B visa for at least three years).
The average fiscal impact of an immigrant population with graduate degrees with this age structure is a positive net present value of over $1.1 million, while the fiscal impact for new applicants, aged 18–24, who arrived as international students is over $1.6 million.
The following tables show three scenarios where the population that graduates from a U.S. college with a graduate degree in a STEM area rises to 10,000, 15,000, and 20,000. Table 35 shows the first-year impact; Table 36 shows the perpetual impact. Note that the total number (graduate and undergraduate) of STEM OPT approvals every year is 11,000, and universities would have physical, financial, academic, and regulatory constraints to expand.
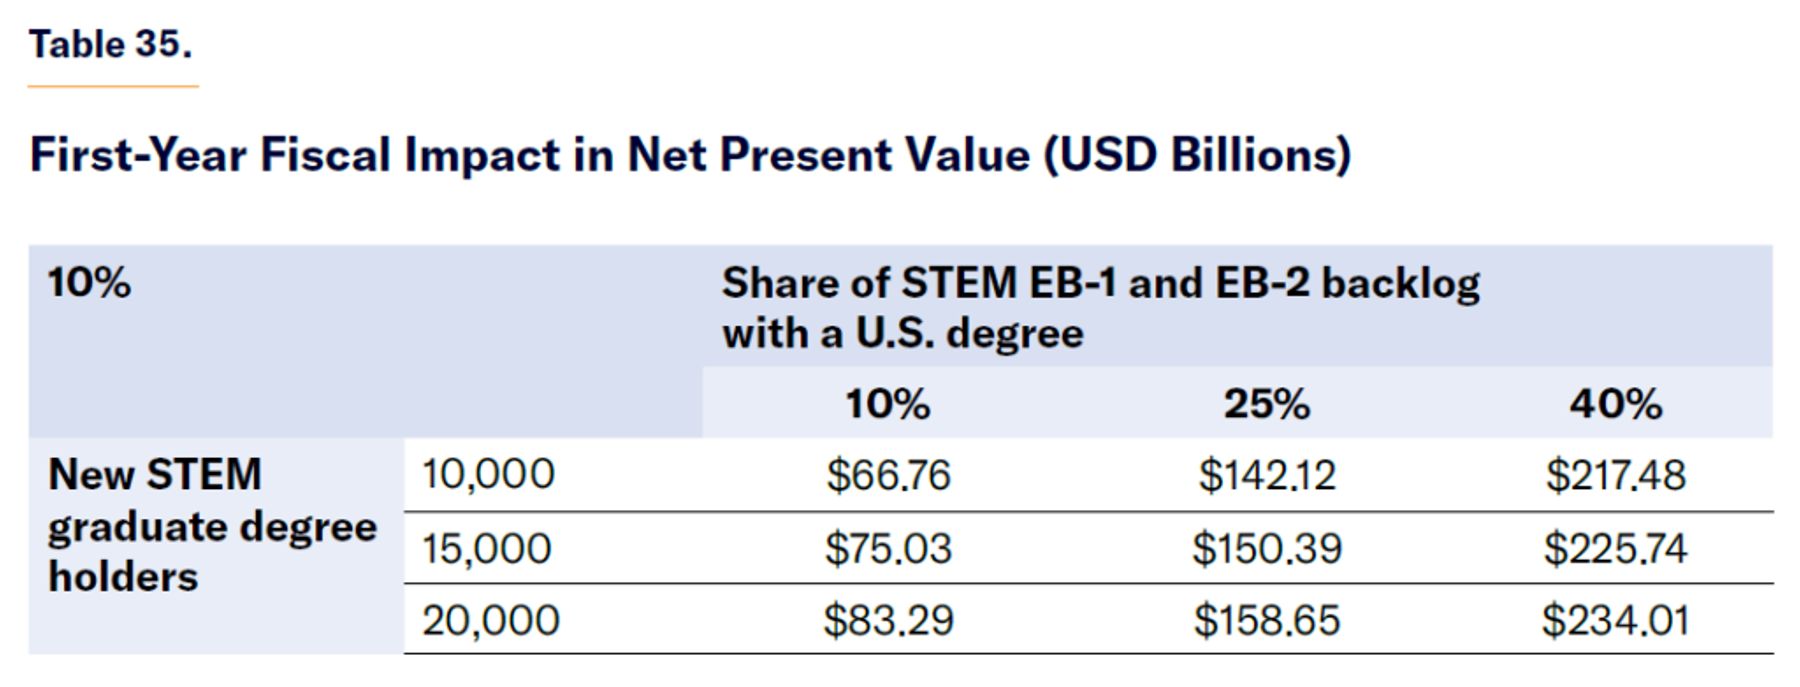
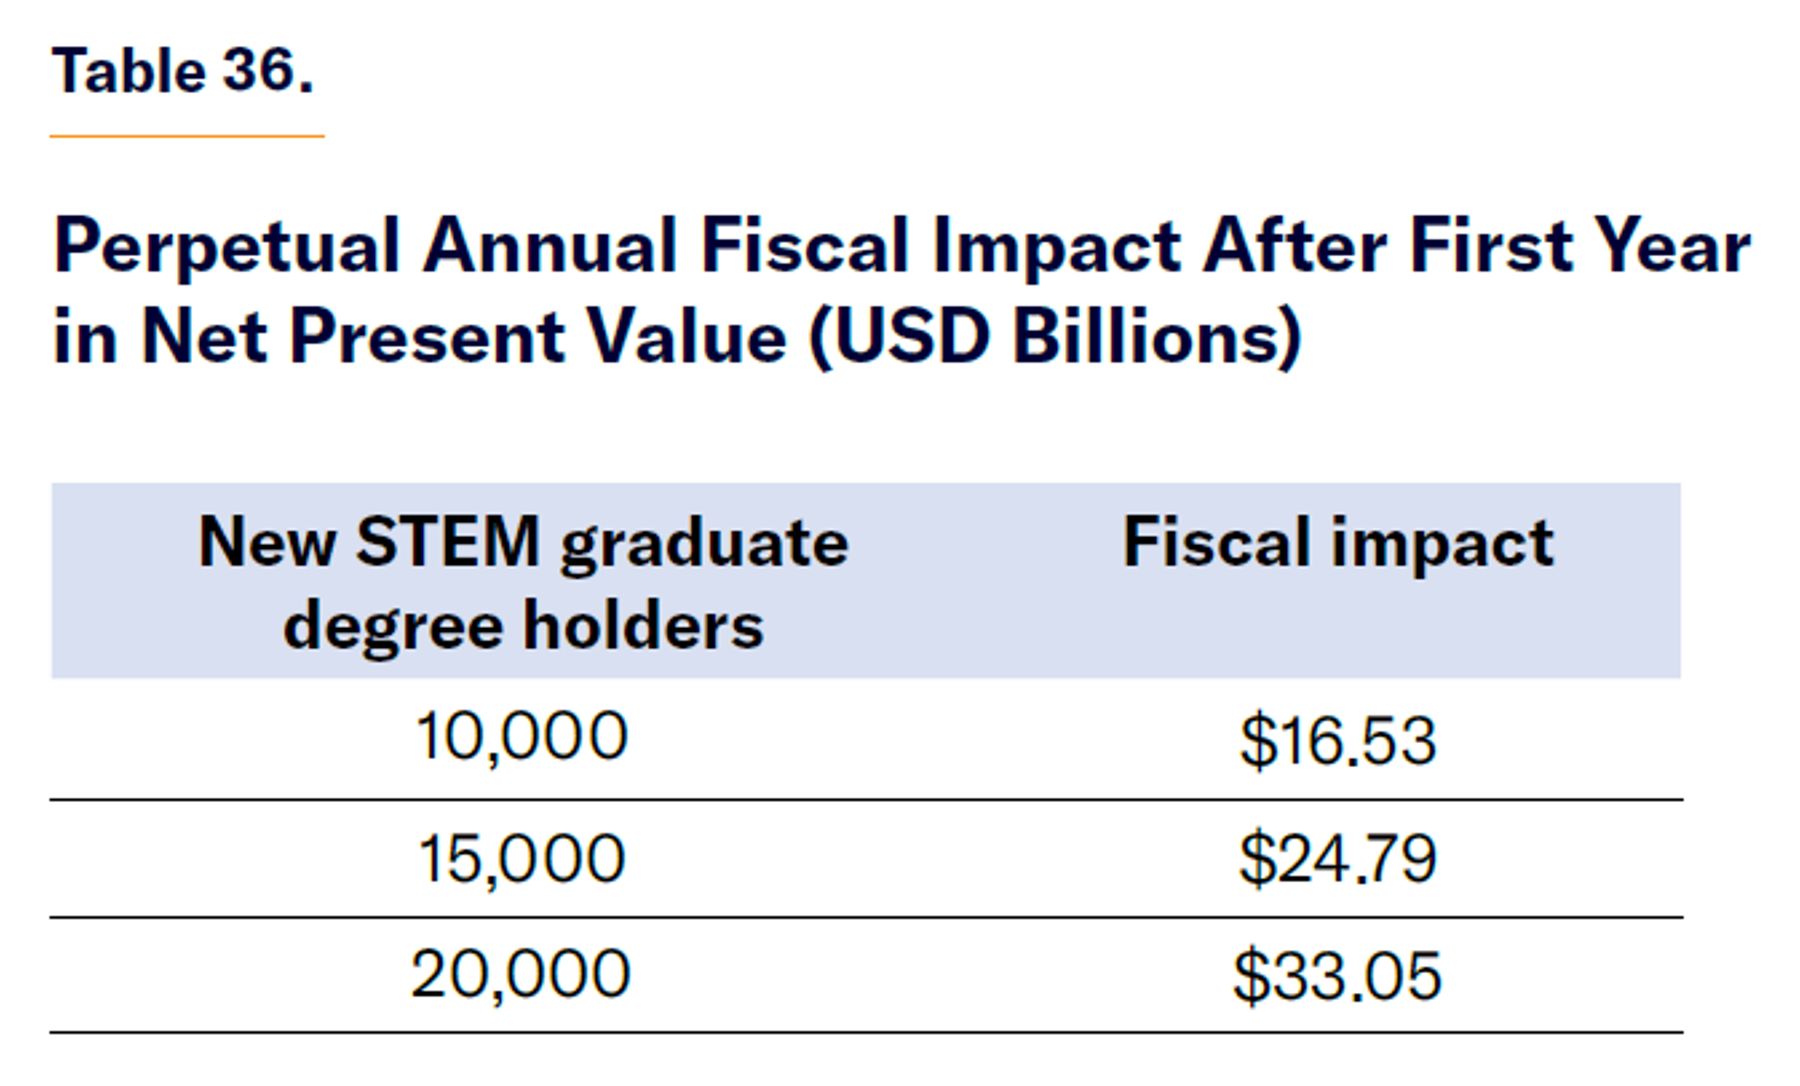
During its first year, the policy of exempting STEM graduate degree holders from immigration caps would have a positive fiscal impact of $67 billion to $234 billion in net present value and then a perpetual positive impact of $17 billion to $33 billion every year that it stays in place—i.e., expanding the number of EB visas could significantly close the budget deficit without even factoring in economic and productivity growth from more scientists, researchers, and their children.
Allow Child-Dependents of Long-Term Visa Holders to Obtain a Green Card
This policy is based on the many versions of the bipartisan America’s CHILDREN Act,[58] which would authorize lawful permanent resident status for some immigrants’ dependents waiting for a green card in the EB backlog. These so-called documented dreamers hail mostly from India but also from China and other countries, and they arrived legally as children under their parents’ work or investment visa. But they turned 21 while their parents waited for a green card and are no longer eligible based on their dependent visa. Instead, they must become international students in U.S. universities, apply for their own work visa, or leave the U.S.—despite, in many cases, having lived in the country for nearly their whole lives.
This is a highly educated population, since all their parents hold bachelor’s degrees and most hold graduate degrees. Based on the ACS, if this population comprises only Indian- and Chinese-born immigrants who came to the U.S. as children and all have a college education, approximately 60% have a graduate degree while 40% have a bachelor’s.
This policy proposal would either let the children of long-term visa holders who obtain a college degree wait for a green card indefinitely, allowing them to stay and work permanently as they wait (for decades), or give them green cards outright.
To model the impact (Table 37), I assume that the policy does not increase immigration but rather reduces emigration to zero among affected immigrants—because the policy does not expand eligibility and affects only minors who are unable to apply for a visa on their own. I estimate the number of potential beneficiaries from USCIS’s database on approved I-140 petitions for EB-1, EB-2, EB-3, and EB-5 visas.[59] These are individuals who are approved to obtain these EB green cards but must wait years until they become available. I exclude the EB-4 category because it is mainly for immigrant juveniles who were abused and religious workers. The number of likely children comes from the actual share of EB visas in these categories that went to dependent children. This results in approximately 170,000 potential beneficiaries immediately from policy enactment. Every year, new children age out from their parent’s visa under current policy, so this proposal would affect approximately 10,000 new immigrants every year after enactment.
If emigration is reduced to zero among bachelor’s degree and graduate degree holders who arrived before age 18, their net adjusted fiscal impact increases from $626,000 and $1,178,000 to $979,000 and $1,868,000, respectively.
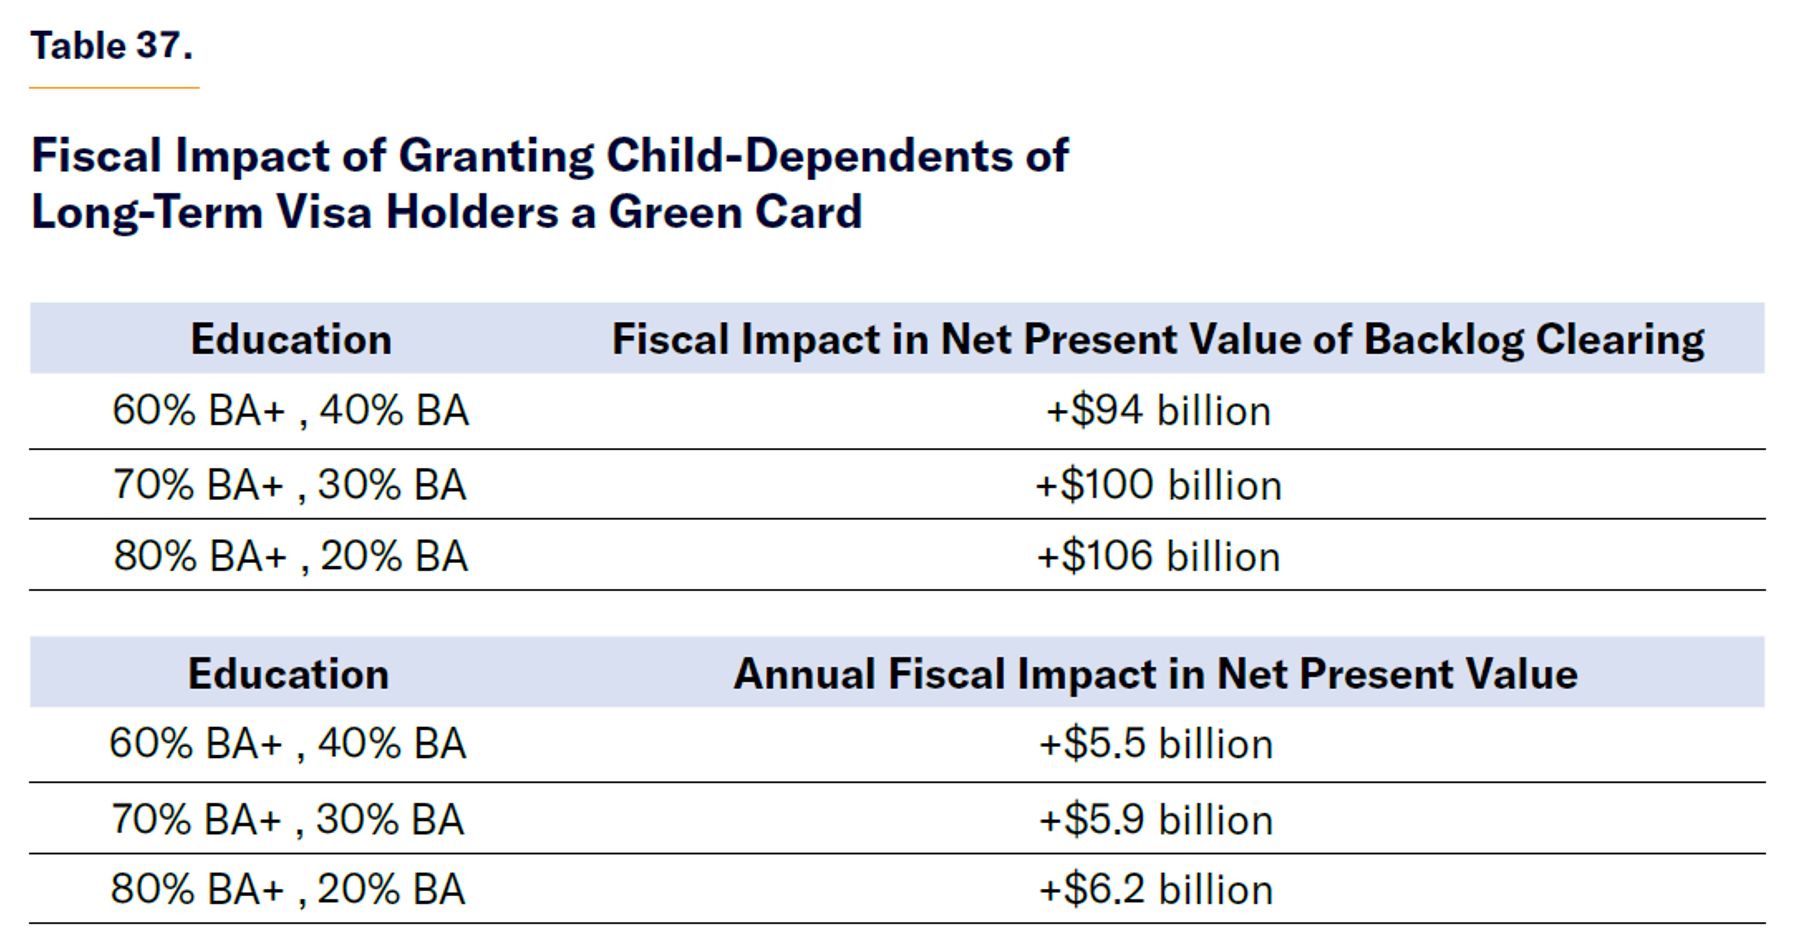
Combining Multiple Policies in Immigration Reform
Now imagine that Congress passes comprehensive immigration reform to maximize high-skilled immigration and reduce low-skilled immigration. This legislative package could include:
- Creating a regularization program for unlawful immigrants who pay a fee, on average of $100,000.
- Eliminating the formal government refugee program or convert it into a private refugee-sponsorship program that allows nonprofits wishing to pay a fee of approximately $150,000 depending on their age and education to sponsor refugees to pay a fee to compensate for their net fiscal costs and another fee to DHS for vetting.
- Turning the immigrant visa for parents of U.S. citizens into a nonimmigrant visa, or require a fee of $261,000 to sponsor a parent for a green card.
- Requiring a high school diploma for FB immigrants.
- Transferring the 55,000 Diversity lottery visas into the EB-1 and EB-2 immigration categories.
- Increasing the H-1B visa cap from 85,000 to 170,000, with the reserved visas for those with graduate degrees also doubling, from 20,000 to 40,000.
- Exempting all applicants with a graduate degree from a U.S. institution in a DHS-designated STEM area from caps in the EB immigrant visa categories.
- Allowing children of long-term visa holders waiting for a green card under the EB backlog to receive a green card after graduating college.
The fiscal impact of such a proposal would be over $2 trillion in net present value during the first year and over $200 billion each subsequent year, without accounting for the additional productivity growth from high-skilled immigration (Table 38).
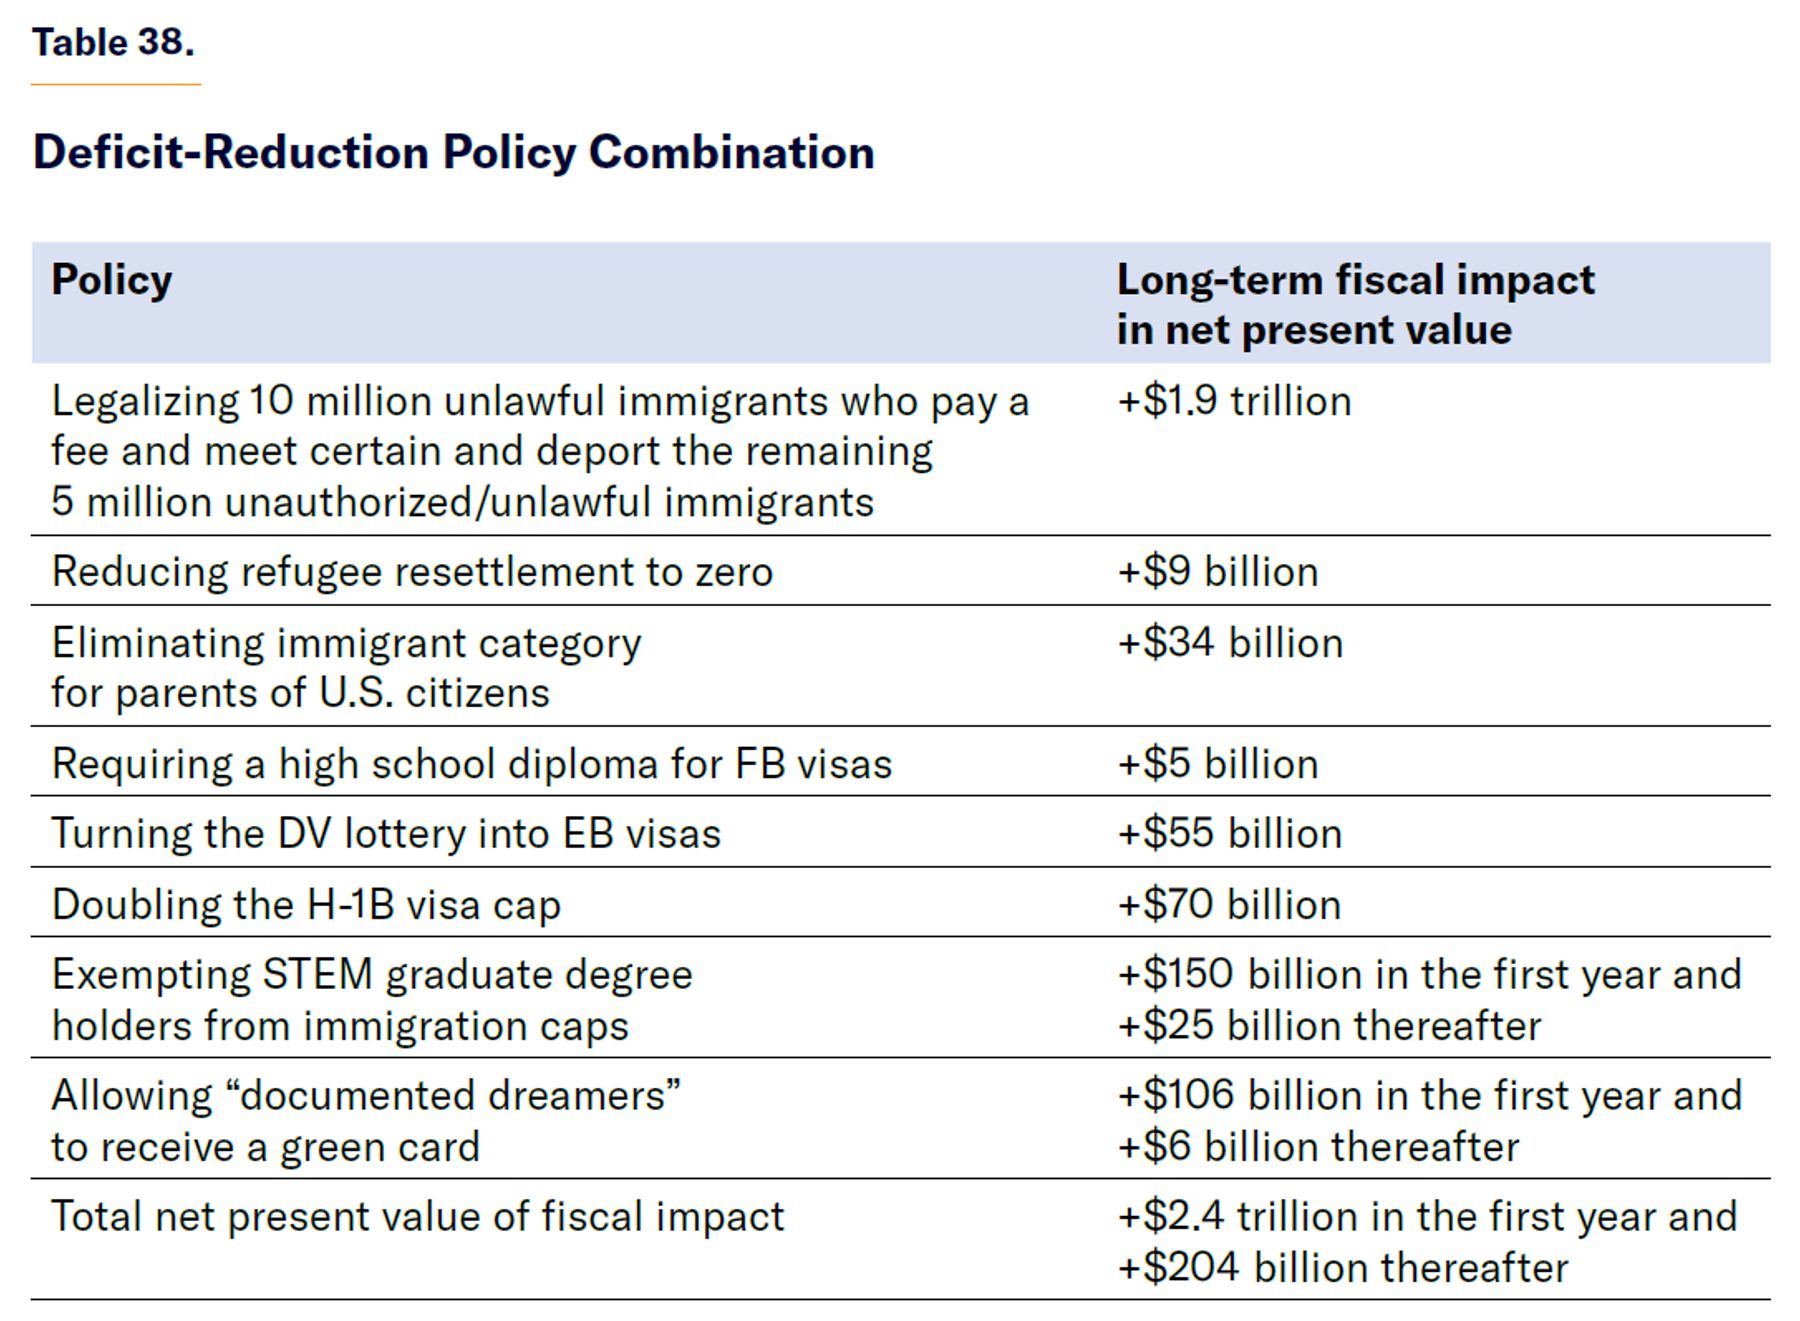
Under this plan, the annual number of immigrants who are new permanent residents decreases by about 15% after the temporary legalization program for 10 million and partial clearing of 590,000–750,000 immigrants and dependents in the Employment-Based immigration backlog (Figure 14). Long term, annual legal immigration decreases under this plan from approximately 1 million in FY 2019 (before the Covid-19 pandemic disruptions) to approximately 860,000.
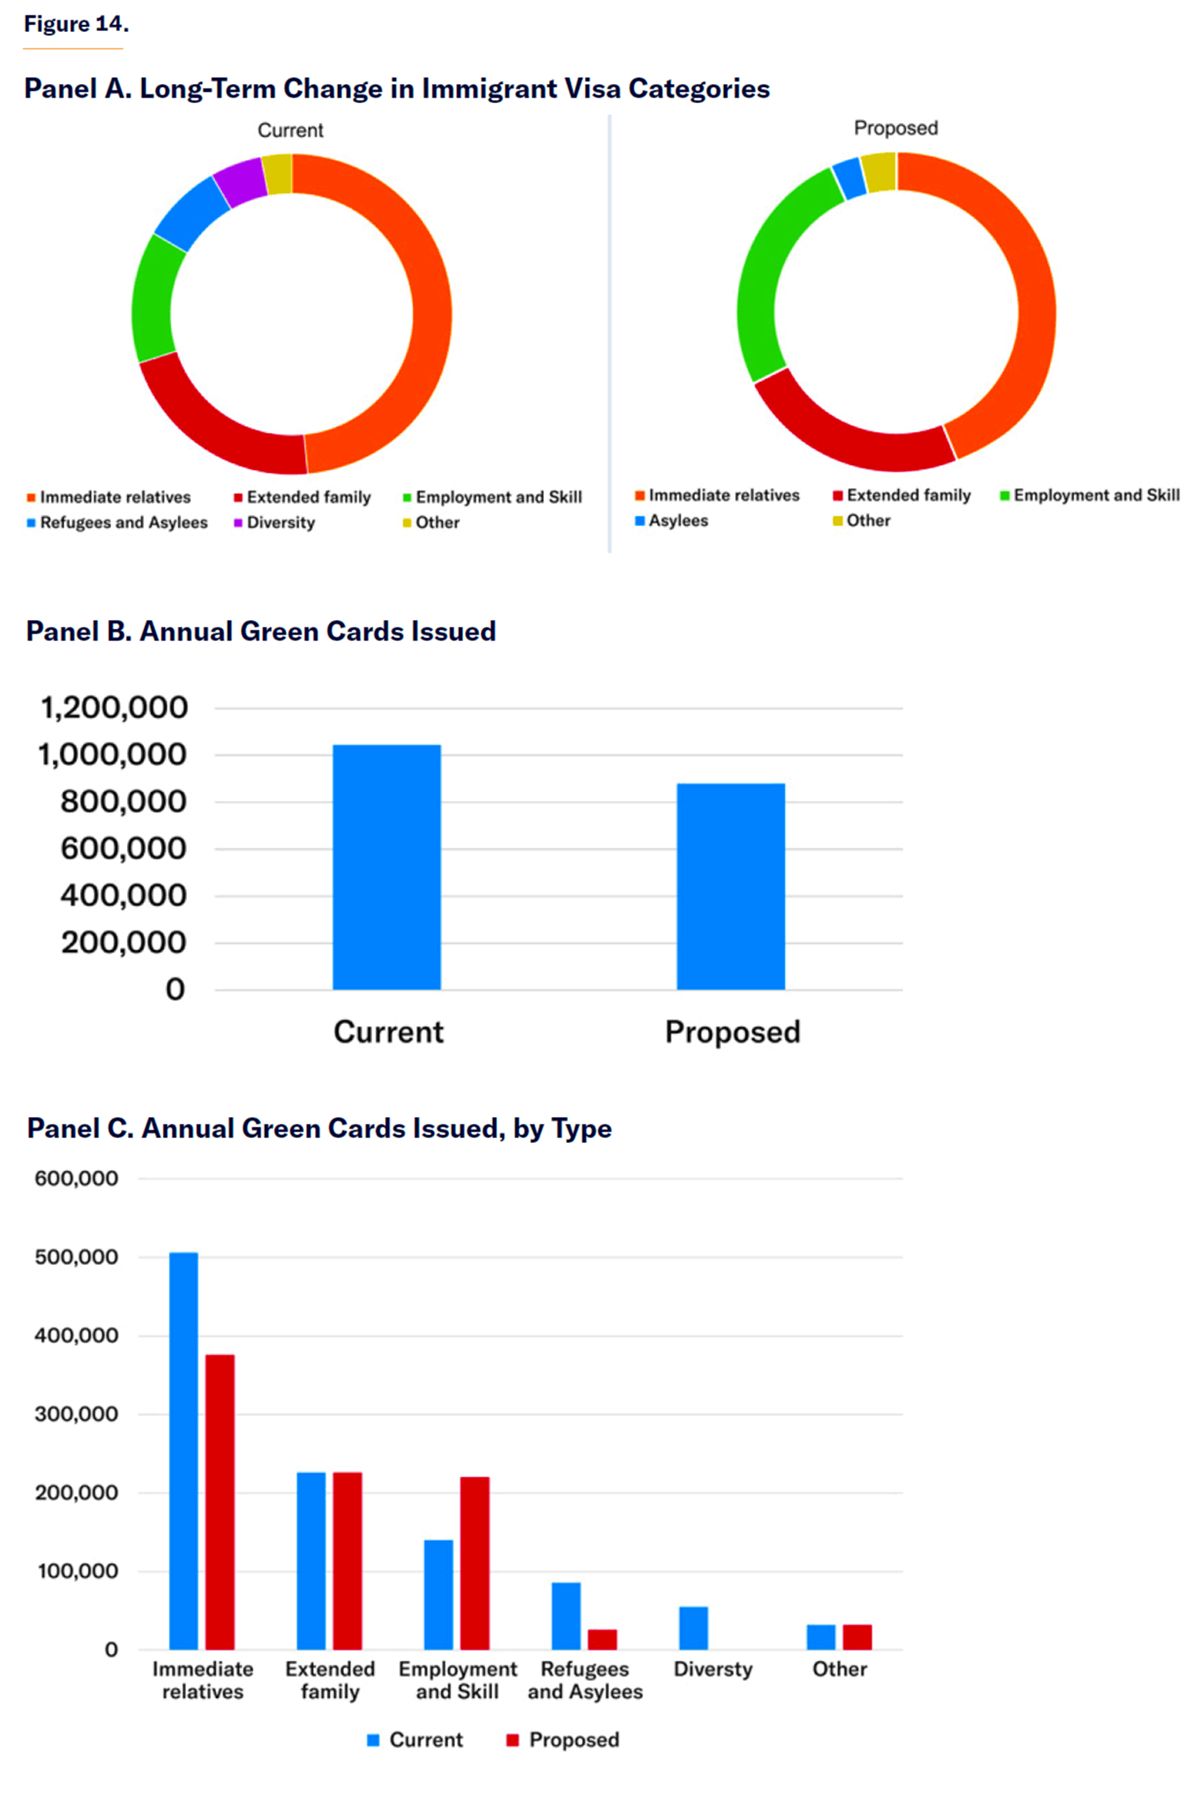
Conclusion
This report underscores the profound impact of immigration on the federal budget, especially by highlighting how age and education are pivotal in the potential fiscal impact of immigrants. Younger and more educated immigrants consistently pay more in taxes and receive fewer government benefits than their older and less educated counterparts throughout their lives. By enacting immigration policies that select younger, college-educated immigrants, the U.S. could significantly reduce the national debt over the long term by trillions of dollars.
It is clear that, on average, immigration has a net positive fiscal impact on the federal budget largely because it dilutes the burden of the federal debt across a growing population. However, this is a temporary remedy. The real concern from this finding is that the fiscal future of the U.S. is dire. If native fertility continues to fall or high-skilled immigration decreases, the labor force will shrink even faster, and the debt burden per person will grow rapidly and become unsustainable.
While the average immigrant reduces the budget deficit, this fact masks significant differences by age at arrival and education. Immigrants without any college education and those over the age of 55 when they first arrive tend to increase the budget deficit, both in absolute terms and adjusted for their economic impact. Conversely, immigrants with college and graduate degrees, especially those under 45 when they arrive in the U.S., tend to be net fiscal contributors by up to over $1 million over their lifetimes. This disparity highlights just how flawed is the status quo of U.S. immigration policy, where millions of unlawful immigrants with little education are allowed to enter, while hundreds of thousands of highly educated and highly paid immigrants face decades-long waits for green cards and are even forced to self-deport.
Policies that restrict low-skilled and old-age immigration—such as eliminating visa categories or charging a fee to participate, requiring a high school diploma to obtain a visa, or reducing refugee resettlement—can reduce the deficit significantly. However, the budget savings of these restrictions are dwarfed by the benefits of selected expansions in high-skilled legal immigration, especially exempting immigrants with STEM graduate degrees from visa caps or raising the number of annual H-1B visas issued.
The large costs of unlawful immigration—along with the high cost of deportations and many benefits of allowing immigrants who arrived as children to stay—highlight the fiscal dilemma of immigration enforcement. Deportations, on average, reduce the budget deficit, and a policy of mass deportations would save over $1 trillion for the federal government in the long run. But a legalization program that asks unauthorized immigrants to pay a fee to legalize their status and allows DREAMers to remain, while deporting the costliest migrants, including criminals, would be the most fiscally beneficial policy, saving some $1.9 trillion over the long run. A policy of blanket legalization or amnesty is undesirable because it would impose large costs on taxpayers by making millions of people eligible for entitlement benefits.
If all the recommendations made in this report are implemented, the U.S. could reduce the debt and grow the economy by potentially $2.4 trillion over the long run, rising by over $200 billion every year that these selectionist immigration policies remain in place. Selectionist immigration requires taking a strategic approach to immigration that prioritizes young and highly educated immigrants over older and less educated immigrants.
Of course, people’s fiscal impact should not be the only consideration for whether they are allowed into a country; in some cases, it should not even be a factor (spouses of U.S. citizens and their minor children, for instance). But policymakers must take the fiscal impact into account. When an American citizen or a business sponsors a family member or worker, or when the government welcomes a refugee, the transaction is not limited to the people directly involved; instead, that transaction is bringing a cost or a benefit to taxpayers and the entire United States. The immigration debate is one we cannot afford to ignore.
About the Author
Daniel Di Martino is a PhD candidate in economics at Columbia University and a graduate fellow at the Manhattan Institute, where he focuses on high-skill immigration policy. Born and raised in Venezuela, he came to the U.S. in 2016. He has appeared many times on national TV, including Fox News and CNN, and has written for USA Today and National Review. Di Martino speaks regularly on college campuses and at high schools. He is the founder of the Dissident Project and a member of the board of advisors of Young America’s Foundation.
Acknowledgments
The author thanks the following individuals for their feedback and support during the research for this report: Dr. George Borjas, Reade Ben, and Victoria Freeman.
Corrections and Clarifications
This report initially misstated how the Cato Institute report accounted for immigrant age of arrival. The error has been corrected.
Appendix A: Acronyms and Definitions
ACS: American Community Survey
Age at migration: The age of an immigrant in the year he first entered the U.S.
CBO: Congressional Budget Office
CDC: Centers for Disease Control and Prevention
CES: Consumer Expenditure Survey
CHIP: Children’s Health Insurance Program
CMS: Centers for Medicare & Medicaid Services
CPS: Current Population Survey
DHS: Department of Homeland Security
Direct public goods: Government services and goods that are congestible, meaning that as demand for a public good increases and the number of people using or consuming a good increases (becomes more “congested”), the value or quality of the good decreases for other users (i.e., public highways or the administration of justice). Direct public goods are, therefore, partially rival.
Discount rate: The price of time. In the case of money, it represents the difference in utility of money over time. A positive discount rate indicates that money in the present is more valuable than money in the future.
DV: Diversity visa
EB: Employment-based
Emigration: When a resident leaves a country (as opposed to “immigration,” which is when a person enters a country)
FB: Family-based
Fiscal impact: The difference between government revenues and spending
Foreign-born/Immigrant: People who are not American by birth (native-born) and live in the U.S. in any legal status. This may include immigrants who are now citizens but are not native-born Americans.
FRPL: Free or reduced-price lunch
H-1B: A visa type for immigrants with college degrees in specialized fields
ICE: Immigration and Customs Enforcement
Incarcerated: People who are in a prison, jail, or any form of imprisonment due to law-enforcement action
Indirect public goods: Government services and goods that are not congestible, meaning that increased demand for a public good does not affect the efficiency or quality of the good (i.e., national defense, street lighting)
Institutionalized: Committed to an institution where an individual is not independent, such as a prison or a nursing home
KFF: Kaiser Family Foundation
NAS: National Academies of Sciences
Native-born/Native: A person who was born in the U.S., or born abroad to American parents, and is an American citizen by birth
NCES: National Center for Education Statistics
NIPA: National Income and Product Accounts
Primary fiscal impact: The difference between government revenues and spending, excluding interest on the debt
Prime age: The 25–54 age range
Productivity growth: The rate of change in what the average person produces
Public goods: In economics, goods that are generally both non-rivalrous and non-excludable, meaning that if one person consumes them, that does not prevent another person from consuming them as well (i.e., clean air, or national defense) and no one can be stopped from using them. In this report, public goods are all the government spending categories that are not directly received by a person. Public goods are divided into direct and indirect public goods.
SNAP: Supplemental Nutrition Assistance Program
SSI: Supplemental Security Income
STEM: Science, Technology, Engineering, and Mathematics
TANF: Temporary Assistance for Needy Families
USCIS: U.S. Citizenship and Immigration Services
Welfare: All other cash transfer programs
WIC: Special Supplemental Nutrition Program for Women, Infants, and Children
Appendix B: Other Fiscal Scenarios
Below, I present five additional, distinct ways to estimate the fiscal impact of immigration (Table B.1.).
Scenario Descriptions
Scenario 1: Calculates the difference between the net present value of all taxes paid by immigrants minus that of government benefits received, omitting (1) the use of public goods, and (2) the debt obligations resulting from deficit spending or reduced debt from surpluses.
Scenario 2: Adds the cost of direct public goods (i.e., transportation and criminal-justice spending) to immigrants while native-born Americans pay the full cost of all public goods. In this case, immigrants do not raise the cost of indirect public goods (i.e., defense) at all.
Scenario 3: Assumes that immigrants use direct public goods as in Scenario 2 but also are responsible for half the average cost of indirect public goods. Natives still pay the full cost of all public goods. Therefore, indirect public goods spending increases with immigration but at half the rate of the increase in population.
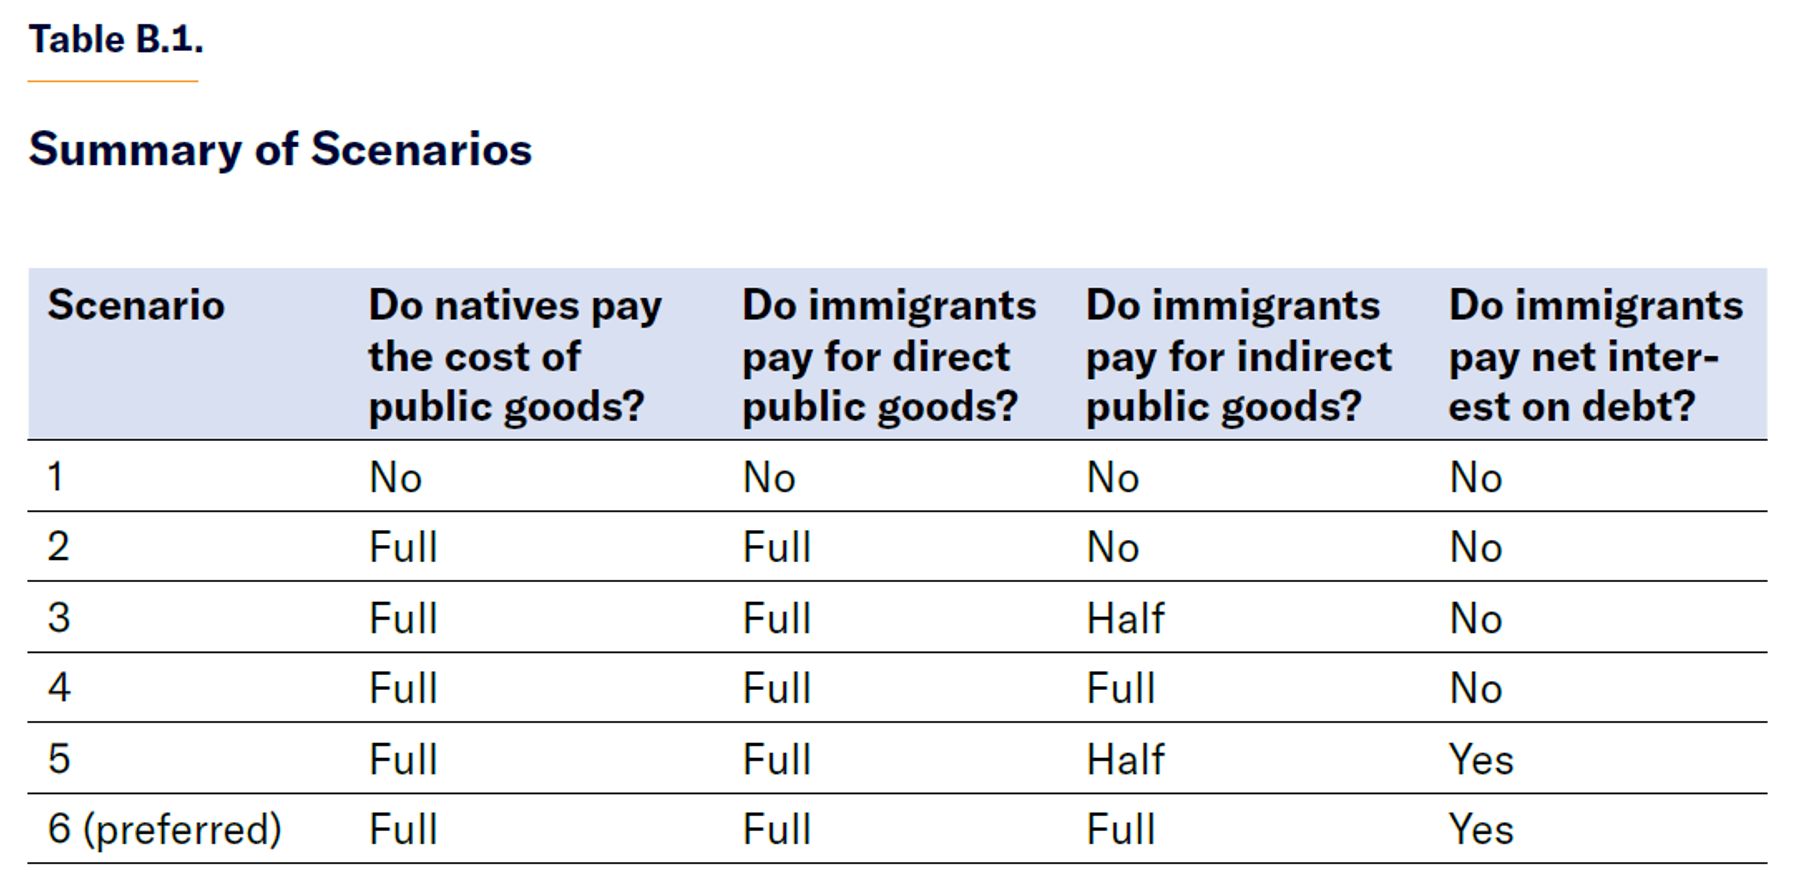
Scenario 4: Same as Scenario 3; but in this case, immigrants pay the full cost of all public goods as well. Therefore, indirect public goods such as national defense increase proportionally with population.
Scenario 5: Same as Scenario 3—immigrants pay the full cost of direct public goods and half the cost of indirect ones—but it adds the cost of servicing the national debt. To allocate the cost of interest on the debt, natives pay the average cost of interest on all the national debt, present and projected, while immigrants are responsible only for the cost of servicing new debt since they entered the United States. Each immigrant group pays a different net interest, proportional to their relative fiscal impact in Scenario 3. Immigrants who pay more in taxes than their cost to the government do not pay any interest, since they reduce the national debt. These immigrants instead “earn” interest. Some immigrants cost much more than a native-born citizen, so they accumulate debt and interest faster.
Scenario 6, the long-term scenario: Adds the cost of servicing the debt, as in Scenario 5 but, as in Scenario 4, immigrants pay the full cost of all public goods, resulting in more debt accumulation for them. This is the main scenario described in Part III of the report.
Scenario 1
In this scenario, which considers taxes paid and direct government benefits received, not public goods or debt, the average native-born American pays more than he gets back from the government and therefore has a positive impact on the fiscal health of the United States. For immigrants—although more categories of immigrants receive more in direct government benefits than they pay in taxes—the average immigrant has a positive impact.
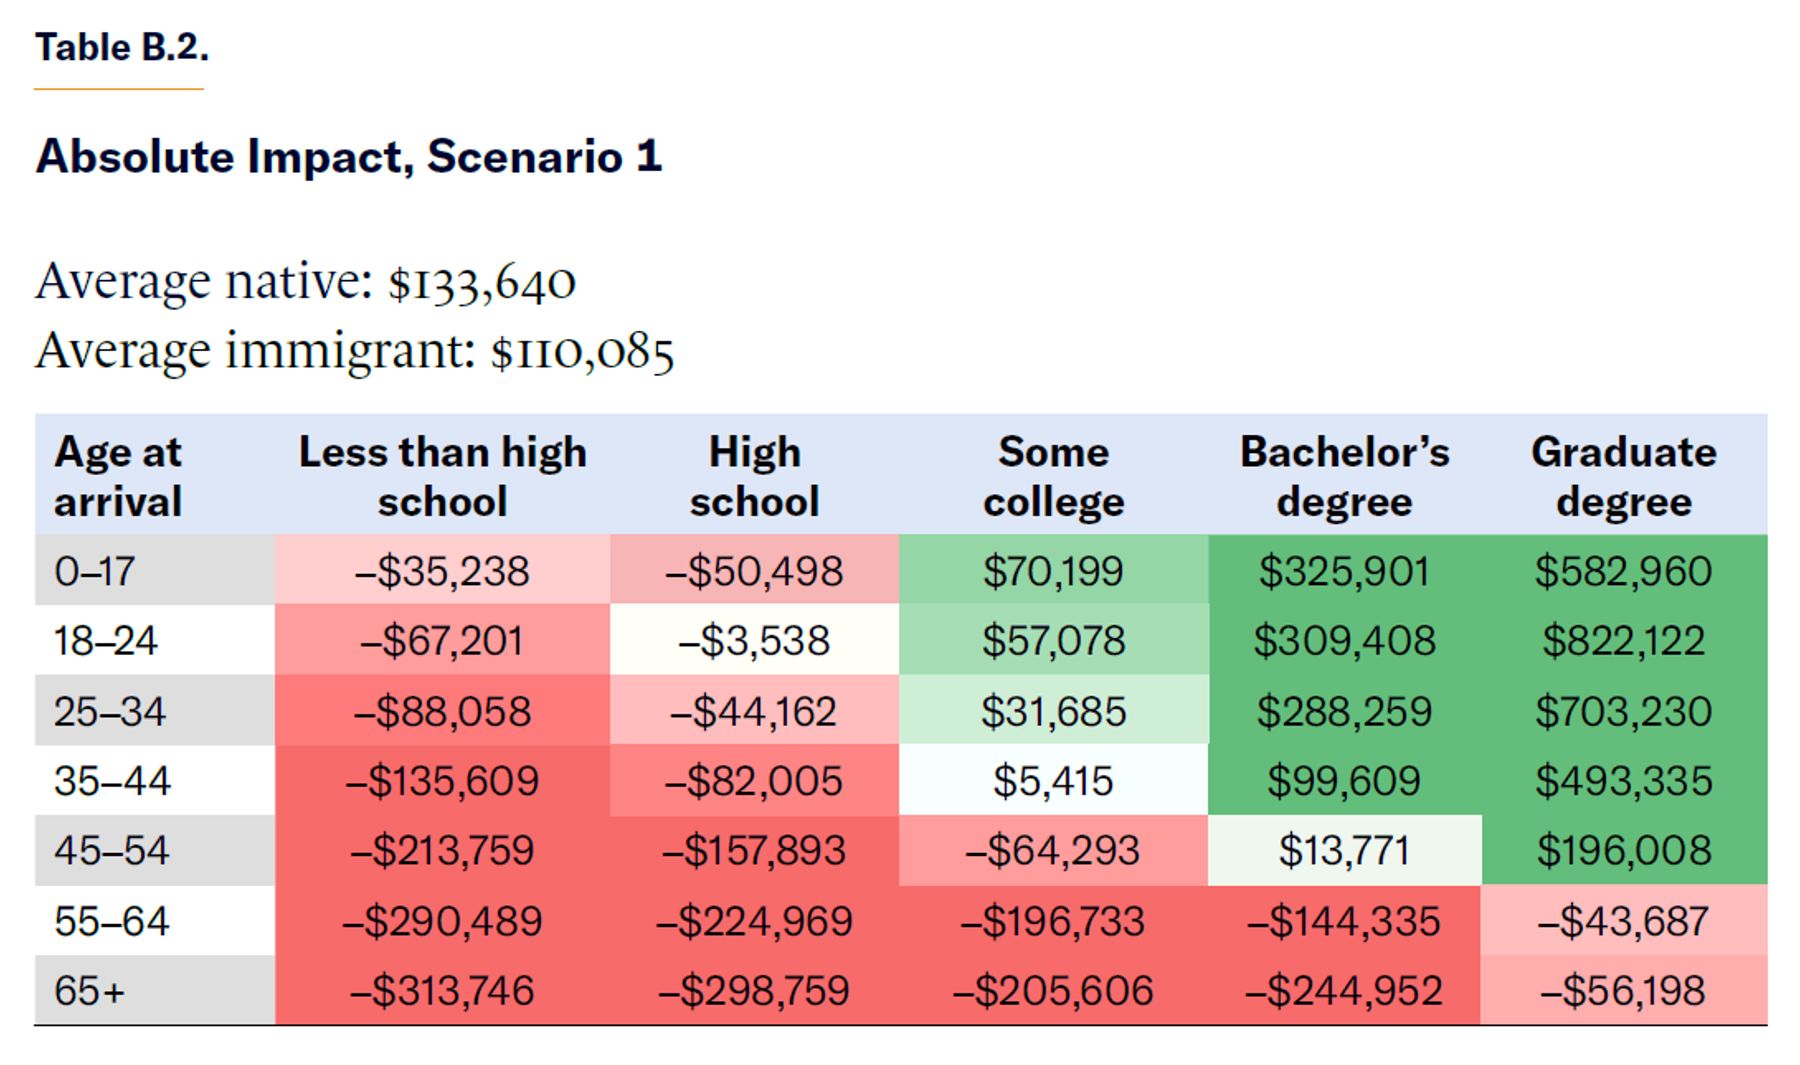
The fiscal impact of immigrants relative to natives is negative when not considering public goods or the national debt. The only immigrants with a positive fiscal impact relative to natives in this scenario are those who obtained bachelor’s degrees and came to the U.S. before age 35 and those with graduate degrees who immigrated before age 55.
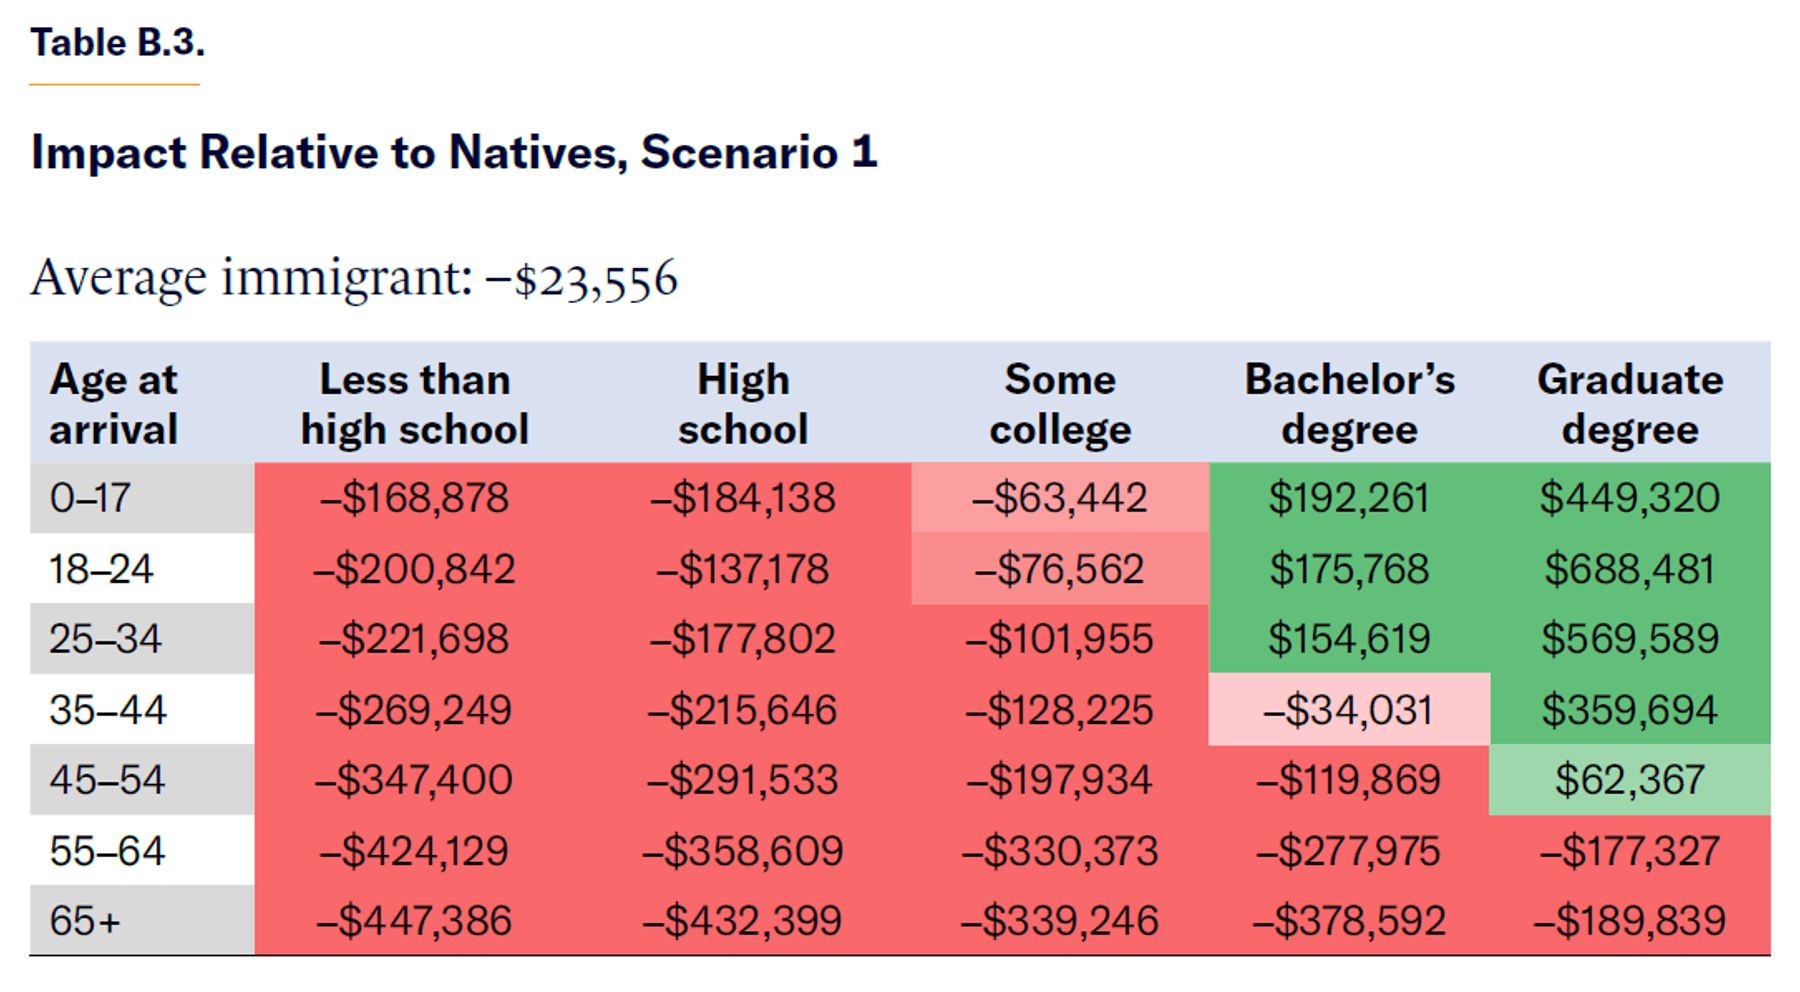
Scenario 2
In Scenario 2, which assigns the full cost of public goods to natives, the fiscal impact of native-born Americans on the U.S. turns negative, compared with Scenario 1. The fiscal impact for the average immigrant also declines, compared with Scenario 1. The negative turn for immigrants is less severe than the negative turn for natives because immigrants, in Scenario 2, pay only the cost of direct public goods.
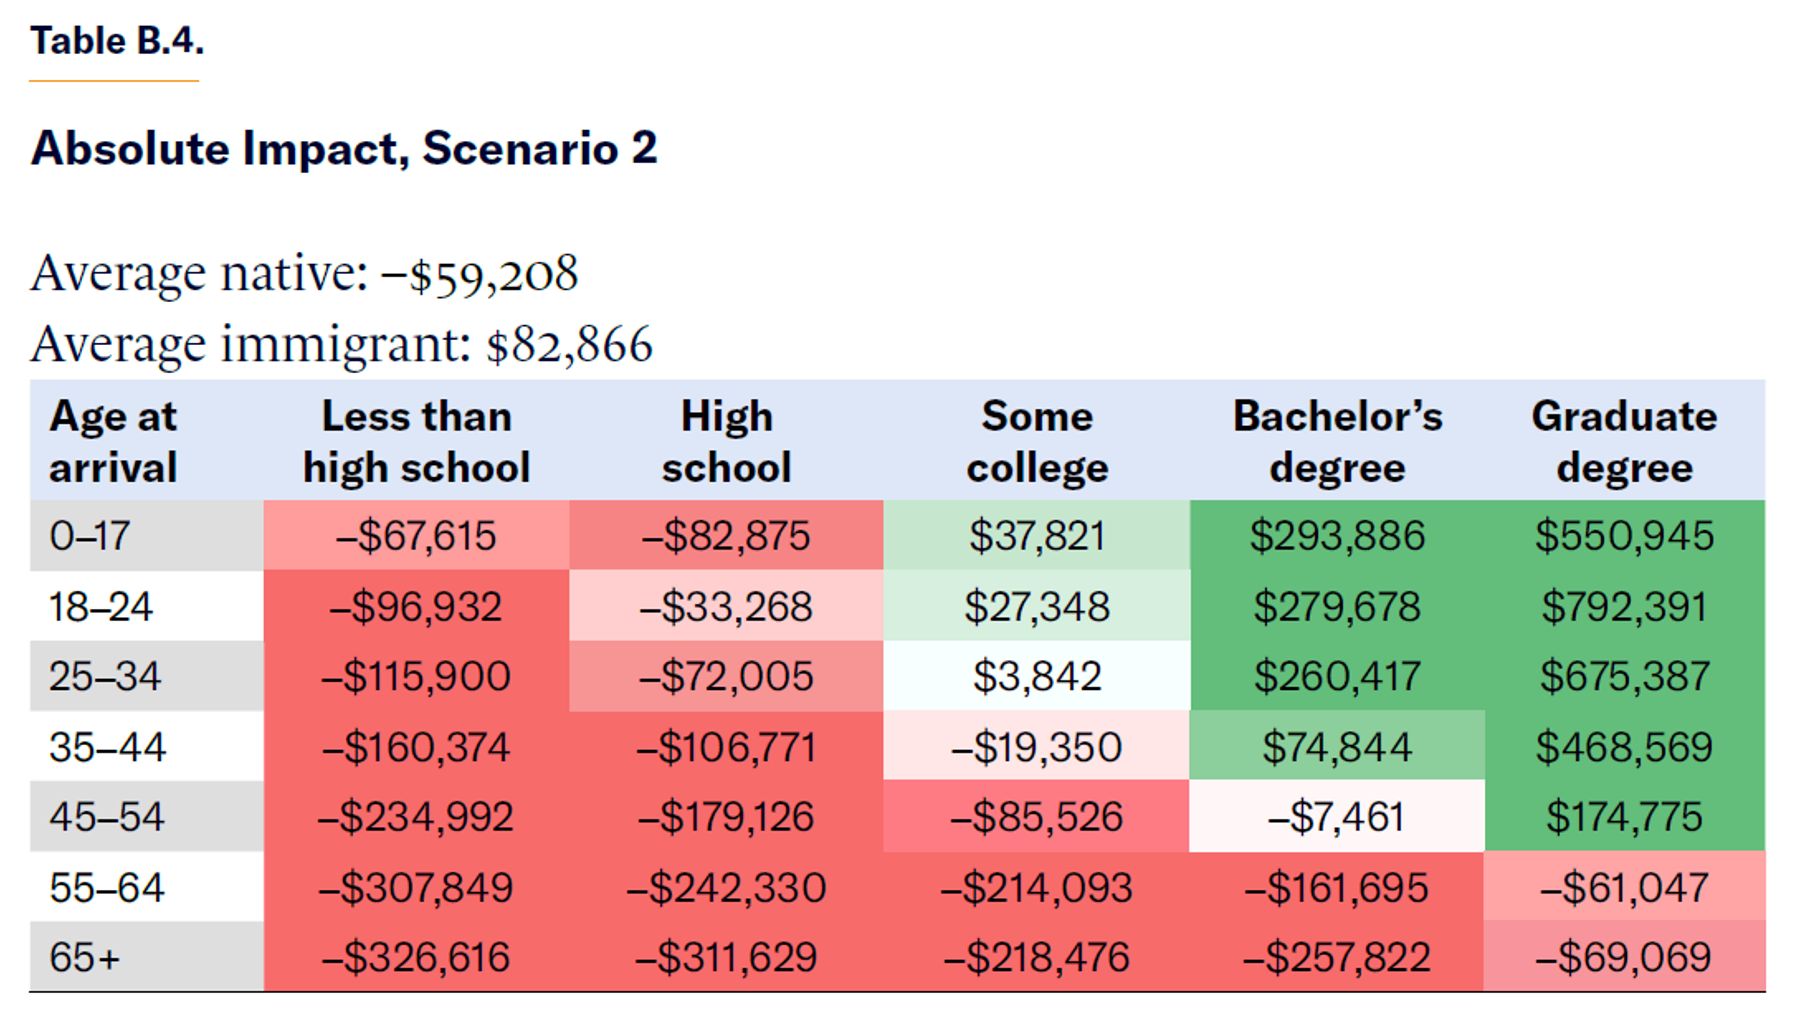
Due to the allocation of public goods, the relative fiscal impact of immigrants is positive. In this scenario, all degree-holding immigrants who entered the U.S. younger than 55 have a positive contribution relative to natives. Even immigrants with only some college and under age 45 have a positive contribution. One group of high school graduates, those who came to the U.S. right after high school (18–24 years old) is also positive. But those near and of retirement age, all other high school–only graduates, and immigrants with less than a high school diploma continue imposing a net fiscal burden on the federal government.
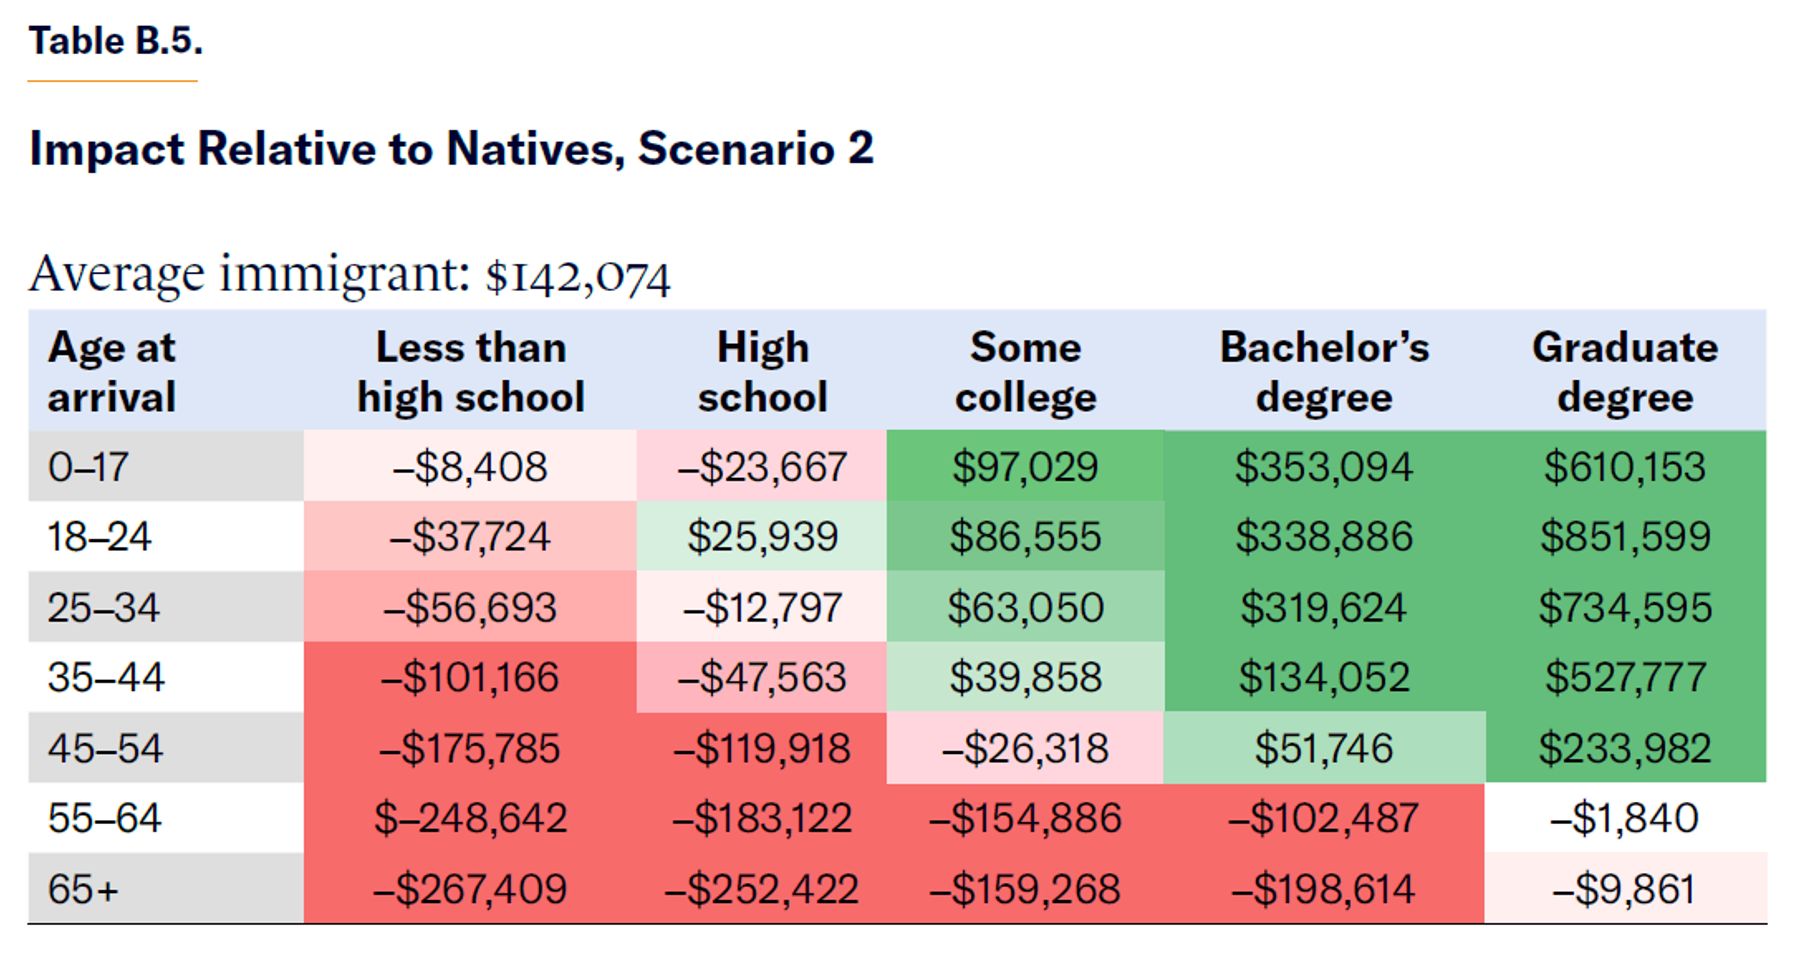
Scenario 3
In Scenario 3, we assign half the cost of indirect public goods to immigrants on top of direct public goods, as in Scenario 2. Logically, immigrants’ expected fiscal impact is more detrimental (compared with the previous scenarios) for all groups.
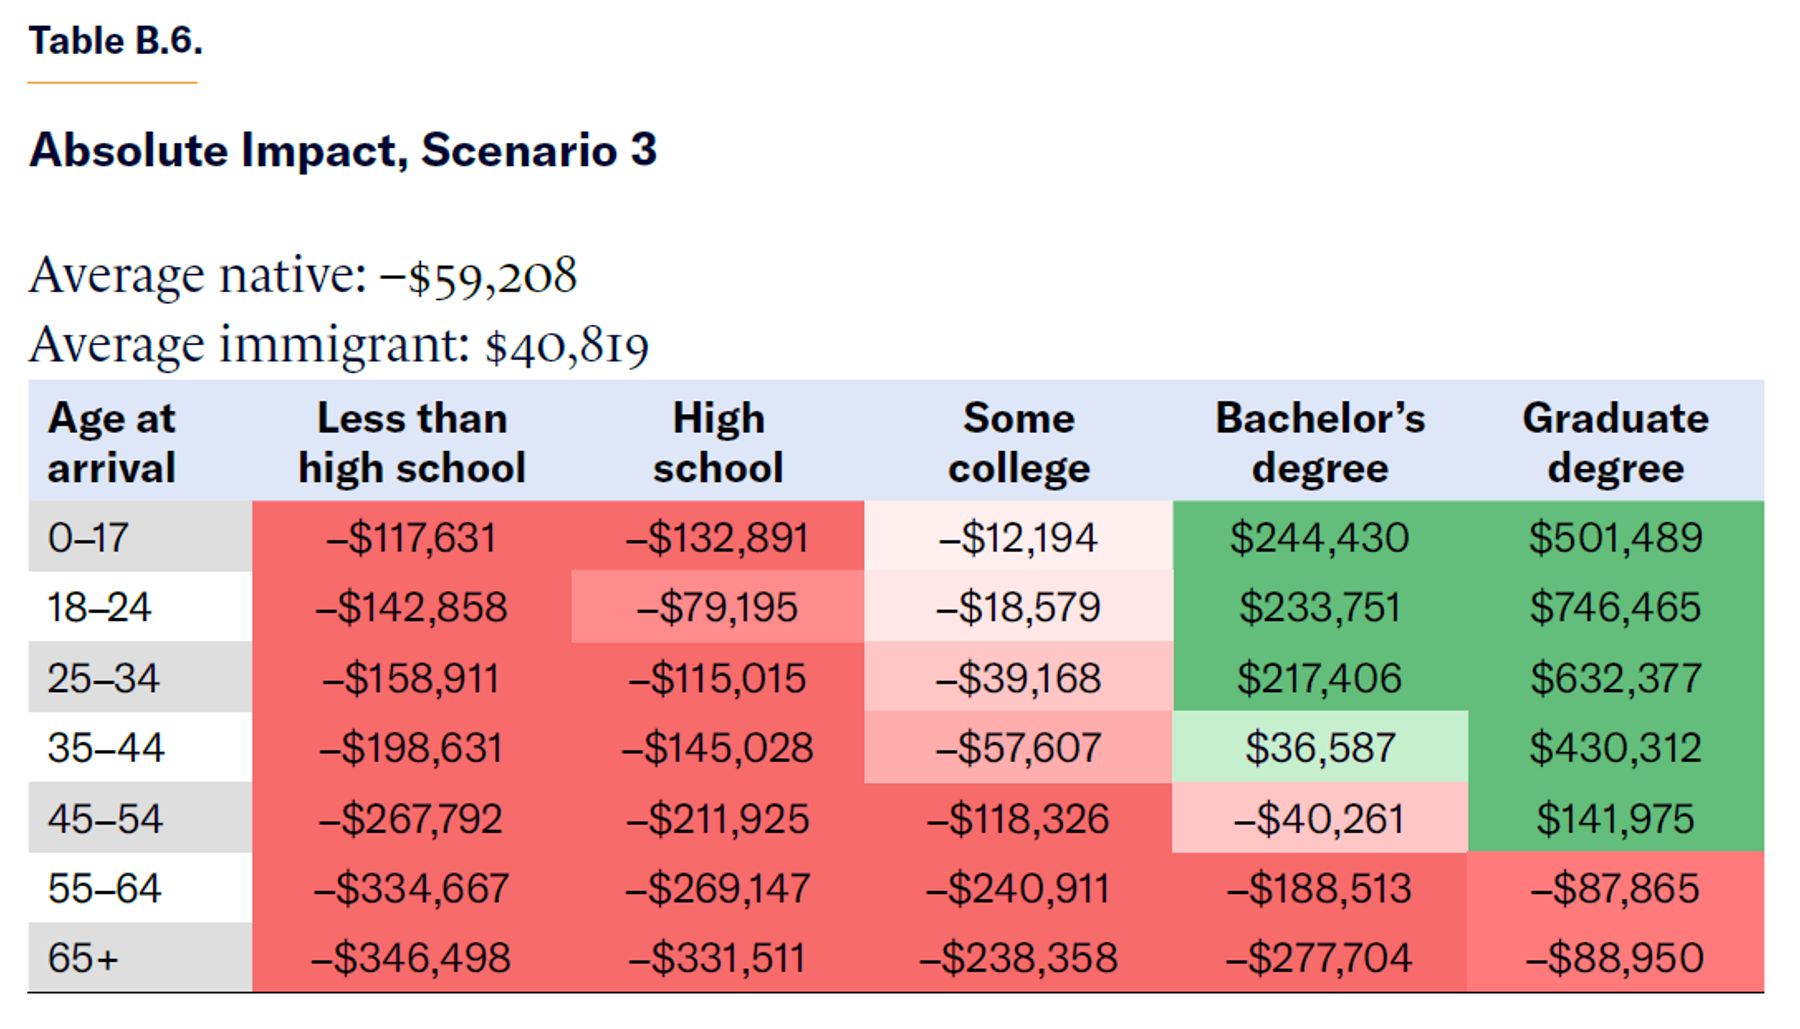
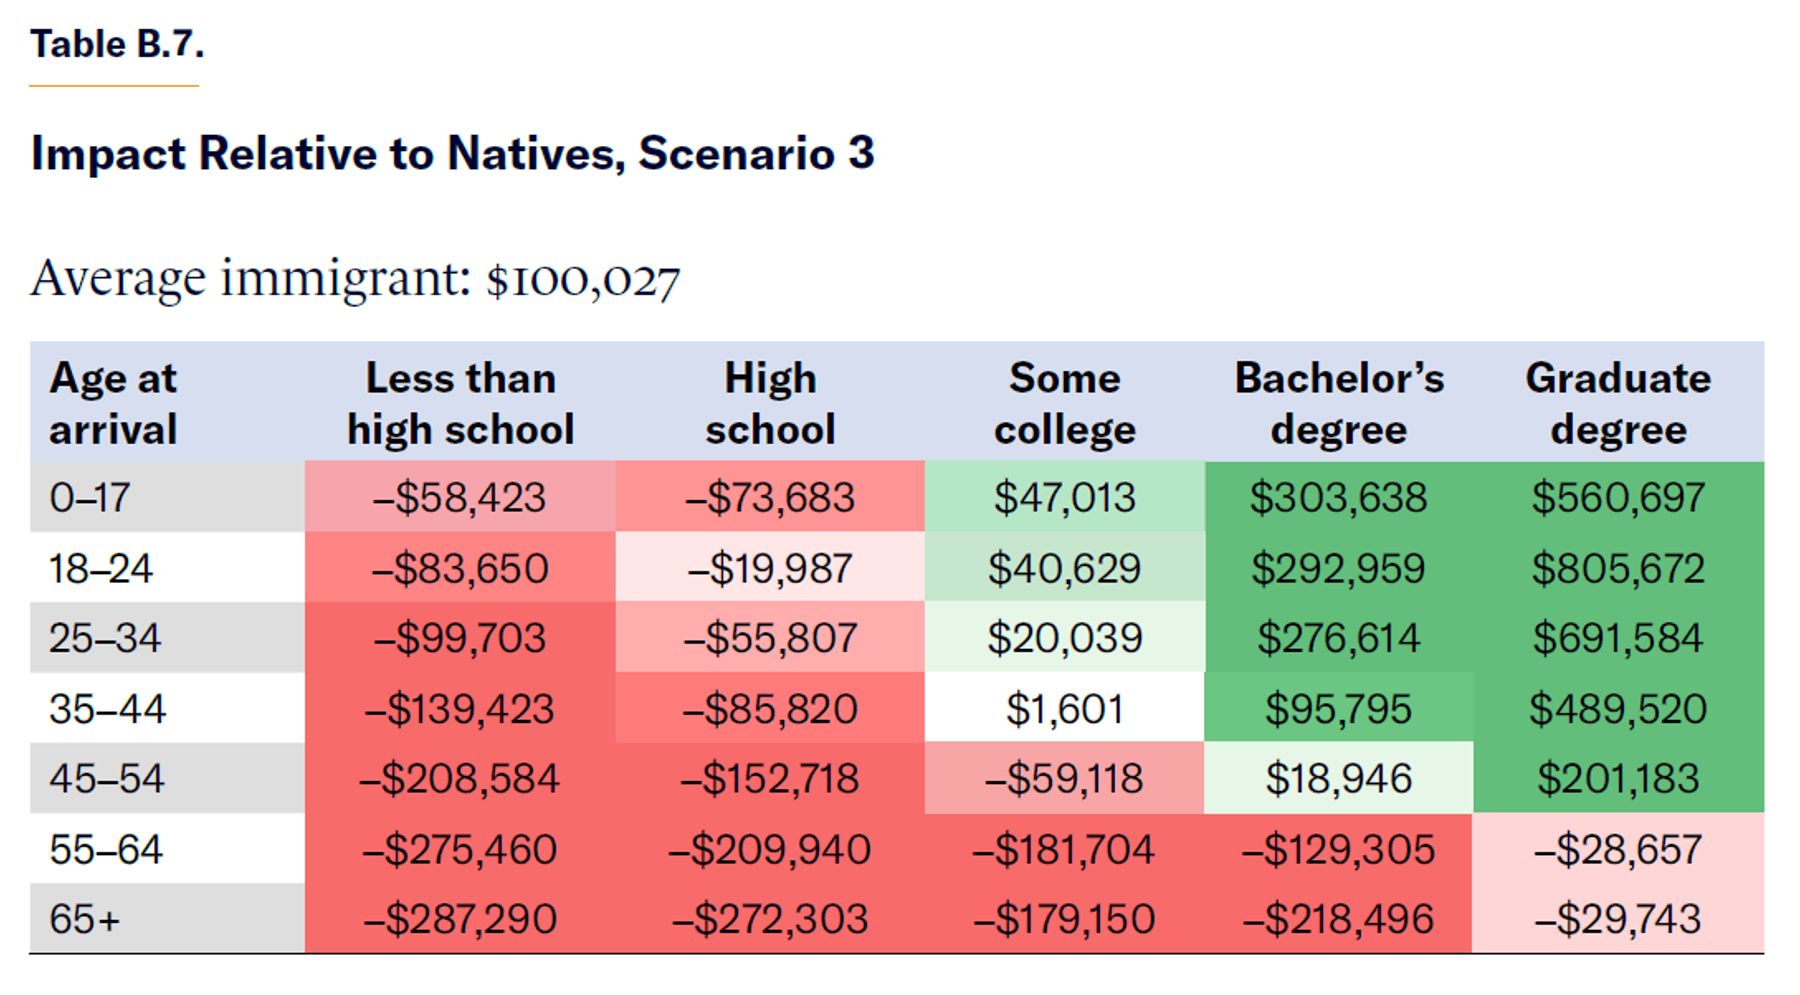
Scenario 4
In Scenario 4, we now assign the full cost of public goods to immigrants, making this the most realistic scenario of the ones that do not include the impact on the national debt. The primary fiscal impact of immigrants is negative for all but college graduates who entered the U.S. under age 35 and postgraduates who entered under age 55.
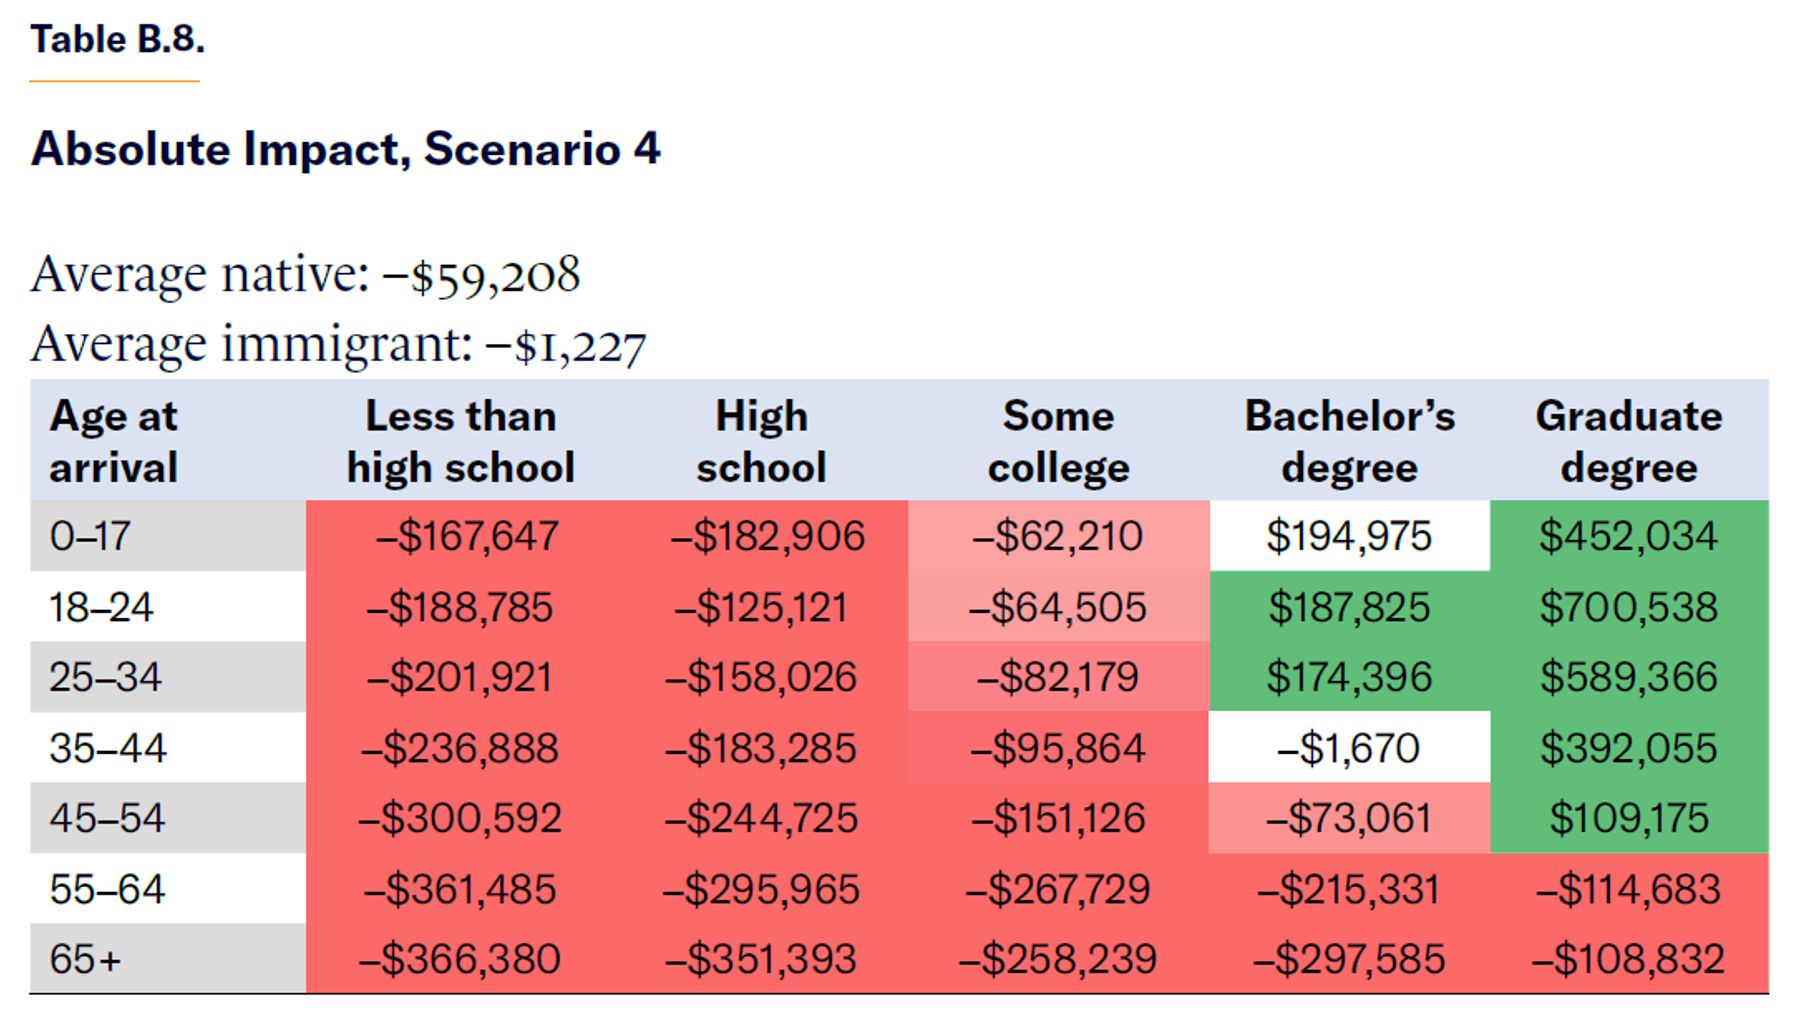
As for the relative impact of immigrants under this scenario, even immigrants with just some college education remain a negative fiscal force relative to natives.
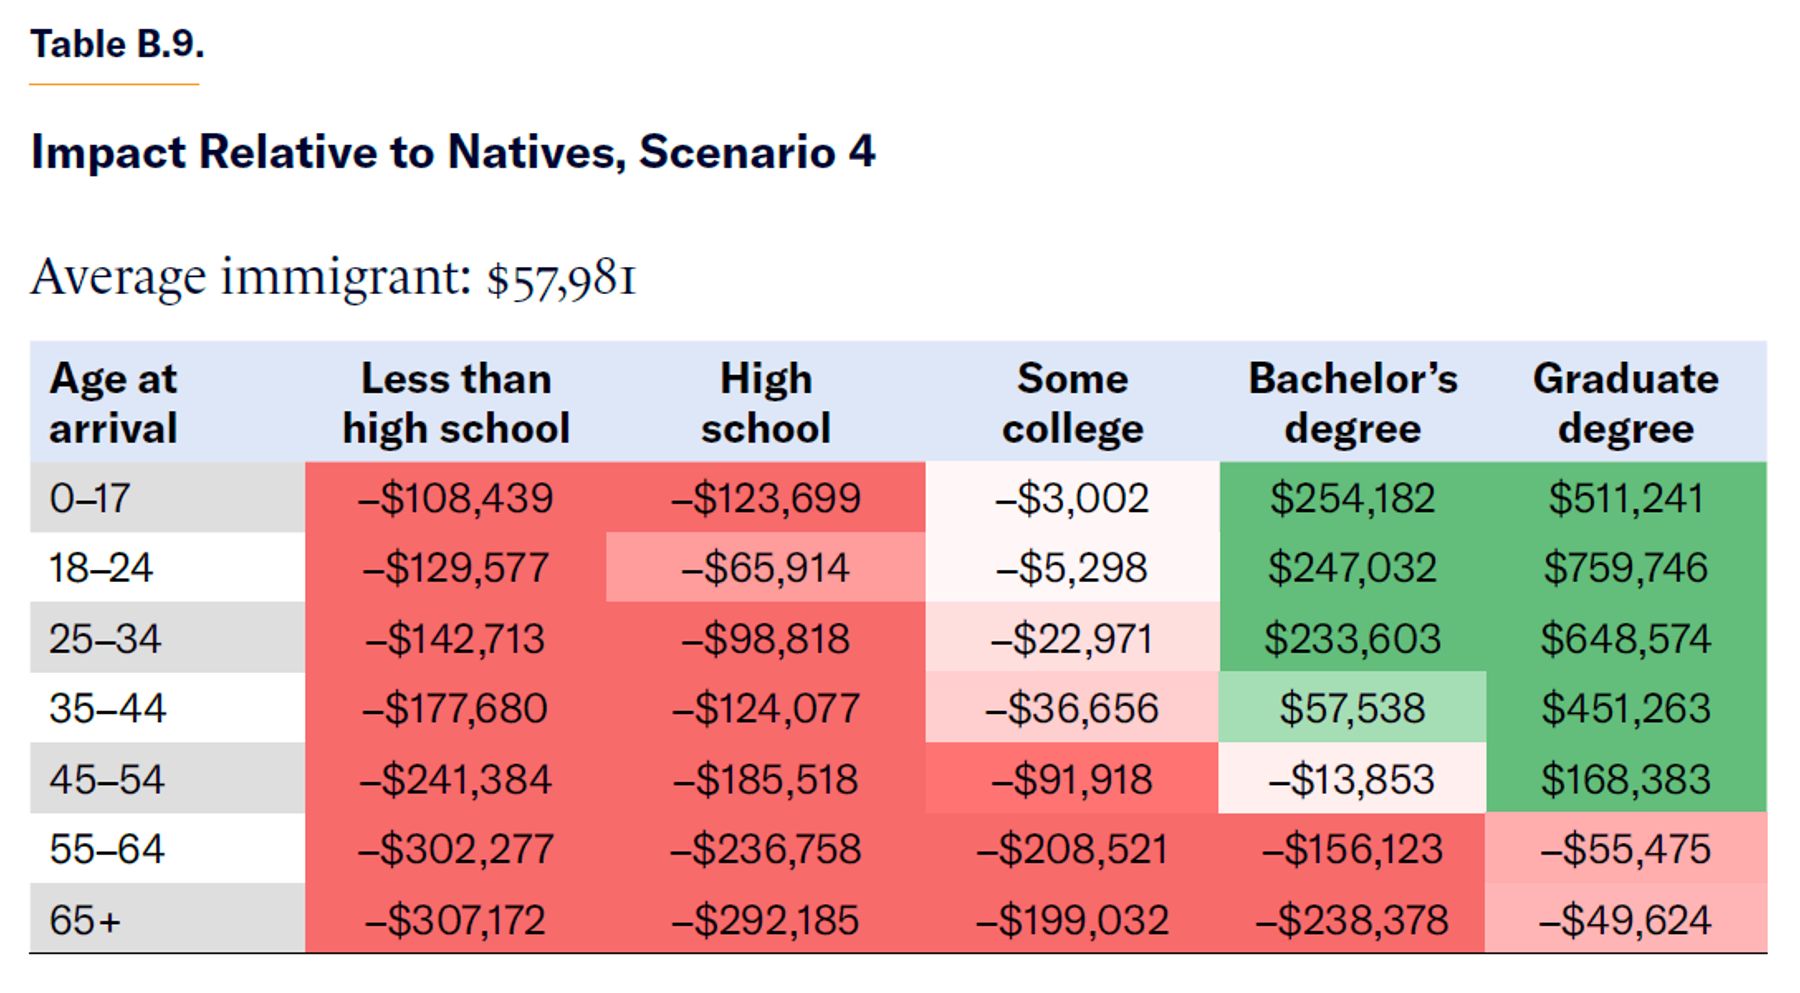
Scenario 5
Scenario 5 is based on Scenario 3 but adds the cost of the national debt. This increases the fiscal cost of natives from over $59,000 in Scenario 3 to over $256,000 in Scenario 5. Therefore, servicing past and future debt is expected to cost each new American born today some $200,000 over his lifetime, approximately half of what he is expected to pay in taxes in today’s dollars.
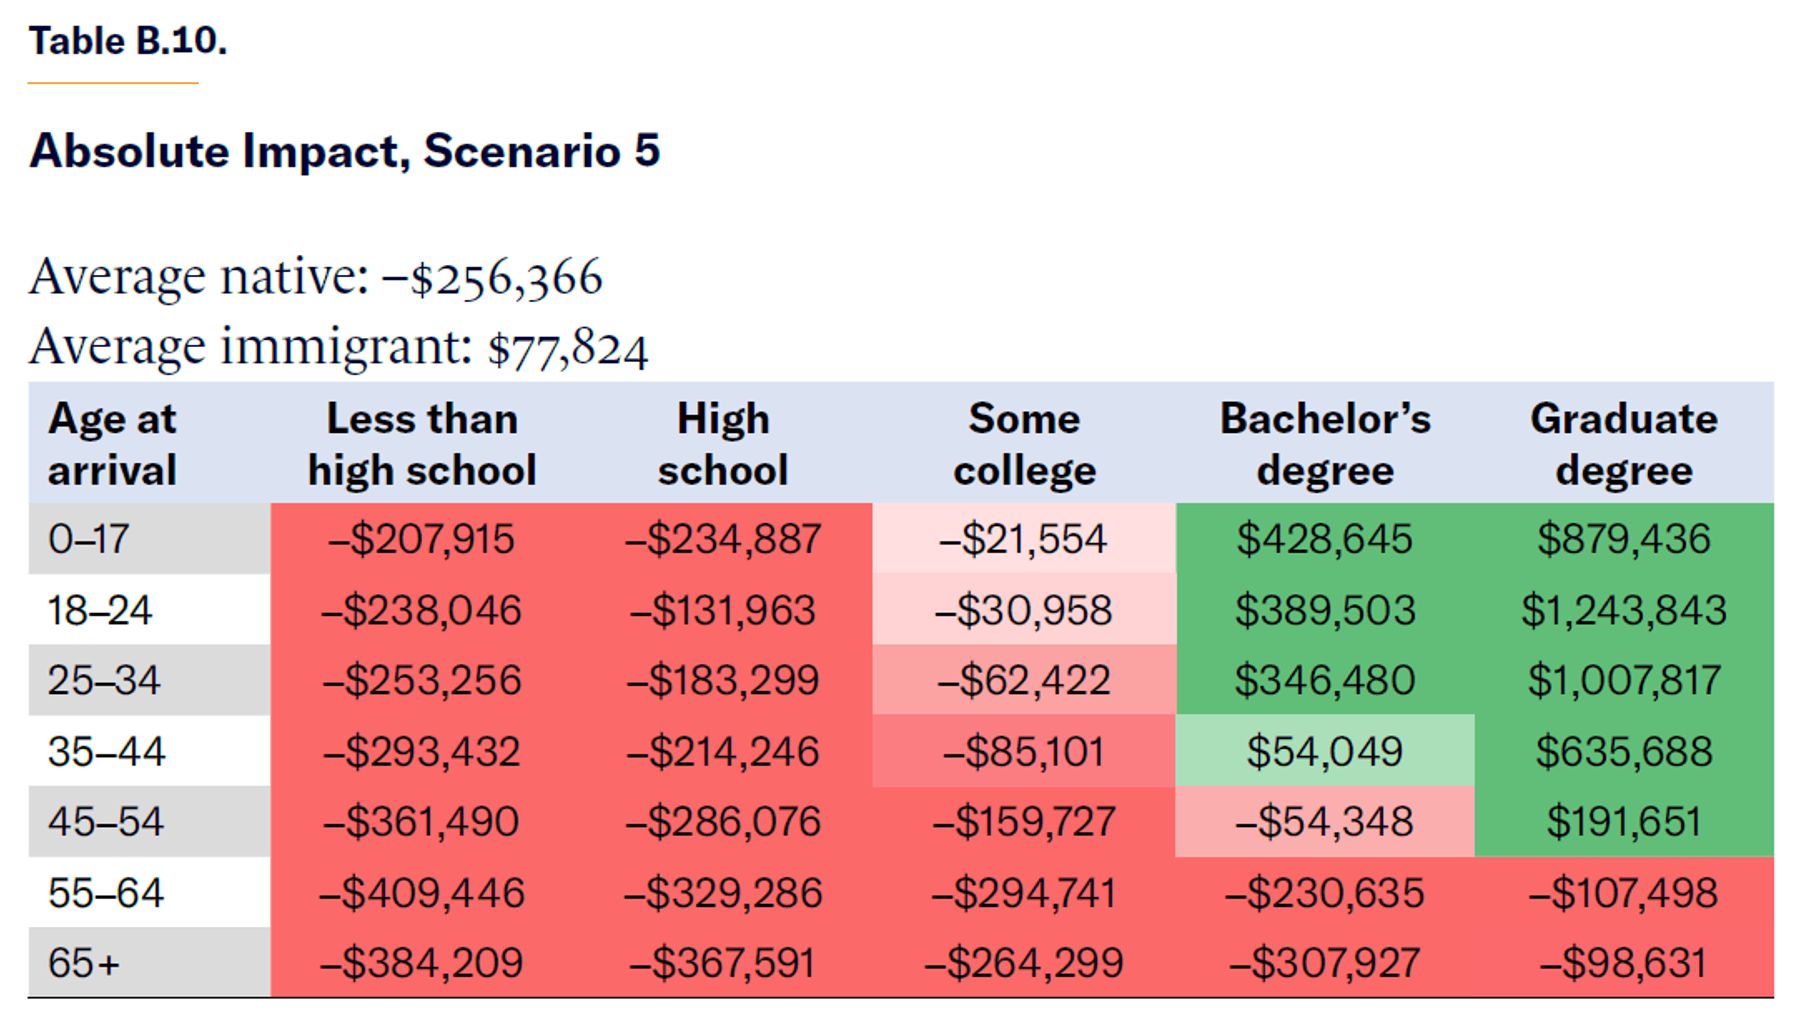
Immigrants also cost more under this scenario because they are now expected to pay the cost of future debt. But since they do not bear the cost of present debt, their fiscal impact relative to native-born citizens is even more positive than the previous scenarios. In Scenario 5, with immigrants paying just half the cost of indirect public goods but also paying for future debt, most immigrant groups become net fiscal contributors, including all immigrants who arrive before turning 35 and all immigrants with a graduate degree, even the elderly.
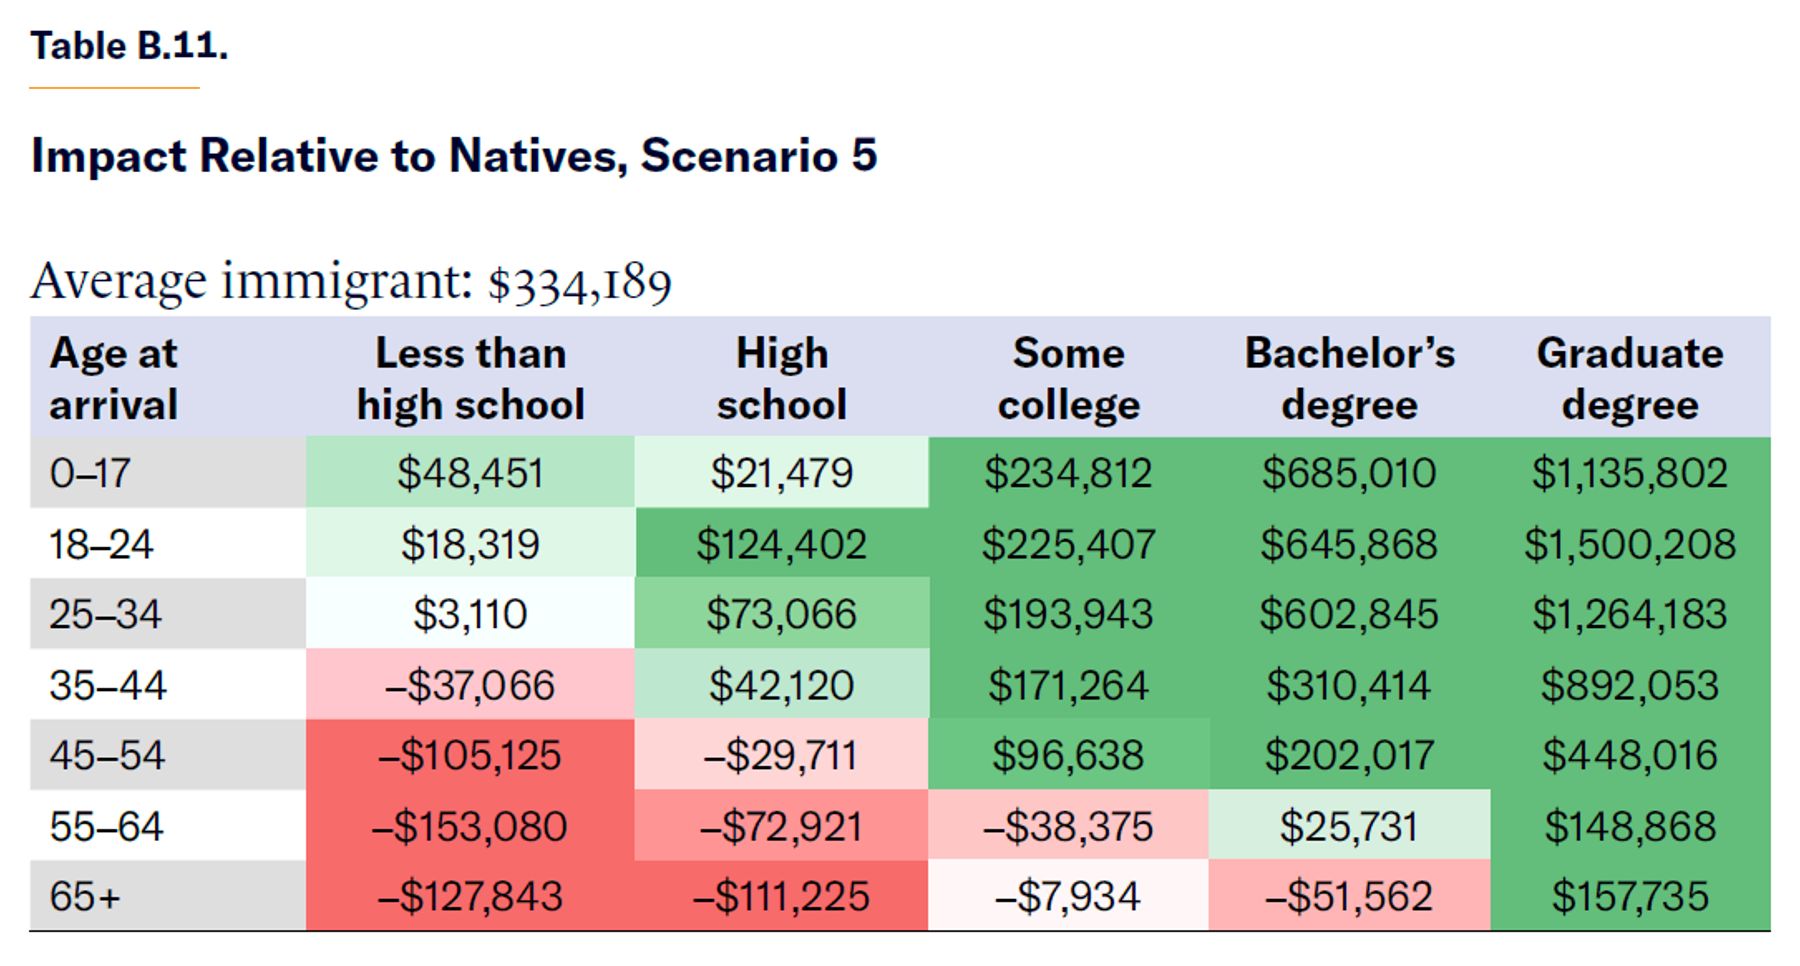
Endnotes
Photo: Peter Zelei Images / Moment via Getty Images
Are you interested in supporting the Manhattan Institute’s public-interest research and journalism? As a 501(c)(3) nonprofit, donations in support of MI and its scholars’ work are fully tax-deductible as provided by law (EIN #13-2912529).