Policy Pruno The Inability of Policymakers to Save Taxpayer Dollars Through Reducing Prison Populations at the Margins

Photo: Peter Unger / The Image Bank Unreleased via Getty Images
Introduction
Incapacitating criminals in the U.S. is expensive. In 2021, state governments spent $64 billion to house prisoners.[1] If you include probation and parole supervision costs, that number increases to just under $81 billion.[2] These costs have increased substantially in recent decades. In 1982, states spent just $15 billion on corrections.[3] But beginning in the 1980s, rising crime—especially gun and violent crime—led to more prisoners and more punitive sentences.[4] States built new prisons to meet crowding demands and then had to staff them and provide constitutionally adequate conditions.
Despite the significant increase in corrections costs during 1982–2010, corrections never reached 5% of total state budget expenditures, far below the cost of education (25%–35%), public welfare spending (20%–25%), highways (5%–10%), and hospitals and health care (5%–10%).[5] After the 2008 recession, however, corrections costs became a prime target of reform groups and budget hawks in state legislatures.
While progressives have long advocated for reduced prison populations and a smaller criminal-justice system,[6] the conservative case for criminal-justice reform—which largely focused on costs—emerged in the 2000s. In their 2016 book, Prison Break: Why Conservatives Turned Against Mass Incarceration, David Dagan and Steven Teles argue that the conservative embrace of prison reform was not only about cost but also reflected a broader rightward shift within the Republican party:
Along with shifts in the politics of crime itself, the other crucial impetus for reframing incarceration in terms of efficiency and cost has been the rightward ideological shift in the conservative movement. The more the party deepens its hostility to government, the less willing Republican office holders are to give prisons an exception from their critique of government as inefficient, unjust, inherently expansionary, and unaccountable. Ironically, conservatives have become more likely to agree with liberals on crime for precisely the same reason they are more likely to disagree on just about everything else.[7]
At the time, even in deeply red states, legislators were growing uneasy with corrections costs, which they wanted to reduce by putting fewer people in prison for less time.[8] Since 2010, hundreds of reforms have passed in states throughout the country that have affected crime, recidivism, and the criminal-justice system. The total state prison population also significantly declined in that period, from 1,404,043 in 2010 to 1,067,011 in 2023—a 24% reduction.[9] But the impact on corrections costs has not been comprehensively evaluated. Can lawmakers reduce corrections costs and save taxpayer dollars by marginally reducing prison populations?
Discussions about the effect of reform on corrections costs often rely on dubious “per-prisoner” cost estimates, which are produced by simply dividing the total cost of the prison system by the number of prisoners at a given time. These figures vary dramatically across states, from as low as $22,981 per prisoner, per year in Arkansas to as much as $307,468 in Massachusetts. Decarceration advocates interpret such estimates to mean that if Massachusetts, for example, were to release 10 inmates, the state would save over $3 million—and conversely, that adding 10 inmates would cost the state $3 million.
Neither theory appears to be anywhere near the truth. That is because a significant portion of corrections costs—such as payroll, maintenance, and utility costs—are fixed or long-run marginal costs, which do not vary with small, or even moderate, changes to prison populations.
About Prison Populations
Americans are deeply divided in their views on the prison system. In a 2023 poll, 36% of U.S. adults said that too many people were incarcerated, compared with 24% who said that too few were incarcerated and 21% who said that the number was about right.[10] Opinion closely tracks partisanship, with 51% of Democrats saying that too many people are incarcerated, compared with just 18% of Republicans, and 45% of Republicans saying that too few people are incarcerated, compared with only 13% of Democrats.[11]
According to the General Social Survey (GSS), most Americans think that their local courts are not harsh enough with criminals, but the prevalence of that view decreased, from 85% in 1994 to 54% in 2018.[12] The share who say that local courts are too harsh, meanwhile, increased from 3% in 1994 to 17% in 2018.
A majority also believe that the U.S. incarcerates too many nonviolent and drug offenders. In polling conducted before the 2016 presidential election, 63% of Americans agreed that “we put too many non-violent drug offenders in prison instead of treating their addiction,” and 78% agreed that “we need to treat drug and alcohol addiction more as a health problem and less as a criminal problem.”[13]
This belief in overincarceration has been reinforced in some of the most popular scholarship on the topic. In her 2010 book, The New Jim Crow: Mass Incarceration in the Age of Colorblindness, attorney Michelle Alexander argues that the “impact of the drug war has been astounding. In less than thirty years, the U.S. penal population exploded from around 300,000 to more than 2 million, with drug convictions accounting for the majority of the increase.”[14]
Although drug charges are involved in a large percentage of admissions to federal prisons, federal prisoners accounted for only 13% of all prisoners in 2022.[15]
By contrast, in state prisons—where efforts around cost-cutting have been focused—drug offenders made up just 13% of inmates, or 127,000 people, in 2022.[16] Drug offenders accounted for roughly the same share as those incarcerated for property crimes (132,800 inmates) and slightly outnumbered those incarcerated for public order offenses (111,900 inmates). Furthermore, of the 127,000 drug offenders, just 34,382 were incarcerated for possession, in contrast to trafficking or manufacturing. But the lion’s share of inmates—63%, or 642,500 people—were in prison for violent offenses,[17] including 155,115 murderers.
Similarly, the vast majority of state prison inmates are not first-time offenders. In 2014, first-time arrestees accounted for only 4.6% of state prison admissions, while more than three-quarters (76.7%) had been arrested five or more times before their current admission.[18] Those numbers are consistent with data from 2009, when 5.2% of those admitted to state prison had just one arrest and 76.2% had five or more.[19]
In sum, state prisons primarily comprise violent and recidivist offenders, making it hard to create policy that would substantially reduce the prison population without releasing these populations. Yet from 2010 to 2023, state prison populations decreased by 24% overall and declined in all but seven states.[20]
Reform efforts likely played a role in this decline, but a much larger driver was the decrease in the crime rate. Prison populations are a lagging indicator of crime,[21] especially violent crime, so the considerable drop in violent crime rates that began in the mid-1990s would begin to be reflected in the prison population only years later.
Regardless of what caused the decline, if a smaller prison population means fewer costs associated with incarceration, this decline should have resulted in substantial taxpayer savings.
Understanding the Cost of a Prisoner
The belief that marginal reductions in prison populations will significantly reduce corrections costs assumes that each individual inmate imposes a large financial cost. Of course, each inmate does come with some cost, but the most common ways of assessing that cost are insufficient.
The most comprehensive assessment of the literature on calculating per-prisoner marginal costs (by economists Stuart John Wilson and Jocelyne Lemoine), lays it out thus:
To understand the fiscal impact of reforms, we must understand and quantify the costs of incarceration. Current estimates of the costs of incarceration are often generated in practice by taking total aggregate direct government spending on incarceration, and then calculating the average cost per inmate. This average direct cost estimate is relatively simple to calculate, and total spending and population data are often published and freely available. However, average cost figures are not the best figures to use to forecast custody costs with projected changes in prison populations, nor for evaluating the net benefits of new programs and policies to reduce incarceration and its costs. These total and average direct costs of incarceration include many cost components which do not vary with changes in the prison population.[22]
Wilson and Lemoine assessed 18 existing studies on the subject and found three distinct ways of calculating marginal costs. Of the 18 studies, only one was from a peer-reviewed journal. The authors’ primary conclusion is that more research is needed to accurately assess per-prisoner costs and to predict the effects that any proposed reforms or changes in the prison population would have.[23]
Any assessment of the marginal cost of a prisoner must consider short- and long-run marginal costs. Short-run marginal costs—those that vary immediately in response to small or short-term changes[24]—are the literal costs associated with a single additional inmate or the savings associated with one inmate fewer. This could include items like food or toiletries, assuming that these are not procured through prearranged contracts with fixed quantities. Long-run marginal costs, by contrast, are incurred only when a change beyond a specific range occurs,[25] such as an increase or a decrease in population large enough to require hiring/firing staff or closing/constructing a prison.
There is no uniformly accepted method for calculating these costs, but there have been some attempts to do so within individual states. The most recent state-level attempt was in Illinois, where the Illinois Sentencing Policy Advisory Council (ISPAC) examined the variable (short-run), step (long-run), and fixed costs of incarceration. As shown in Figure 1, most of the per-inmate, per-year costs of incarceration were long-run marginal costs.[26]
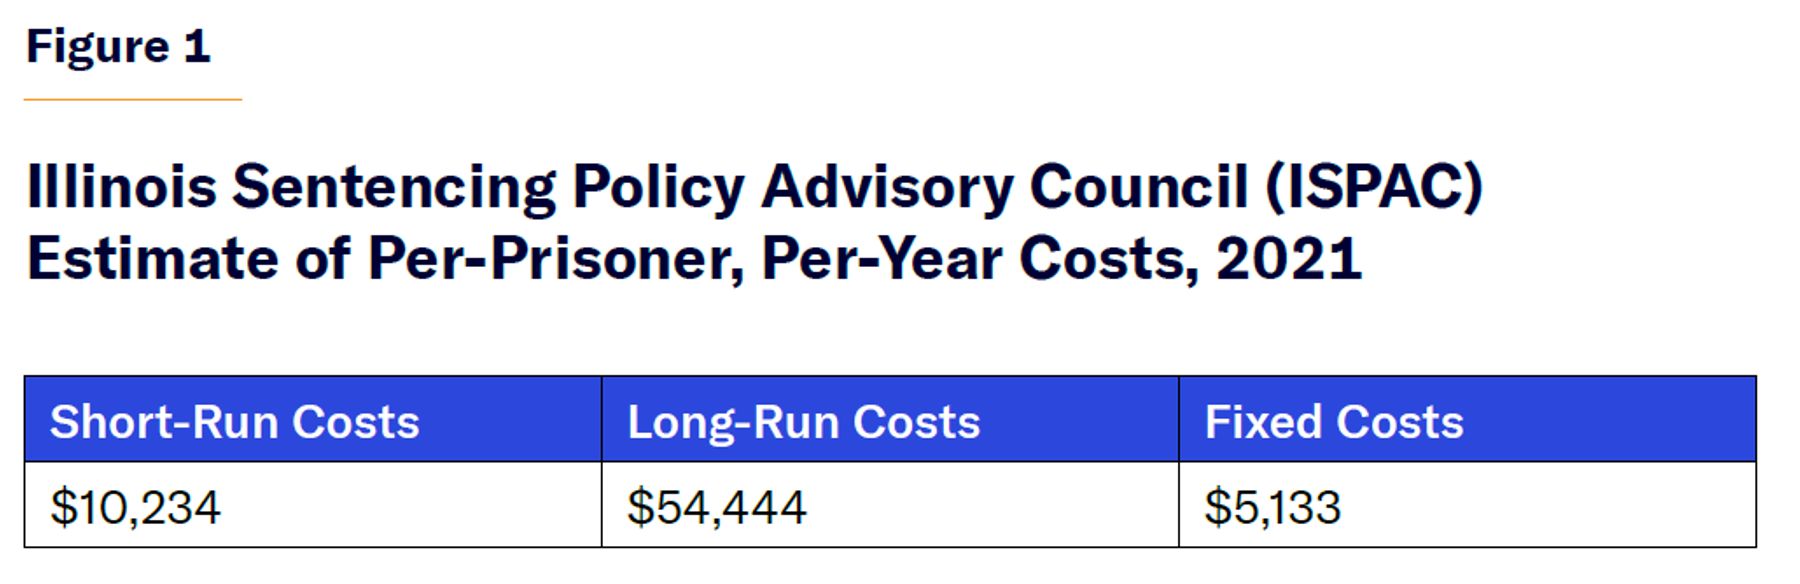
The total per-prisoner, per-year cost in Illinois—the type of estimate most often cited by advocates, produced by simply dividing total costs by number of prisoners—was $69,811.[27] But as ISPAC’s analysis shows, the true short-run cost—i.e., the portion of the cost that would change by adding or subtracting a single inmate—represents just under 15% of that number.
Furthermore, not all the long-run marginal costs kick in at the same time. ISPAC estimates that at about 500 inmates, the per-inmate, per-year cost is $11,076; at about 1,000 inmates, that cost is $12,546; and at about 3,000 inmates, that cost is $37,575.[28]
This means that an overnight release of 1,000 state prison inmates in Illinois would yield a taxpayer savings of only about $12.5 million, not the $70 million suggested by the aggregate division method. For context, $12.5 million represents 0.083% of the state’s $1.5 billion corrections budget in 2021 and 0.0029% of the state’s $42.9 billion general fund budget.[29]
Similarly, the Michigan Senate Fiscal Agency (SFA) attempted to calculate these per-prisoner, per-year costs in Michigan in 2015 (Figure 2).[30]
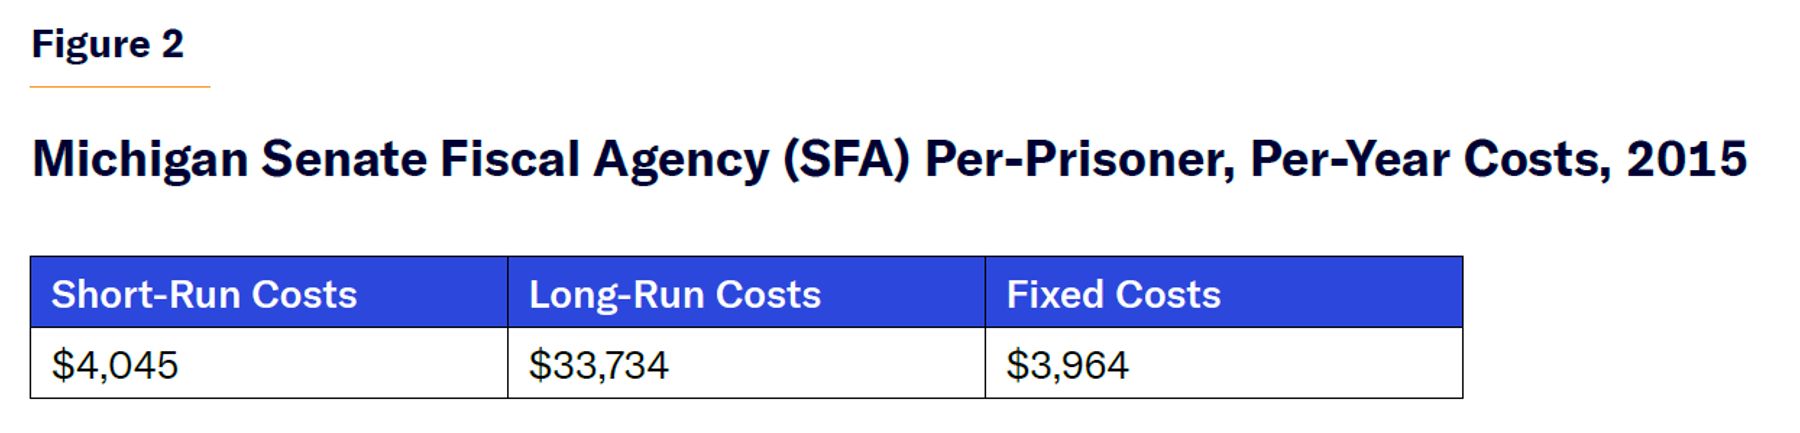
Importantly, SFA excluded reentry services and certain one-time payments from its analysis. These omitted costs represent just over $420 million per year, or about $9,560 per inmate per year.[31] This means that the aggregate division per-inmate, per-year cost to Michigan in 2015 was $51,303. The short-run cost per inmate per year represents just under 8% of this cost.
SFA did not attempt to quantify how large a change in the total prison population would be required to produce changes to the long-run costs of incarceration. But we can roughly estimate those figures by looking at the Illinois analysis, where about 1,000 inmates meant a change to long-run marginal costs equivalent to just under 123% of the short-run per-inmate, per-year costs. If we use that same assumption here, then about 1,000 in Michigan would change the long-run marginal cost by $4,959.[32] That would mean that an overnight reduction of 1,000 inmates—3.6% of the state prison population—would yield a savings of just under $5 million, equivalent to 0.2% of the state’s 2015 corrections budget, 0.05% of the state’s general fund budget, or 0.017% of all state spending that year.
These estimates suggest that the actual, achievable savings to taxpayers by reducing prison populations is significantly less than anticipated, and any savings would represent a tiny fraction of overall state spending. But we can also look at what has happened over the last 15 years, in which the prison population has been dramatically reduced. Over that period, what has actually happened to state corrections budgets? Do fewer inmates mean less spending?
A Look into the States
As mentioned above, total state prisoner populations declined by 24% between 2010 and 2023, and all but seven states experienced a decline during that period. As a result, have states spent less on prisons, corrections, and overall?
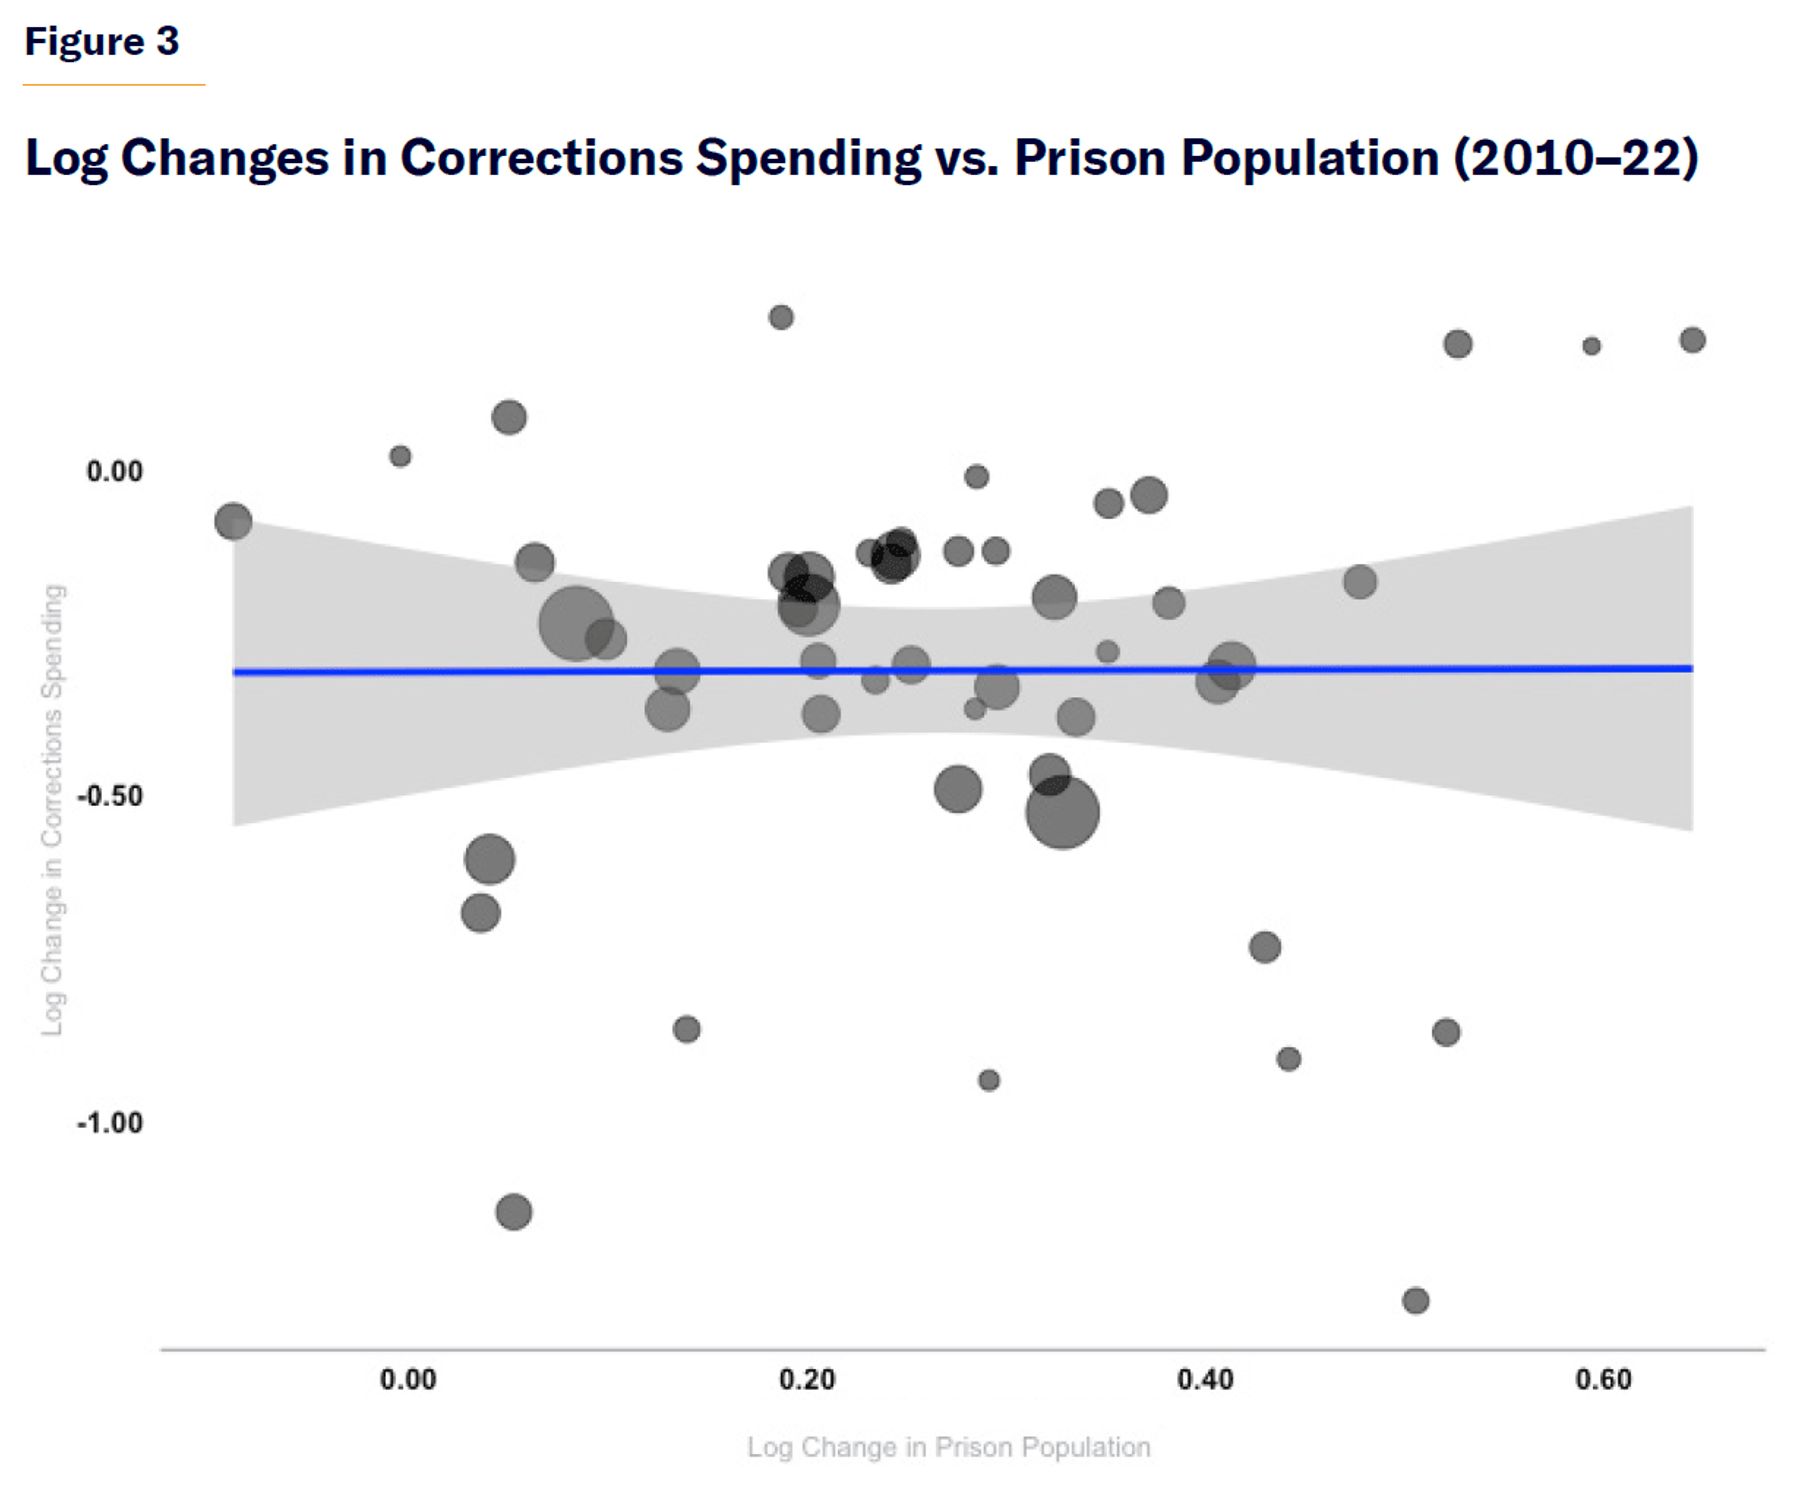
Between 2010 and 2022—the most recent year for which data on spending are available for all 50 states—state prison populations declined by 26% while corrections spending in real dollars increased by 27.7%.[33] In fact, corrections spending increased in all but two states: Mississippi and Wyoming. In 2022, the Mississippi prison population was 8% smaller than it was in 2010, but the Wyoming prison population was 2% larger, suggesting a disconnect between corrections budgets and prison populations.
To better understand this disconnect, Figure 3 presents a log-log regression comparing changes in corrections budgets and prison populations between 2010 and 2022. The results were not statistically significant, indicating an implied elasticity of 0.01 (95% confidence interval: –0.60 to 0.62). The results reinforce that changes in prison populations show little systematic relationship to changes in corrections spending.
I next examined a cross-section of states—large and small, red and blue[34]—whose prison populations increased or decreased between 2010 and 2023. First, let’s look at Idaho, a state that has bucked the trend of declining prison population.
Increasing Incarceration
Idaho is one of the seven states whose prison population has increased since 2010, and the increase has been steady and substantial. The population grew from 7,431 in 2010 to 9,689 in 2023—a 30.4% increase, the second-largest in the country over that period.[35] The increase was also steady, save for a small decline in 2020 (Figure 4).
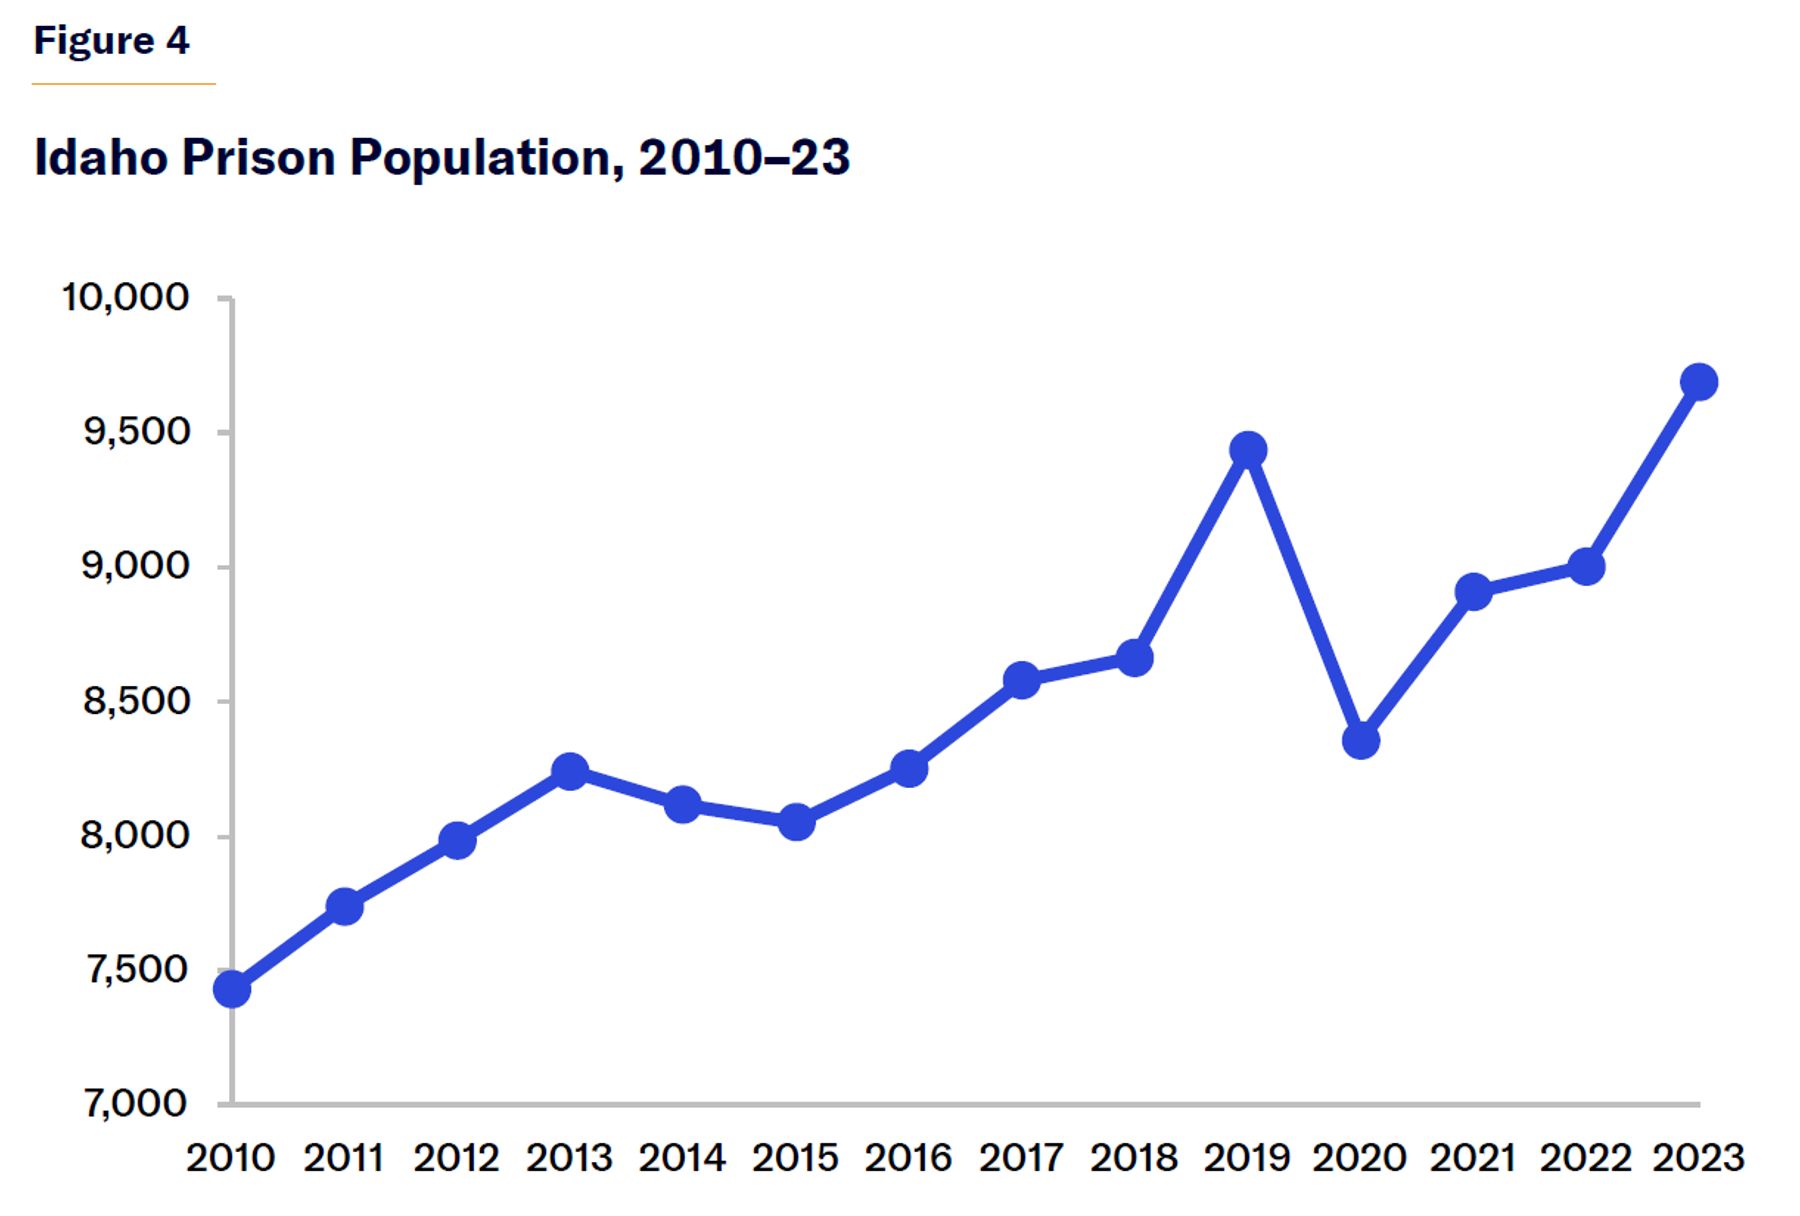
Between 2010 and 2023, the state’s prison budget also increased, from just under $67 million in 2010 to $156 million in 2023, an increase of 122% in real dollars.[36] Total corrections spending also increased, from $166 million to $342 million. As such, state prisons now account for a larger share of the total corrections budget, increasing from 55% in 2010 to 60% in 2023. Total corrections spending, however, remained constant as a percentage of the total state budget, at 2.86%. Prison spending increased slightly as a percentage of the total budget, from 1.1% in 2010 to 1.3% in 2023. The entire state budget also grew 106% in real dollars over that period.
So while both Idaho’s prison budget and overall corrections spending have grown in real dollars, the overall increase in state spending is primarily driven by other expenses. Nonetheless, more prisoners have meant higher prison and corrections costs in Idaho.
Red-State Declines in Incarceration
The nationwide trend of declining prison population has occurred in red as well as blue states—though the declines in red states have been more modest.
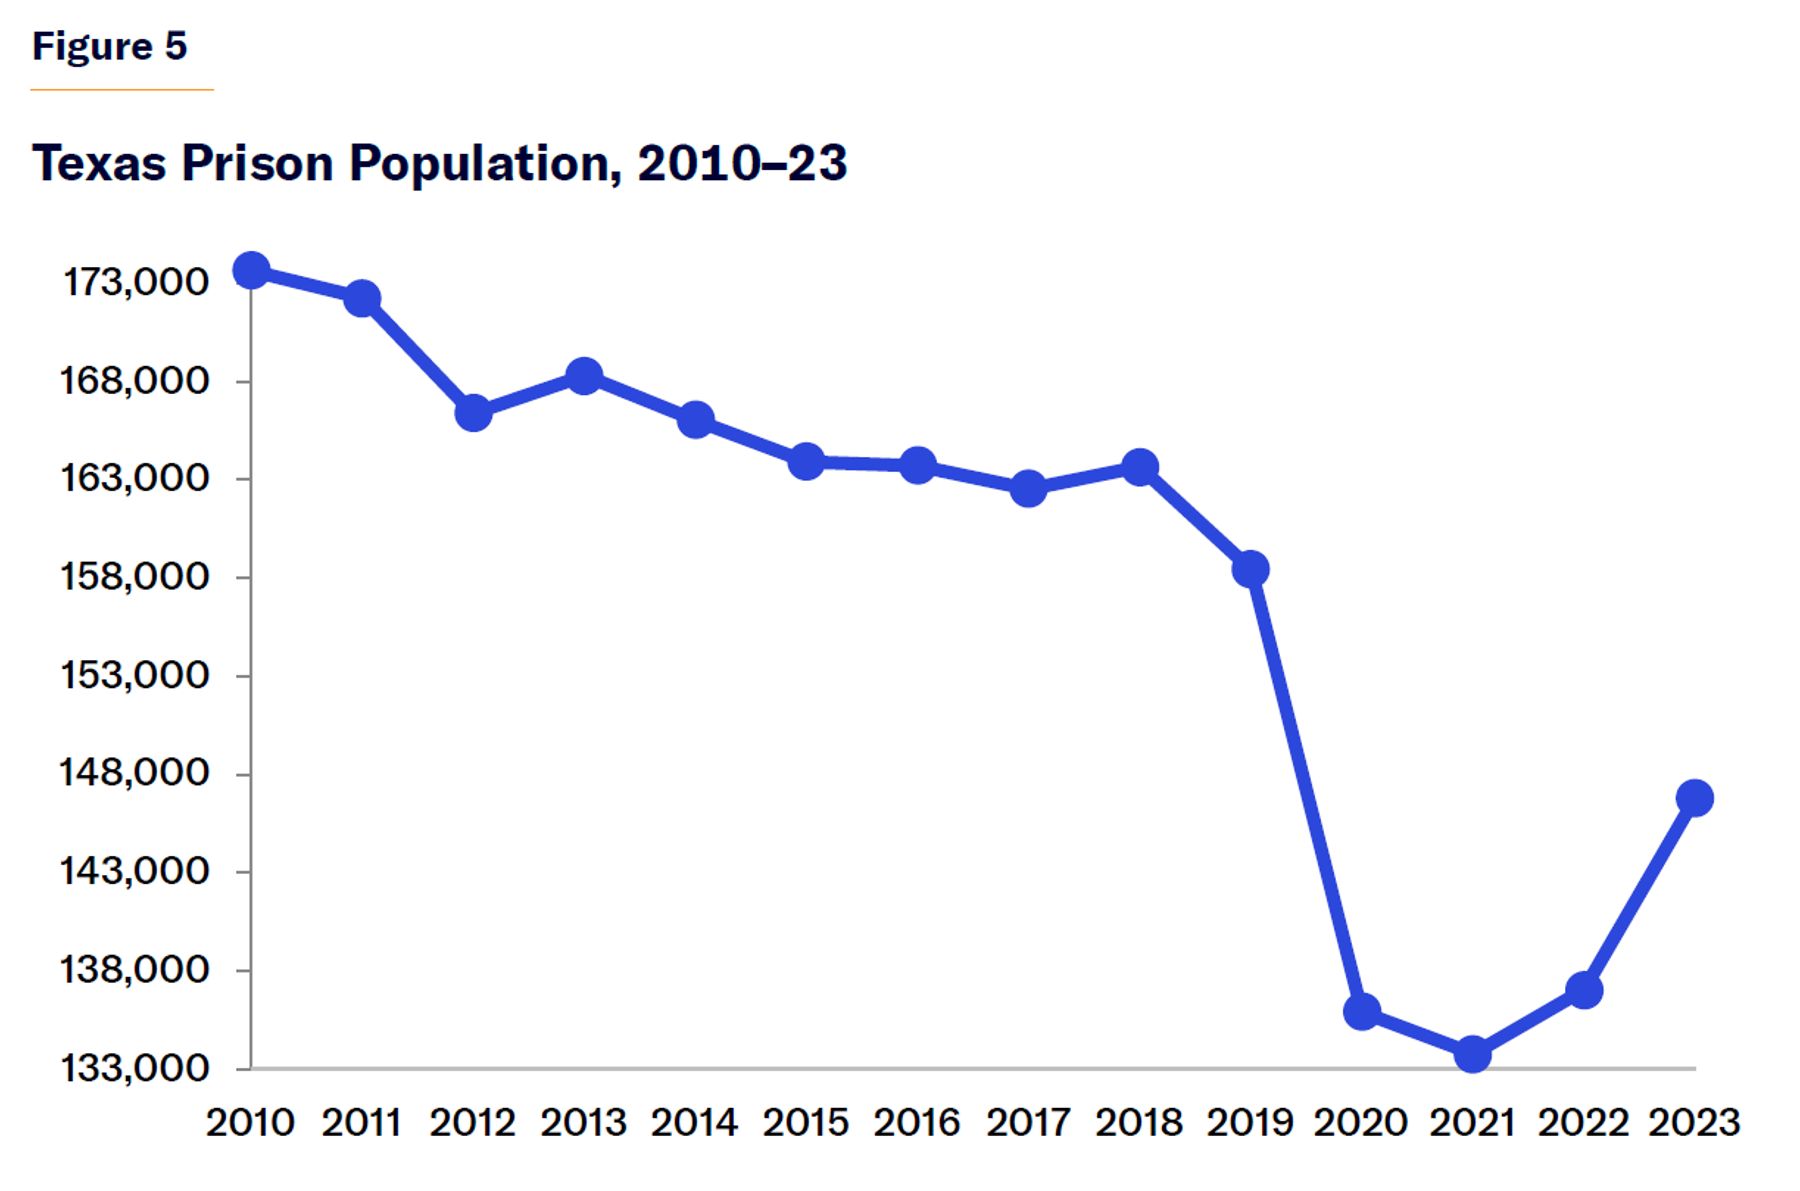
In Texas, which was among the first red states to adopt criminal-justice reforms, the prison population declined by 15.5%, from 173,649 in 2010 to 146,811 in 2023 (Figure 5).[37] In absolute terms, the 26,838 fewer inmates represent the largest reduction of prisoners in any red state. As a result of declining prison populations and staffing issues, Texas closed 10 prisons over the evaluation period.[38] But over the same 2010–23 period, spending on incarceration of felons increased in real dollars, from $2.4 billion to $2.8 billion.[39] However, prison spending grew less than other parts of the state’s budget, so the percentage of state spending that goes to prisons declined over that period, from 6.8% to 4.8%.
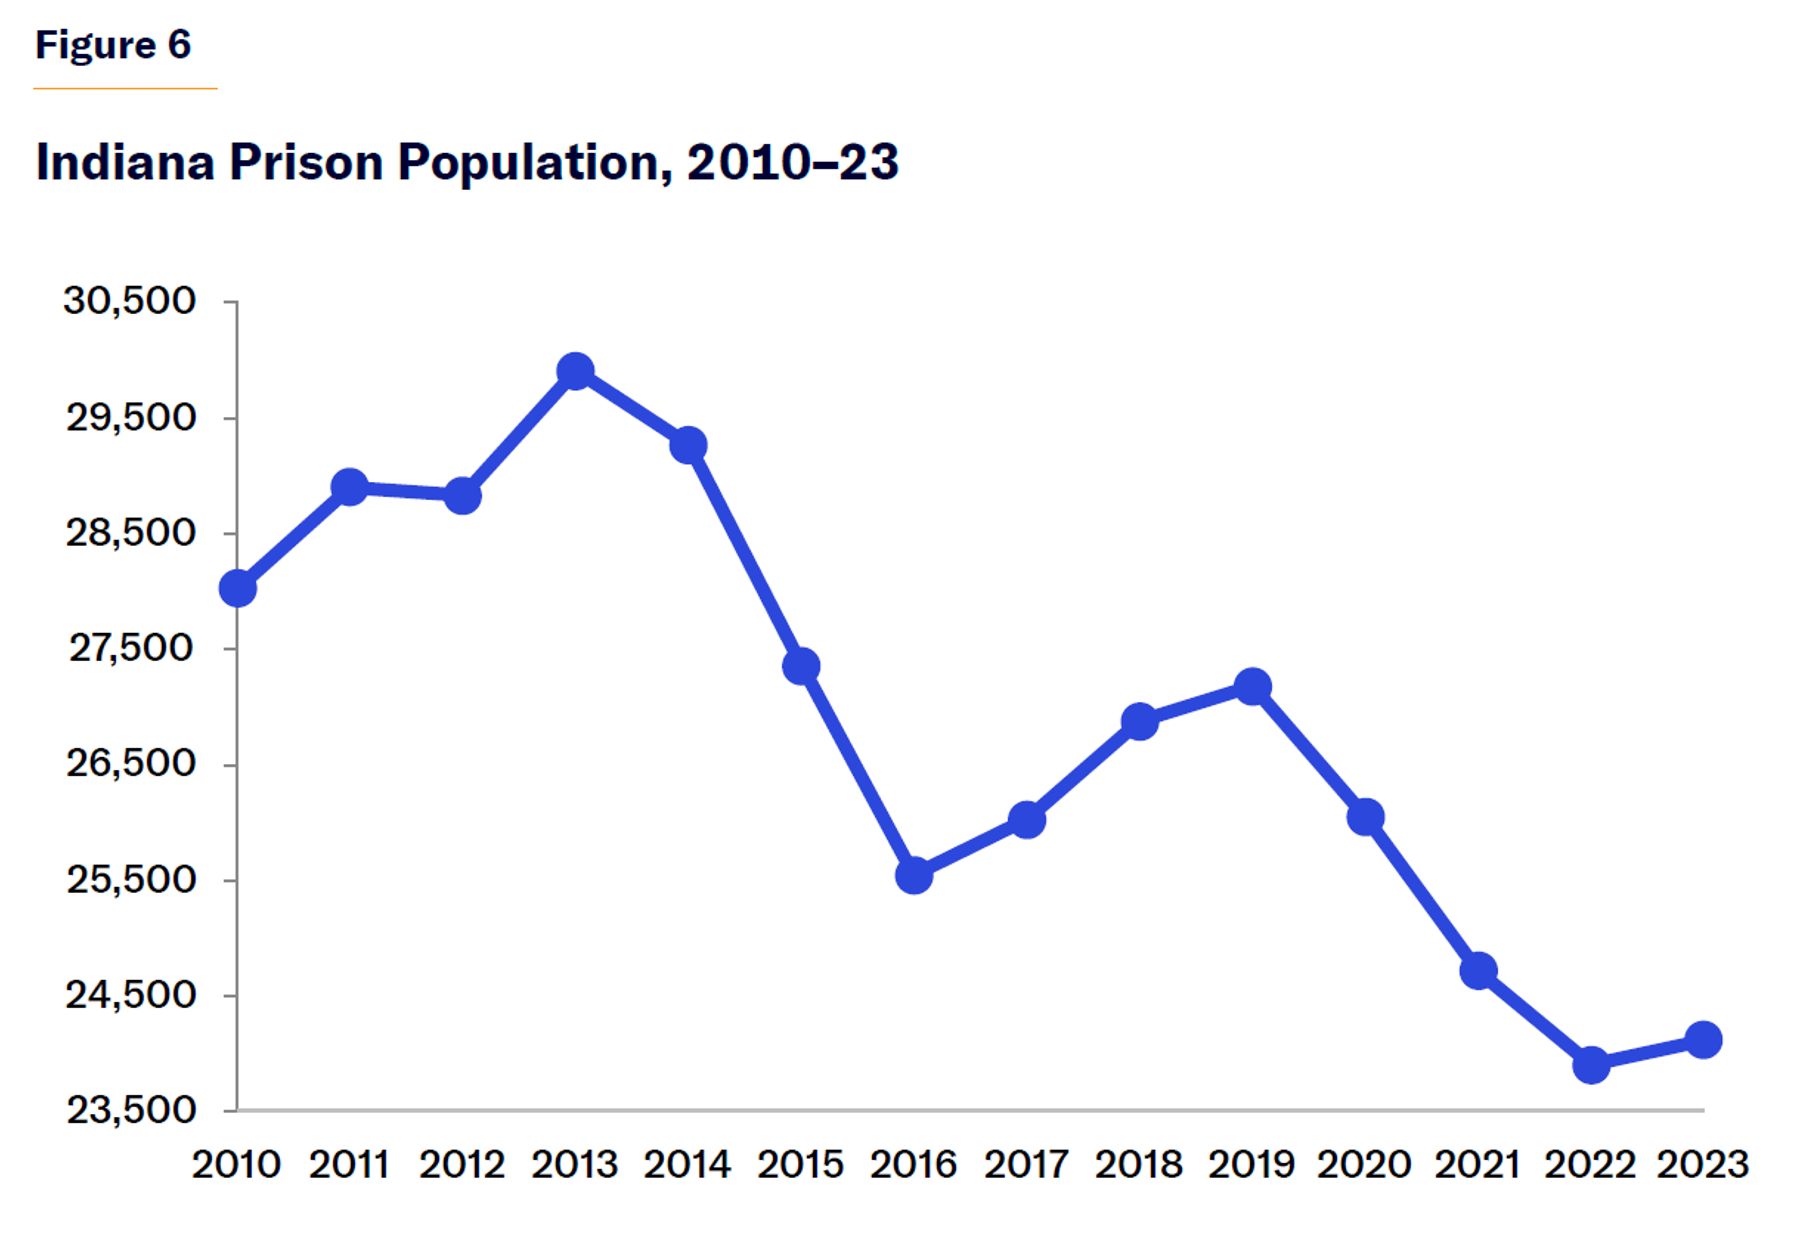
Another large red state that has seen a decline in its prison population is Indiana. Its prison population declined by 14% between 2010 and 2023, from 28,028 inmates to 24,116.[40] The decline has been fairly steady since it began in 2014 (Figure 6).
Corrections spending, meanwhile, has increased in real dollars but remained a small percentage of total state spending. Spending increased from $727 million in 2010 to $889 million in 2023, an increase of 22.4% in real dollars.[41] But overall corrections costs accounted for just 2.7% of state spending in 2010 and 2% of spending in 2023.
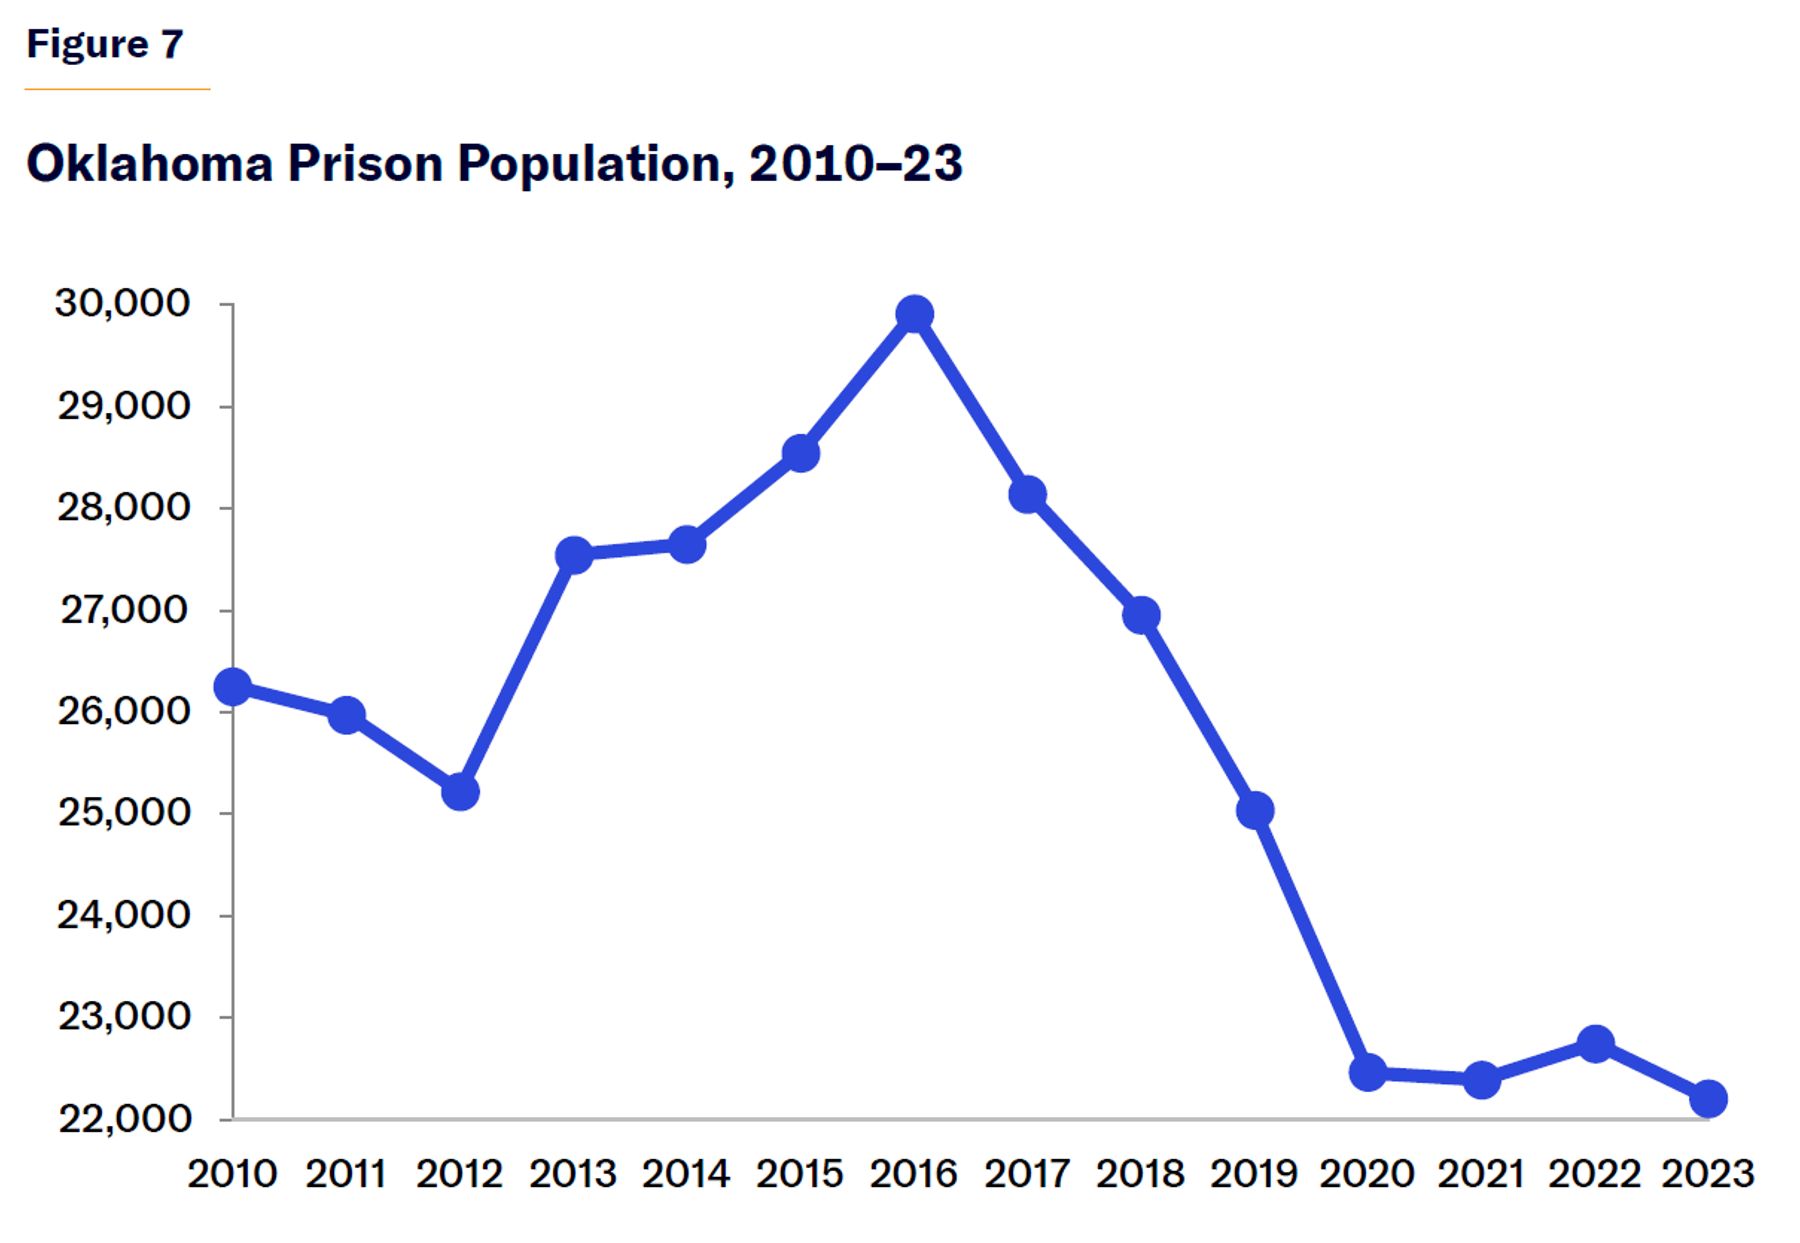
Smaller red states have also seen declining prison populations. Oklahoma had a 15.4% reduction in state prisoners between 2010 and 2023, from 26,252 prisoners to 22,206.[42] The downward trend, however, began only in 2016, when the state prison population was 29,916. Since then, the population has declined by 25.8% (Figure 7).
Unsurprisingly, between 2010 and 2016—while the prison population was growing—the corrections budget increased by 9.5%. But spending continued to increase, by another 5.9%, between 2016 and 2023, while the prison population was declining.[43] Throughout the whole period, corrections remained a small percentage of the overall state budget (6.9% in 2010 and 5.7% in 2023).
Overall, the red states examined showed significant reductions in prison populations but continued growth in corrections spending. Despite the spending growth, corrections spending does represent a declining percentage of red-state budgets, due to greater spending growth elsewhere.
Blue-State Declines in Incarceration
In blue states, the declines in prisoner populations between 2010 and 2023 were, on average, greater than those in red states. They were also more consistent: no blue state had an increased prison population during the period. But were blue states able to achieve greater taxpayer savings, thanks to these reductions?
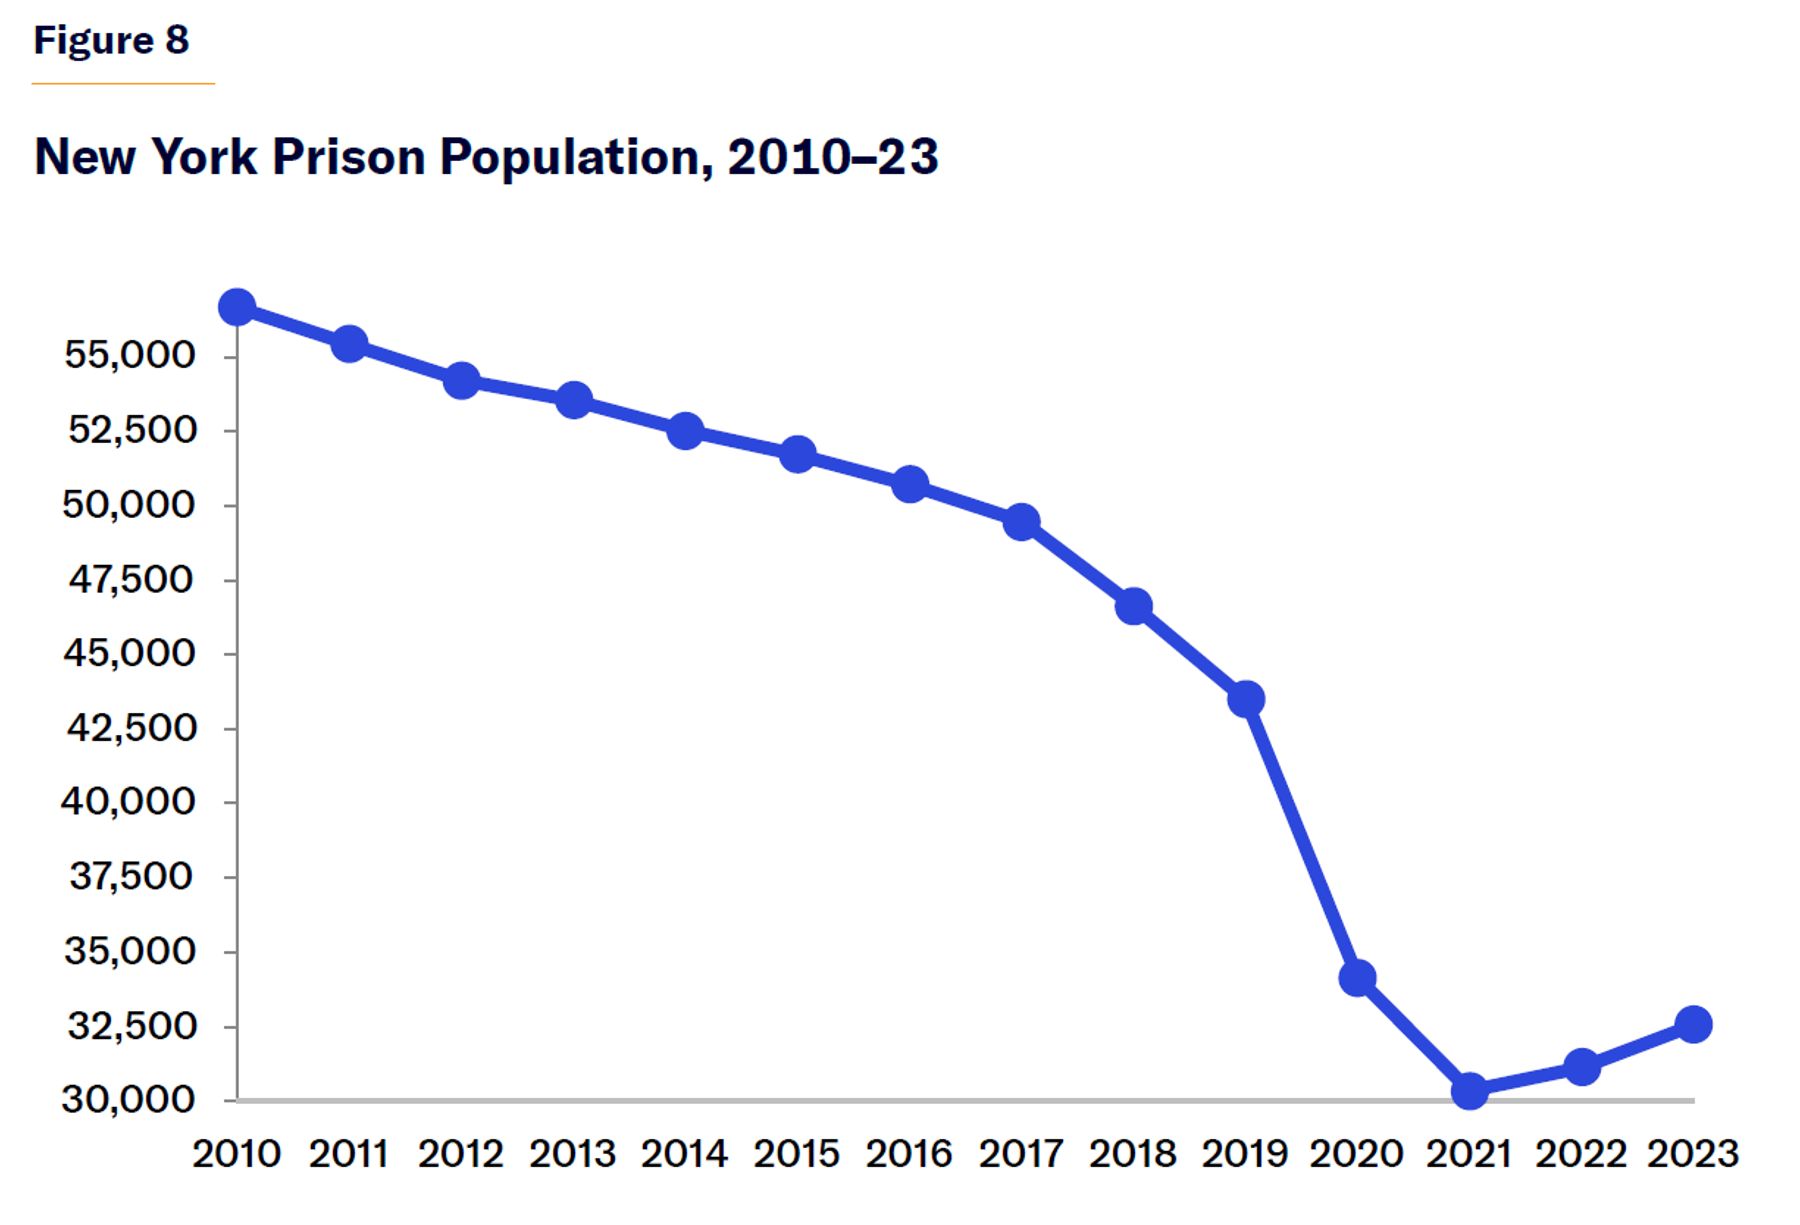
In New York, the prison population declined by 42.5% between 2010 and 2023 (Figure 8).[44] In 2010, the Empire State had 56,656 state prisoners, compared with 32,565 in 2023, a decline of 24,091 inmates. This is the second-largest decline in the number of prisoners of any state, behind only California. The decline was mostly steady but accelerated in 2020, and there were slight increases in 2022 and 2023. Like Texas, New York closed a number of prisons over this period.[45]
But corrections spending grew from $2.9 billion to $3 billion in real dollars—an increase of 4.73%, which was less than spending growth in red states.[46] Corrections spending as a percentage of total state spending remained low but also declined, from 2.3% of state expenditures to 1.4%.
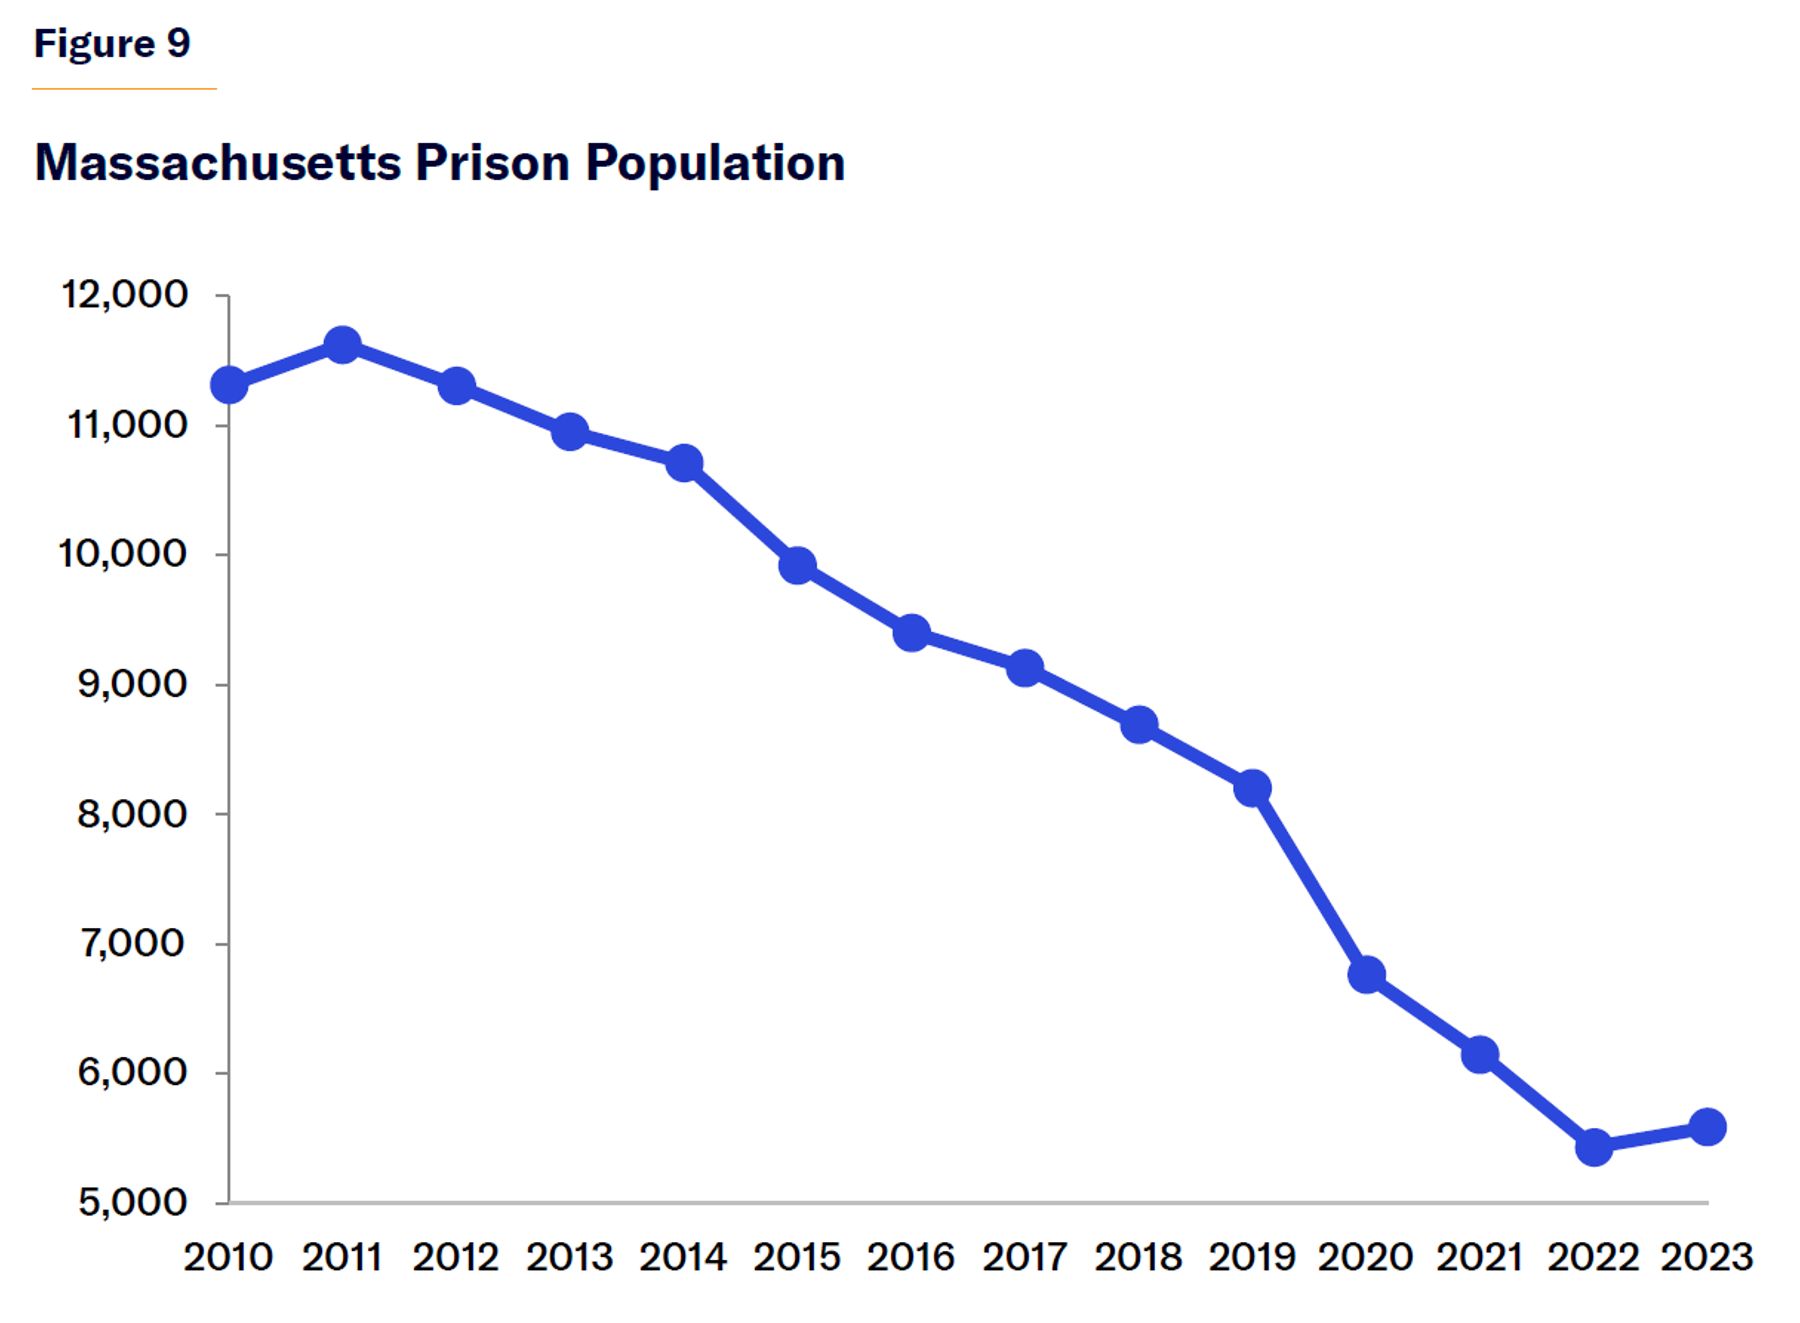
Other blue states fared no better. In Massachusetts, the state prison population declined by 50.6% from 2010 to 2023,[47] while spending on corrections increased by 48.3% in real dollars (Figure 9).[48] Spending on state prisons specifically increased by 47.2%. As in other states, however, steeper growth in other state expenditures led to corrections spending declining as a percentage of the state budget, from 2% to 1.5%.
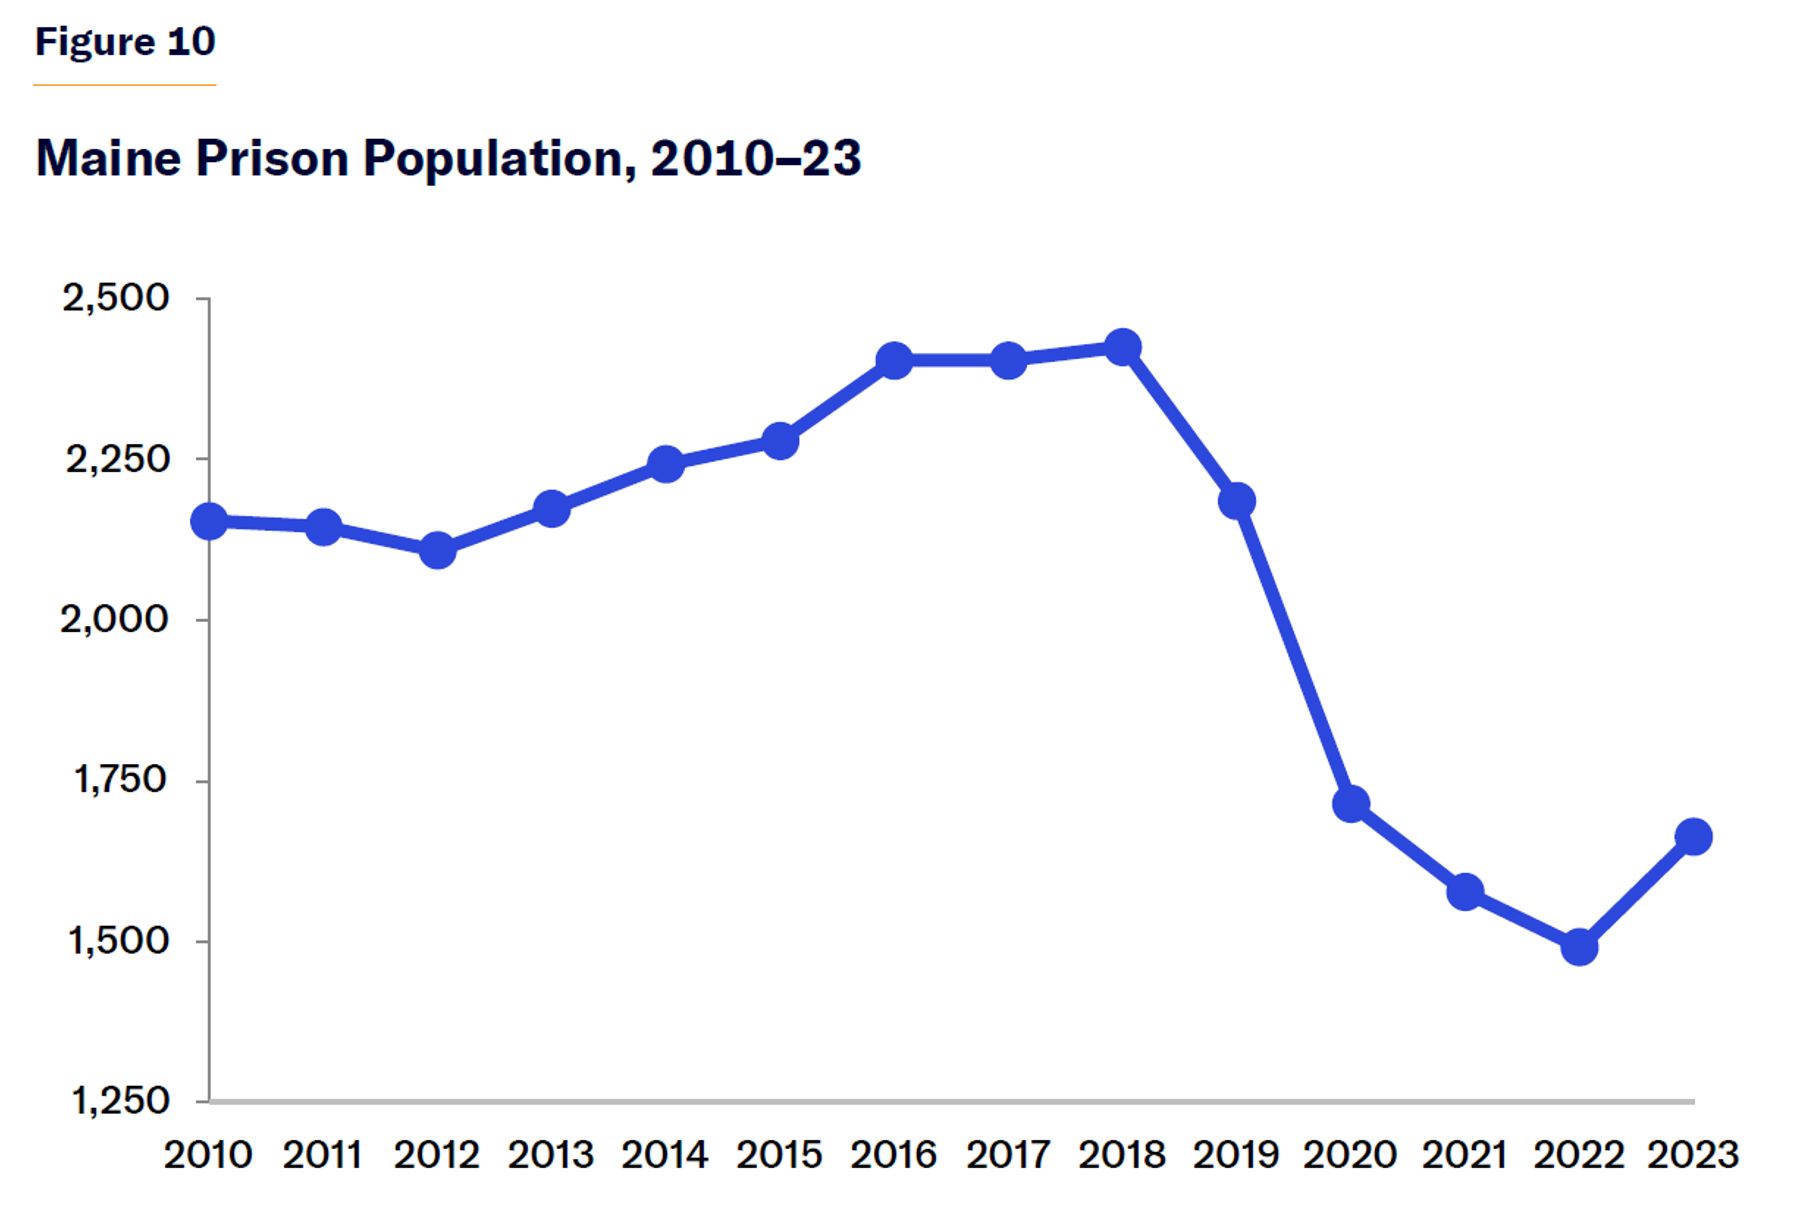
Maine, a rural blue state, offers an interesting counterpoint. Between 2010 and 2023, Maine’s prison population declined by 22.8%, or by 491 inmates (Figure 10).[49] Spending on corrections also increased by 30%, from $162 million to $210 million.[50] In that sense, Maine is in line with the other states examined. However, spending on adult prisons specifically declined slightly over that period, from $76.2 million to $72.7 million. That $3.5 million reduction represents just under 0.03% of the state’s 2023 state budget, representing a savings of $7,194 per inmate—which is meaningful, albeit equivalent to only 6.2% of Maine’s aggregate division per-inmate, per-year cost of $116,689.
This suggests that it is possible to reduce real dollar corrections expenditures by reducing prison populations—but the savings are modest and far smaller than what would be expected based on aggregate division per-prisoner cost estimates.
Discussion
Why haven’t smaller prison populations resulted in real dollar savings in most states? Perhaps the declines have not been quick enough. In most of the states evaluated, declines have been relatively small year-to-year but significant over the whole 2010–23 period. Possibly, the system adjusts to many smaller reductions differently from how it would to a single large reduction.
It is also possible that the reductions were not big enough. In many of the states examined, the reduction in prison populations was 15%–20%. This may not be a large enough decrease to produce real savings on long-run marginal costs. Any savings on short-run marginal costs are small enough that they are offset by increased spending on reentry programming or community supervision.
Larger reductions in prisoner populations will likely require releasing at least some violent or recidivist offenders, or preventing the incarceration of such offenders in the future. As noted earlier, the majority of state prisoners are there for violent offenses, and an even larger majority had five or more arrests prior to their incarceration. The question of whether the political will exists to release or not incarcerate such offenders—or if it would be smart policy to do so—is not addressed here.
A lack of political will might help explain why spending has not decreased alongside declining prison populations. Possibly, prison populations in some states have declined sufficiently to make the current level of capacity and staffing infrastructure unnecessary, but there has not been the political will to close facilities or fire staff. If so, even sizable declines would not yield any savings in long-run marginal costs. However, both Texas and New York did close several facilities over the period examined here.
Whatever the reason, states have largely been unable to reduce real dollar costs associated with corrections and prison spending, despite reductions in prison populations.
The potential for significant cost savings remains a common argument for certain criminal-justice reforms. In 2024, for example, Michigan legislators introduced a prison credits bill, claiming that it would save $35,000 per inmate, per year who had his sentenced reduced because of the bill.[51]
In addition to unrealistic estimates of how much could be saved from decarceration, these arguments suffer from a larger problem: they assess costs in a vacuum, assuming that decarceration would not increase costs in other ways. This is unlikely. A large body of criminological research has found that larger prison populations decrease crime through incapacitation.[52] When that incarceration is focused on high-rate offenders, the incapacitation of a single offender can prevent 9.4 serious felonies.[53]
Additional crime comes with considerable costs. Recent estimates for the total annual cost of crime in the U.S. range from $2.6 trillion[54] to $5.76 trillion,[55] depending on exactly what is included. Importantly, violent crime accounts for 85% of those costs.[56]
Homicide is by far the most expensive crime—typically estimated at about $9 million per offense[57]—due to lost potential earnings of victims, as well as the resources devoted to these investigations, prosecutions, and incarcerations. For each robbery, the estimated cost is $40,000–$70,000; for each serious assault, about $100,000; and for each burglary, $6,000–$13,000.[58]
Some of these costs, of course, come from incarceration—but most of the cost comes from the crime itself.
Conclusion
In the wake of the 2008 recession, Republican budget hawks in state legislatures across the country began to demand reductions in prison costs. A combination of policy changes and declining crime rates reduced prison populations in most states in the country, but corrections costs continued to grow. Despite their growth, corrections spending remains a small and declining percentage of overall state spending.
A particular criminal-justice reform might make our system more just; it might reduce recidivism or even decrease crime. What it almost certainly will not do is reduce corrections budgets or overall state spending. Policy discussions about criminal-justice reforms ought to adjust accordingly.
Acknowledgments
The author would like to thank Jessica Snellings, Georgia Center for Opportunity research analyst for her extensive data collection and other work on this project. The author would also like to thank Rafael Mangual and Robert VerBruggen for their comments on the draft.
Endnotes
Photo: Peter Unger / The Image Bank Unreleased via Getty Images
Are you interested in supporting the Manhattan Institute’s public-interest research and journalism? As a 501(c)(3) nonprofit, donations in support of MI and its scholars’ work are fully tax-deductible as provided by law (EIN #13-2912529).