Testimony on Low Labor Force Participation Rates Tell Us about Work Opportunities, Incentives
Chairman Coats, Ranking Member Maloney, and Members of the Committee, thank you for the opportunity to testify before the Joint Economic Committee today. Policy cannot succeed but accidentally if we do not have a clear understanding of the problems that face us. It is my belief that much of what we think we know about living standards, economic insecurity, and the state of the economy is incorrect, based on a mistaken read of the available data. Furthermore, our misinterpretation of the data, more often than not, translates into an exaggeration of the economic challenges we face. I hope I can illustrate this today and provide a new way to think about labor force participation data and what they mean for opportunity and incentives.
Understanding trends in labor force participation requires that different demographic groups be assessed individually. Failing to distinguish between the experiences of different groups will often cause important details to be missed. In particular, since expectations of and preferences for work have historically differed so much between men and women, it is necessary to examine them separately. Because labor force participation changes throughout the life course, as people move from schooling to work to retirement, age should also be taken into account in assessing trends. Other times, educational attainment or ethnic background are relevant markers for fundamentally different interactions with the labor market.
In my past research, I have examined trends in the labor force participation of men between the ages of 25 and 54. That research found that a strong majority of men in this age range who are out of the labor force—roughly 70 percent on the eve of the Great Recession—tell government surveyors when asked outright that they do not want a job. The increase in their numbers between 1979 and 2006 explains nearly all of the decline in labor force participation among men between the ages of 25 and 54.
Furthermore, roughly half of men in this age range and out of the labor force cite a disability when asked the reason for not working or looking for work. The increase in their ranks explains about one-third of the decline in labor force participation. Most data on health indicators offer little reason to think that disabilities are becoming more common, but receipt of federal disability benefits has increased significantly since the 1980s. Roughly half of the increase since 1989 may be attributed to policy changes that have made it easier to receive disability benefits (and made them more attractive). Federal disability benefits increasingly serve as a shadow long-term unemployment program for a group of able-bodied men with low skill levels.
Today, I will focus my remarks on the labor force participation of black and white men and women under age 25. The degree to which these groups are attached to the labor force is a vital empirical question, as is the extent to which changes in their labor force attachment reflect on their opportunities. These adults also provide a clear illustration of the ways in which policy can affect incentives to increase labor force participation. Confining the analyses to these groups will also help to make manageable the task of illustrating how tricky it is to make sense of seemingly straightforward data.
Figure 1 displays labor force participation trends for adults 18 to 24, broken out by sex and race. Considering women first, black and white women had the same labor force participation rates during the 1960s, but a gap opened up in the 1970s and widened through 1993. For both groups, participation rose through 1997 (for black women) or 1998 (for whites). White women’s participation began to plateau starting in 1987 after having risen consistently since at least 1962.
The increase in participation among young black women was not as continuous, and unlike the rate for white women, participation fell significantly from 1988 to 1993—to below its 1969 level. Strikingly, however, the participation rate for young black women jumped from 53 percent to 69 percent in the four years between 1993 and 1997. That increase is unlike anything else in the chart and begs for an explanation.
Before turning to that, however, it is worth examining the trends for young men, among whom labor force participation has been on the decline for decades. It peaked for white men in 1981, while the black participation rate has declined steadily since at least 1962. The labor force participation rate was actually higher among young black men than among whites during the 1960s, but the two rates crossed over around 1970. The gap that opened up during the 1970s barely narrowed at all thereafter.
Since young black men were the only group not to experience a rise in labor force participation at some point over the period, it is tempting to conclude that the black male trend is an especially alarming outlier. However, as we will see, Figure 1 presents too pessimistic a picture of how the labor market is performing. Labor force participation can fall for reasons we should celebrate, and it can rise due to developments that are concerning. An increase in school enrollment, for instance, will lower labor force participation, while a decline in school-going will raise it. Trends in school enrollment turn out to matter a great deal in assessing the patterns in Figure 1.
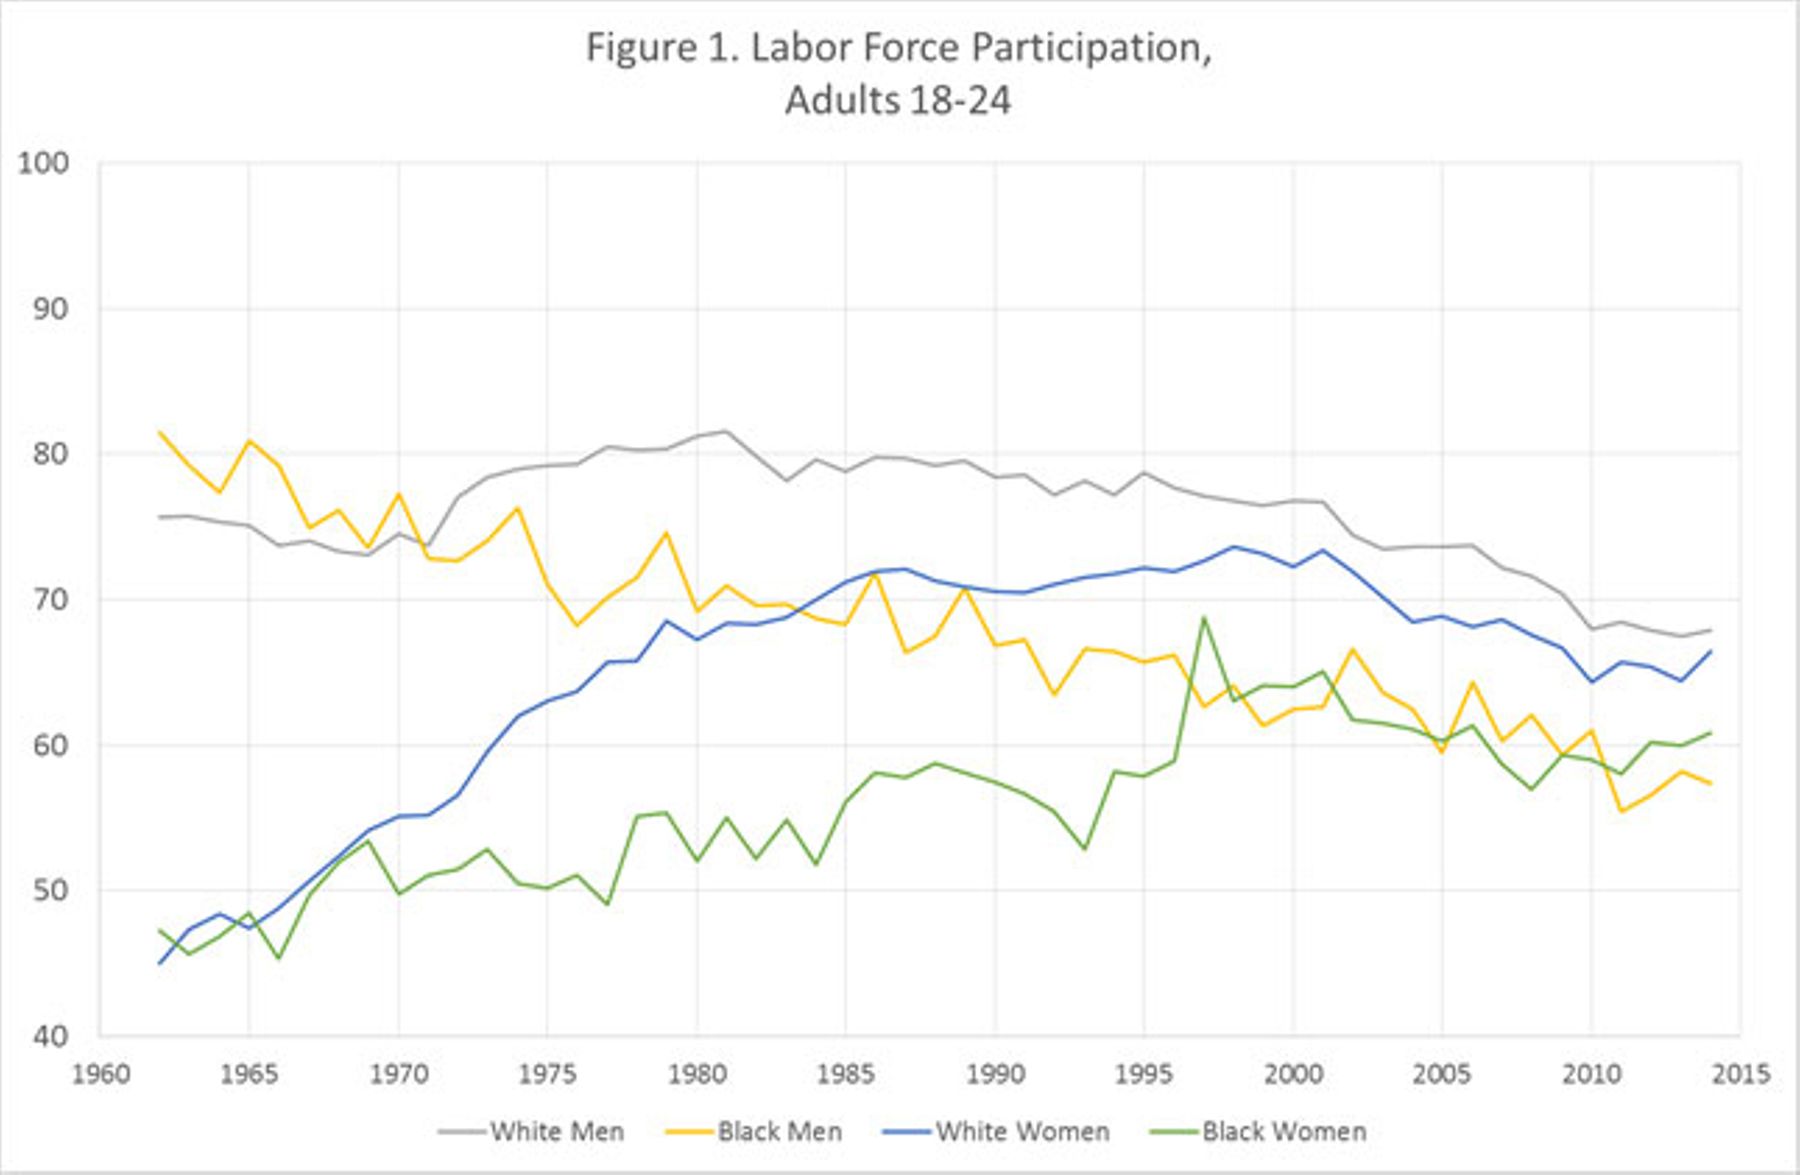
Figure 2 shows trends in school enrollment, using overlapping series based on distinct survey responses. In the set of estimates for the earlier period, enrollment rates indicate the percent of people for whom being in school was the major activity in which they were engaged and who were out of the labor force. The estimates for the more recent period indicate the share of people who were enrolled in school and were outside the labor force. The two series tell the same story, as can be seen looking at the years in which they overlap, from 1986 to 1993.
Are you interested in supporting the Manhattan Institute’s public-interest research and journalism? As a 501(c)(3) nonprofit, donations in support of MI and its scholars’ work are fully tax-deductible as provided by law (EIN #13-2912529).