Cut Spending For The Rich Before Raising Their Taxes

Photo: ijeab/iStock
Members of Congress have increasingly demanded large tax hikes on upper-income families to finance large spending increases on top of soaring baseline deficits. But even the most aggressive tax hikes on the rich would make only a small dent in the long-term budget deficits, and they would significantly harm the economy. Before considering any new taxes, lawmakers should first reduce federal spending benefits for high-income families. This bipartisan strategy would achieve both the redistributive goals of the left and the spending restraint goals of the right.
Such upper-income spending cuts have several advantages over new taxes: 1) they will not harm economic growth, 2) they increase future policy flexibility, 3) they are better targeted, and 4) they promote political compromise.
Several programs target spending to wealthy Americans. This report focuses on three of the largest: Social Security, Medicare, and farm subsidies, where basic reforms could save upward of $1 trillion in the first decade, and substantially more in future decades.
Introduction
As structural budget deficits grow to trillions of dollars and politicians promise even more spending, taxing the rich has become a popular solution to finance expanded government. But large tax increases on high earners not only are insufficient to close much of these budget gaps; they would also reduce economic growth and kill jobs. Additionally, they are often poorly targeted, build expectations of higher government benefit levels later, and reduce Congress’s flexibility to tax these families for other purposes down the road.
The goal of redistributing income down the ladder can be accomplished not only by taxing the rich but also by cutting federal spending that disproportionately benefits them. This approach is more pro-growth and better targeted. It also represents a plausible bipartisan compromise between progressives who want the wealthy to bear more of the costs of government and conservatives who prefer to simply reduce its size.
The federal budget is growing rapidly. The national debt held by the public has increased from $5 trillion to $22 trillion since 2007, as a result of two deep recessions, $6 trillion in stimulus legislation (across both recessions), and $3 trillion in tax cuts, as well as annual (inflation-adjusted) increases in the cost of Social Security, Medicare, and Medicaid of just under $1 trillion per year.
The national debt held by the public is projected to soar to $35 trillion by 2030[1]—or $42 trillion, if President Biden’s entire campaign agenda is enacted.[2] This would leave the national debt at 130% of GDP, or one-quarter higher than at the end of World War II.
Even without any new legislation, the Congressional Budget Office (CBO) projects $104 trillion in new borrowing over the next 30 years, bringing the national debt to 195% of GDP.[3] Nearly all this debt will result from general revenue transfers into the Social Security and Medicare systems to close their widening shortfalls, as well as the added interest costs on the national debt created by these shortfalls.[4]
Some new taxes on the rich will likely be part of any realistic plan to substantially close this gap.[5] But these taxes alone won’t come close to stabilizing the national debt. Hypothetically seizing all annual household income earned in America above the $1 million threshold would not even balance the short-term budget, much less address growing long-term budget gaps or finance new spending programs.[6 ]Even if we were to double the top two income-tax rates to 70% and 74%, impose the world’s largest wealth tax, tax capital gains as ordinary income, impose a 77% estate tax, and apply the Social Security payroll taxes all the way up the income ladder—bringing marginal income-tax rates of nearly 100% and savings taxed at similar rates—it would still not fully finance President Biden’s spending agenda, much less the underlying $100 trillion in borrowing that is scheduled in the baseline.[7]
Lawmakers should take a stronger look at cutting spending on the rich. While most federal benefits go to the middle class (particularly in the Social Security and Medicare programs) and federal antipoverty spending has steadily grown to 4% of GDP, Washington continues to distribute cash and in-kind federal benefits to wealthy families. Cutting this spending brings several advantages over upper-income tax hikes.
Economic Growth. While economists debate the magnitude of these effects on the margin, the general consensus is that steep tax-rate increases reduce incentives to work, save, invest, and be productive. They distort economic decision-making, incentivize expensive avoidance and evasion schemes, and often drive income away from the jurisdictions doing the taxing. Even if, as many economists believe, these costs can be outweighed by the benefits of federal redistribution programs or public goods, it would still be best to minimize those costs as much as possible. Reducing upper-income spending benefits can enhance redistribution yet avoid many of the broader negative macroeconomic effects of large new taxes.
Policy Flexibility. High taxes reduce policy flexibility in two ways. First, tax rates can rise only so high before the economic harm becomes overwhelming and new revenues fall away. For example, applying the 12.4% Social Security tax to all wages would close roughly half the long-term Social Security shortfall.[8] It would also raise combined marginal tax rates (including federal income, state income, and payroll taxes) on upper-income families past 60% in many states, which approaches the revenue-maximizing tax rate, and thus leaves little room for taxes on the wealthy to close the much larger Medicare shortfall or to finance new government initiatives on such things as climate, infrastructure, health, the safety net, K–12 education, and college student debt relief.
Second, exorbitant tax increases create expectations of large future government benefits, especially for social insurance programs. And the more that government locks in these large benefits, the more politically difficult it will be to unwind or repeal those benefits down the road as costs escalate. Maximizing tax rates and locking in unaffordable spending promises would paralyze future governments.
Better Targeting. The person paying the high tax rates today may not be around to collect the earned government benefits later. This problem would not apply to paring back spending benefits.
Political Compromise. Spending cuts are never popular. Yet many wealthy families would surely accept smaller current and future government benefits in return for limiting the substantial tax increases that they may otherwise face. Additionally, conservatives wary of tax increases may be willing to accept the progressive goals of expanding redistribution through this alternative route.
Critics of these cuts will contend that programs like Social Security and Medicare enjoy broad support because they are universal, and thus any means-testing will render them as unpopular (and prone to cuts) as welfare. But means-tested programs have proved extraordinarily politically resilient. Since 1965, federal antipoverty spending has steadily risen from 0.5%–4.0% of GDP[9]—across Republican- and Democratic-led governments—and programs like Medicaid have been expanded with the strong support of state referenda. Nor is it true that these programs are entirely universal; Medicare benefits, for example, have been income-related, without undermining program support. It is not true that means-testing will lead to drastic, across-the-board cuts.
Furthermore, there is no reason to believe that large tax increases would not undermine program support among wealthy families just as much as benefit cuts. If wealthy people support Social Security because their taxes finance their future benefits, then doubling their Social Security taxes (by eliminating the payroll-tax wage limit) without a corresponding benefit increase will break that tax-to-benefit link just as much as cutting their future benefits. Social Security expert Andrew Biggs states: “It is not clear why large benefit cuts for high earners would reduce their support for entitlement programs, as the left believes, but even larger tax increases would not—unless we assume that the best-educated and hardest-working Americans are extremely bad at math.”[10] Once it is agreed that wealthy families should bear a larger burden of redistribution, higher taxes and smaller benefits both accomplish the same goal.
Several programs disproportionately benefit wealthy Americans. This report focuses on three of the largest: Social Security, Medicare, and farm subsidies, where basic reforms could save upward of $1 trillion in the first decade, and substantially more in future decades.
Why Subsidies to Wealthy Seniors Should Be Targeted
Social Security and Medicare were created in eras in which most senior citizens endured low incomes and little savings. By contrast, today’s seniors are the wealthiest cohort in the wealthiest country in its wealthiest era.[11] While some seniors still struggle, average household retiree income grew more than twice as fast as working-age salaries between 1979 and 2016 (the latest data available).[12] And the wealthiest 10%–20% of seniors are doing remarkably well. Four million retiree households hold more than $1 million in investable assets, and 1.1 million households hold more than $3.5 million.[13] Relatedly, CBO data show that 6.3 million elderly Americans live in households that currently earn annual market incomes of at least $87,200 for someone living alone or $123,400 for a two-person household—including 2 million seniors in households earning more than $174,100 (one person) or $246,200 (two people) annually (Figure 1). To the extent that such high post-retirement incomes derive from annuities or 401(k)-style investments, they suggest investment portfolios that are well into the millions of dollars.

Social Security
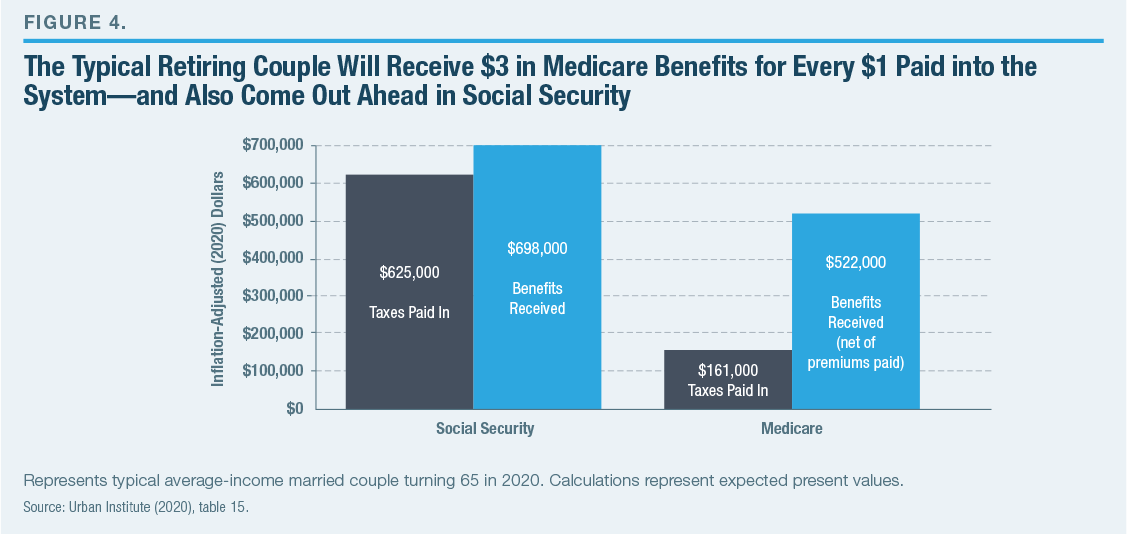
First, let’s examine Social Security. Despite conventional wisdom that Social Security recipients are merely getting back what they paid in to the system, the reality is that the typical average-income married couple retiring today will receive $698,000 in lifetime benefits from $625,000 in lifetime Social Security contributions (figures adjusted into net present value).[14]
- High-earning Americans, in particular, receive large annual benefits:
- A typical high-earning couple will collect $836,000 in benefits from $812,000 in contributions (in net present value).[15]
- The typical high-earning couple retiring in 2020 will receive approximately $50,000 in first-year benefits, compared with $42,000 for a couple with two average earners.[16]
- On an individual level, initial benefits for someone retiring in 2021 can be as high as $37,776—or $46,740, if retiring at age 70.[17]
Figure 2 shows initial benefits for a retiring couple with one average earner and one high earner, by year of retirement. These data suggest that Social Security is not merely social insurance—which would insure against low incomes—but rather a universal system currently designed to pay large benefits (exceeding lifetime contributions) even to wealthy Americans. This contributes to widening Social Security deficits that must be funded by general revenues.
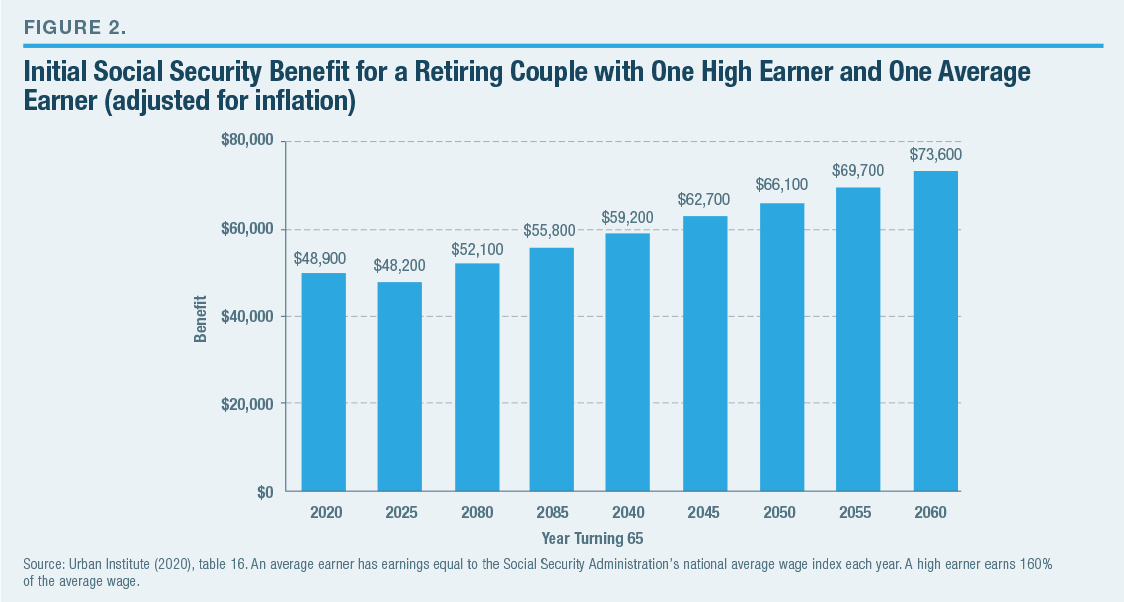
Social Security benefits for the wealthy are also set to steeply rise for future retirees—with benefit levels replenishing a larger percentage of their lifetime earnings—because benefits are designed to grow significantly for each succeeding generation, even adjusting for inflation.[18] Imagine two individuals, 30 years apart, who both retire at age 65, having earned 160% of the average wage index over their lifetime. The person who retires in 2020 would receive first-year Social Security benefits of $28,182, while the person retiring at age 65 in 2050 will begin with $37,642 in initial benefits (adjusted for inflation)—a level that is 34% higher.[19]
Whatever the merits of generational increases in Social Security benefits for low- and middle-income retirees may be, it is much more difficult to justify them for millions of current and future retirees who have millions of dollars in savings and high post-retirement incomes—especially when Social Security is running large deficits. Former Social Security public trustee Charles Blahous notes that, for Americans born in the 1960s—who will be retiring over the next 15 years—the highest-earning quintile will, on average, receive enough Social Security benefits to cover 49% of their target postretirement income.[20] That is quite generous, given the degree of savings and pensions also available for this high-income group.
What does this cost? Over the next decade, CBO projects that Social Security’s Old Age and Survivors Insurance (OASI), the largest federal program, will cost $12.8 trillion.[21] Approximately $1.6 trillion of that spending will go to one-person households earning at least $87,200 and two-person households earning at least $123,400 in market income (adjusted for inflation). This includes $500 billion in benefits for retired one-person households earning at least $174,100 (one-person household) or $246,200 (two-person households).[22] While most of these benefits will be subject to income taxes, it is still an enormous cost to the federal government.
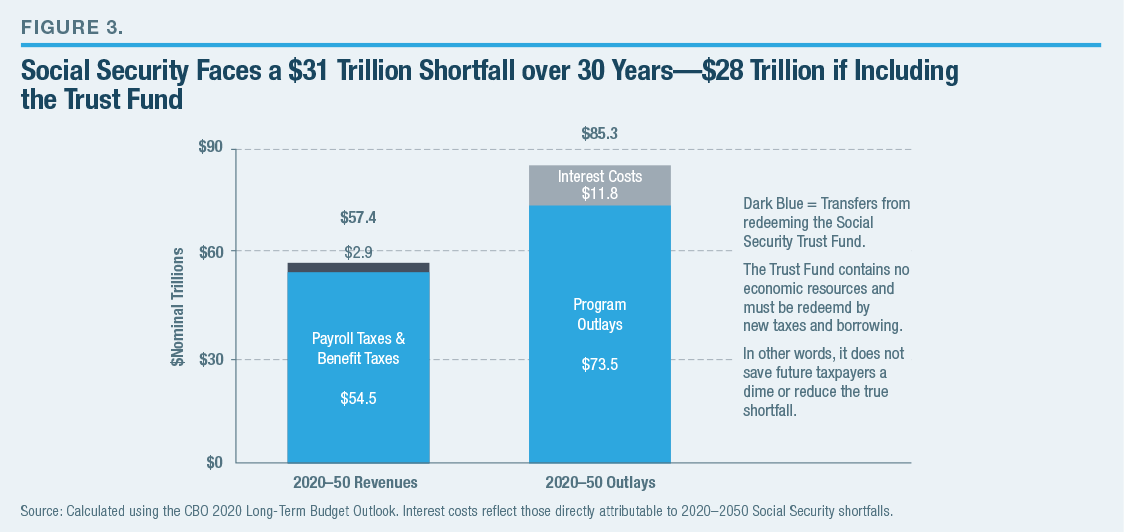
The unsustainability of Social Security’s finances is well known. Between 2020 and 2050, the system is projected to collect $55 trillion in payroll taxes and taxes on benefits and to pay out $74 trillion in benefits—creating a $19 trillion shortfall. Much of that shortfall will be funded by federal borrowing that will, in turn, add $12 trillion in interest payments on the national debt, and bring the true drain on the federal budget to $31 trillion (Figure 3).[23] Repaying $3 trillion to the Social Security Trust Fund does not change these figures because that requires outside taxes and borrowing as well. Clearly, Washington’s overpromises on Social Security will require difficult decisions, and it makes the most sense to start with the wealthiest retirees. Rather than eliminating the current $142,800 wage cap on Social Security taxes and then canceling the corresponding benefit increases—which would harm the economy and leave little room to raise taxes for upper-income retirees in order to close remaining deficits—it makes sense to trim benefits for upper-income retirees.
Solutions: At the risk of minor oversimplification, Social Security benefits are calculated at retirement by first indexing all lifetime wages (capped at a certain annual income) to the economy’s subsequent growth of wages (rather than price inflation) to create a present-day wage equivalent. Then the program calculates the average indexed monthly earnings (AIME) for the highest-earning 35 years. The initial Social Security benefit replaces those wages at a marginal rate of 90% of the lowest earnings (currently the first $11,952 annualized), followed by 32% of medium-level earnings (between $11,953 and $72,024 annualized), and then 15% of the marginal earnings above that level. These thresholds are also adjusted annually by national average wage growth. From that initial level, benefits rise annually with price inflation. Benefits are adjusted downward for those who retire between 62 and the normal retirement age (currently 66 years and two months, and gradually rising), and adjusted upward for those who retire later, up to age 70.[24]
Options to trim benefits for the wealthy include:
- Reducing the 15% replacement rate (for earnings above $72,024) to 5%;[25]
- Setting initial benefits by converting lifetime earnings into an AIME using price inflation rather than (more generous) wage inflation for the top 20% of earners— a concept known as “progressive indexing”;[26] and
- Canceling out the annual cost-of-living adjustment (COLA) for benefits for retired individuals earning at least $92,750 and couples earning more than $185,500 (threshold adjusted annually for inflation).[27]
Precise savings estimates are unavailable partly because of the interactive effects of various proposals. However, data from the Social Security Administration suggest that, by itself, the savings from canceling upper-income COLAs would ramp up quickly, from $100 billion in the first decade to $2 trillion over 30 years.[28] By 2050, this policy would be closing as much as one-fifth of the projected annual Social Security shortfall. Reducing the top replacement rate from 15% to 5% could reduce Social Security shortfalls by 10% over the long term—and sooner, if current retirees are not exempted.[29] Progressive indexing of the initial benefits of the richest 20% of future retirees would save negligible amounts in the first decade but may reduce Social Security’s long-term shortfall by 5%–10%.[30] Again, the interaction of these policies may reduce cumulative savings. Reforms limited to the wealthiest seniors will not be sufficient to close the entire long-term Social Security gap—a higher eligibility age and benefit changes reaching further down the income line are likely required—but they are the lowest-hanging fruit and a sensible place to start.
A more ambitious plan to reduce the $500 billion in scheduled benefits over the next decade for retired households earning at least $174,100 (one-person households) or $246,200 (two-person households)—beyond just freezing COLAs and altering benefits for future retirees—could also finance an increase in the minimum benefit for low-income seniors and a larger benefit increase that kicks in 20 years after retirement, when savings are often running out (such benefit increases should be considered only in the context of making Social Security fully solvent). For upper-income families, these deeper Social Security cuts may still be preferable to lifting the payroll-tax wage cap and pushing their marginal tax rates as high as 60%.
Medicare
Addressing Medicare’s upper-income subsidies is even more straightforward than addressing those of Social Security because Medicare is based on even less of a social insurance model. The typical average-income couple retiring in 2020 will receive a staggering $522,000 in Medicare benefits (net of premiums paid) despite paying only $161,000 in lifetime Medicare taxes (Figure 4). A higher-earning couple will also receive $522,000 in net benefits despite paying just $209,000 in Medicare taxes (all figures adjusted for net present value).[31]
Large Medicare Part A (hospital insurance) benefits for upper-income families can be partially justified on the grounds that, like Social Security, they are partially “pre-funded” with payroll taxes. However, Medicare Part B (physician benefits) and Part D (prescription drugs) are not pre-funded with payroll taxes at all. The vast majority of enrolled retirees pay premiums equal to approximately 25% of the cost of coverage (wealthier retirees pay higher premiums), as well as some limited copays and deductibles. The taxpayers cover the rest.
Thus, Medicare Parts B and D are really age-based welfare programs, not social insurance. CBO estimates that, by 2030, Medicare Parts B and D will have a combined gross budgetary cost of $15,111 per enrollee annually. This will be financed by an average senior premium payment of $3,944 and a taxpayer-funded subsidy of $11,167 per enrolled retiree.[32]
That model is certainly justified for lower-income seniors whose resources are limited. But it is not justified when applied, for example, to the 4 million retiree households that hold at least $1 million in investable assets. Clearly, these families can afford to pay a few thousand dollars more per year in Medicare Part B and D premiums.
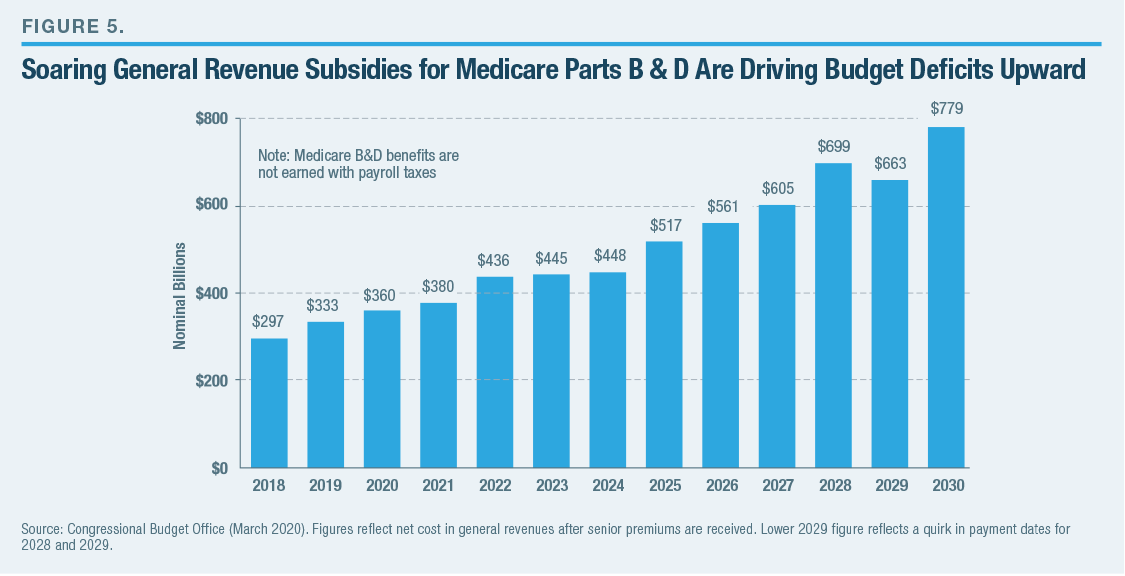
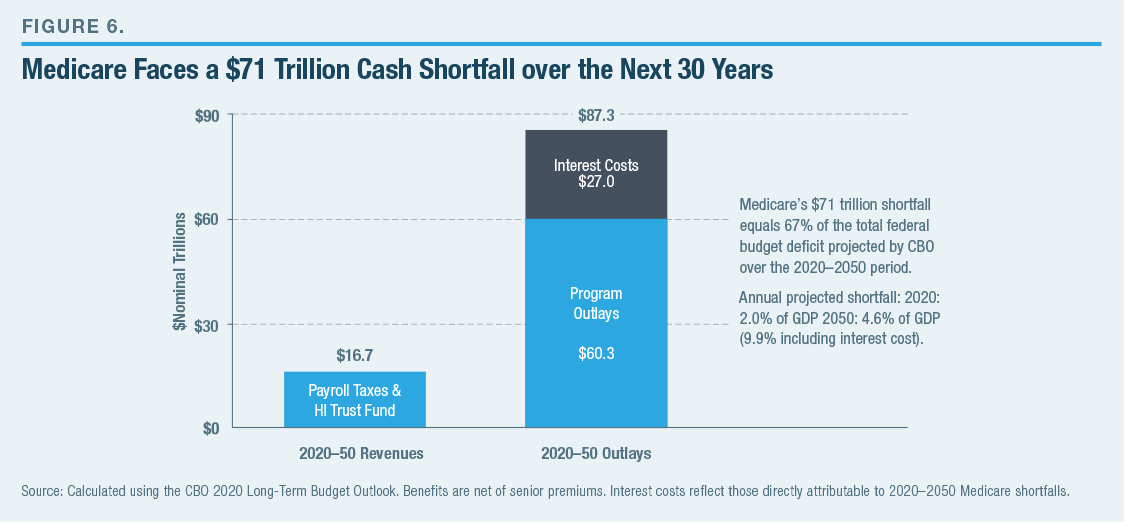
Federal Medicare Part B and D subsidies—net of premiums—will cost $5.5 trillion over the next decade. Their unsustainable 8% annual growth will push the annual cost from $360 billion to $779 billion over that period (Figure 5).[33] Between 2020 and 2050, the Medicare system will collect $17 trillion in payroll taxes and other collections while spending $60 trillion in benefits—plus an additional $27 trillion in interest payments on the national debt directly attributable to these shortfalls. This $70 trillion, three-decade shortfall, shown in Figure 6, is unsustainable, as is Medicare’s 4.6% of GDP annual shortfall by 2050 (10% of GDP, including interest).[34]
Medicare premiums are currently means-tested for upper-income retirees. For married couples, the premiums are set to cover the following shares of coverage cost:
- 35% for households earning between $176,000 and $222,000;
- 50% for households earning between $222,001 and $276,000;
- 65% for households earning between $276,001 and $330,000;
- 80% for households earning between $330,001 and $750,000; and
- 85% for households earning above $750,000.
Single retirees face thresholds at half these levels (except that the 85% rate kicks in for singles at $500,000, rather than $375,000), and these thresholds rise annually with inflation, except that the 85% threshold will remain frozen until 2028.
This means test currently affects just 9% of retirees, and only the highest-earning 2.5% of retirees pay premiums set at 80% or 85%.[35] One can legitimately ask why families still earning $300,000 or $400,000 after retirement—which corresponds to financial holdings far into the millions—are receiving unearned Medicare Part B and D subsidies at all. Perhaps a small federal subsidy is necessary to keep these families participating in Medicare Parts B and D, as their exit would generally leave a remaining insurance pool that is older and less healthy.
Solutions: A reasonable reform package would phase in higher premiums beginning at the 70th income percentile.[36] Under this system, retirees in the 70th to 90th income percentile would be assessed premiums ranging from 35% to 65%. From there, premiums would reach 80% for couples earning between $176,000 and $276,000, and 85% above $276,000. These income brackets would be halved for single households and would rise with inflation annually.
These premium increases would cost approximately $2,500 annually to the typical senior in the highest-earning 30%, with the hardest-hit seeing an additional annual cost of $4,000, or 4% of their income. These costs are certainly affordable for retirees with incomes well into the hundreds of thousands of dollars. They would also save the federal government approximately $470 billion over the decade—or more, when accounting for the increasing rates of baby boomers retiring with higher incomes.[37] Congress could also expand the savings by growing these brackets at a rate lower than inflation. Over several decades, the savings would accumulate steeply.
Lawmakers need not exempt Medicare Part A from reforms. Like Social Security, the “earning” of benefits with lifetime payroll taxes does not mean that upper-income benefits cannot be pared back, possibly with a modestly higher deductible or coinsurance rates. That said, the large Medicare Part B and D subsidies to wealthy seniors—which are not earned with previous payroll taxes—are one of the most justifiable ways to begin slowing the unsustainable growth of Medicare.[38]
Farm Subsidies
The federal spending category most egregiously tilted to upper-income households is farm subsidies. The persistent public support of this $20 billion annual expenditure is based largely on the false perception that they help poor, struggling family farmers who are always one drought away from bankruptcy. In reality, decades of government-encouraged consolidation of the agriculture industry have resulted in three-quarters of all farm production coming from 180,000 households that run commercial farms and who report an average household income of $300,000. The remaining 25% of farm production comes from 750,000 intermediate farms, where the average household income of $75,800 is derived overwhelmingly from nonfarm sources.[39] By comparison, the typical U.S. median household income was $63,761 in 2017, when these data were measured. This income gap between farm and nonfarm households is even more pronounced when accounting for the substantially lower cost of living in rural areas compared with large cities.
A recent report by the American Enterprise Institute (AEI) showed how the agriculture industry is thriving. The industry’s net cash income reached $134 billion in 2020, which is the seventh-highest figure since 1970 (adjusted for inflation).[40] Debt-to-asset ratios are in a long-term decline, only 2% of farm loans are currently classified as “nonperforming,” and less than 3% of farms meet the definition of extreme financial stress.[41] AEI adds that, since 2000, the annual farm bankruptcy rate has been just 0.02%.[42] Very few industries are as stable and strong over the long run as agriculture.
Farm subsidies come in four main categories: 1) Commodity subsidies that are distributed mostly to producers of wheat, cotton, corn, soybeans, rice, peanuts, and dairy (by contrast, producers of fruit, vegetables, livestock, and poultry do just fine, despite being ineligible for most commodity subsidies);[43] 2) conservation subsidies, in order to undertake new projects as well as to take 20 million acres of existing farmland out of production; 3) crop-insurance subsidies, which fund 60% of the farmer premiums; and 4) ad hoc disaster aid, as well as recent tariff and pandemic compensation.
The economic case for farm subsidies weakens every decade.[44] Producers of fruit, vegetables, poultry, and livestock have long thrived without regular commodity subsidies. The amorphous “food as national security” argument is undermined by America’s immense production levels that allow it to be a leading food exporter. Any slightly lower consumer prices due to commodity subsidies are offset by the higher consumer costs of milk and sugar regulations, as well as taking 20 million acres out of production. Farm subsidies often override market demand in determining which crops to plant and even induce farmers to plant on marginal land in order to collect crop insurance payments. Subsidies also often violate international trade agreements (inviting retaliation),[45] undercut impoverished third-world farmers,[46] and contribute to the obesity pandemic by subsidizing unhealthy foods like high-fructose corn syrup.[47]
The most common pro-subsidy argument is that farmers require a safety net to protect them from year-to-year income volatility caused by price fluctuations, weather-related disasters, and crop failures. But a permanent welfare program is not the solution for what is essentially an insurance problem. Imagine a hypothetical farm household that—over a typical decade—earns an income of $250,000 in eight of those years, and zero in the other two years. A simple insurance program (or futures contract) could be crafted that ensures a comfortable and steady income of $200,000 for each of the 10 years. Smoothing out the profitable and unprofitable years should have a net zero cost to taxpayers.
Instead, under the current system, that farm would likely receive subsidies ranging from $40,000 in good years to $100,000 in bad years. That is no more sensible than a car-insurance company sending every car owner a large annual repair reimbursement, regardless of whether they had an accident or filed a claim. Except in this case, taxpayers are paying the $20 billion annual cost.
This is not insurance against the chance of a bad year but welfare—what’s more, it’s welfare for the wealthy. For eligible farmers, subsidy levels grow with the size of the farm—and small family farms have been replaced by large agribusinesses. Farm consolidation has accelerated over the past three decades as a result of economies of scale, technology, and large federal subsidies.[48] Between 1991 and 2015, the share of agricultural production coming from farms with more than $1 million in gross cash farm income (basically cash receipts, farm-related income, and federal subsidies) nearly doubled, to 42% (threshold adjusted for inflation).[49] These farms produce a median household income of $360,000.[50]
Consequently, farm subsidies are overwhelmingly distributed to high-earning households.[51] A recent Department of Agriculture study determined that half of all commodity subsidies distributed between 2012 and 2015 went to households earning more than $166,000 annually—which was nearly triple the U.S. median household income of $58,700 (Figure 7). One-quarter of commodity subsidies went to families earning more than $392,000 in income, and just one-quarter went to households earning below $62,000 (which was still slightly above the U.S. median income). These figures reflect a rapid shift from 25 years earlier, when commodity subsidy recipients more closely tracked the normal distribution of U.S. household income. Crop-insurance subsidies are distributed even further upward, while conservation subsidies are distributed slightly less upward than commodity payments.

These policies are nearly impossible to justify. Families across America pay taxes that finance large payments to farm households near the top of the income distribution. These payments are made even during highly profitable years to an industry that—despite year-to-year volatility—enjoys high incomes with low debt-to-asset ratios and minuscule bankruptcy rates.
Solutions: In response to criticism over farm subsidy distribution, Congress has occasionally tried to limit annual subsidies to $125,000 per individual (a quite generous figure) and to restrict eligibility to households below certain levels of adjusted gross income (between $900,000 and $2.5 million). But intense opposition from farm lobbying groups induced Congress to include so many loopholes to these restrictions that the USDA concluded that “these caps and limits have not had significant effects on the distribution of Government program payments.”[52]
The farm subsidy system is so deeply tilted to upper-income households that fixing the distribution would likely require creating a new system from scratch. Congress can start by repealing the tariffs put into place by President Trump that have induced large farm compensation payments. These payments, combined with temporary pandemic aid, have pushed total farm subsidies to $30 billion in 2019 and $52 billion in 2020.[53] If both policies end, it will leave a system in place that spends approximately $22 billion annually over the next decade.[54]
Congress’s goal should be to replace a permanent farm welfare system with one that smooths out volatile annual farmer incomes and keeps them closer to their (often high) annual average income. Such an insurance system need not require expensive taxpayer subsidies.
First, Congress should phase out the $8 billion in annual commodity subsidies over the next few years.[55] If producers of fruit, vegetables, livestock, and poultry can survive without annual subsidies, then so can producers of wheat, corn, cotton, soybeans, rice, peanuts, and dairy. Next, Congress should gradually halve the $6 billion conservation budget. Farmers already have the incentive (and often the financial resources) to protect their own land investments, and pollution can be addressed with sensible regulations rather than generous payments that few other industries enjoy. Any assistance should be reserved for low-income farmers as well as for large, cross-farm public conservation initiatives.
Finally, the Department of Agriculture should encourage a better system to help farmers use insurance and futures markets to protect themselves from crop losses and price volatility—without permanent federal subsidies. This should include repealing crop-insurance subsidies for families with household incomes above the national median (and eventually, many of those below), which would reduce the annual federal cost from $8 billion to $2 billion.
In this improved system, the main federal roles would be research and development to help farmers become more productive, modest relief to low-income farms, and ensuring a functioning crop-insurance system to handle volatility. This can include a federal backstop if crop disasters truly overload the insurance system. These policies—when fully phased in—would reduce annual farm subsidies from $22 billion to $5 billion without significantly burdening low-income farmers or endangering the long-term viability of the U.S. agriculture sector.
Conclusion
Social Security, Medicare, and farm subsidies are three areas ripe for cutting spending on wealthy families. Other possible candidates include flood insurance, unemployment insurance, and several loan and loan-guarantee benefits for upper-income households, as well as corporate welfare spending in areas such as defense and energy. Before lawmakers endanger the economy and limit their future policy flexibility by drastically raising taxes on upper-income families, they can promote their redistributive goals simply by cutting federal spending on the rich.
Endnotes
About the Author
Brian Riedl is a senior fellow at the Manhattan Institute, focusing on budget, tax, and economic policy. Previously, he worked for six years as chief economist to Senator Rob Portman (R-OH) and as staff director of the Senate Finance Subcommittee on Fiscal Responsibility and Economic Growth. He also served as a director of budget and spending policy for Marco Rubio’s presidential campaign and was the lead architect of the ten-year deficit-reduction plan for Mitt Romney’s presidential campaign.
During 2001–11, Riedl served as the Heritage Foundation’s lead research fellow on federal budget and spending policy. In that position, he helped lay the groundwork for Congress to cap soaring federal spending, rein in farm subsidies, and ban pork-barrel earmarks. Riedl’s writing and research have been featured in, among others, the New York Times, Wall Street Journal, Washington Post, Los Angeles Times, and National Review; he is a frequent guest on NBC, CBS, PBS, CNN, FOX News, MSNBC, and C-SPAN.
Riedl holds a bachelor's degree in economics and political science from the University of Wisconsin and a master's degree in public affairs from Princeton University.
Photo: ijeab/iStock
Are you interested in supporting the Manhattan Institute’s public-interest research and journalism? As a 501(c)(3) nonprofit, donations in support of MI and its scholars’ work are fully tax-deductible as provided by law (EIN #13-2912529).