California’s Contradictions: Survey Analysis of 2026 Voter Preferences Statewide and in Los Angeles

Photo: LPETTET/E+ via Getty Images
A new survey conducted by the Manhattan Institute examines the attitudes of California likely voters one month before Election Day. The poll surveyed 1,000 likely voters statewide and a separate sample of 449 likely voters in Los Angeles, allowing for a detailed look at both the statewide electorate and the political dynamics shaping the state’s largest city.
The survey helps clarify a central question confronting California politics: Does the state’s long-running pattern of Democratic electoral success reflect an endorsement of its governing approach, or does it coexist with broader dissatisfaction about the state’s performance on its most pressing challenges?
Democrats remain well positioned electorally. Xavier Becerra holds a commanding 17-point lead over Republican Steve Hilton in the race for governor. City Councilmember Nithya Raman holds a six-point advantage over incumbent Karen Bass in the Los Angeles mayoral race, narrowing to three points with leaners included. The mayoral contest is complicated by the fact that half of Spencer Pratt’s primary supporters say they plan not to vote in the race rather than back either finalist.
But voters also express considerable frustration with the state’s performance. Only 32% of California voters believe that their state is headed in a better direction than other states, while 45% believe it is headed in a worse direction. More than four in five Californians (81%) and Angelenos (83%) say the state has a bigger homelessness problem than other states. A majority say California is less business-friendly than its peers, while pluralities rate the state negatively on infrastructure, public safety, and corruption. Concern about waste, fraud, and abuse in the welfare system is also widespread.
Both Governor Gavin Newsom and former Vice President Kamala Harris have negative net favorability ratings among voters in their home state. Notably, nearly one in four of Harris’s own 2024 voters (24%) view her unfavorably, despite her comfortable victory in the state as the Democratic nominee for president.
On a range of major policy questions, voters frequently depart from the state’s progressive reputation. Californians oppose Proposition 40, the proposed billionaire wealth tax, by a 50% to 35% margin. A majority believe that the state’s Medicaid program Medi-Cal should be limited to those with legal status. Most oppose race-conscious hiring and admissions policies, and nearly two-thirds would support limiting the power of public-sector unions if doing so would improve accountability and service delivery. On homelessness, voters overwhelmingly attribute the crisis to substance addiction and mental health issues rather than housing affordability.
Taken together, the findings suggest that Democratic electoral strength in California should not necessarily be interpreted as an endorsement of the status quo. Voters continue to prefer Democratic candidates while expressing dissatisfaction with the state’s direction and performance. On issues ranging from homelessness and public-sector unions to welfare administration, infrastructure, and taxation, voters are interested in reform and more effective governance.
Full Results Available: Statewide Toplines, Los Angeles Toplines, Crosstabs
Methodology
Between September 24 and October 1, 2026, the Manhattan Institute surveyed 1,000 likely voters in California and a separate sample of 449 likely voters in the City of Los Angeles. The sample was reached via live cell-phone interviews (300 statewide, 142 Los Angeles), SMS-to-web interviews (500 statewide, 227 Los Angeles), and online panel interviews (200 statewide, 80 Los Angeles).
In addition to self-reported voting intention, voters reached through cell and SMS were drawn from a modeled universe of likely voters from the voter file, based on their previous general election participation.
The statewide and Los Angeles samples were weighted separately to their own likely-voter targets based on gender, age, education, race and ethnicity, party registration, 2024 presidential vote, past general election turnout, and geographic region.
Results reported for Los Angeles-specific questions are based only on respondents residing within the City of Los Angeles.
The margin of error is ±3.1 percentage points for the statewide sample and ±4.6 percentage points for the separate Los Angeles sample.
The Race for California Governor
Democrat Xavier Becerra is the clear favorite in California’s gubernatorial race. He receives support from 55% of likely voters, compared with 38% for Republican Steve Hilton, while 7% remain undecided. (Figure 1)
Figure 1
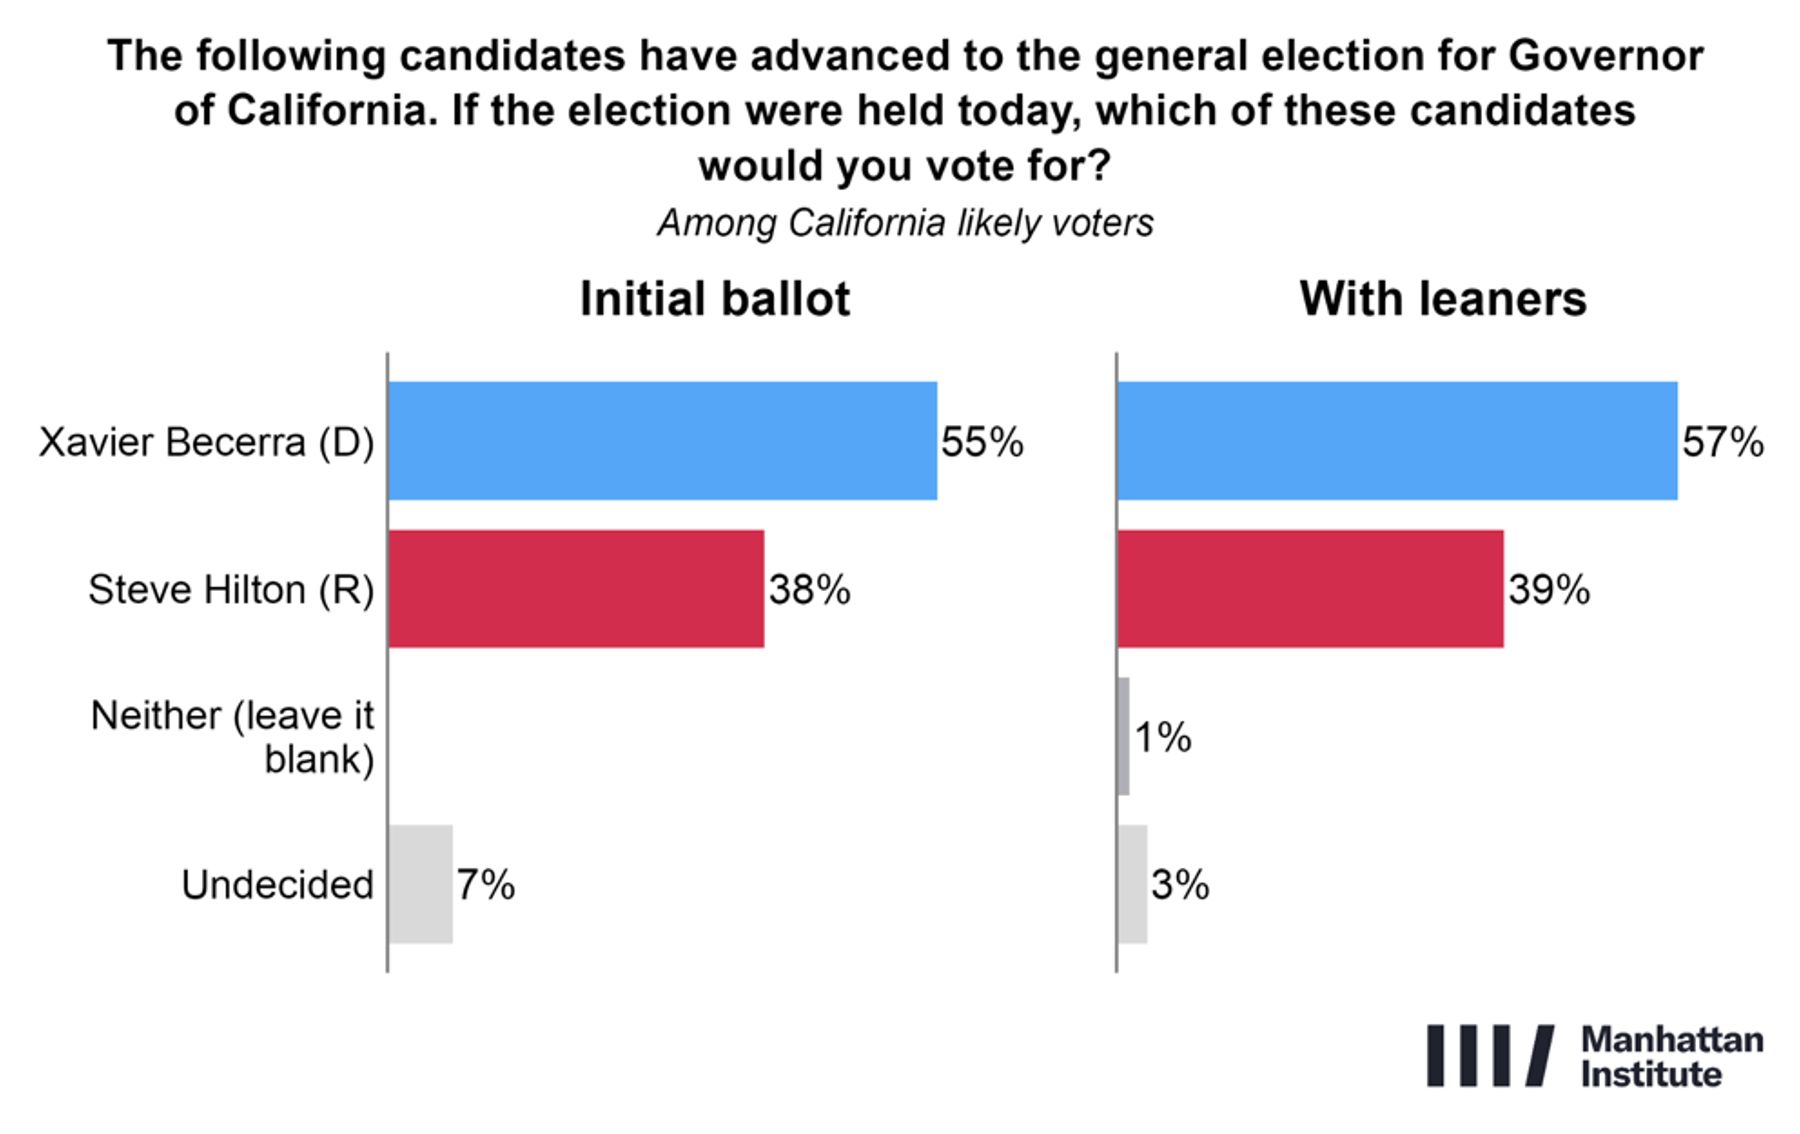
Both parties appear highly consolidated behind their nominees. Becerra has the support of 93% of Democrats, while Hilton receives backing from 96% of Republicans. Among independents and other unaffiliated voters, Becerra holds a meaningful advantage, leading Hilton 48% to 39%.
Becerra’s coalition is especially strong among younger voters (65% Becerra, 30% Hilton), women (59% to 33%), black voters (72% to 22%), and college-educated Californians (63% to 31%). Hilton performs best among men (43% support), non-college voters (43%), and independents and other unaffiliated voters (39%), though he still trails Becerra among each of those groups.
The race is unlikely to change significantly. After the 7% of undecided respondents were pressed to make a choice, Becerra’s lead shifts modestly to 57% (+2) compared to Hilton’s 39% (+1), leaving just 3% of voters truly undecided. (Figure 1) With so few voters still undecided, the electorate appears firmly settled behind the Democratic nominee.
The Race for Los Angeles Mayor
The Los Angeles mayoral race remains competitive, though Nithya Raman currently holds a modest advantage. Raman receives support from 38% of likely voters, compared with 32% for incumbent Mayor Karen Bass, with 30% remaining undecided. (Figure 2) The topline appears to reflect the weakness of the incumbent as much as enthusiasm for the challenger. Bass is viewed favorably by just 33% of Los Angeles voters and unfavorably by 61%.
Figure 2
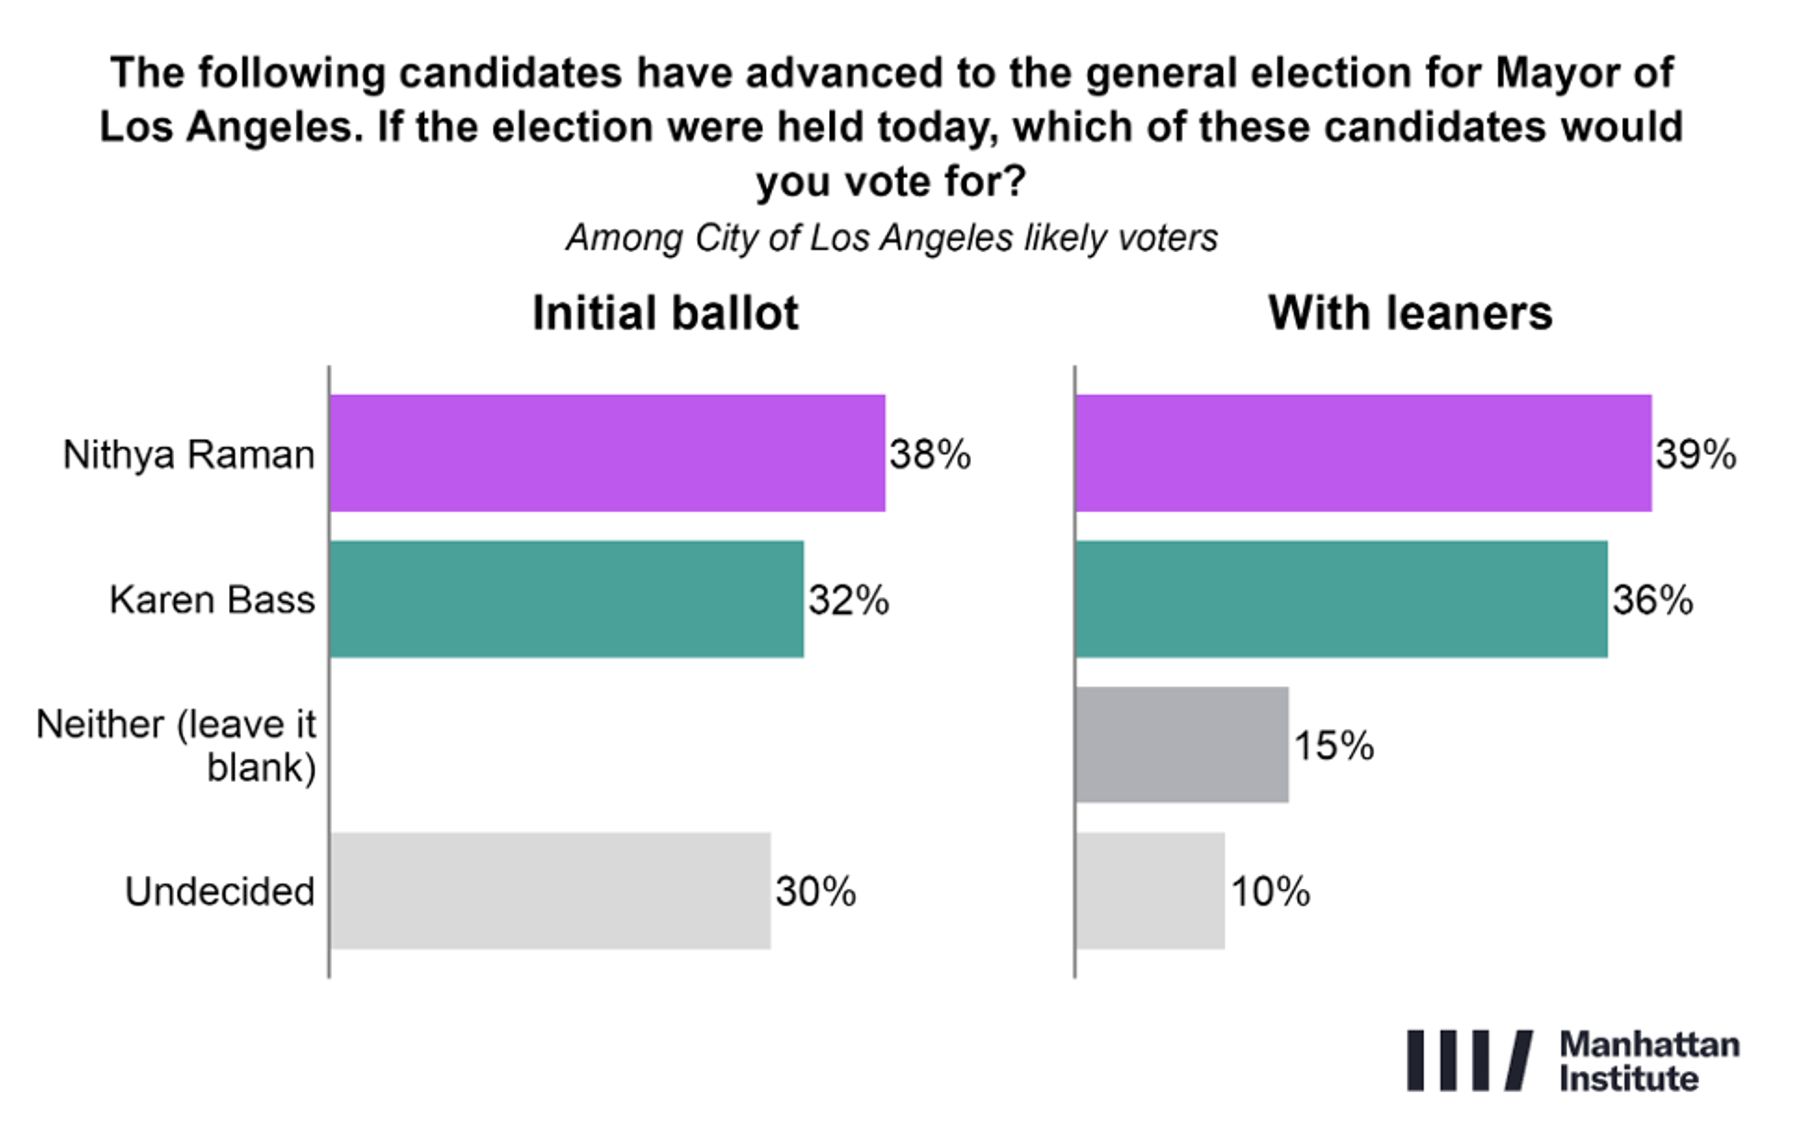
Raman performs particularly well among younger voters (51% support among voters 18–29 and 49% among voters 30–49), college-educated voters (43%), Asian voters (42%) and women (40%). Bass’s strongest support comes from older voters (42% among those 50–64 and 36% among those 65-and-up), and black voters (48%).
Despite Raman's lead, the race remains unsettled. Nearly one-third of voters reported as undecided in the initial ballot test, but after those respondents were pressed to make a choice, Raman’s advantage narrowed to 39% to 36%, while 15% of voters said they actively plan to leave the mayoral race blank, and another 10% remained truly undecided (Figure 2).
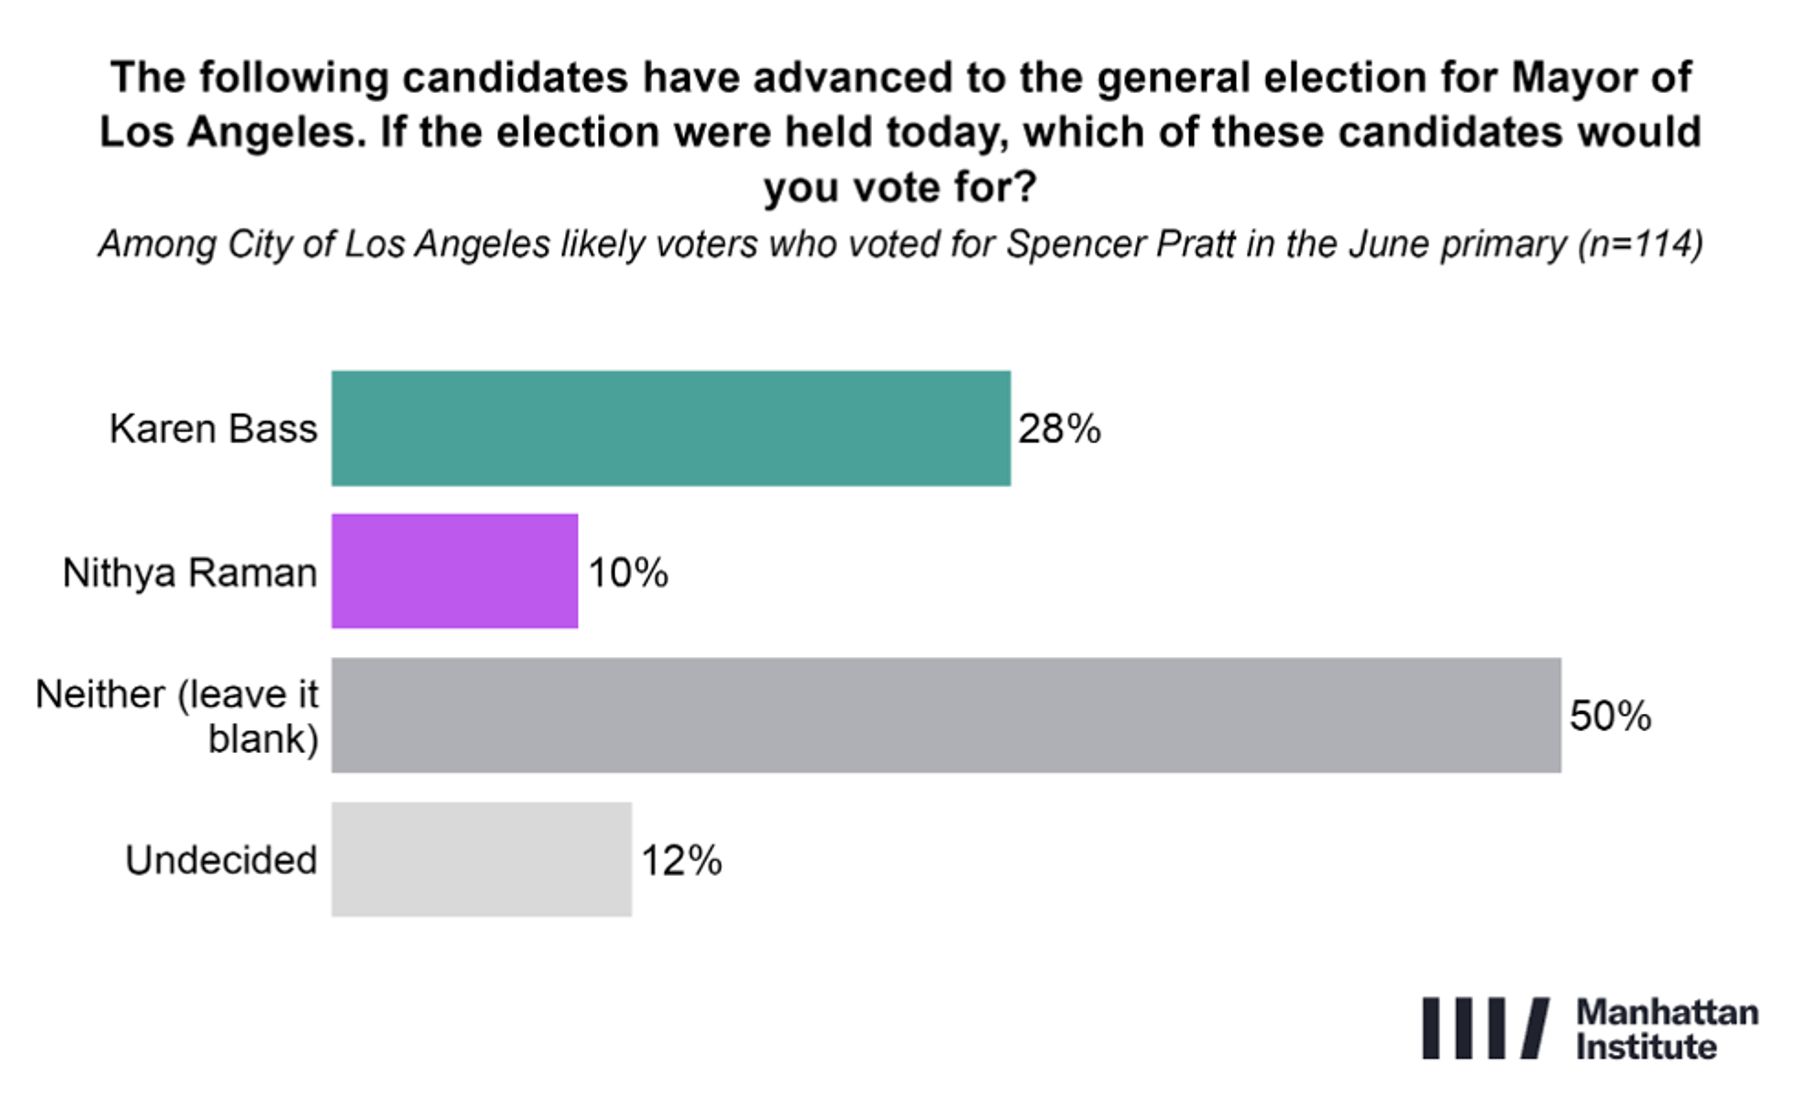
Much of that disengagement is concentrated among supporters of Spencer Pratt, who finished third in the June primary, leaving a sizable bloc of voters now reluctant to back either finalist. 50% of Pratt voters say that they intend to support neither Bass nor Raman, while 28% move to Bass and 10% to Raman (Figure 3).
Figure 3
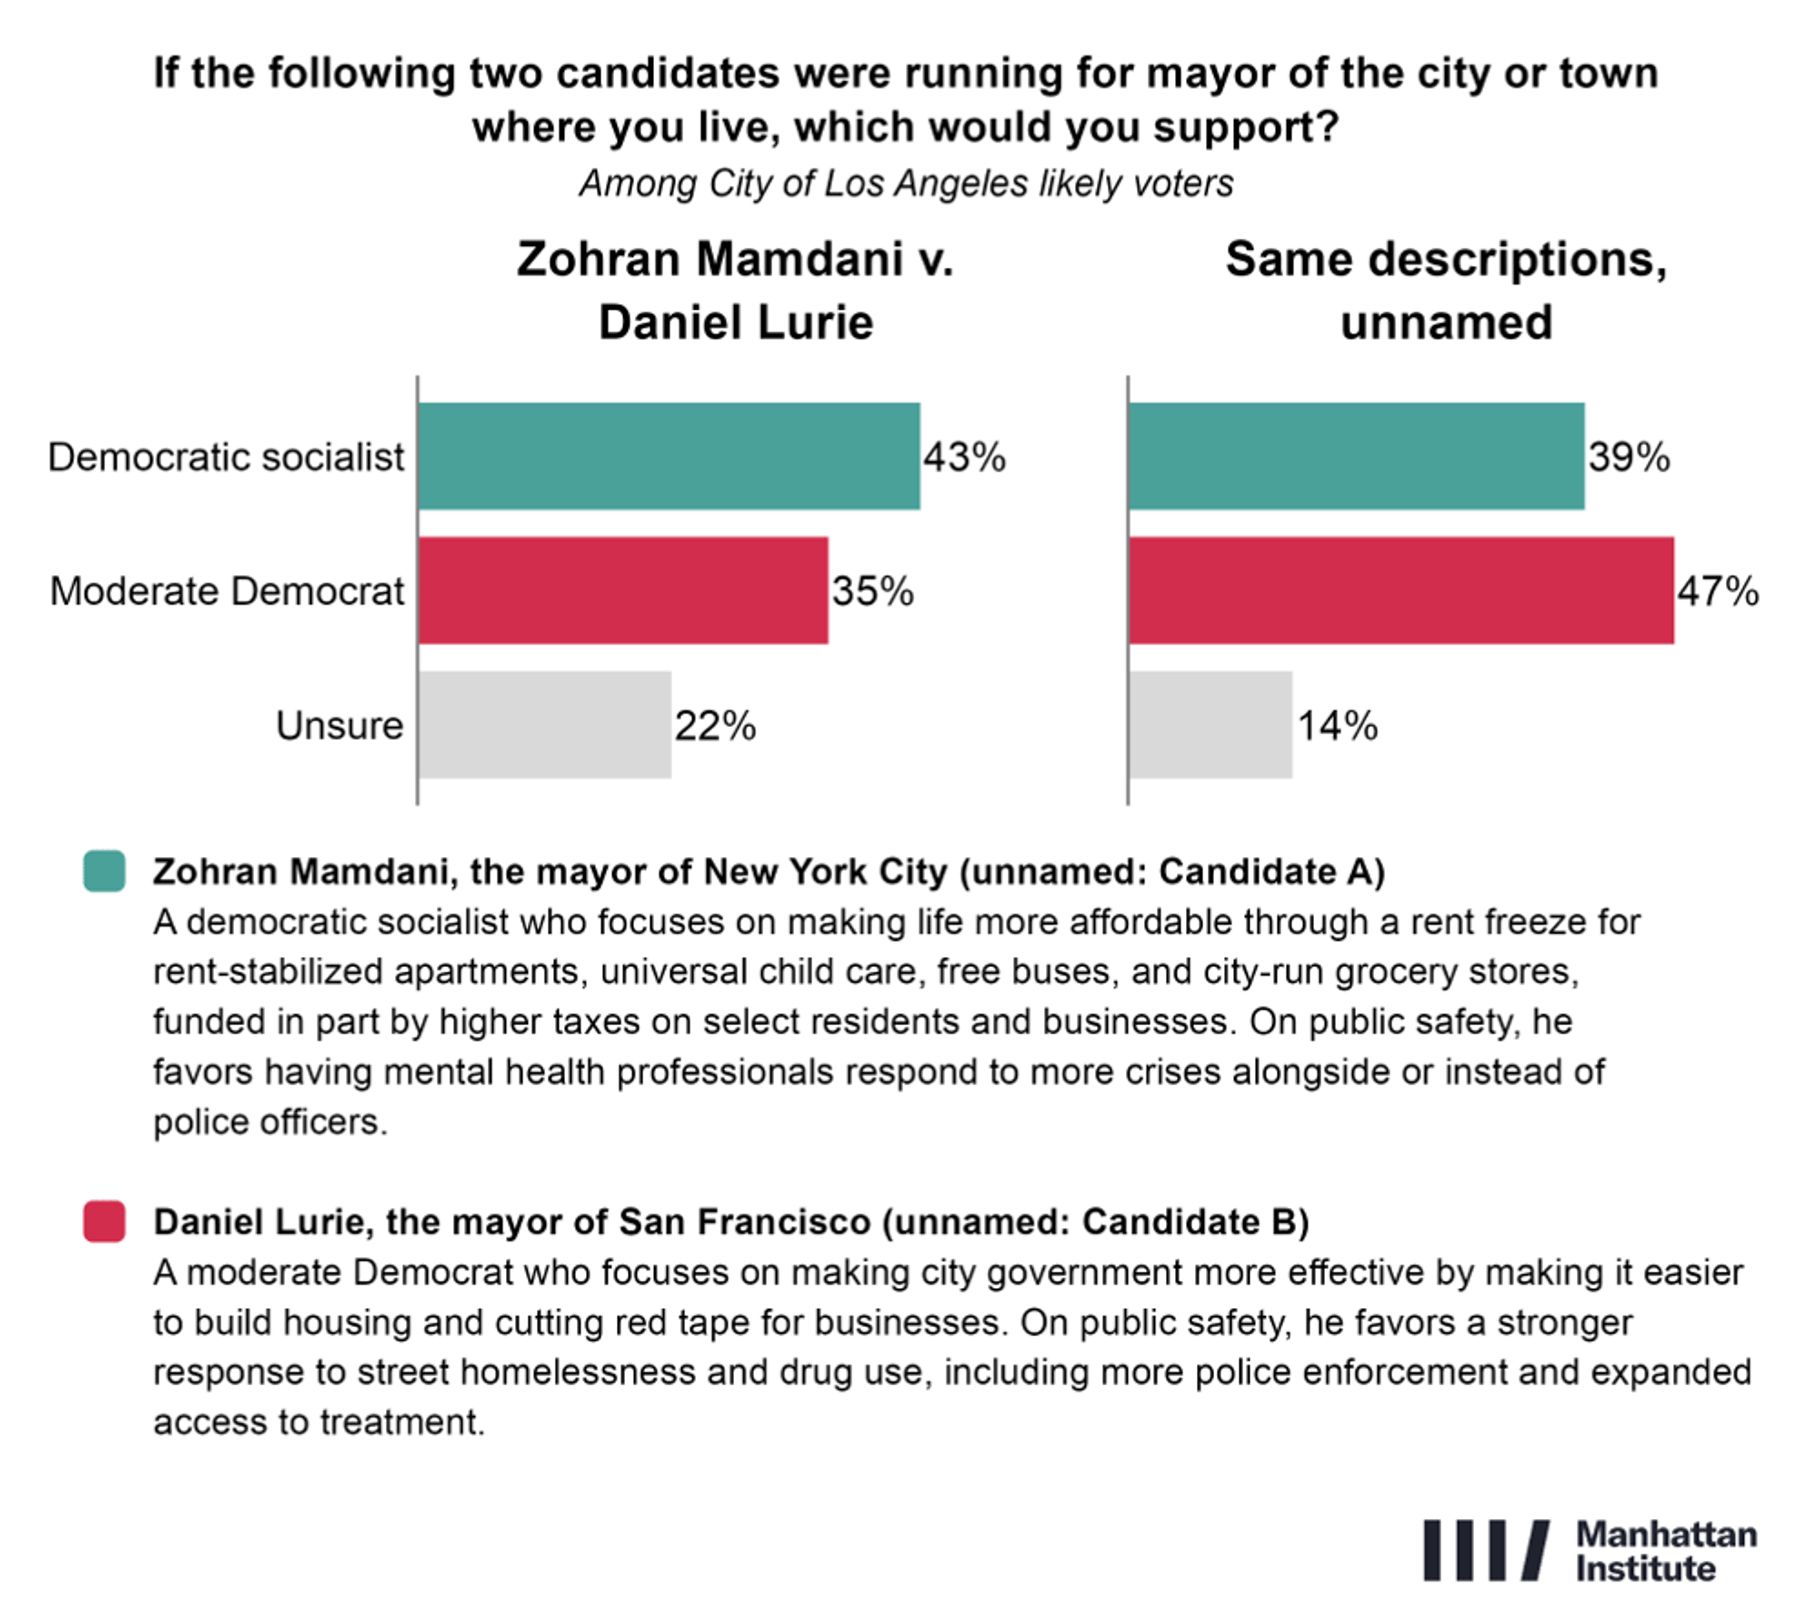
The survey also tested whether Los Angeles voters prefer a democratic socialist or a moderate Democrat as a hypothetical mayor. Respondents were randomly divided into two groups and shown the same policy descriptions. In one group, those policies were ascribed to an unnamed moderate and democratic socialist; in the other, they were ascribed to New York City Mayor Zohran Mamdani and San Francisco Mayor Daniel Lurie. In the unnamed test, voters preferred the moderate Democrat by an eight-point margin (47% to 39%). With the names and offices included, voters preferred Mamdani by a 43% to 35% margin (Figure 4). The contrast suggests that candidate identity can affect responses to the same policy platforms, complicating any interpretation of a Raman victory as a mandate for democratic socialism.
Figure 4
Proposition 40: A Wealth Tax on Billionaires
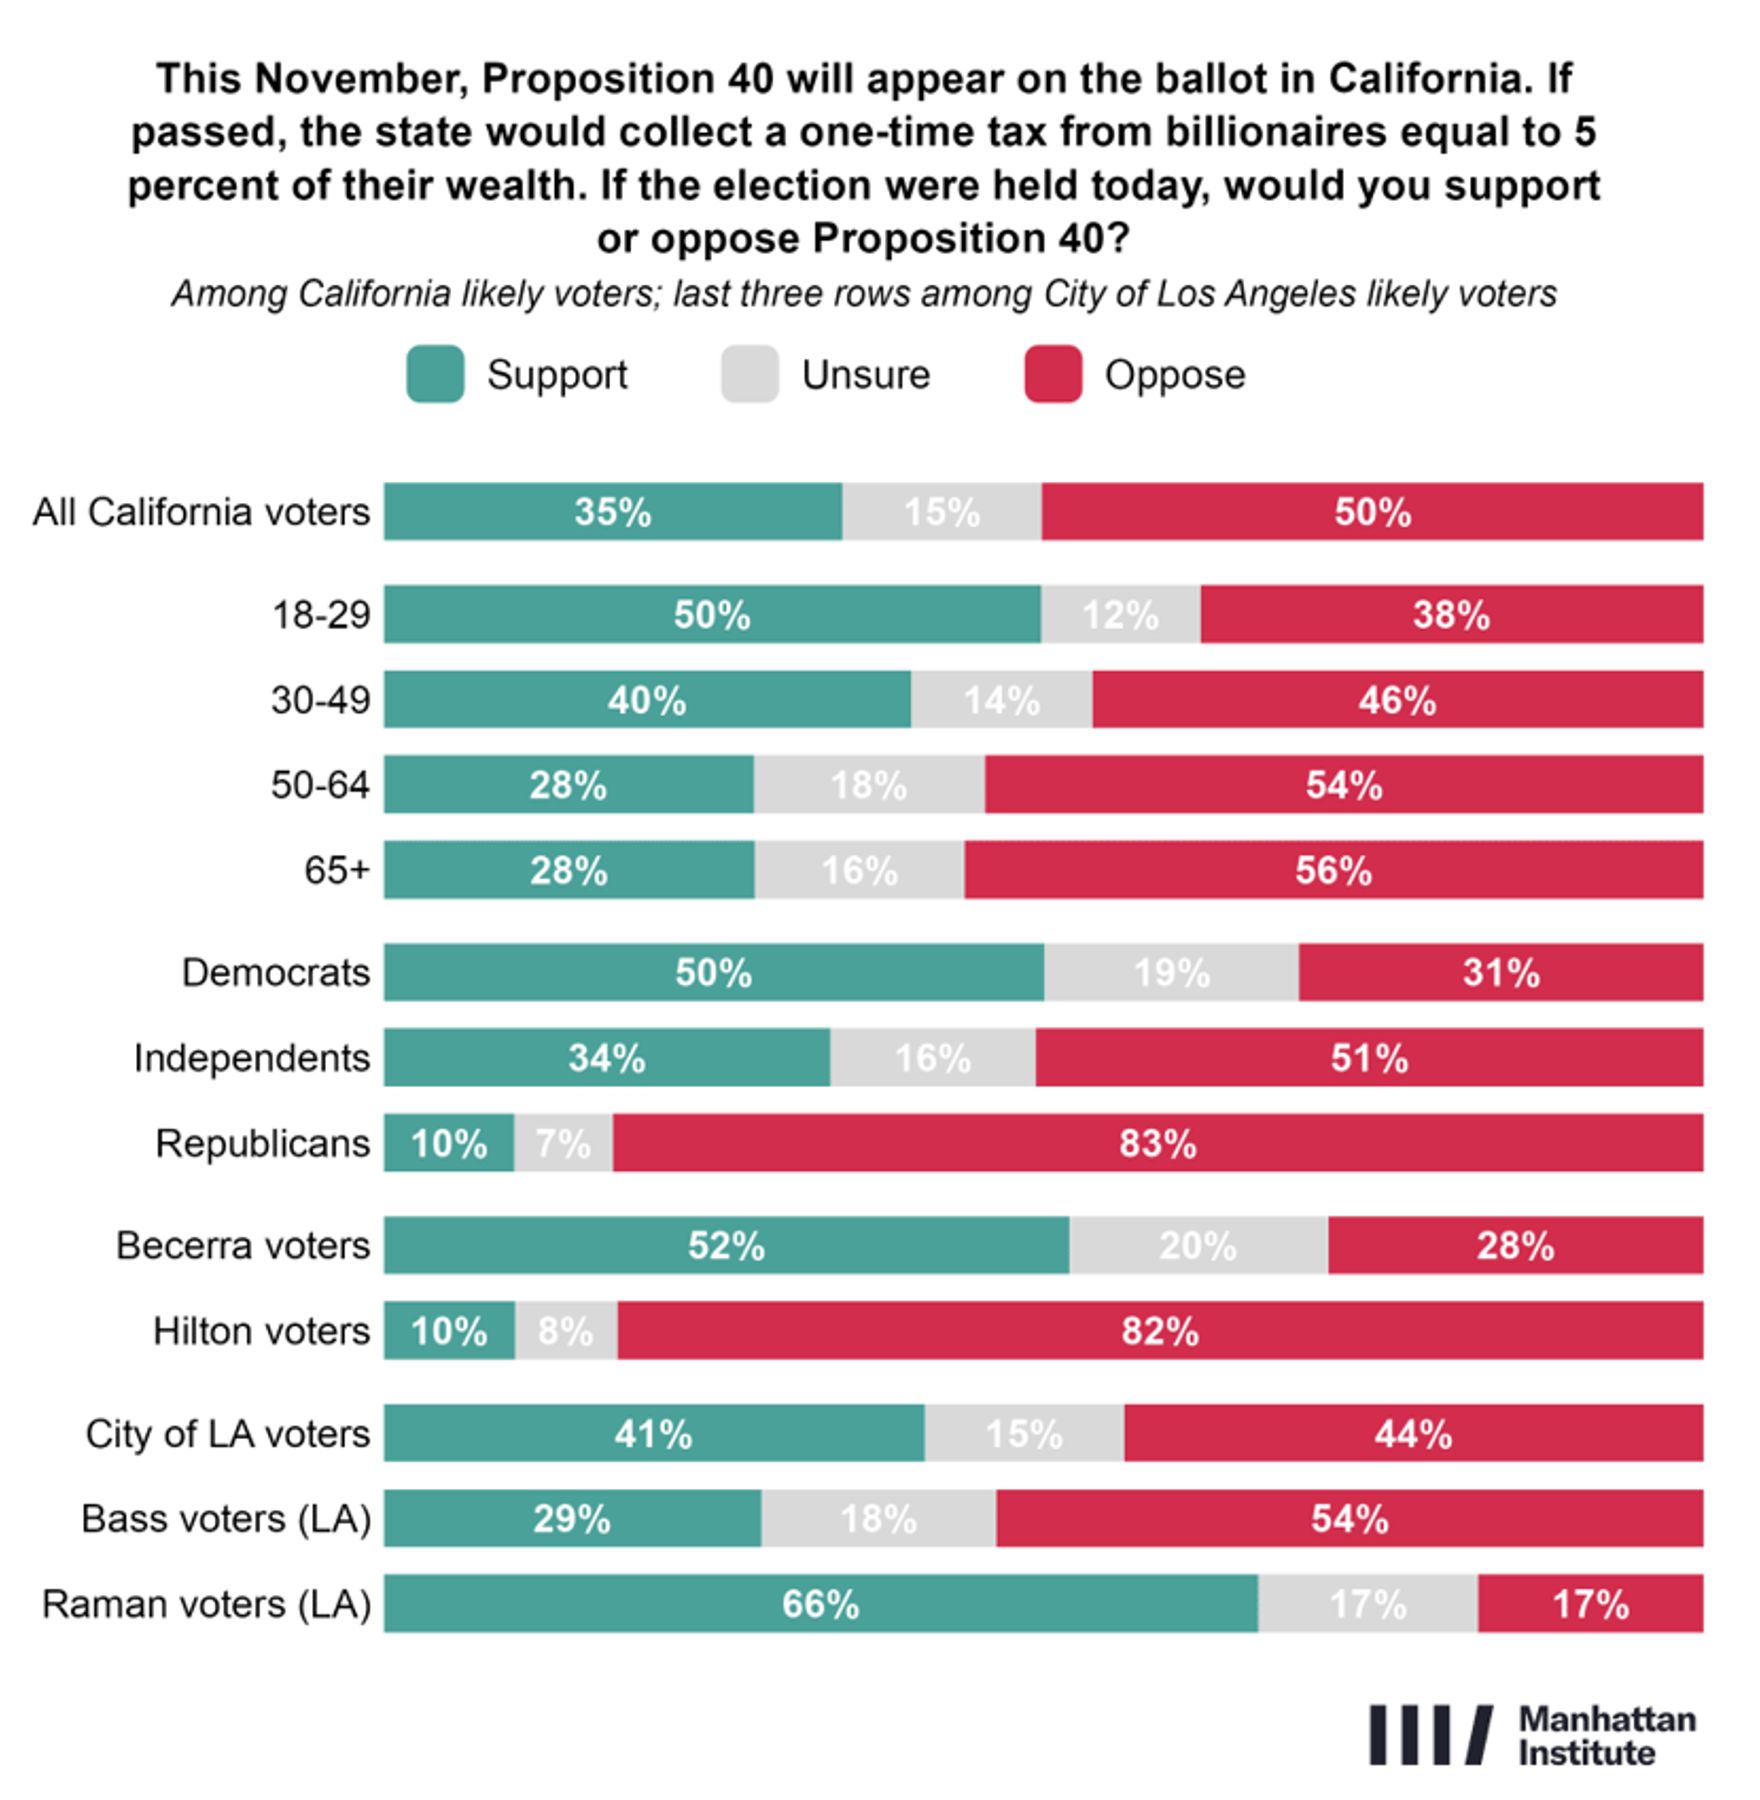
This November, Californians will vote on Proposition 40, which would impose a one-time 5% tax on the wealth of the state’s billionaires. Voters oppose the measure by a 50% to 35% margin, with 15% undecided (Figure 5).
The clearest demographic divide is generational: voters aged 18 to 29 support the measure at substantially higher rates (50%) than voters aged 50 to 64 (28%) and those 65 and older (28%).
The partisan divide is equally pronounced. Republicans oppose Proposition 40 overwhelmingly (83% to 10%), while independents and other unaffiliated voters oppose it by a 51% to 34% margin. Democrats support the proposal, but far from unanimously, with 50% to 31% in favor and nearly one in five undecided.
Among gubernatorial voters, Becerra supporters back the measure (52% support, 28% oppose), while Hilton supporters overwhelmingly oppose it (82% oppose, 10% support). Among Los Angeles voters, Raman supporters strongly back the measure (66% support, 17% oppose), while Bass supporters oppose it (54% oppose, 29% support).
Figure 5
Favorability Ratings
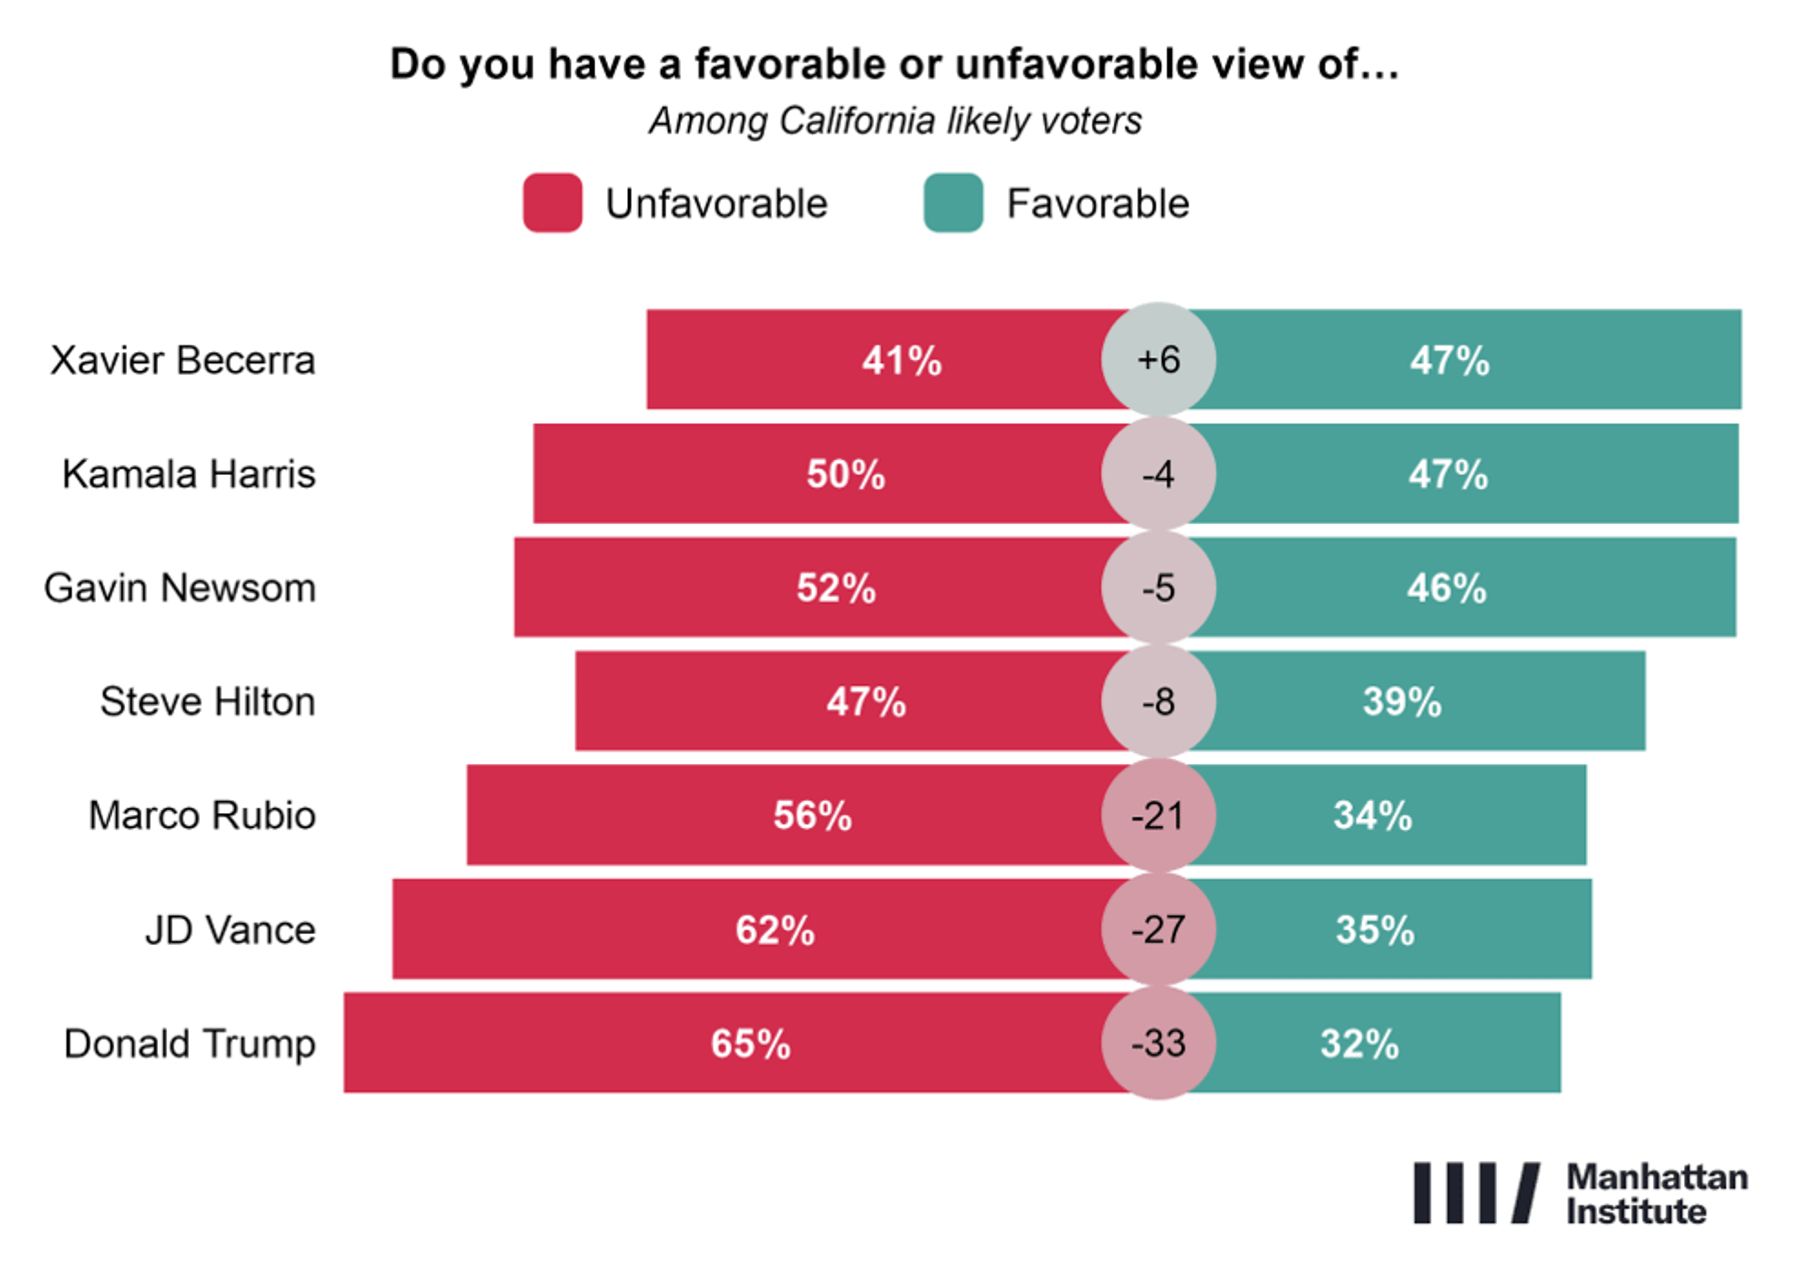
Two of California’s most prominent Democrats carry negative net favorability ratings with voters. Governor Gavin Newsom is viewed favorably by 46% of likely California voters and unfavorably by 52%, while Kamala Harris is viewed favorably by 47% and unfavorably by 50%. The Democratic nominee for governor, Xavier Becerra, performs somewhat better, at 47% favorable and 41% unfavorable. (Figure 6)
Newsom and Harris are especially unpopular among men and Asian voters. Men view Newsom unfavorably by a 57% to 41% margin and Harris unfavorably by a 56% to 40% margin. Among Asian voters, Newsom’s unfavorable and favorable ratings are 56% and 39%, respectively, while Harris’s are 58% and 36%. Independents and other unaffiliated voters also view both politicians negatively: 60% view Newsom unfavorably, compared with 37% favorably, while Harris’s ratings are 58% unfavorable and 36% favorable.
Becerra’s standing is somewhat stronger, though he is also less well known. 12% of voters say they have no opinion of Becerra, compared with only 2% for Newsom and 3% for Harris.
Steve Hilton is also less well known than several national figures tested. He receives a 39% favorable rating and a 47% unfavorable rating, with 14% unsure. Although his ratings are net negative, they are stronger than those of Donald Trump (32% favorable to 65% unfavorable), JD Vance (35% to 62%), and Marco Rubio (34% to 56%) (Figure 6).
Figure 6
California’s Direction
Californians are more pessimistic than optimistic about their state’s trajectory. 32% believe that California is headed in a better direction than other states, while 45% believe it is headed in a worse direction. 18% say California is headed in roughly the same direction as other states. Los Angeles voters mirror the broader statewide mood, rating California’s direction negatively by a 42% to 30% margin. (Figure 7)
Figure 7
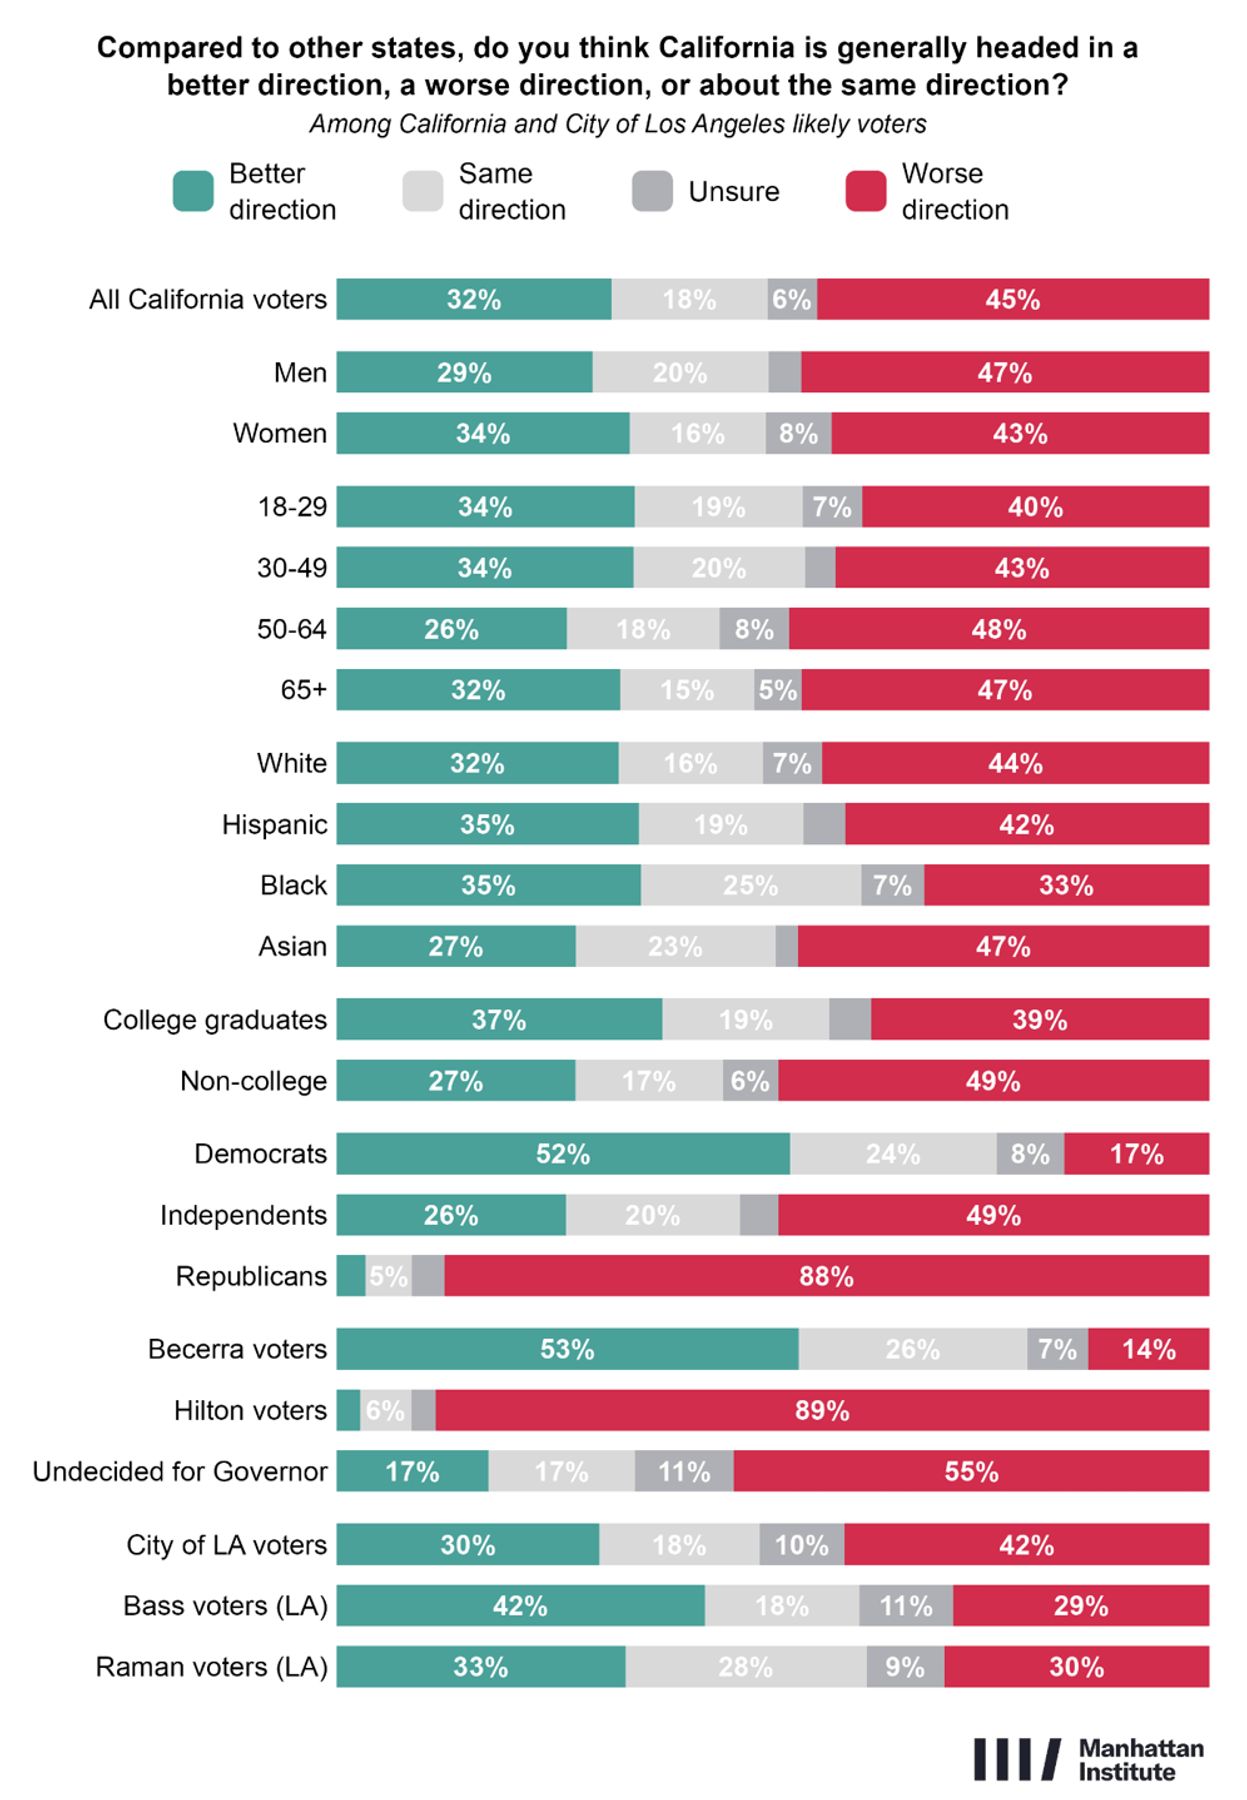
Views of California’s direction differ sharply by both party and race. Among Democrats, better direction leads by a 35-point margin (52% better to 17% worse). Independents and other unaffiliated voters say worse direction by a 23-point margin (26% better to 49% worse) and Republicans by an 84-point margin (3% to 88%).[2] Black voters are the most optimistic racial group, with 35% saying California is headed in a better direction than other states and 33% saying it is headed in a worse direction. White voters are net 12 points negative, Hispanics net 7 points negative, and Asian voters net 20 points negative.
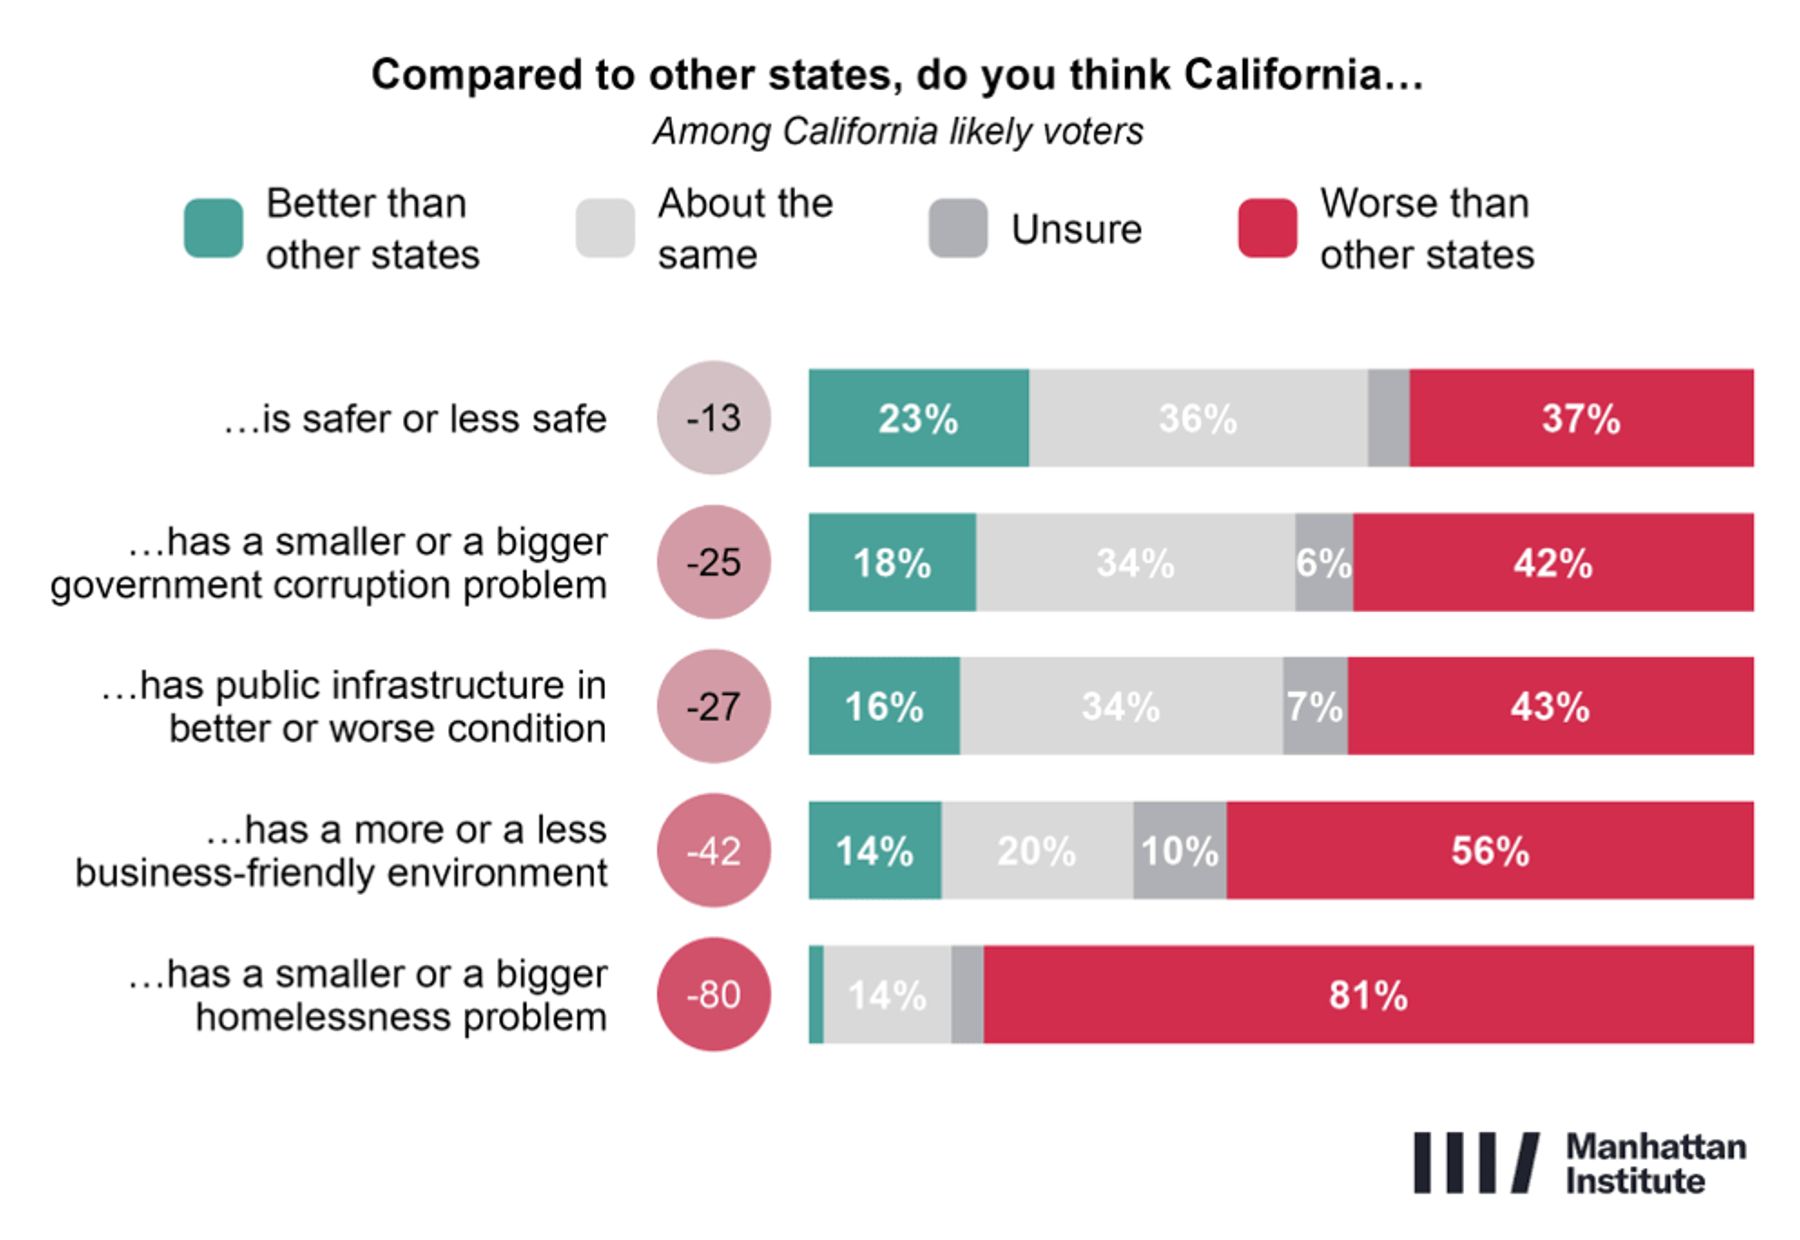
Voters also express skepticism on more particular issue areas. A majority of voters (56%) say California is less business-friendly than other states, compared with just 14% who say it is more business-friendly.
On several major quality-of-life measures, voters consistently rate California poorly relative to other states. More voters say California is less safe than other states (37%) than safer (23%), with 36% saying it is as safe as other states. 81% say California has a bigger homelessness problem than other states. More voters describe the state’s infrastructure as worse than that of other states (43%) than better (16%). A 42% plurality believe that California has a larger corruption problem than its peers. (Figure 8) Taken together, these results paint a picture of an electorate that is broadly dissatisfied with the condition and trajectory of the state.
Figure 8
What Matters Most to California Voters
For California voters, the dominant issue is the cost of living. Nearly half (47%) identify cost of living, taxes, and jobs as the most important issue facing the state, far outpacing government waste and corruption (17%), healthcare costs and access (7%), homelessness (6%), immigration (6%), and crime and public safety (4%). (Figure 9) Across virtually every major demographic and political group, pocketbook concerns rank first.
Figure 9
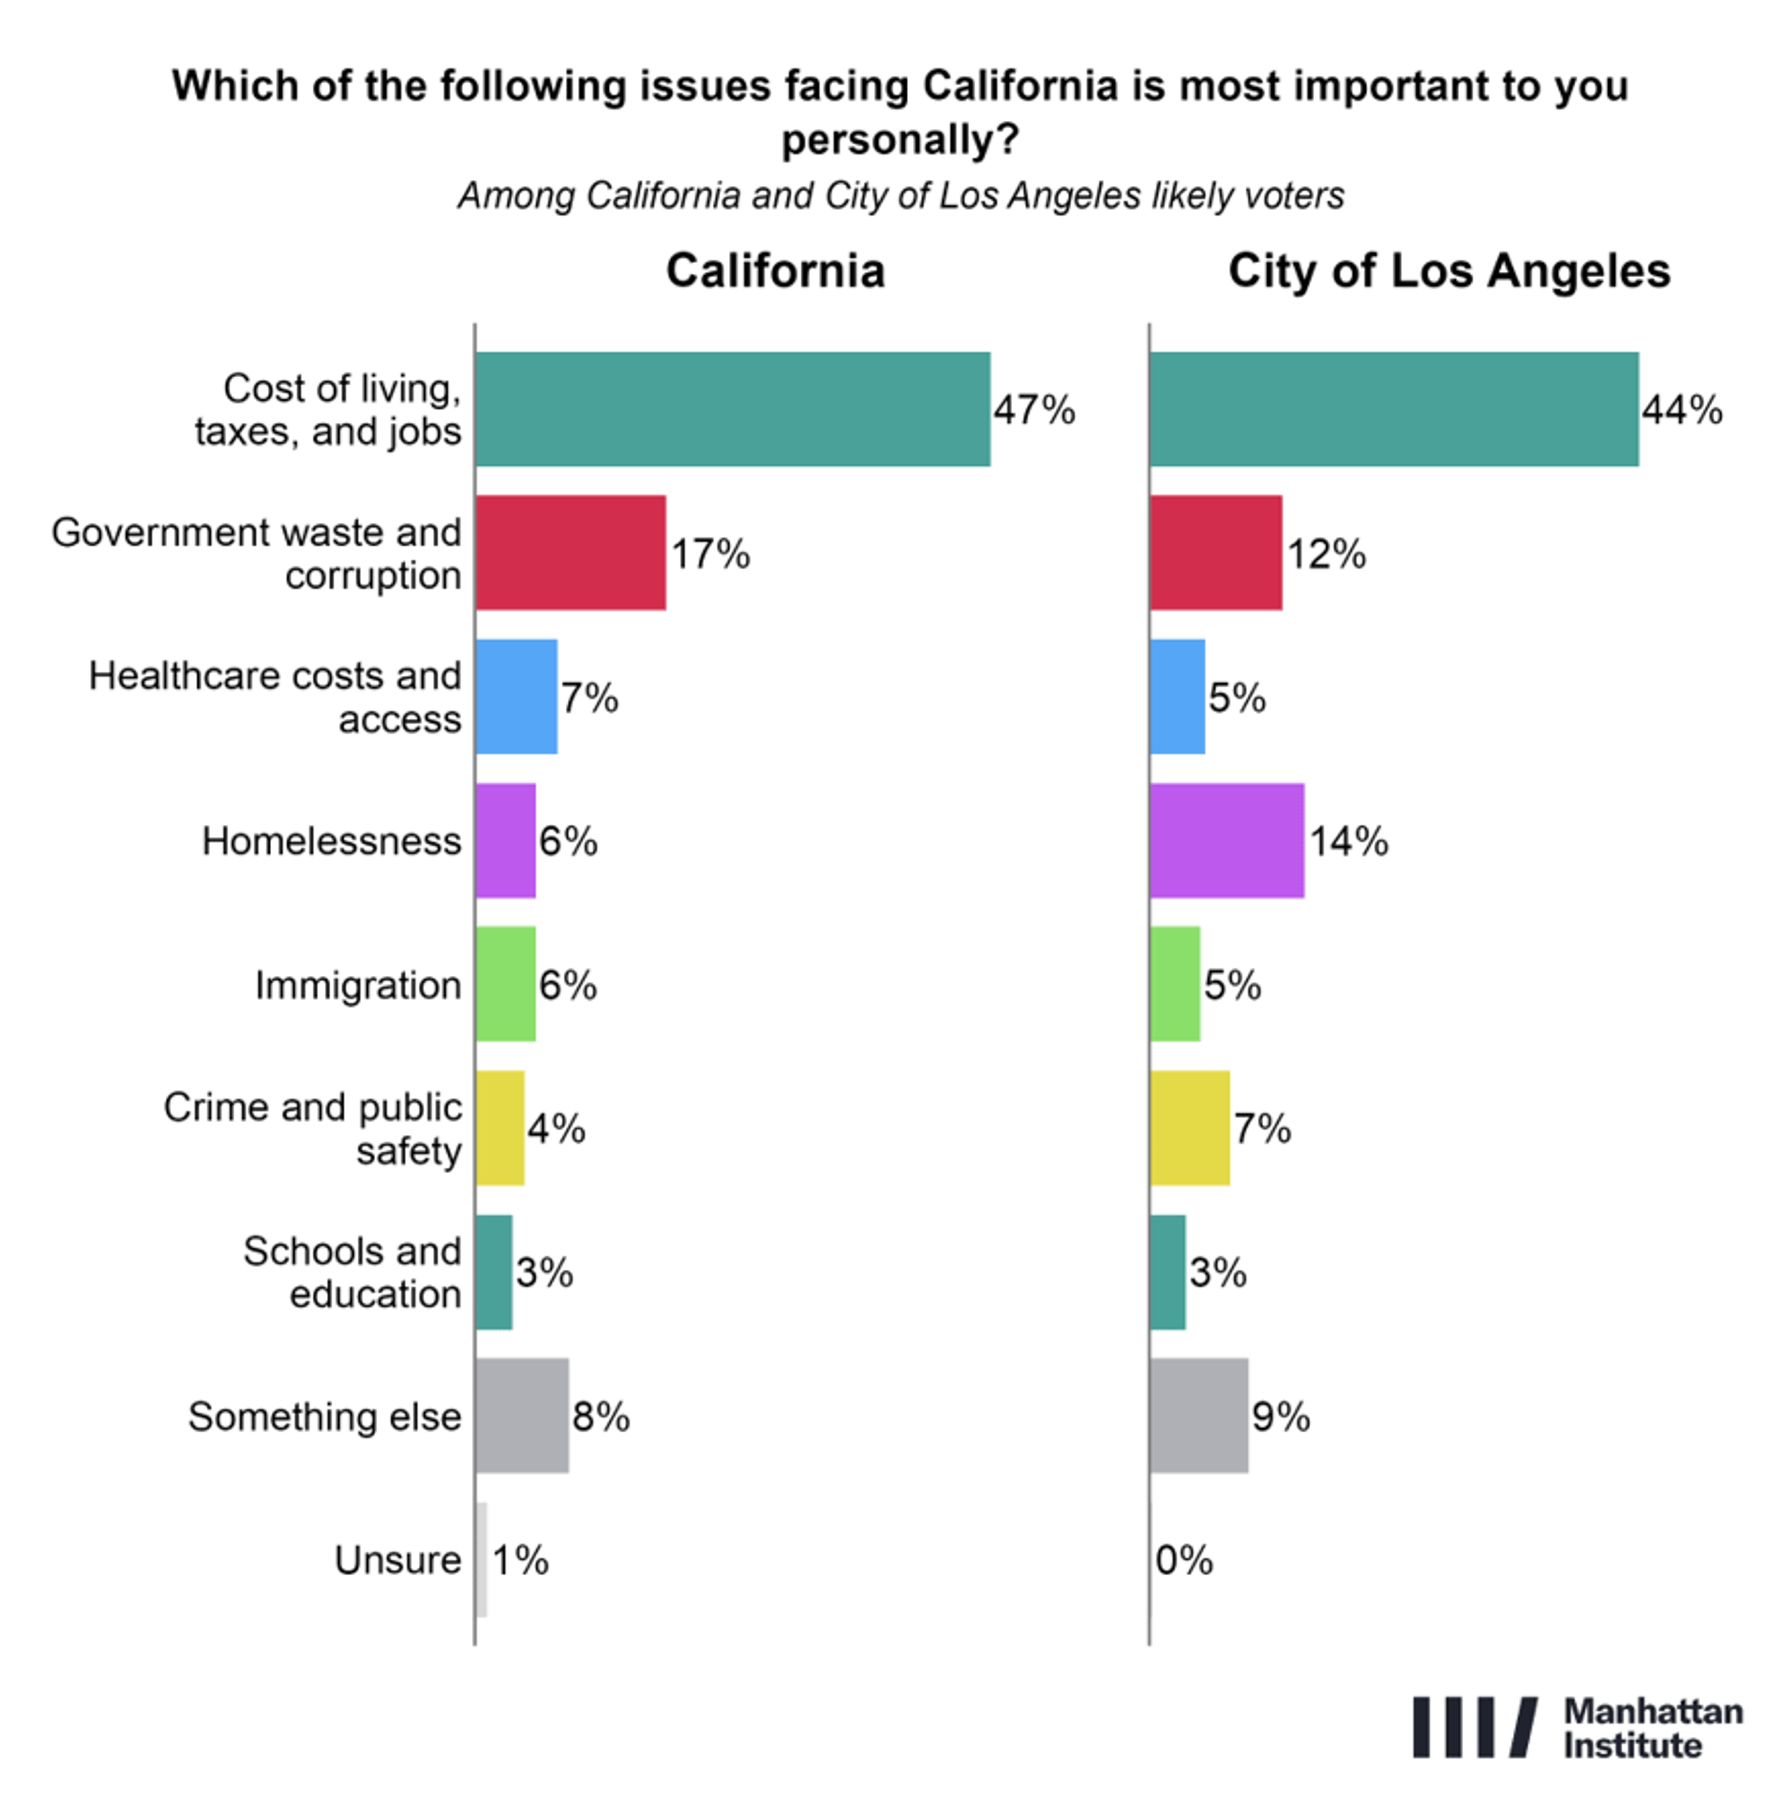
Government waste and corruption ranks as the second-most important issue, selected by 17% of voters overall, 22% of independents, and 29% of Republicans. Concern spans generations: 20% of voters aged 18–29 and 18% of those 65 and older identify it as their most important issue.
Healthcare costs and access—selected as most important by only 7% of voters—is particularly salient among Democrats (11%), black voters (11%), and seniors (9%). Immigration is a higher priority among Hispanic (8%) and Asian (8%) voters than white (4%) or black (1%) voters. Crime and public safety attract greater attention among Asian voters (7%).
Homelessness
Homelessness remains one of the state’s defining challenges for California voters. More than four in five Californians (81%) believe that homelessness is a bigger problem in their state than elsewhere, a figure that rises to 83% in Los Angeles. Voters overwhelmingly reject the view that housing costs is a primary driver of homelessness. By a 60% to 29% margin statewide, Californians say homelessness is mainly driven by substance addiction and mental health issues, rather than housing affordability. (Figure 10)
Figure 10
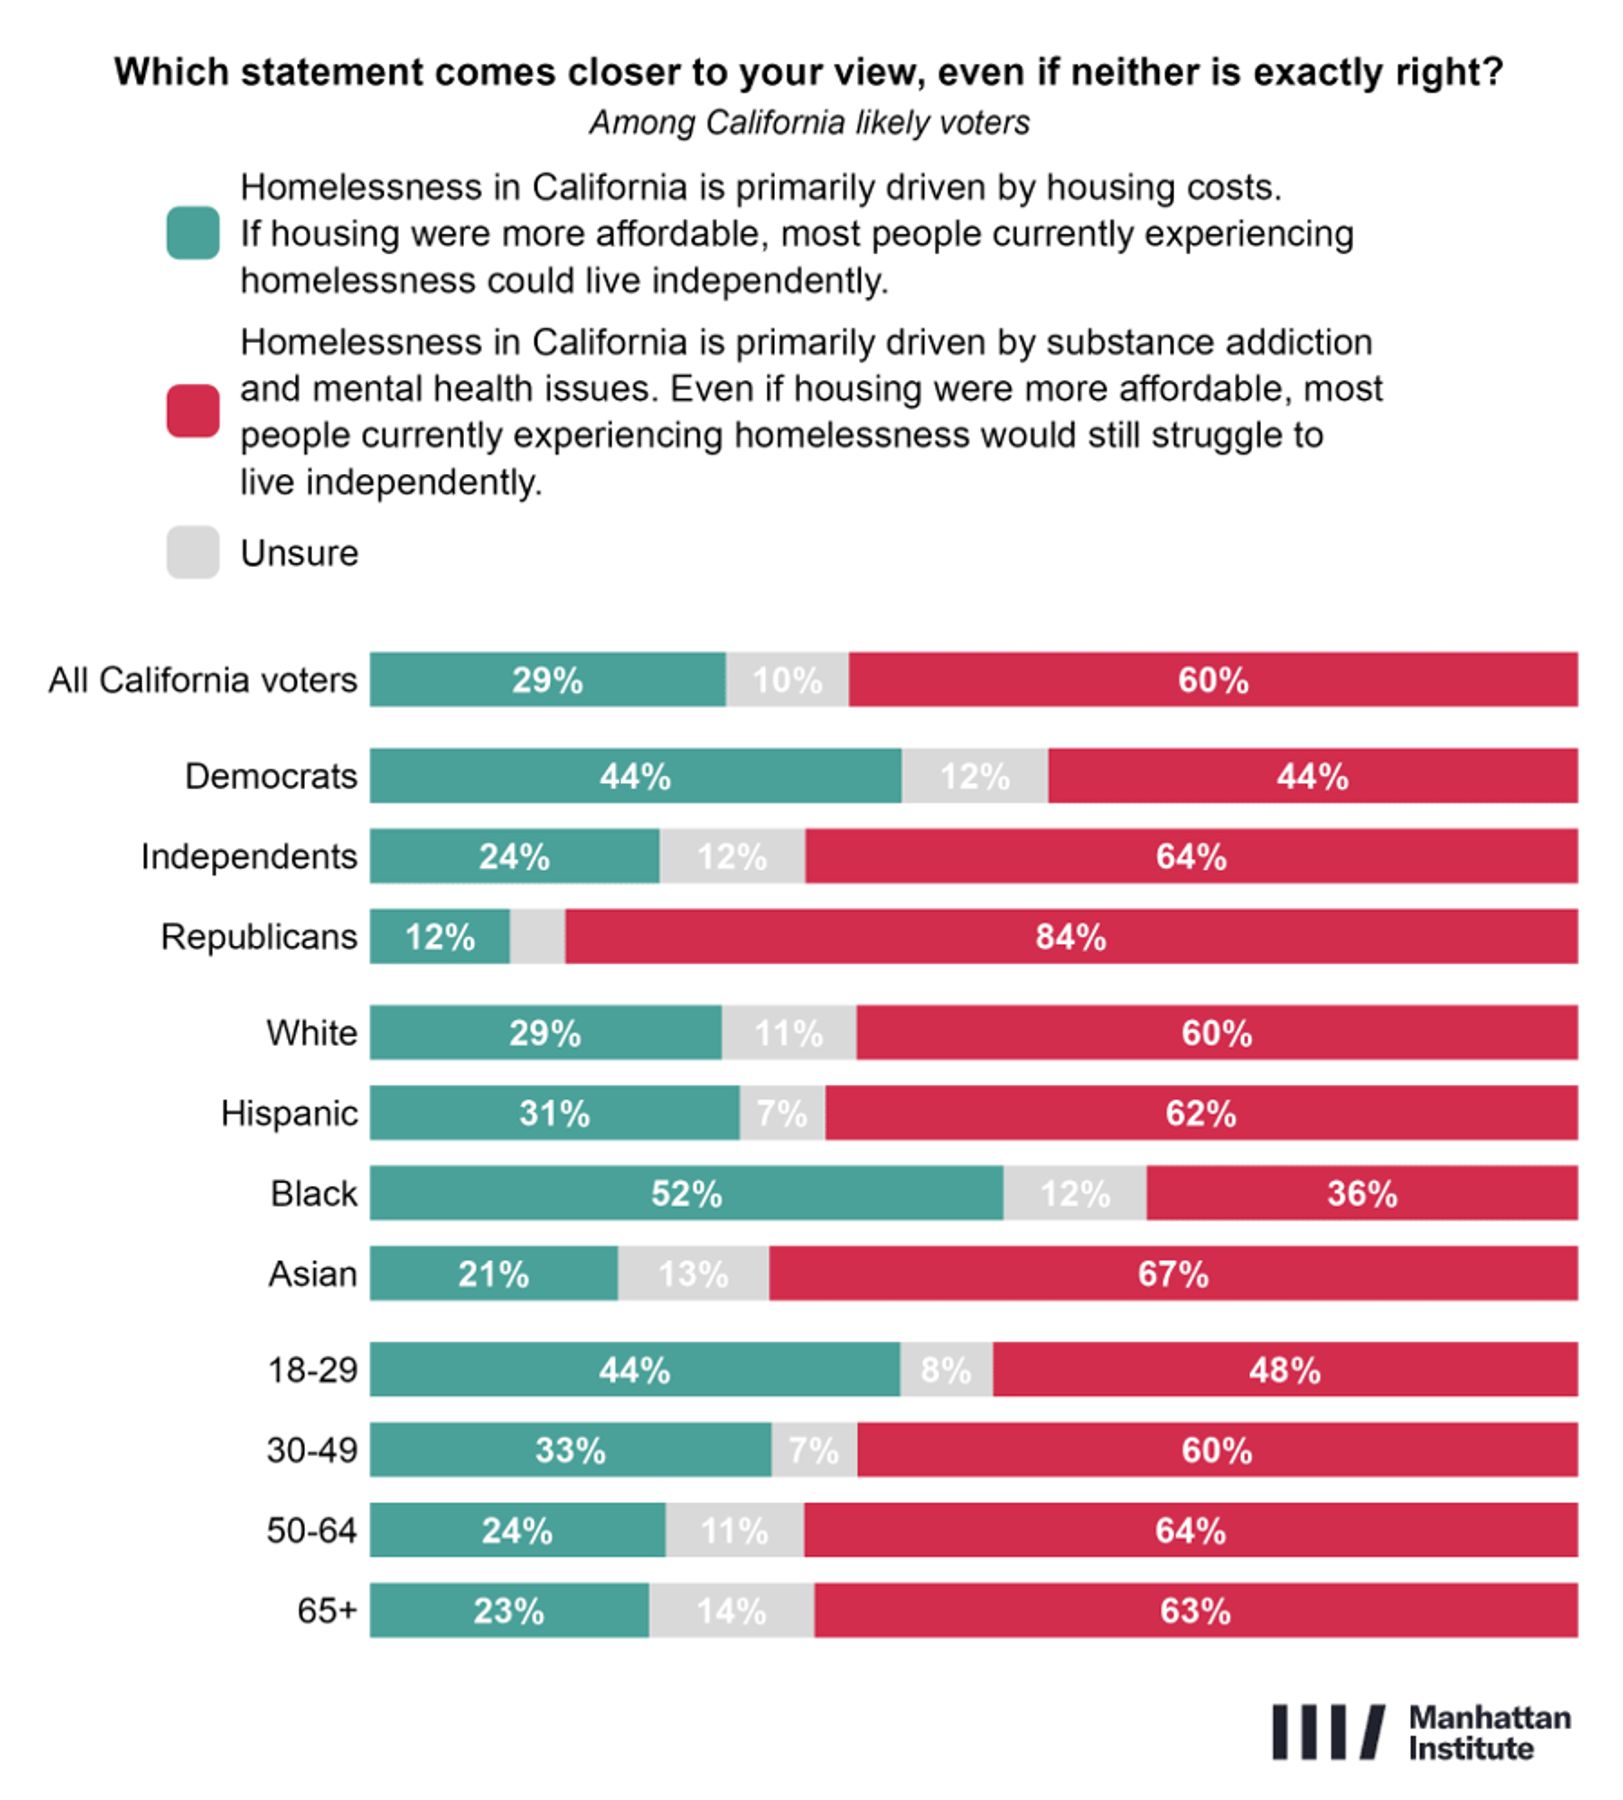
Los Angeles voters reach the same conclusion. Angelenos attribute homelessness to substance addiction and mental health issues, rather than affordability, by a 61% to 30% margin. Even among Raman supporters, a majority (53%) identify addiction and mental illness as primary causes, compared with 40% who point to housing affordability. Among voters backing neither Bass nor Raman, fully 77% identify substance addiction and mental health issues as the chief drivers of homelessness.
Californians are also united on what constitutes a compassionate response to homelessness. By a 62% to 20% margin, voters agree that providing treatment to homeless individuals suffering from substance addiction—even without their consent—is more compassionate than leaving them on the streets. That position receives majority support across virtually every demographic and political group, including Democrats (56%), younger voters (59%), black voters (53%), Becerra supporters (53%), and Raman supporters (60%) (Figure 11).
Figure 11
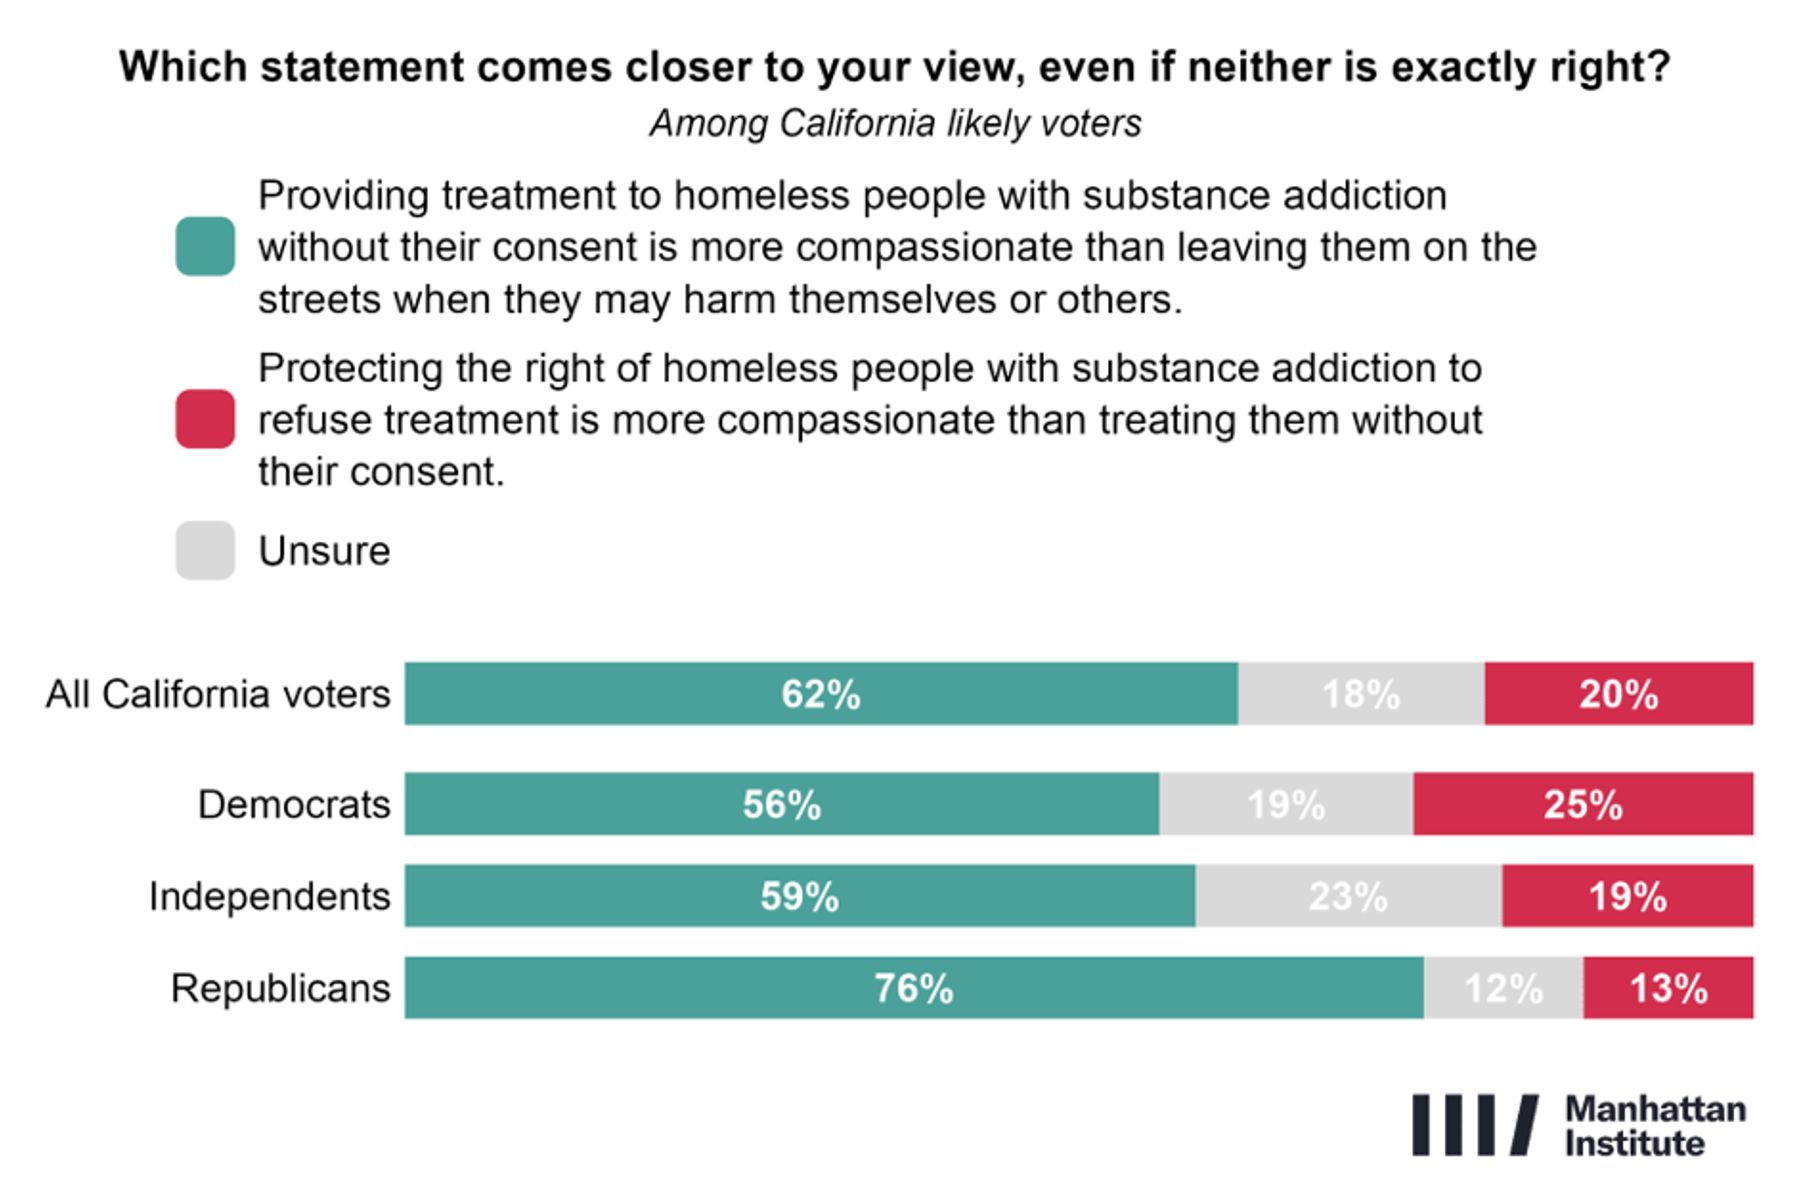
Support for treatment without consent is similarly strong in Los Angeles, where 66% say it is the more compassionate option. Homelessness also ranks higher among Angelenos’ priorities: 14% identify it as the state’s most important issue, compared with 6% of Californians overall.
These findings suggest broad support for a response to homelessness that places greater emphasis on addiction, mental illness, and treatment.
Organized Labor and Public Sector Unions
Californians hold generally favorable views of unions in the abstract. Nearly half (46%) say unions benefit workers in both the private and public sectors, while only 22% believe that unions generally do more harm than good. Democrats are particularly supportive, with roughly two-thirds expressing a broadly positive view of unions.
Voters are less favorable when asked specifically about public-sector unions and their role in government. Nearly half of Californians (48%) believe that public-sector unions have too much influence over elections and government decision-making, compared with just 14% who say they have too little influence.
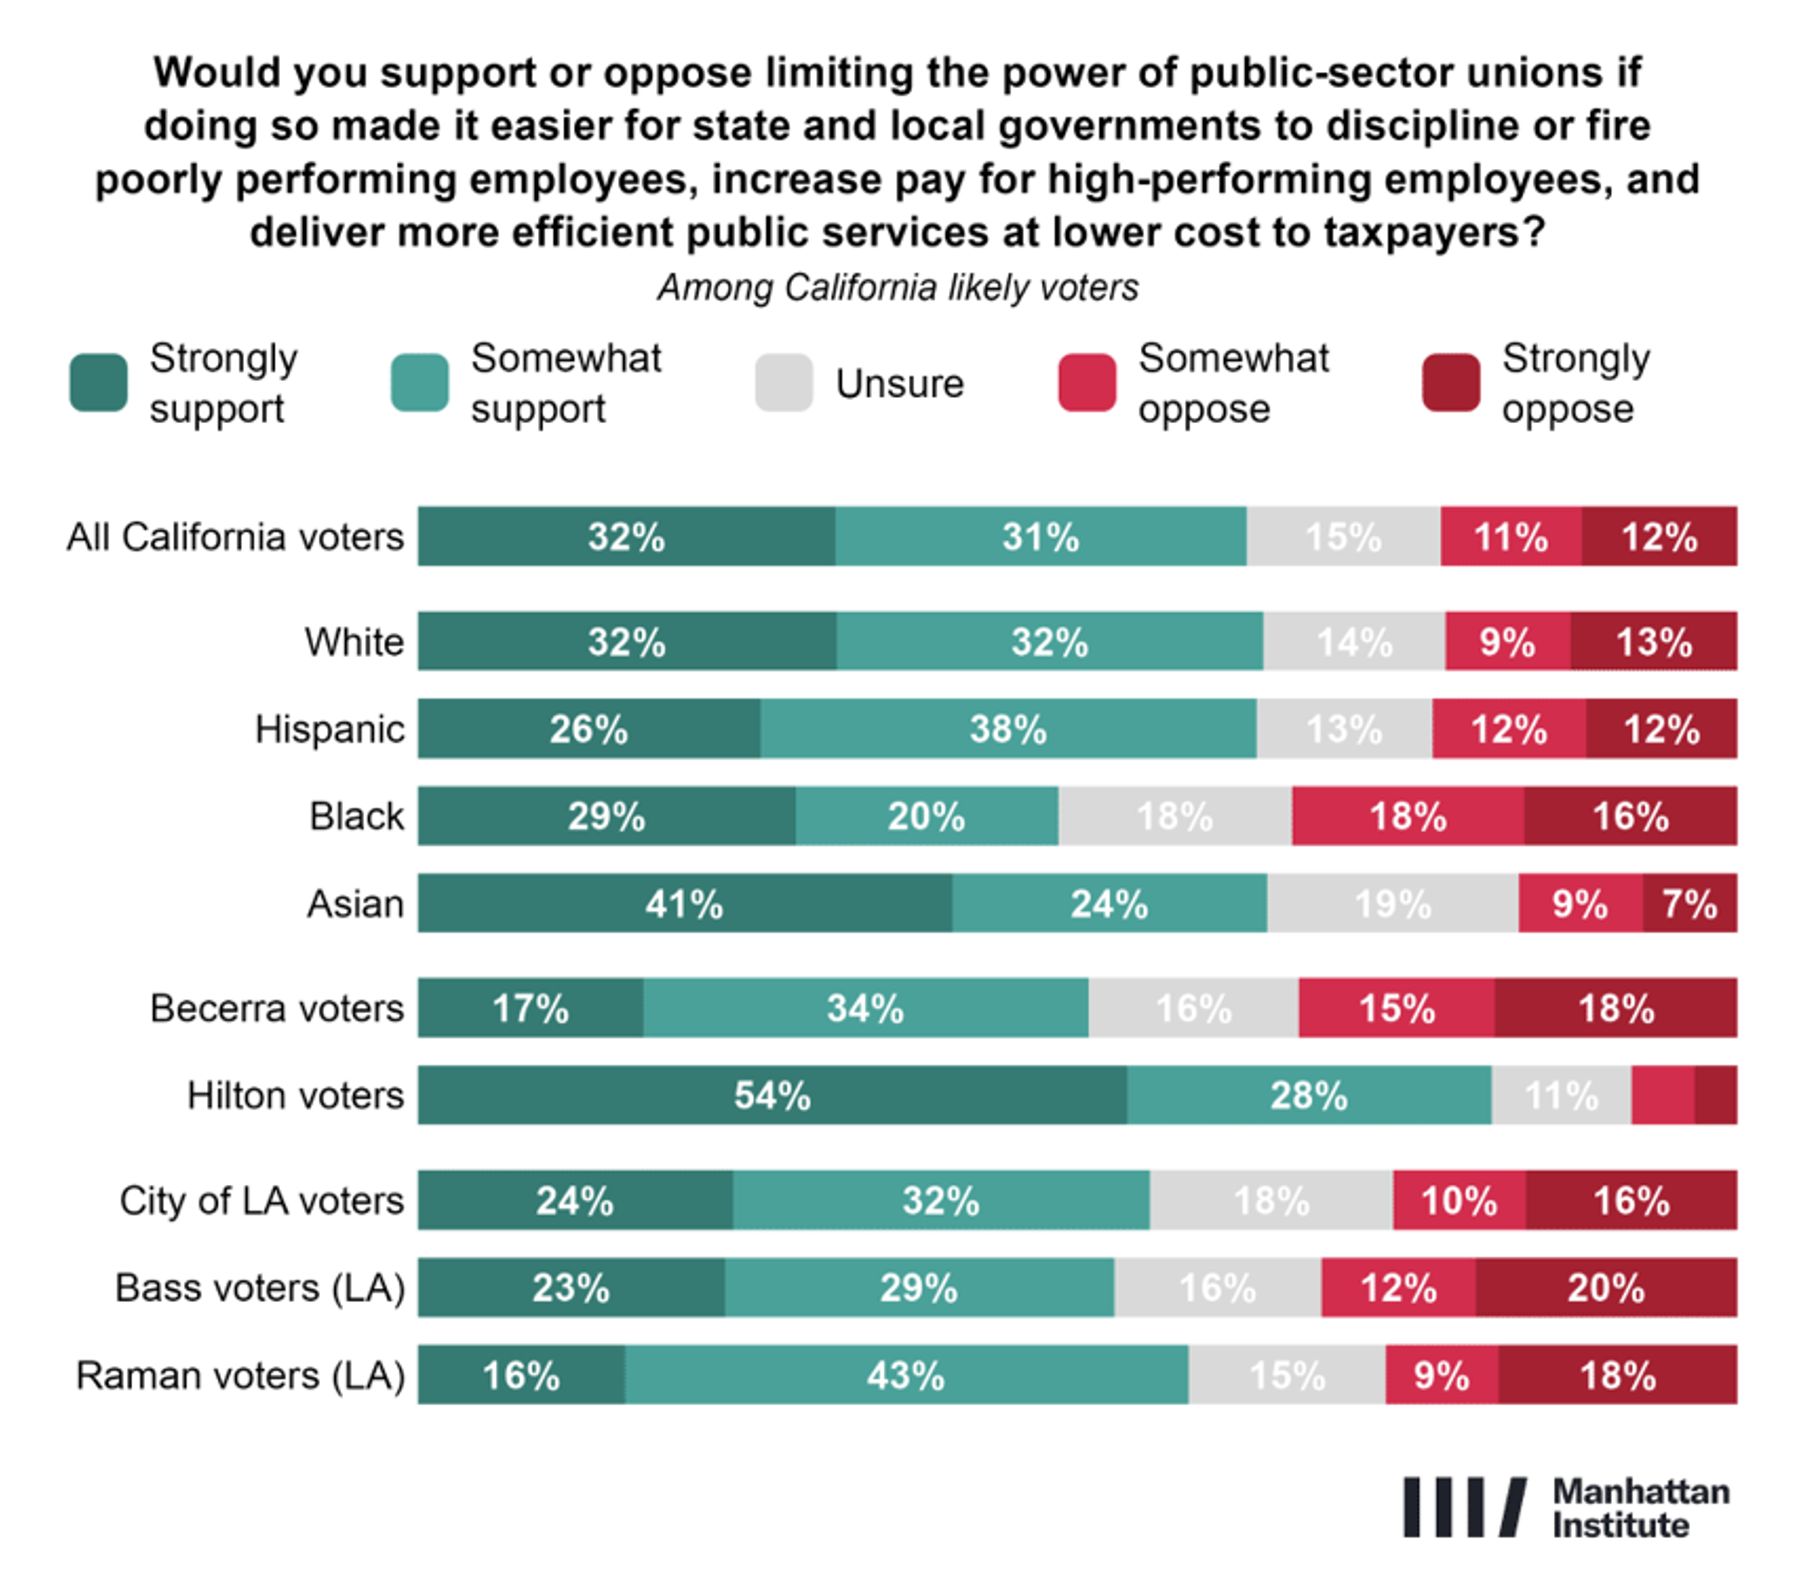
Nearly two-thirds of Californians (63%) also support limiting the power of public-sector unions if doing so would make it easier to reward high-performing employees, discipline poor performers, and deliver better public services at a lower cost. Notably, majorities of independents (62%), Democrats (53%), Raman supporters (59%), and Bass supporters (52%) are in favor of reforms aimed at limiting public-sector union power and improving accountability and service delivery (Figure 12).
Support for organized labor therefore coexists with skepticism about public-sector unions and openness to limits tied to better government performance.
Figure 12
Welfare Fraud, Government Waste, and Corruption
Concern about waste, fraud, and abuse in California’s welfare system is widespread. More than seven in ten voters (71%) say they are concerned, including majorities of Democrats (54%) and Becerra supporters (52%).
As a result, California voters are more likely to support fraud enforcement than expansion of welfare programs. A majority of Californians (53%) believe the state should crack down on waste, fraud, and abuse, while only 32% say it should be easier for eligible people to obtain benefits. 9% favor keeping the system largely as it is today.
Concerns about corruption extend beyond the welfare system. A 42% plurality of Californians believe that their state has a bigger corruption problem than other states, compared with 18% who believe it has a smaller one. Angelenos are somewhat less negative, though 38% still say corruption is a larger problem in California. Among voters planning to support neither Bass nor Raman, that figure rises to 78%, indicating that concerns about corruption are especially prevalent among swing voters.
High-Speed Rail and Public Infrastructure
Californians are broadly dissatisfied with the condition of the state’s infrastructure. Asked to compare California’s roads, bridges, and other public infrastructure to those in other states, more voters (43%) than say they are in worse condition, while only 16% say better condition and 34% say about the same.
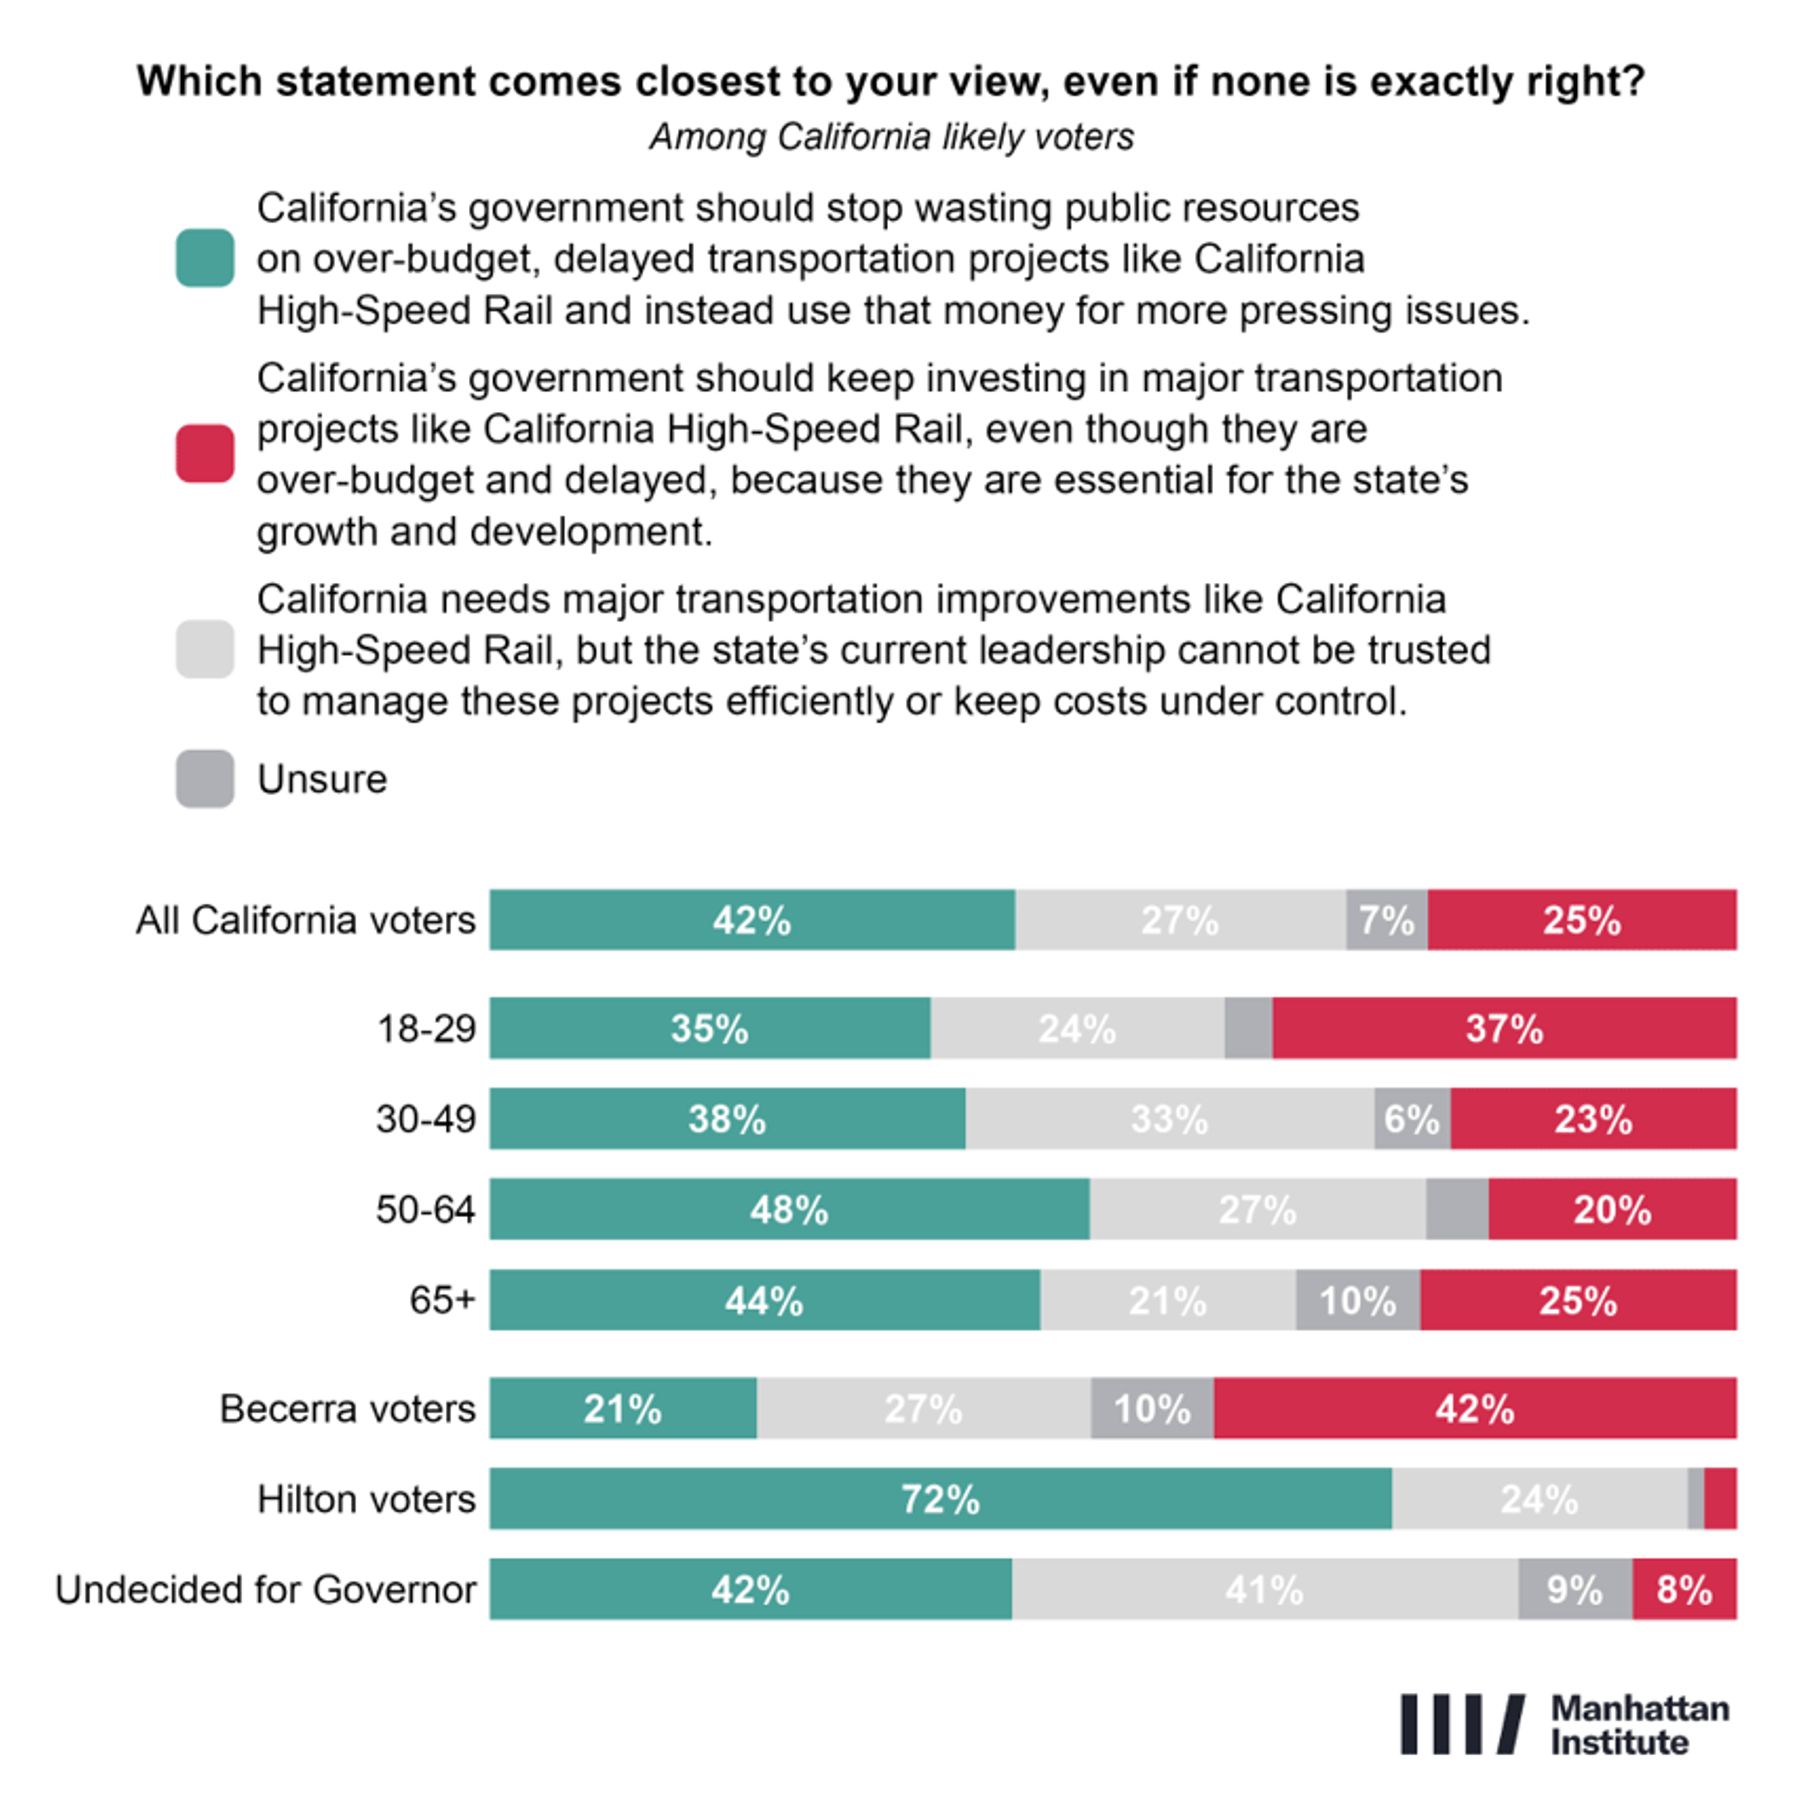
Voters are even more critical of the state’s management of major infrastructure projects. Only 25% believe that the state should continue investing in projects such as California High-Speed Rail despite cost overruns and delays. By contrast, 42% say the state should stop wasting resources on such projects altogether, while another 27% believe major infrastructure investments are needed but do not trust California’s current leadership to manage them effectively. Taken together, roughly seven in ten voters express either opposition to continued spending on projects like High-Speed Rail or skepticism about the state’s ability to deliver them successfully (Figure 13).
Figure 13
Medi-Cal Eligibility
California voters lean toward restricting Medi-Cal eligibility based on legal status. A majority (51%) say that the program should only be available to those with legal status, while 31% believe it should be available regardless of immigration status. Another 11% favor allowing current beneficiaries without legal status to retain coverage while ending new enrollment, and 7% are unsure (Figure 14).
Figure 14
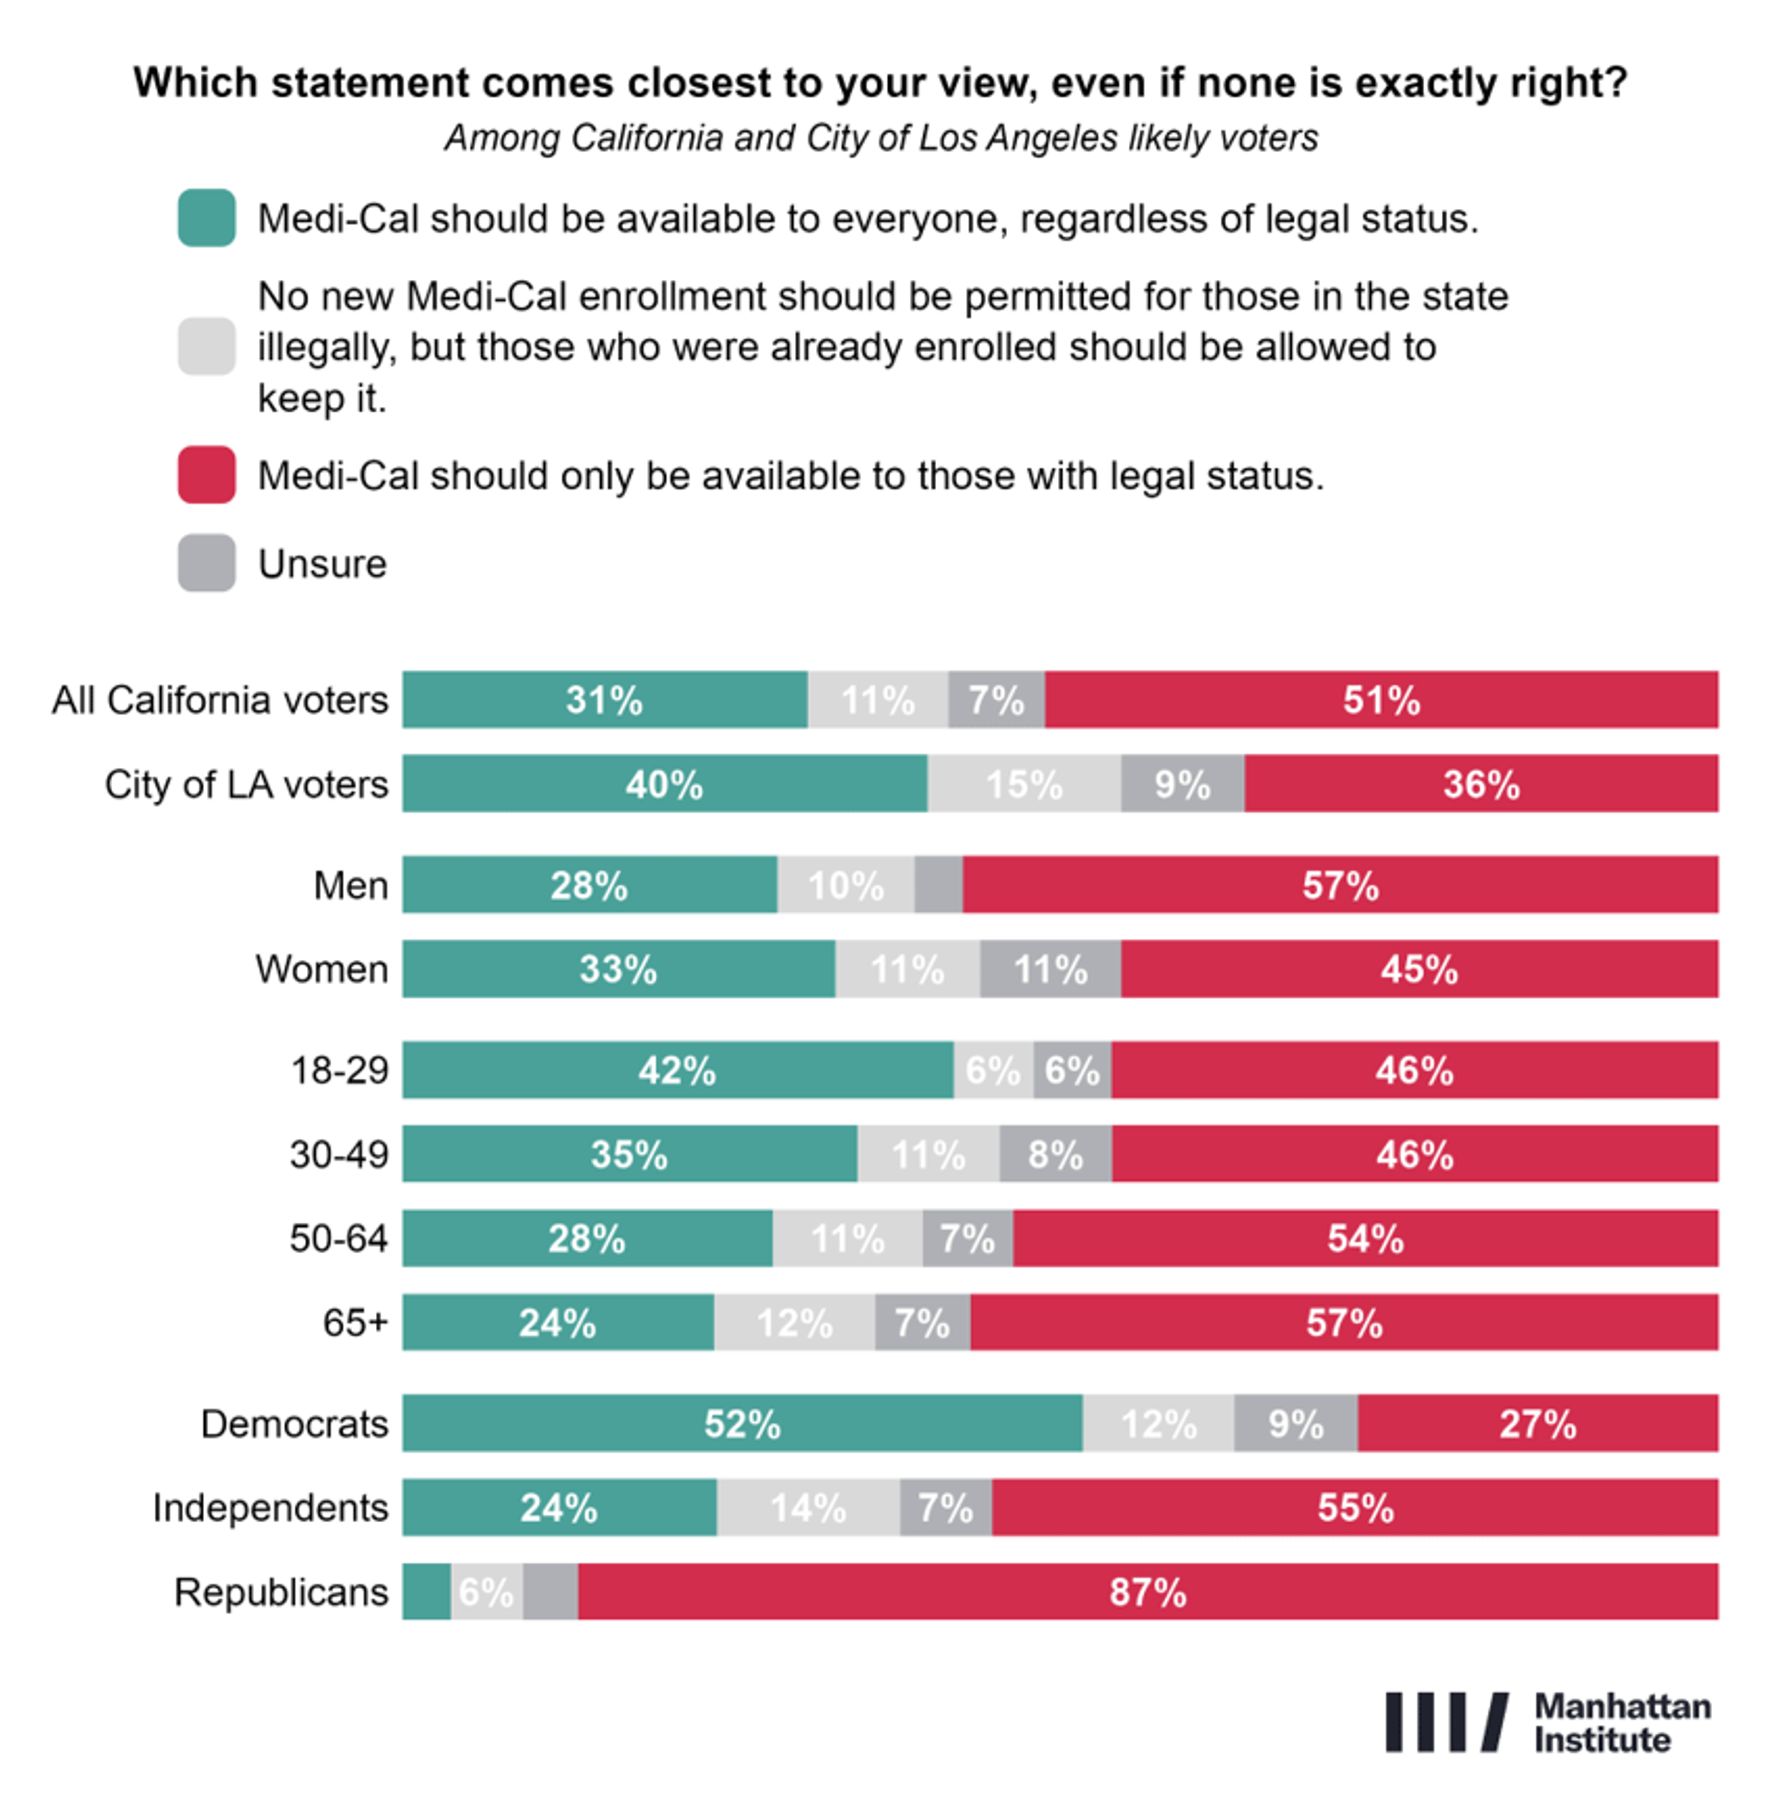
The partisan divide is particularly striking. Independents favor restricting eligibility by a 55% to 24% margin, while Republicans do so overwhelmingly (87% to 4%). Democrats are the only major partisan group in which a majority (52%) support making Medi-Cal available regardless of legal status.
Los Angeles voters are more supportive of making Medi-Cal available regardless of legal status than Californians overall. A plurality (40%) support no eligibility restriction, compared with 36% who favor limiting the program to those with legal status. Raman supporters back eligibility regardless of legal status by a 58% to 15% margin, while Bass supporters are more divided (42% to 36%).
Race and Merit
California voters are opposed to race-conscious hiring and admissions policies. A majority (53%) agree that using race to make hiring or admissions decisions is discriminatory no matter who it helps or hurts, while 37% say that America’s history of discrimination creates an obligation to take race into account today. 10% are unsure (Figure 15).
Figure 15
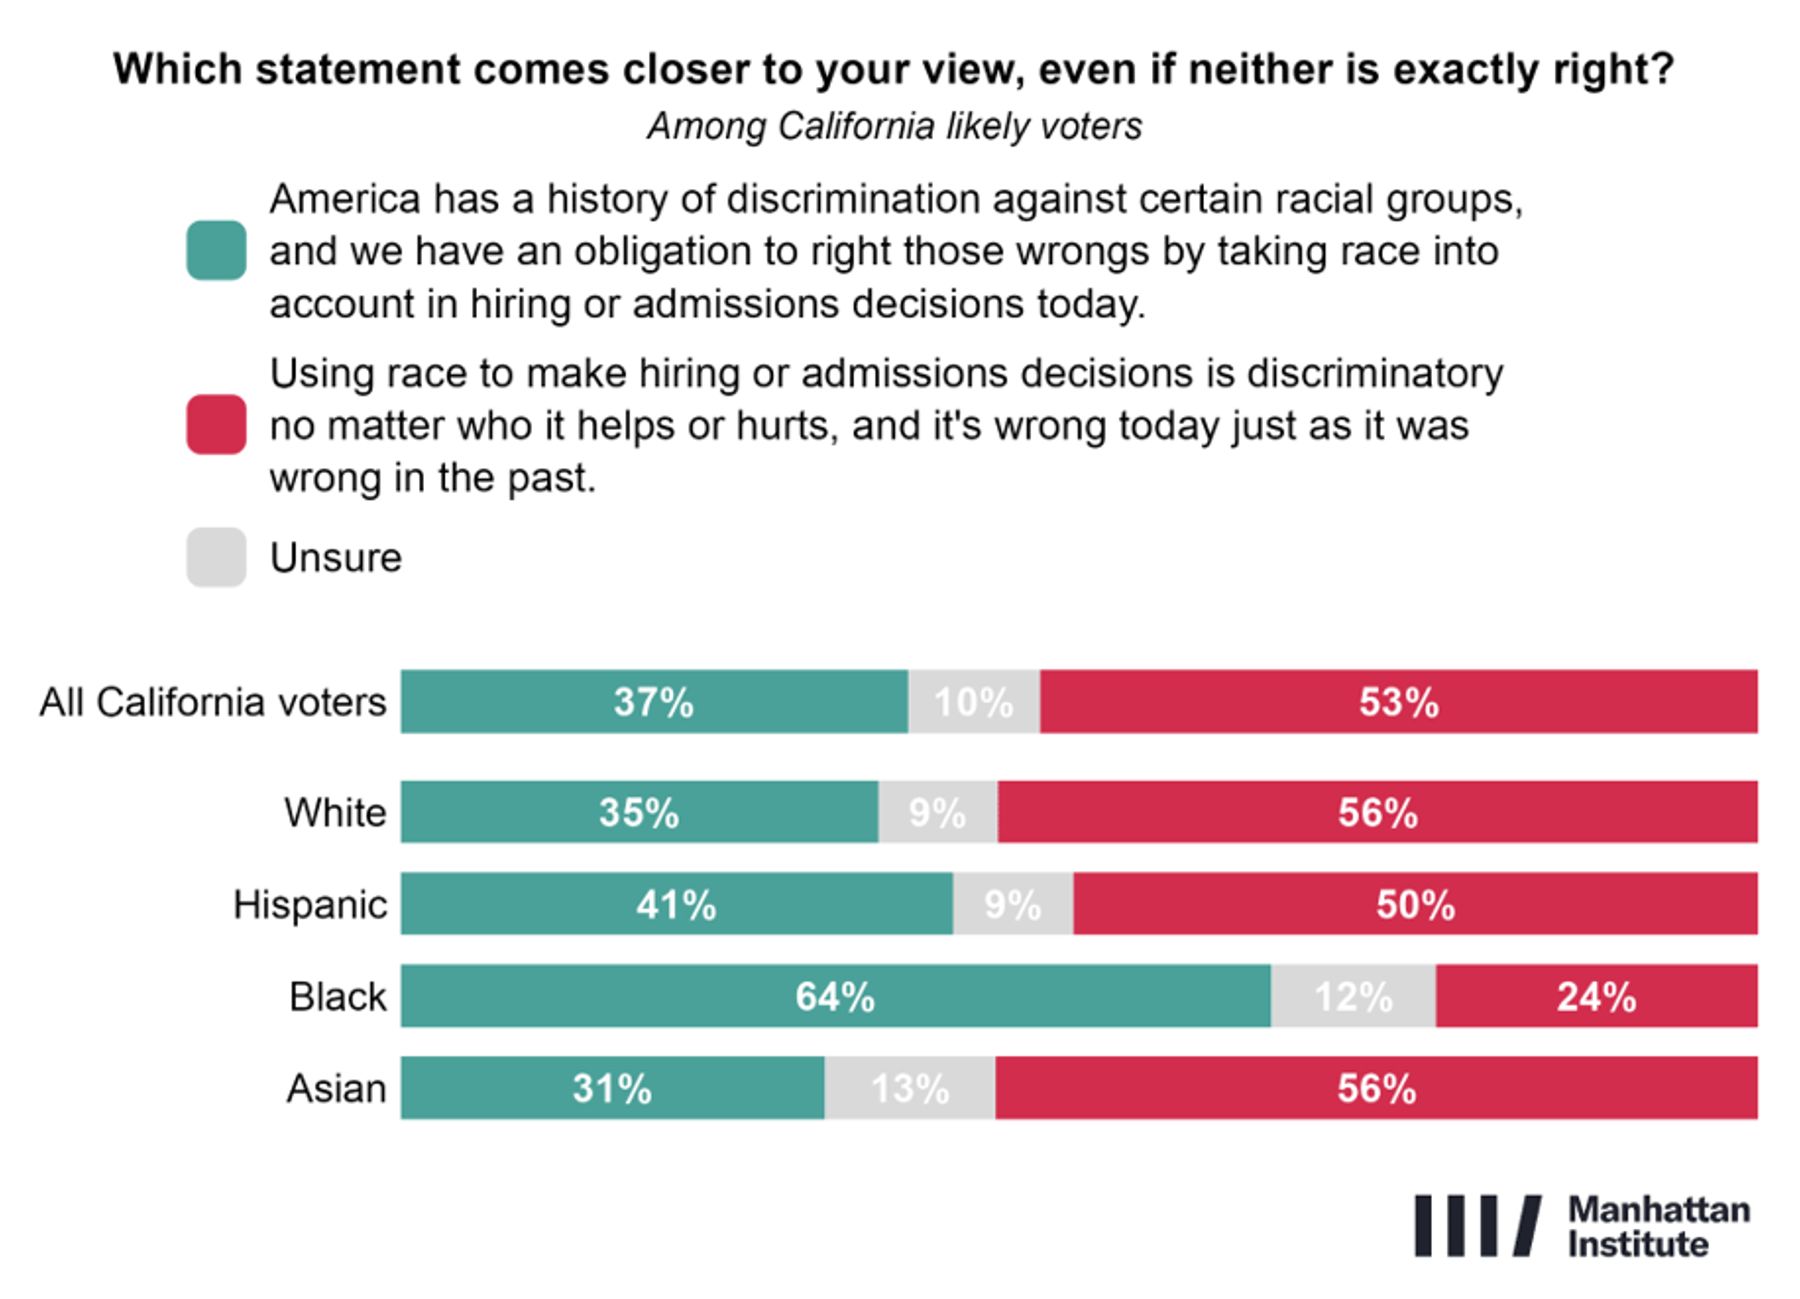
Views on race-conscious hiring and admissions vary across demographic groups. Men believe that using race is discriminatory by a 57% to 33% margin, while women are more divided (50% to 42%). Younger voters are more receptive to race-conscious policies, but that view is still rejected by voters aged 18–29 (47% oppose to 42% support). Among those aged 50–64, a majority oppose race-conscious policies (58%), with only 33% in favor.
Racial divisions are similarly pronounced. Black voters strongly support affirmative action, backing race-conscious hiring and admissions policies by a 64% to 24% margin. Asian voters, meanwhile, are among the strongest critics, opposing race-conscious hiring and admissions policies by a 56% to 31% margin. White voters are similarly opposed (56% to 35%), while Hispanic voters oppose affirmative action by a narrower 50% to 41% margin. College-educated voters are evenly divided, with 45% on each side of the question, whereas voters without a four-year degree oppose affirmative action by a 59% to 32% margin.
On affirmative action, Los Angeles stands apart from the statewide electorate. Los Angeles voters support it by an eight-point margin (48% to 40%), while California voters overall oppose it by a 16-point margin.
[1] Net favorability calculated from unrounded figures; numbers may not appear to sum due to rounding.
[2] Net value calculated from unrounded figures; numbers may not appear to sum due to rounding.
[3] Net value calculated from unrounded figures; numbers may not appear to sum due to rounding.
Are you interested in supporting the Manhattan Institute’s public-interest research and journalism? As a 501(c)(3) nonprofit, donations in support of MI and its scholars’ work are fully tax-deductible as provided by law (EIN #13-2912529).