Behind CBO’s $100 Trillion in Projected Deficits over 30 Years

Photo: flavijus/iStock
The latest long-term budget estimates from the Congressional Budget Office (CBO) show unsustainable growth of government debt (Chart 1). This debt—which was 40% of the economy before the 2008 recession—will surpass 100% this year, on its way to 195% of the economy in 30 years.[1] And this is under the rosy scenario of no new tax cuts, no stimulus bills, and no spending programs—and it even assumes that most of the 2017 tax cuts expire on schedule.
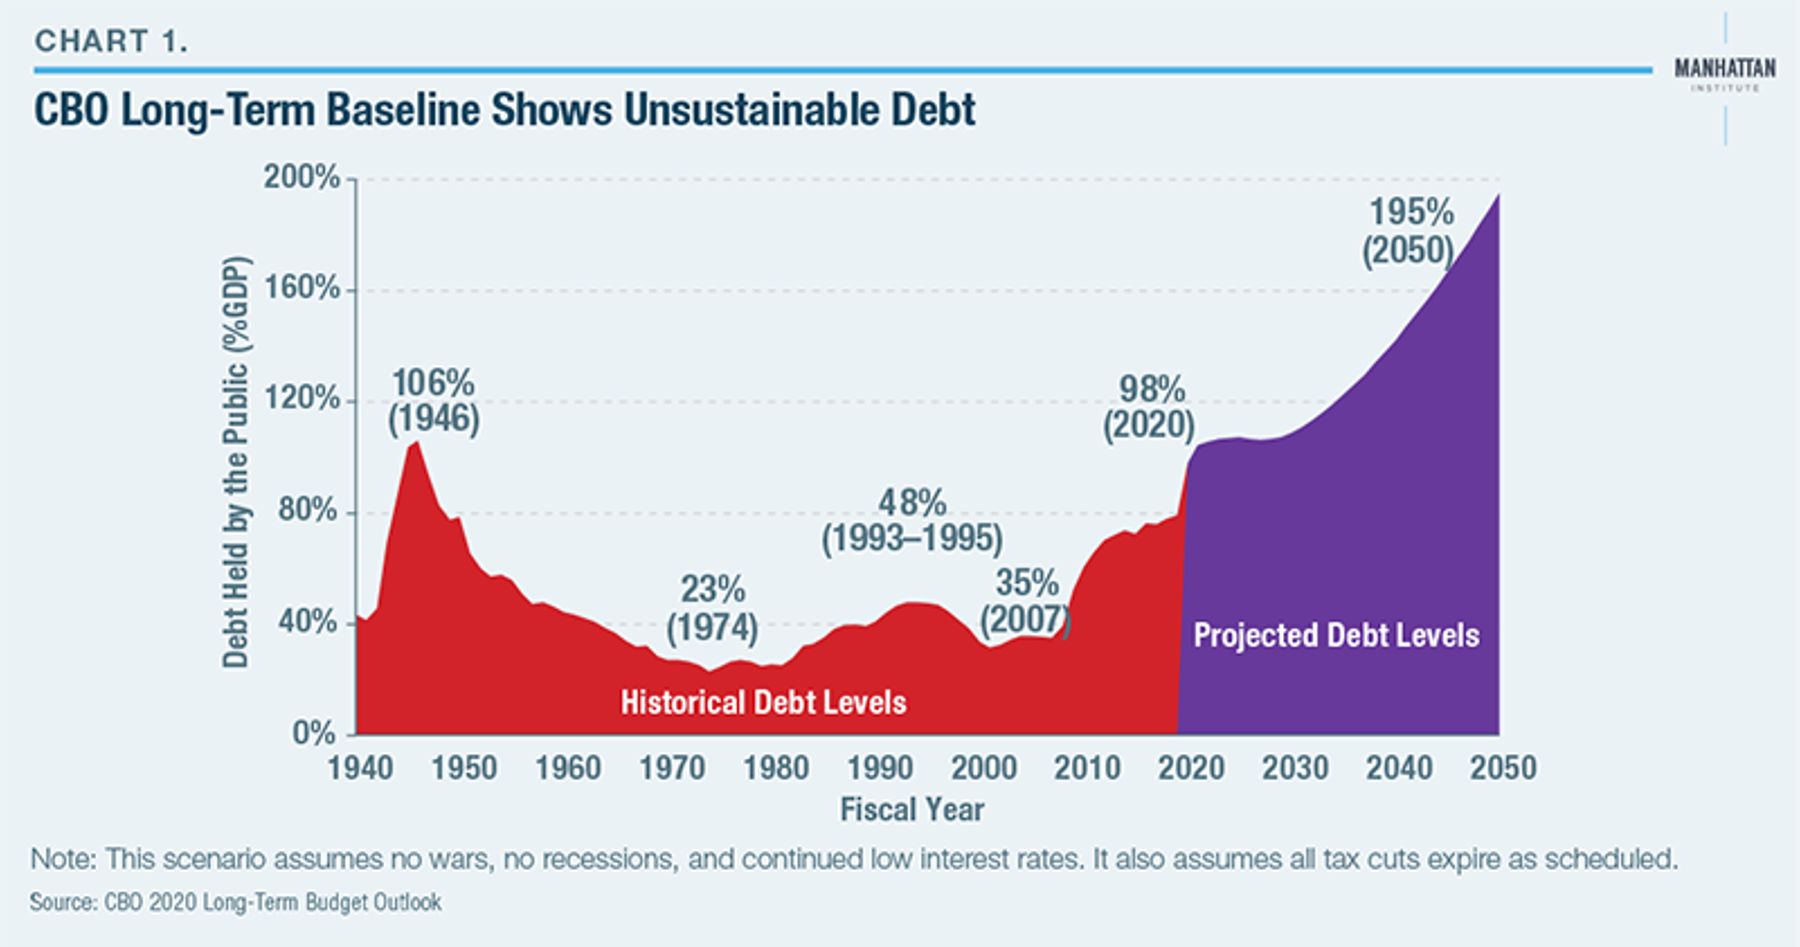
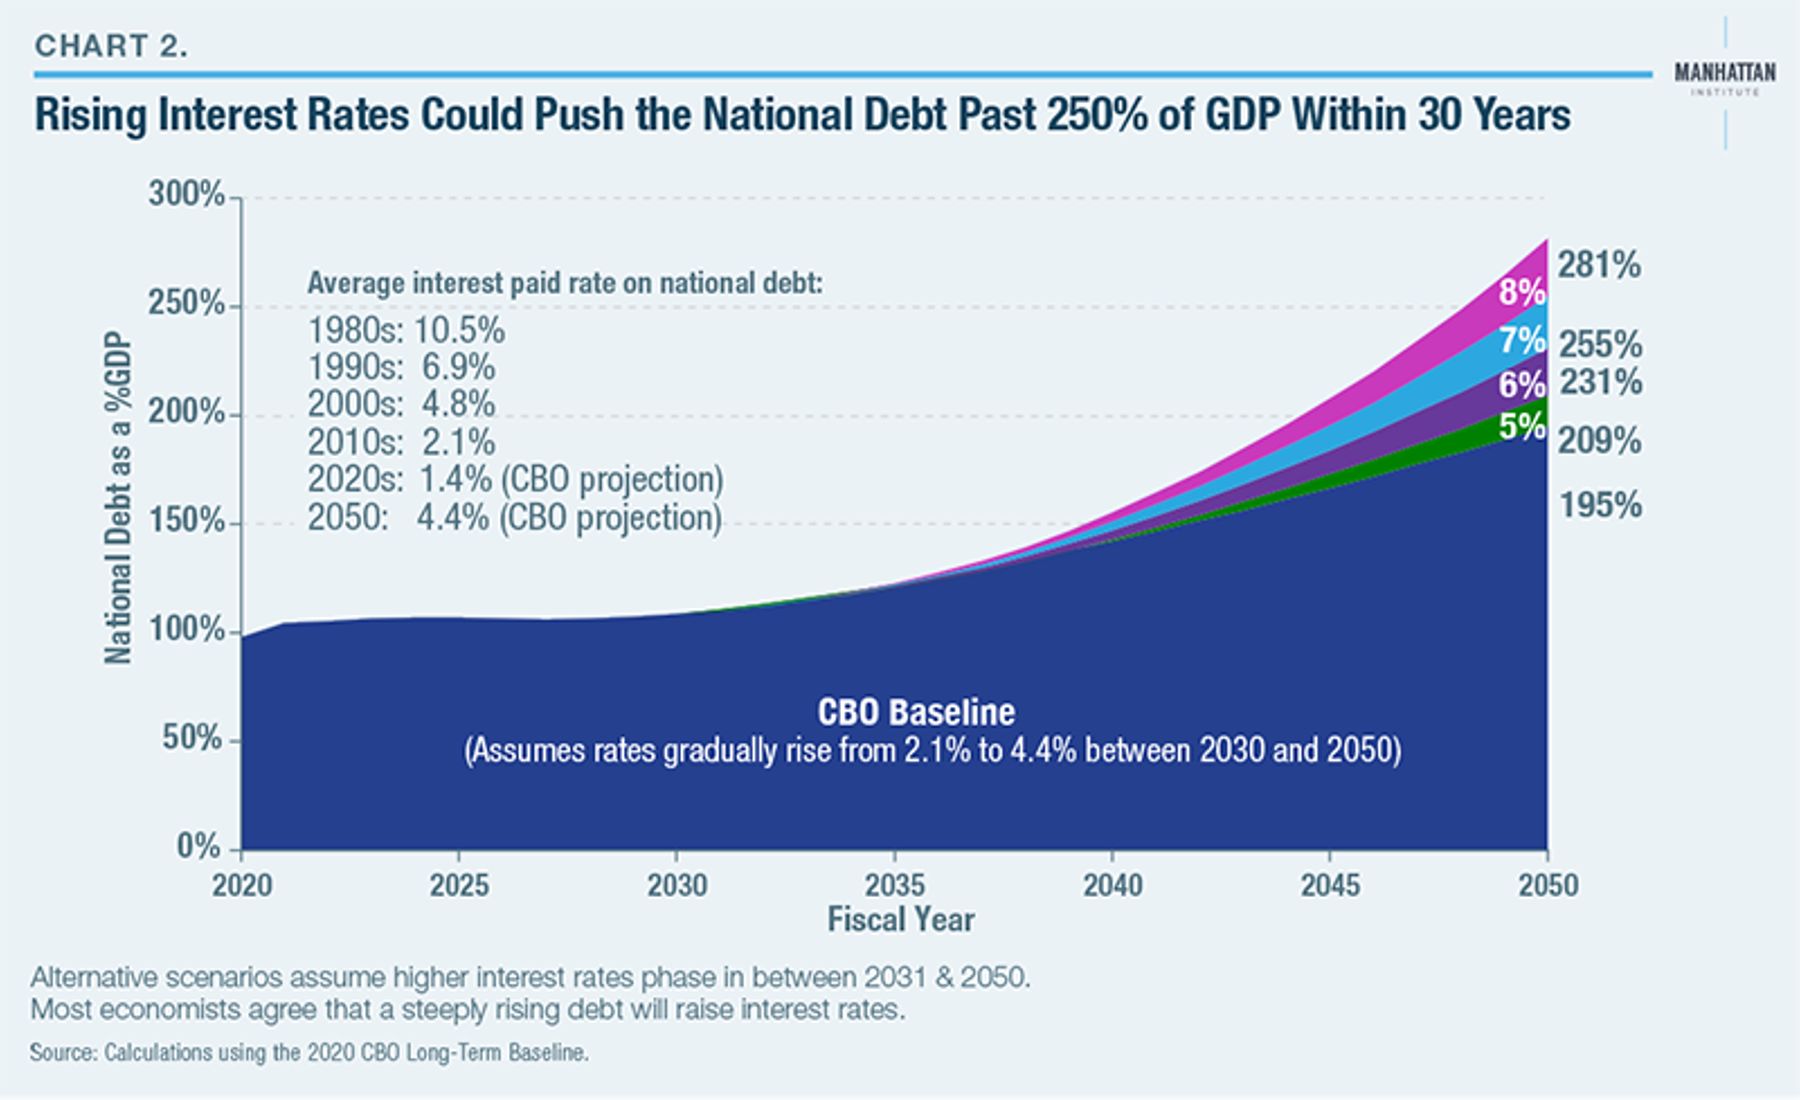
CBO also assumes that interest rates will permanently remain well below historical averages, with the average rate paid by the government gradually rising to 4.4% over 30 years, despite an enormous debt. By comparison, rates averaged 6.9% in the 1990s and 4.8% in the 2000s, before falling to 2.1% during the 2010s (Chart 2). Each gradual 1-percentage-point rise in interest rates over 30 years would add 22% of GDP to the debt—about $15 trillion in new debt.[2] In short, 195% of GDP is the rosy scenario.
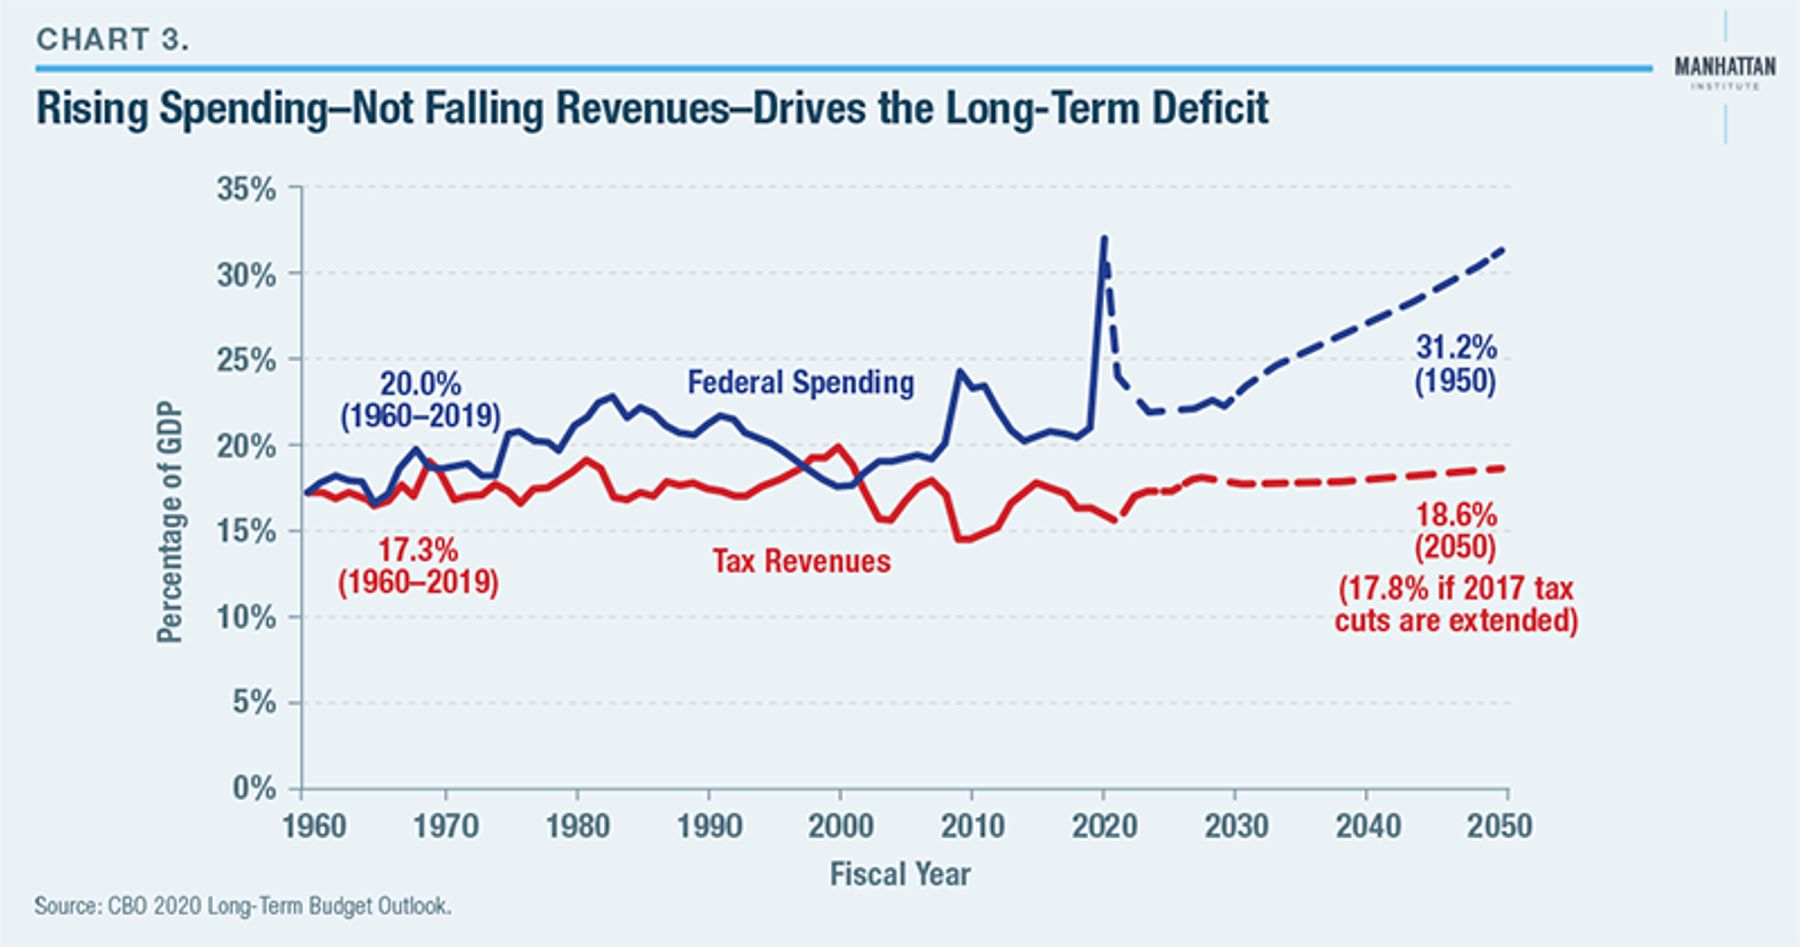
These trends are unsustainable. CBO projections show spending and tax revenues each consuming a larger share of the economy indefinitely, with federal spending leaping past 31% of GDP by 2050 (likely topping 40% of GDP when including state and local government spending) and continuing to grow steeply thereafter (Charst 3, 4). A government that continues to grow as a share of the economy indefinitely would eventually crowd out and swallow the private sector. Furthermore, a debt that doubles as a share of the economy every few decades will eventually crowd out investment and also drown the federal budget in interest expenses, even at low interest rates.[3] While economists disagree on the “right” debt level, virtually none argue that the debt’s share of the economy can steeply rise forever.
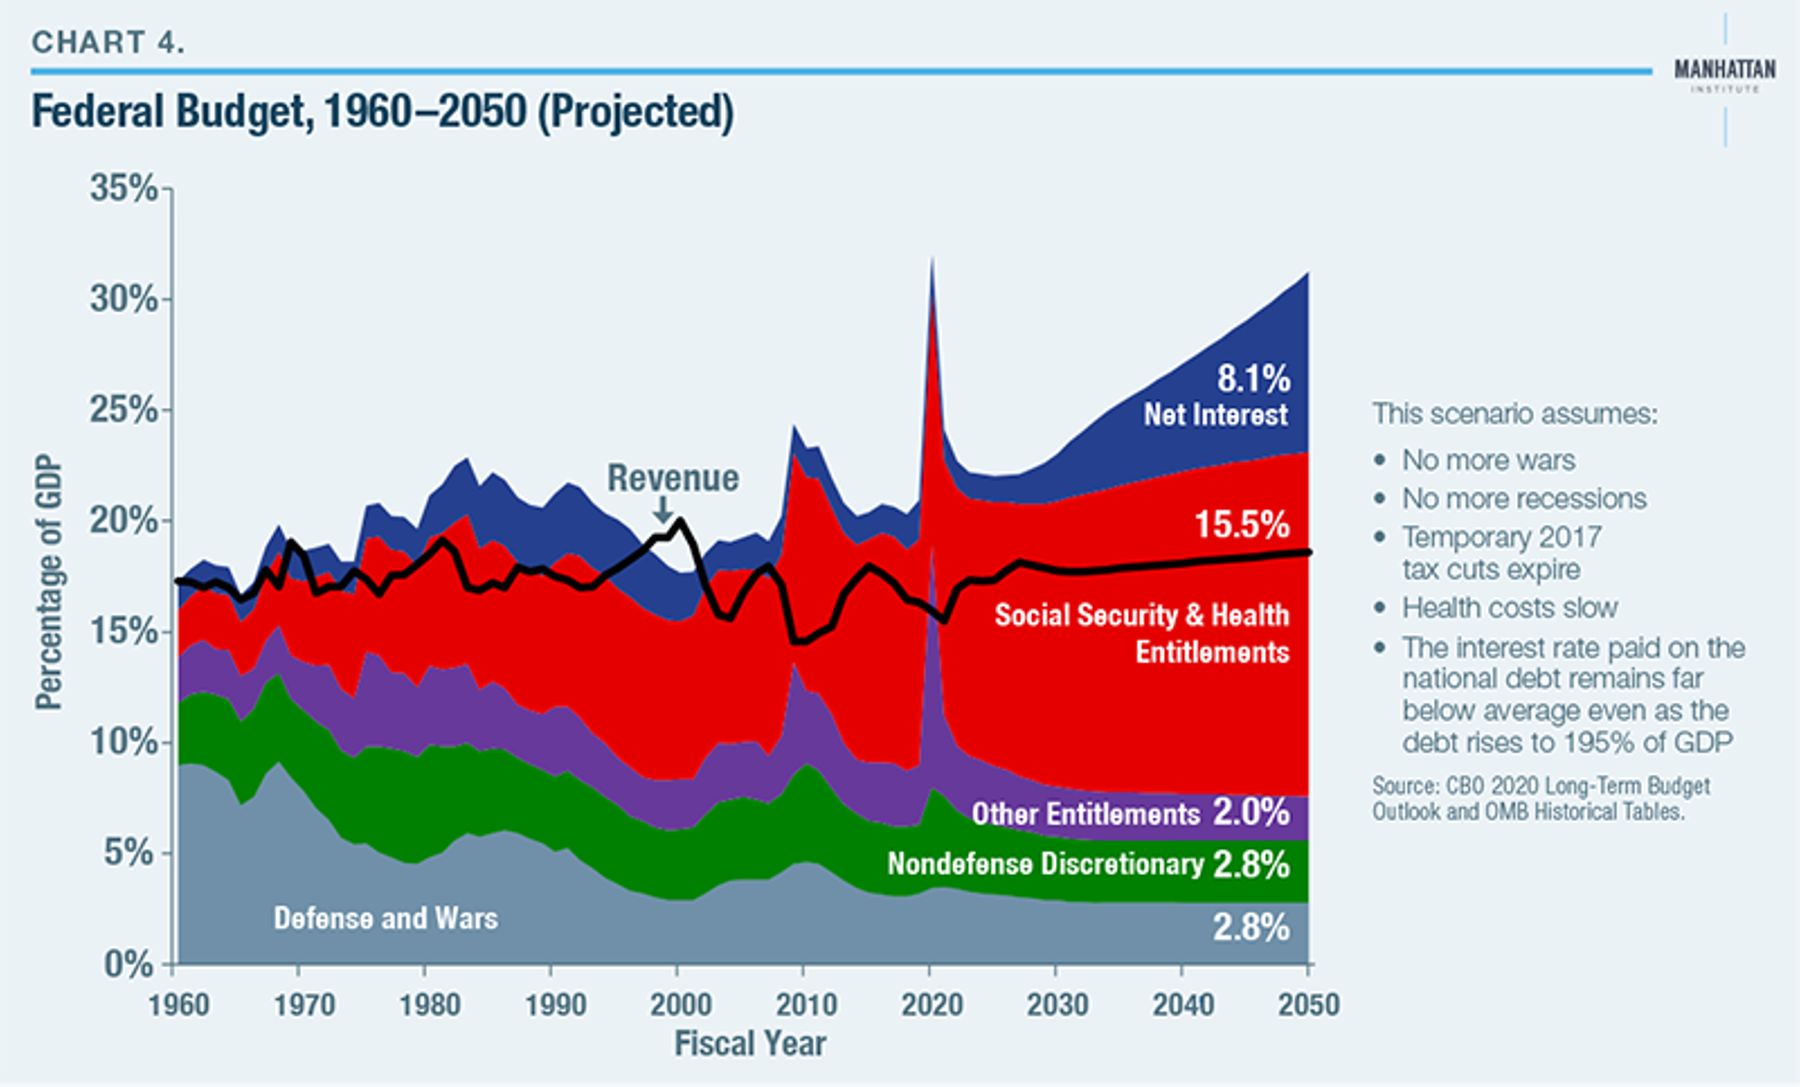
The drivers of this unprecedented increase in debt are Social Security and Medicare shortfalls. CBO projects that—as a share of the economy—tax revenues will continue rising well above historical averages, while discretionary spending (both defense and nondefense functions such as transportation, housing, K–12 education, and health and science research) will continue falling well below their own historical averages. The cost of most smaller entitlement programs such as SNAP, unemployment benefits, veterans’ income aid, and Supplemental Security Income will also continue falling as a share of the economy.
Instead, the rapidly rising costs of Social Security and Medicare are responsible for nearly all the projected debt increase. In contrast to popular belief, these programs are not wholly funded by payroll taxes and senior premiums. Paying all annual benefits requires annual infusions of general revenues that will grow sharply over time (and, in fact, drive nearly the entire $1 trillion projected deficit increase between 2019 and 2030). These shortfalls are driven by the retirement of 74 million baby boomers into a system that pays most retirees benefits far exceeding their lifetime contributions into the Social Security and Medicare systems (even after adjusting their older contributions into their present value) (Chart 5).[4]
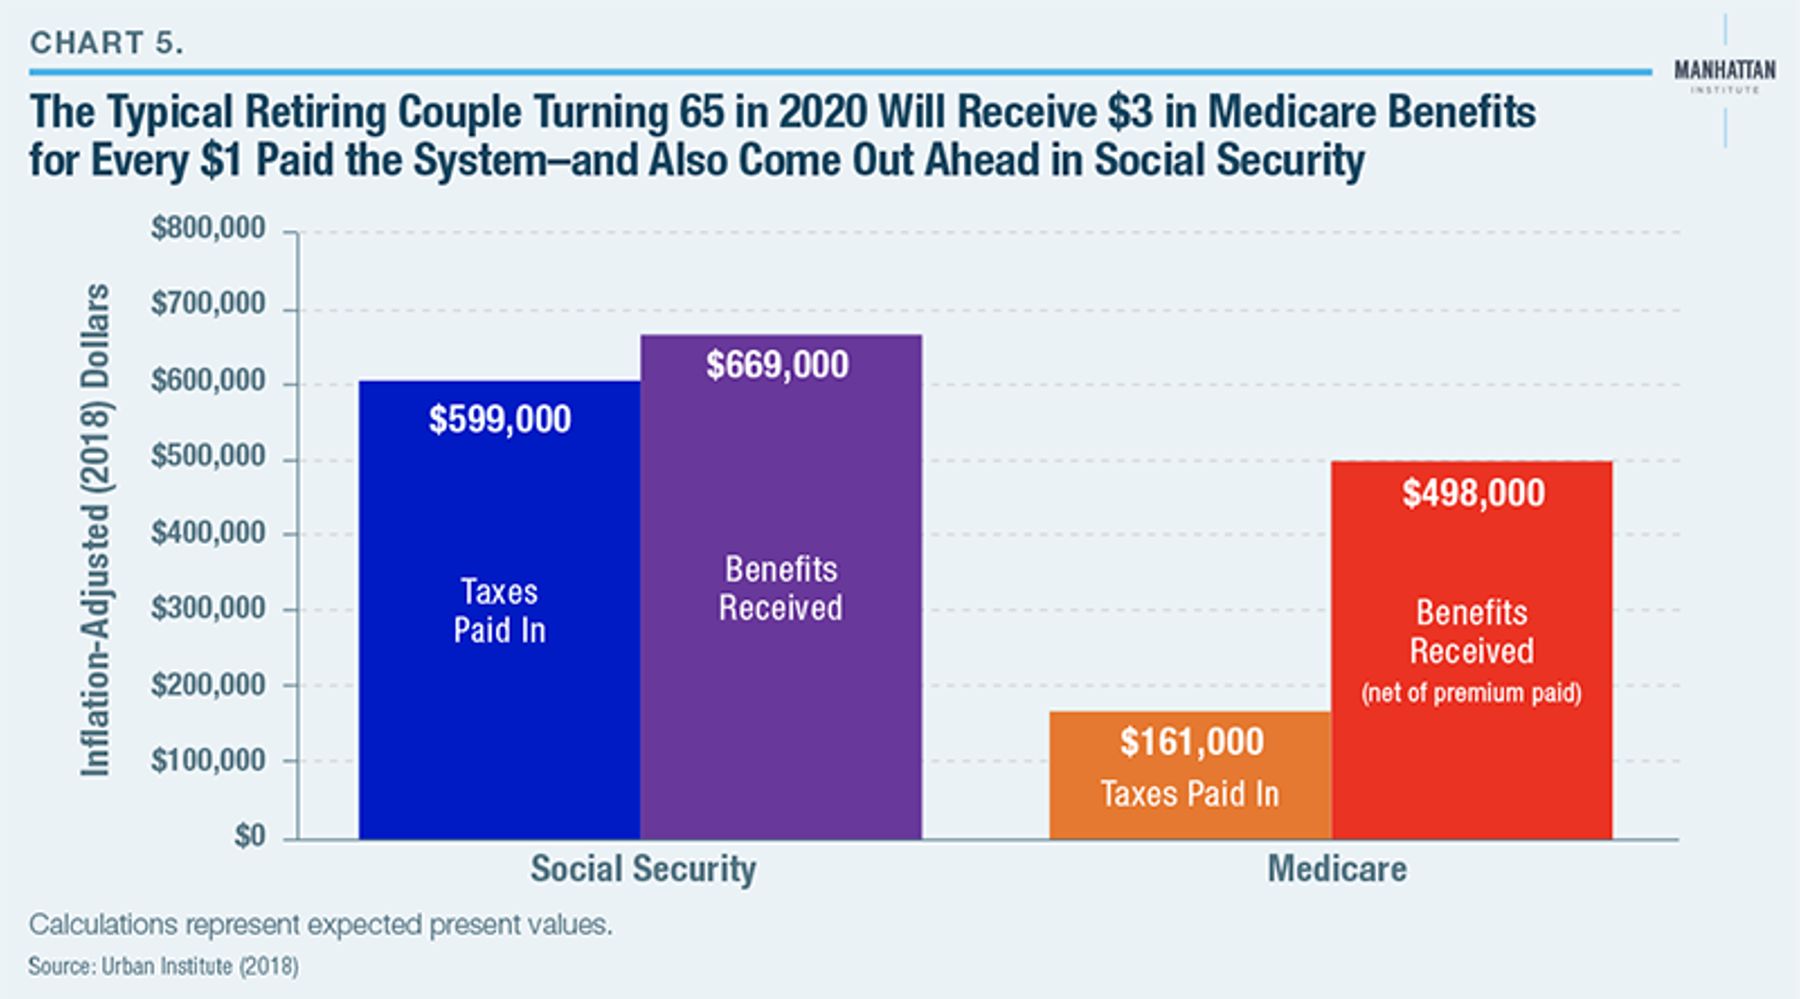
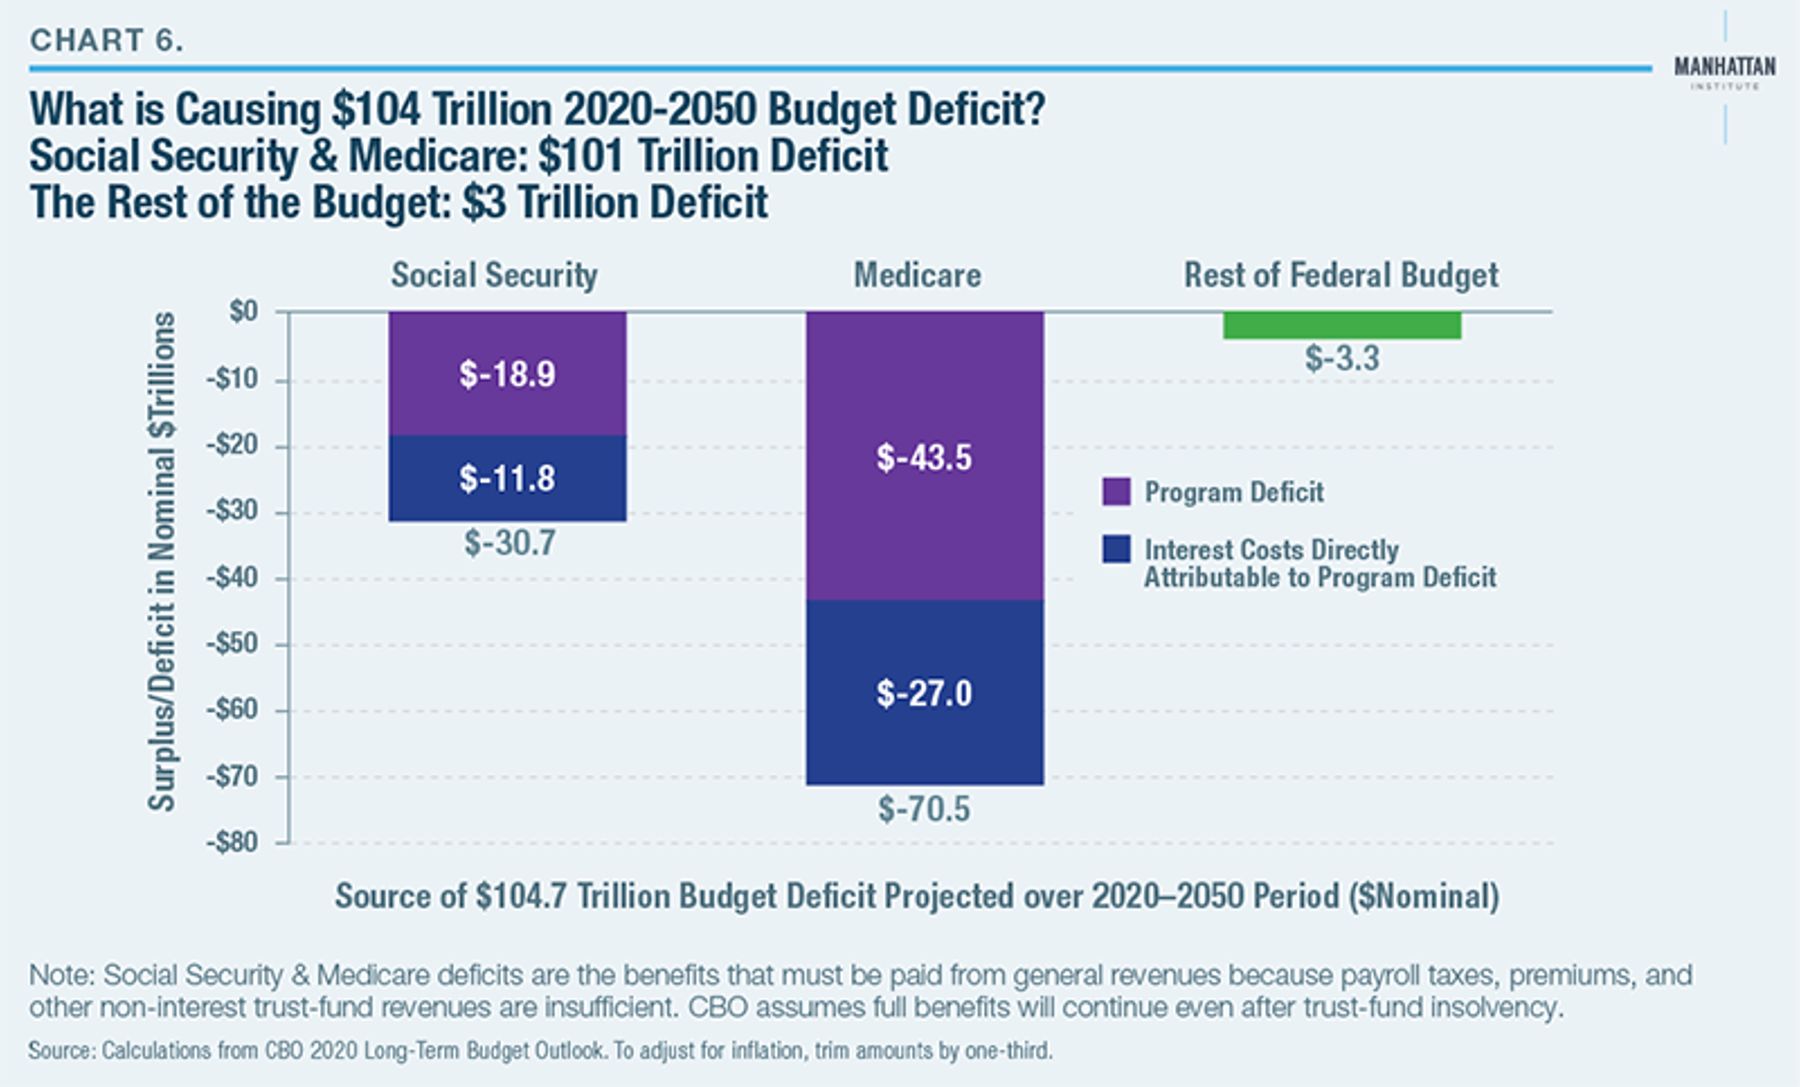
Chart 6 shows that, of the $104 trillion in budget deficits forecast over the next 30 years, the general revenue transfers needed to pay all Social Security and Medicare benefits (plus interest) account for $101 trillion. The rest of the budget will run a shortfall of just $3 trillion (to adjust these amounts for inflation, trim by one-third).
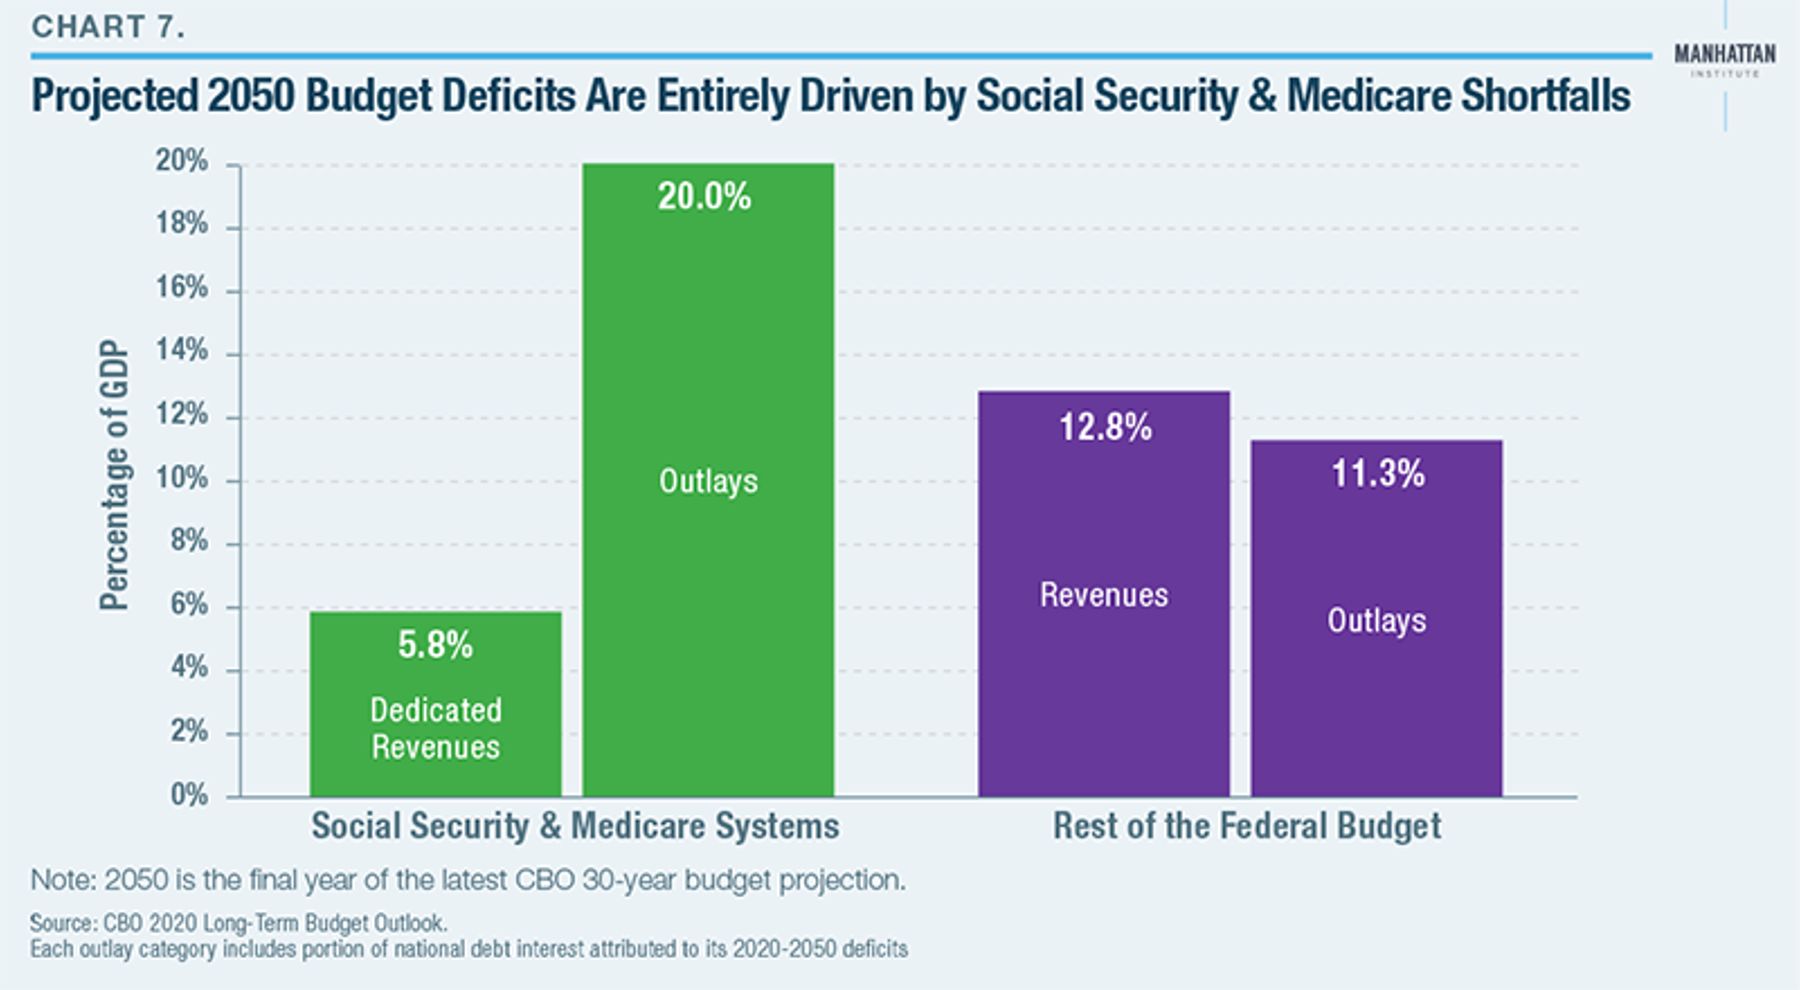
All in all, by 2050, the Social Security and Medicare systems will collect 5.8% of GDP in dedicated revenue and cost 20.0% of GDP (including interest). In other words, two federal programs will run a shortfall equal to 14.2% of GDP. The rest of the budget, by that point, will be running a 1.5% surplus as a share of GDP (Chart 7).
The amount of revenue that Social Security and Medicare collect in payroll taxes and related dedicated revenues has remained steady, at about 6% of GDP—and is projected by CBO to remain at that level for the next 30 years (Charts 8 and 9).
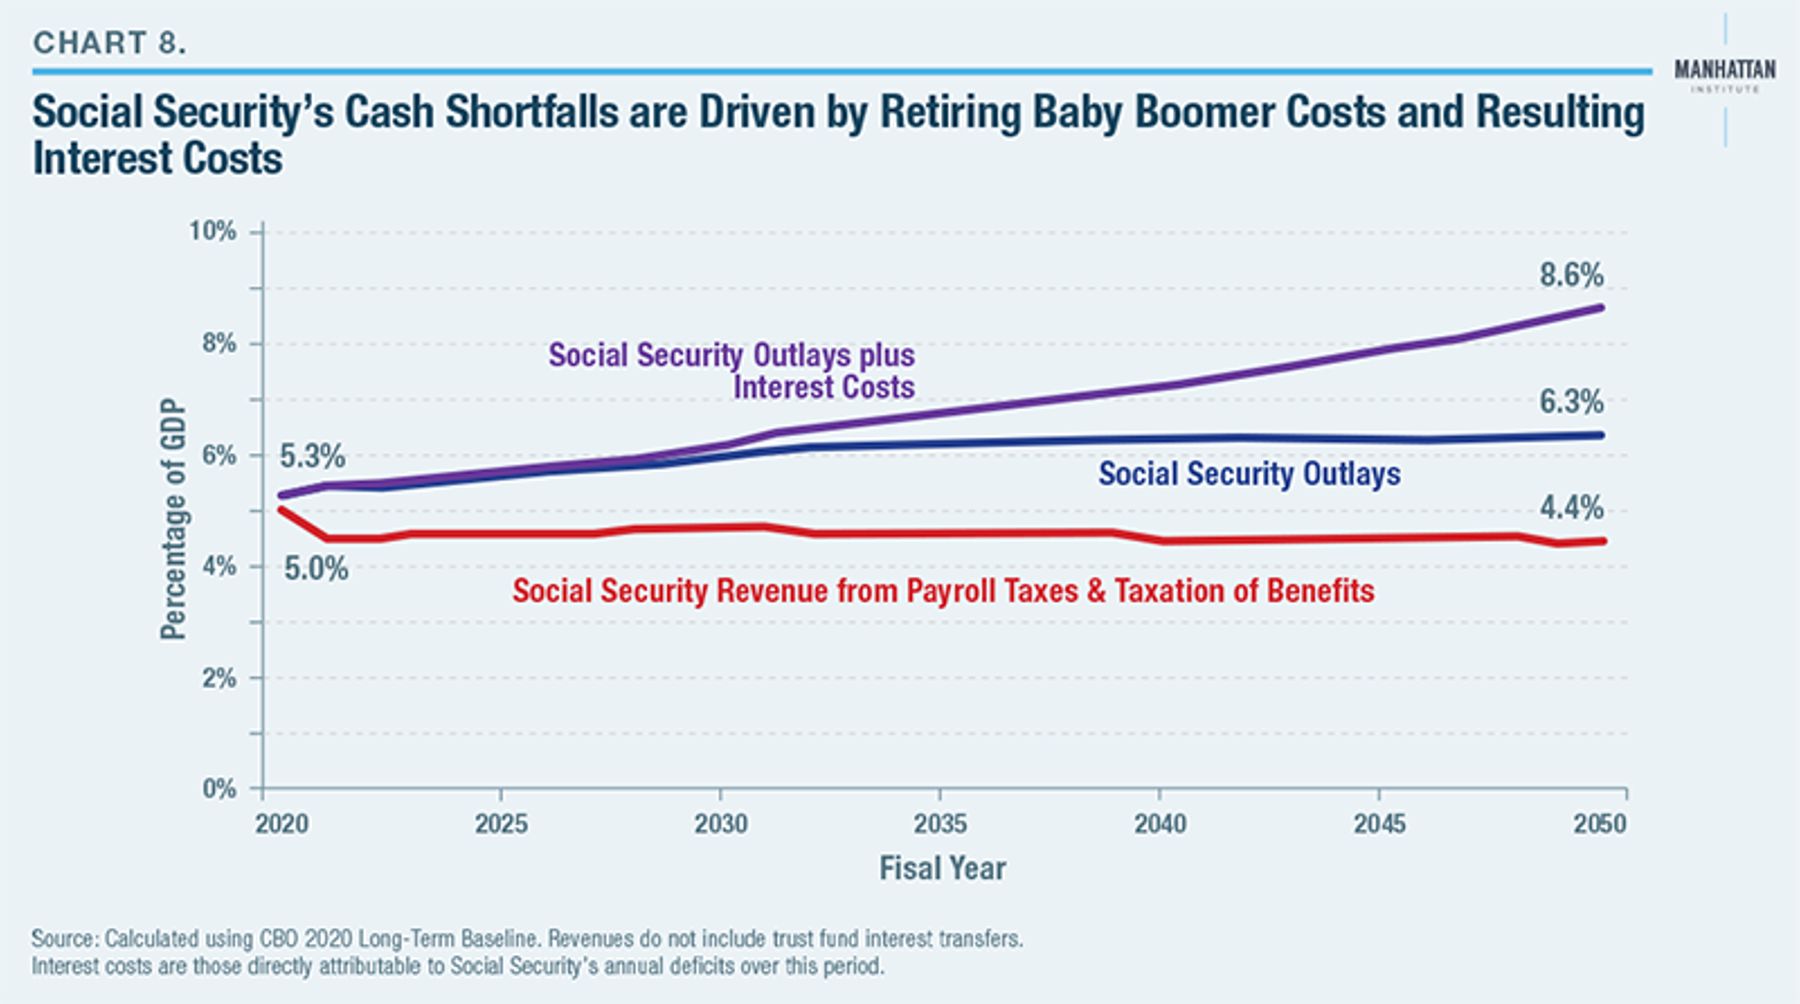
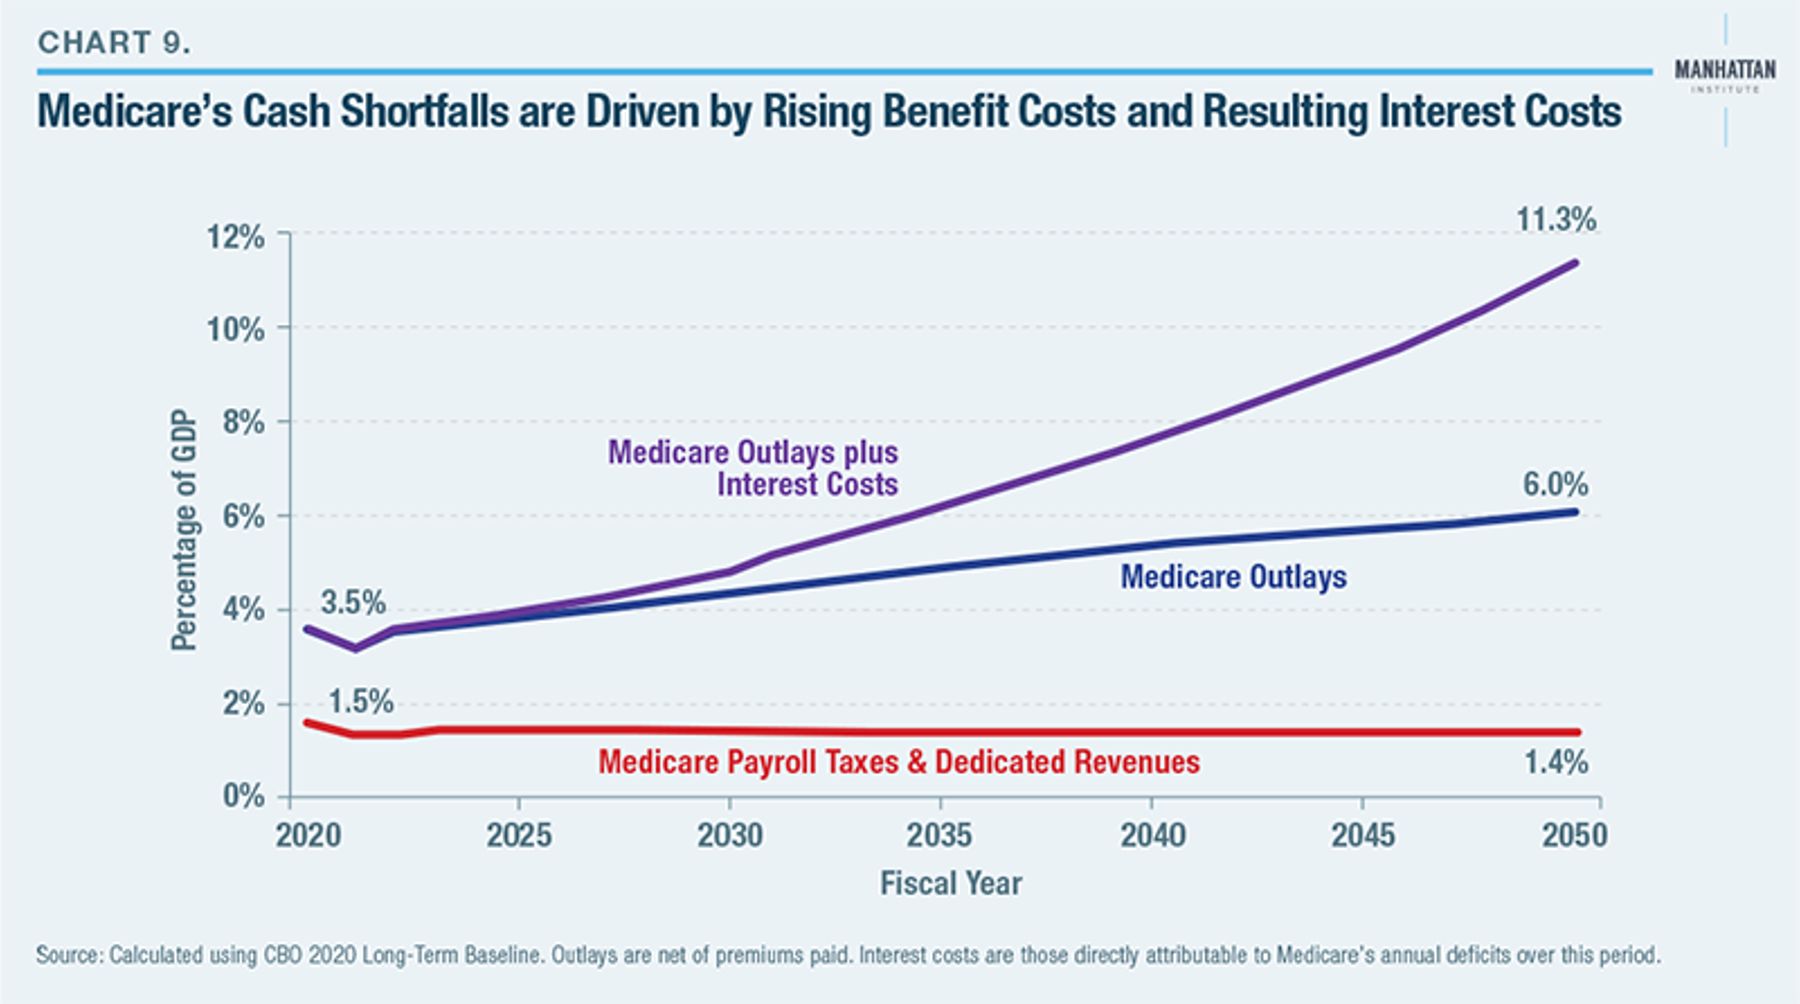
Yet Social Security and Medicare spending rose from 7% to 9% of the economy since 2005, and is headed toward 12.4% of GDP by 2050. If one includes the share of the annual projected interest on the national debt that is directly attributable to these shortfalls, the combined cost rises to 20% of GDP by 2050.
We can dive deeper into these costs.
Chart 8 shows rising Social Security shortfalls that level off at just under 2% of GDP—plus interest costs rising to 2.3% of GDP.
Chart 9 shows that the Medicare system is projected to continue collecting 1.4% of GDP in payroll taxes and other trust fund revenues. Yet spending levels (net of senior premiums) will rise from 3% to 6% of GDP between 2019 and 2050. To be sure, Medicare payroll taxes were not intended to cover all program spending (but only that of Medicare Part A). Yet the portion funded by general revenues is rising dramatically, from 1.6% to 4.6% of the economy, plus 5.3% in annual interest payments on the national debt that are directly attributable to Medicare shortfalls.
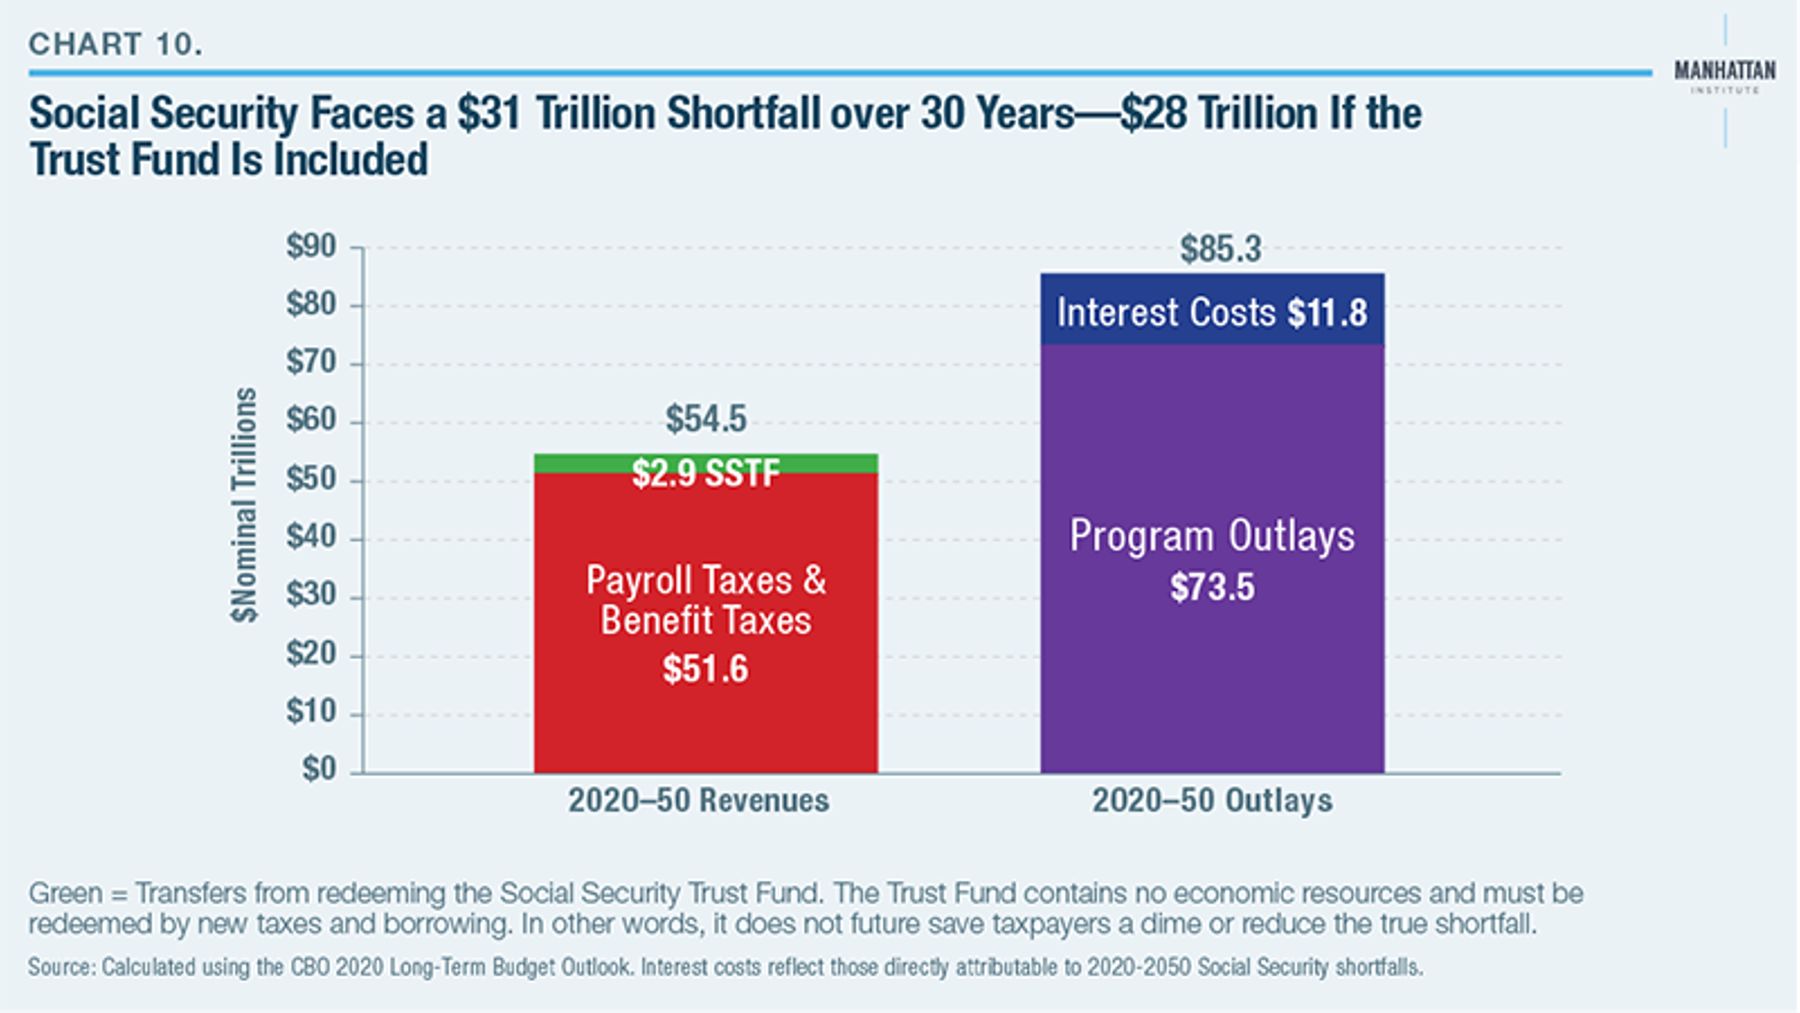
Charts 10 and 11 put these shortfalls in nominal dollars. Between 2020 and 2050, the Social Security system will collect $52 trillion in payroll and benefits taxes and spend $74 trillion on benefits—plus $12 trillion more in interest costs on the national debt from these shortfalls. Had the Social Security trust fund been “saved” rather than spent, it would have closed just $3 trillion of this gap.
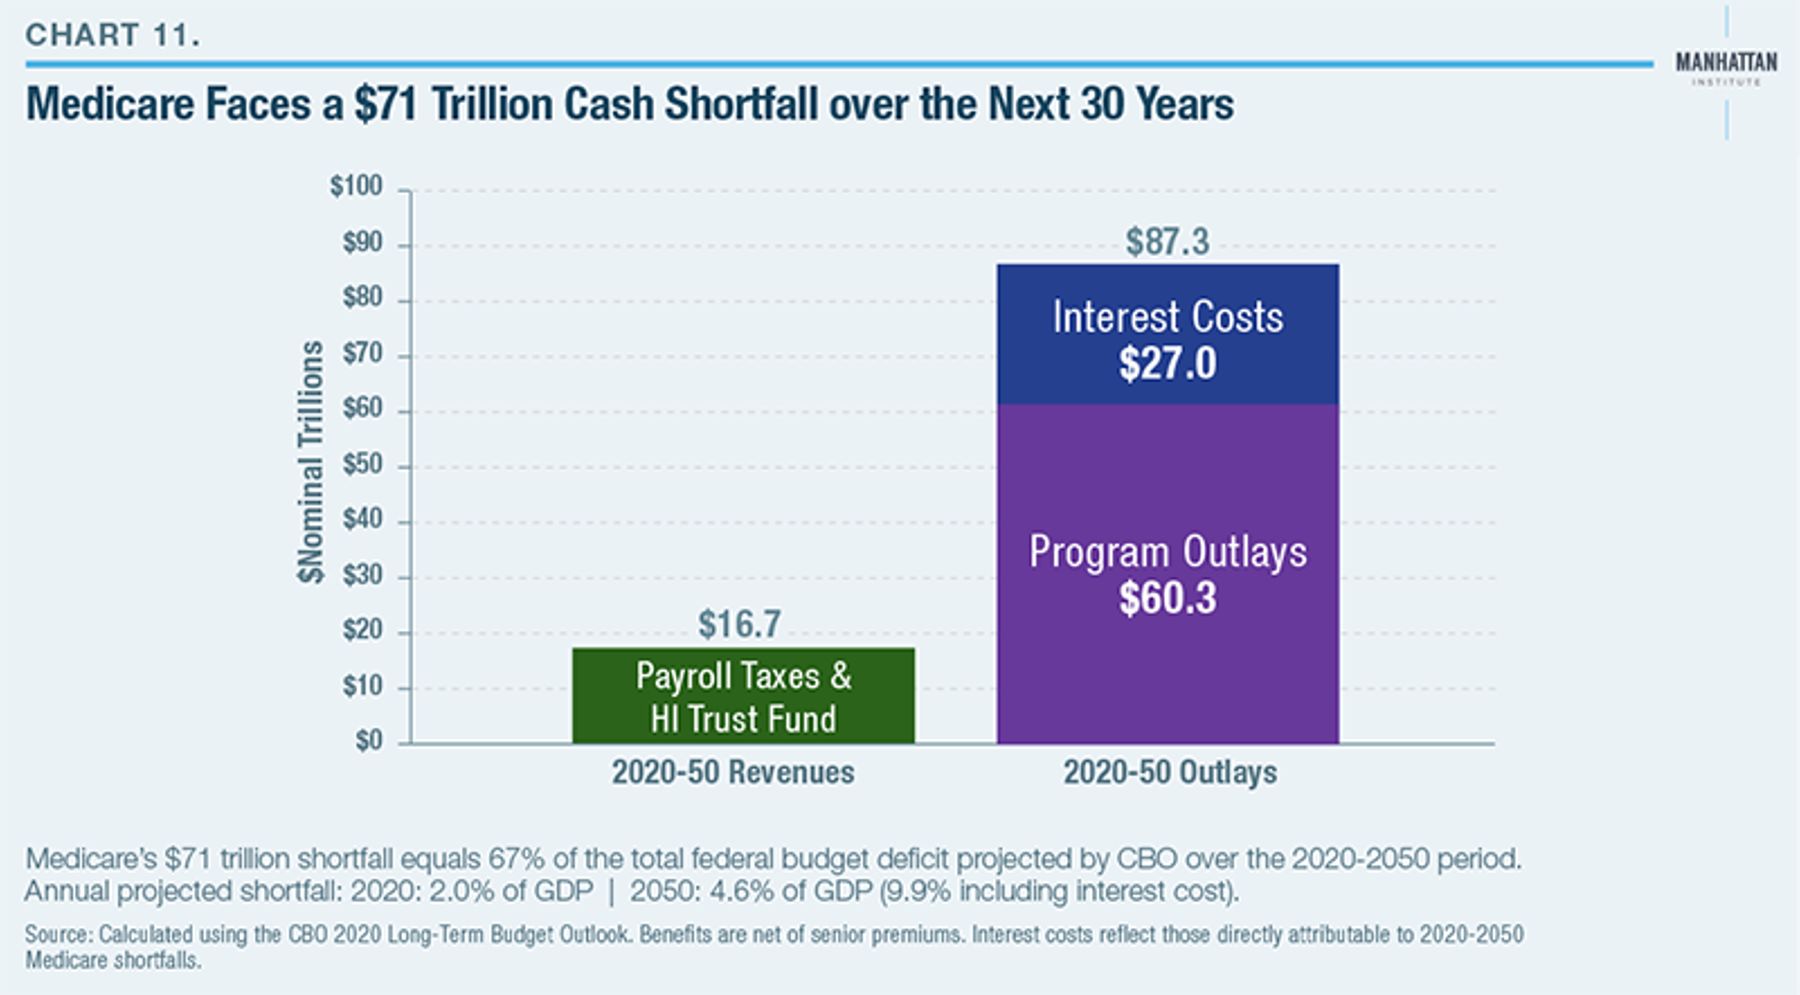
Medicare is in even worse shape. Between 2020 and 2050, it will collect $17 trillion in payroll taxes and other trust-fund revenues and spend $60 trillion in benefits—plus $27 trillion in interest costs.
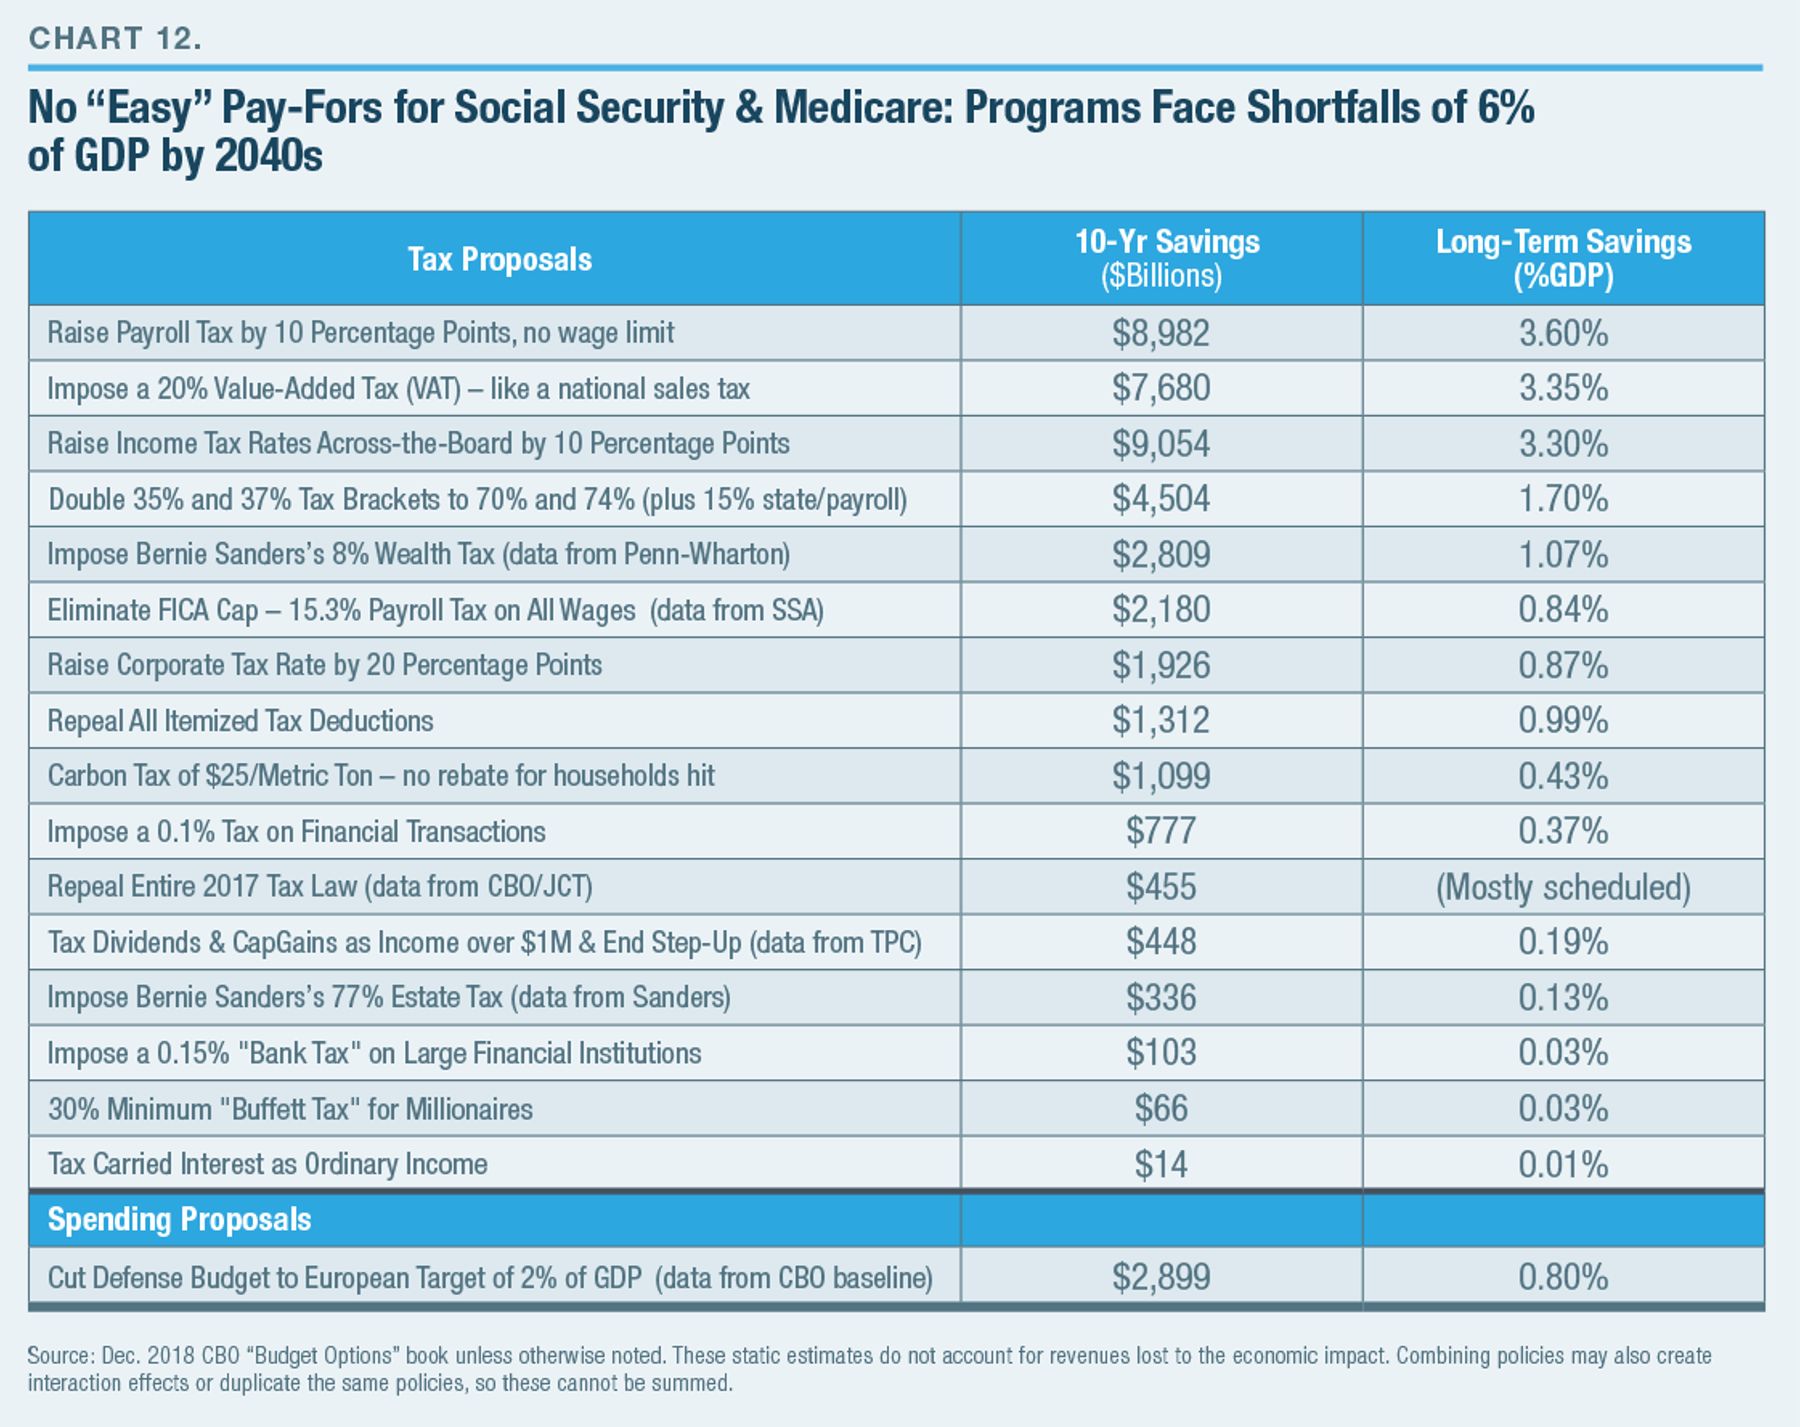
Closing these unsustainable shortfalls will not be easy. Stabilizing the debt as a share of the economy requires a combination of tax increases and program savings that gradually ramp up to 6% of GDP by the 2040s, relative to the baseline spending and revenue levels.5
It is mathematically impossible to achieve more than a small fraction of those savings from the already declining defense and domestic discretionary spending levels. As Chart 12 shows, taxing the rich can close only a small portion of the gap as well. Ultimately, the U.S. faces the same long-term decision as Europe: it can either trim back Social Security and Medicare spending levels, or it must drastically raise middle-class taxes.
ENDNOTES
- Unless stated otherwise, all data in this brief are calculated from “The 2020 Long-Term Budget Outlook,” Congressional Budget Office, Sept. 21, 2020, at https://www.cbo.gov/publication/56516, as well as the supplemental data tables.
- These calculations assume that higher interest rates phase in between 2031 and 2050.
- Brian Riedl, “Why Deficits Still Matter,” Manhattan Institute Issue Brief, Feb. 12, 2020.
- C. Eugene Steuerle and Caleb Quakenbush, “Social Security and Medicare Lifetime Benefits and Taxes: 2017 Update,” Urban Institute, June 5, 2018. Figures in the text reflect Steuerle and Quakenbush’s table 15, for a married couple with two average earners ($102,600 in 2017 dollars).
- For a blueprint of how to produce these savings, see Brian Riedl, “A Comprehensive Federal Budget Plan to Avert a Debt Crisis,” Manhattan Institute, Oct. 10, 2018.
Photo: flavijus/iStock
Are you interested in supporting the Manhattan Institute’s public-interest research and journalism? As a 501(c)(3) nonprofit, donations in support of MI and its scholars’ work are fully tax-deductible as provided by law (EIN #13-2912529).