America’s New Consensus: A National Survey Analysis of the Political and Policy Preferences of Likely 2024 Voters

Photo: EvgeniyShkolenko / iStock / Getty Images Plus
Between July 7th and 13th of 2024, the Manhattan Institute polled a representative sample of 2,100 likely voters across the U.S. on their feelings about elected leaders, the 2024 election, and various social and economic policy issues.
The survey was conducted based on a sample drawn from a national voter file, then weighted to match the population on gender, age, college education, partisanship, race, and 2020 vote. Responses were collected using mixed methods, including a mix of SMS-to-web and online outreach. The poll’s margin of error is 2.7%.
This week, as the Republican National Convention ushers the GOP and their ticket of former President Donald Trump and Senator JD Vance into the final stretch of the 2024 election, we find Trump with something unseen for Republicans in decades: a healthy polling lead in July. Although there is still time for things to shift and Trump still polls below 50% in this survey, his lead is strong and includes a sizable advantage among independent voters. Notably, MI fielded this survey prior to the former president’s near-assassination, and historically, assassination attempts have sometimes boosted the political standing of presidents. Regarding the sitting president, voters have deep concerns with Joe Biden’s cognitive capacity and a majority believe it is unclear who is really running the country day-to-day.
On the issues, Trump leads in the core policy debates that define the election, immigration and the economy, leaving little room for Biden to maneuver. The Biden campaign’s efforts to center the election on abortion and democracy—issues on which we find that the president does hold an advantage over his opponent—do not appear to meaningfully erode Trump’s edge.
A new American policy consensus is emerging. It is one that remains inclined toward supply-side solutions on economic issues, but hostile toward changes to the country’s largest entitlement programs. The new consensus is vigorously opposed to any continued tolerance of illegal immigration, but open to a merit-based immigration system that rewards the highly skilled. And on social issues, well, it depends. While most voters signal support for left-leaning policy prescriptions on abortion and gun control, a clear majority of likely voters indicates conservative preferences on other social issues. These include an intense skepticism regarding gender transition treatments for minors, support for ending racial favoritism to move toward colorblind equality, and a wholesale embrace of tough-on-crime policing and prosecution.
Full Results Available: Toplines, Crosstabs
Presidential Contest
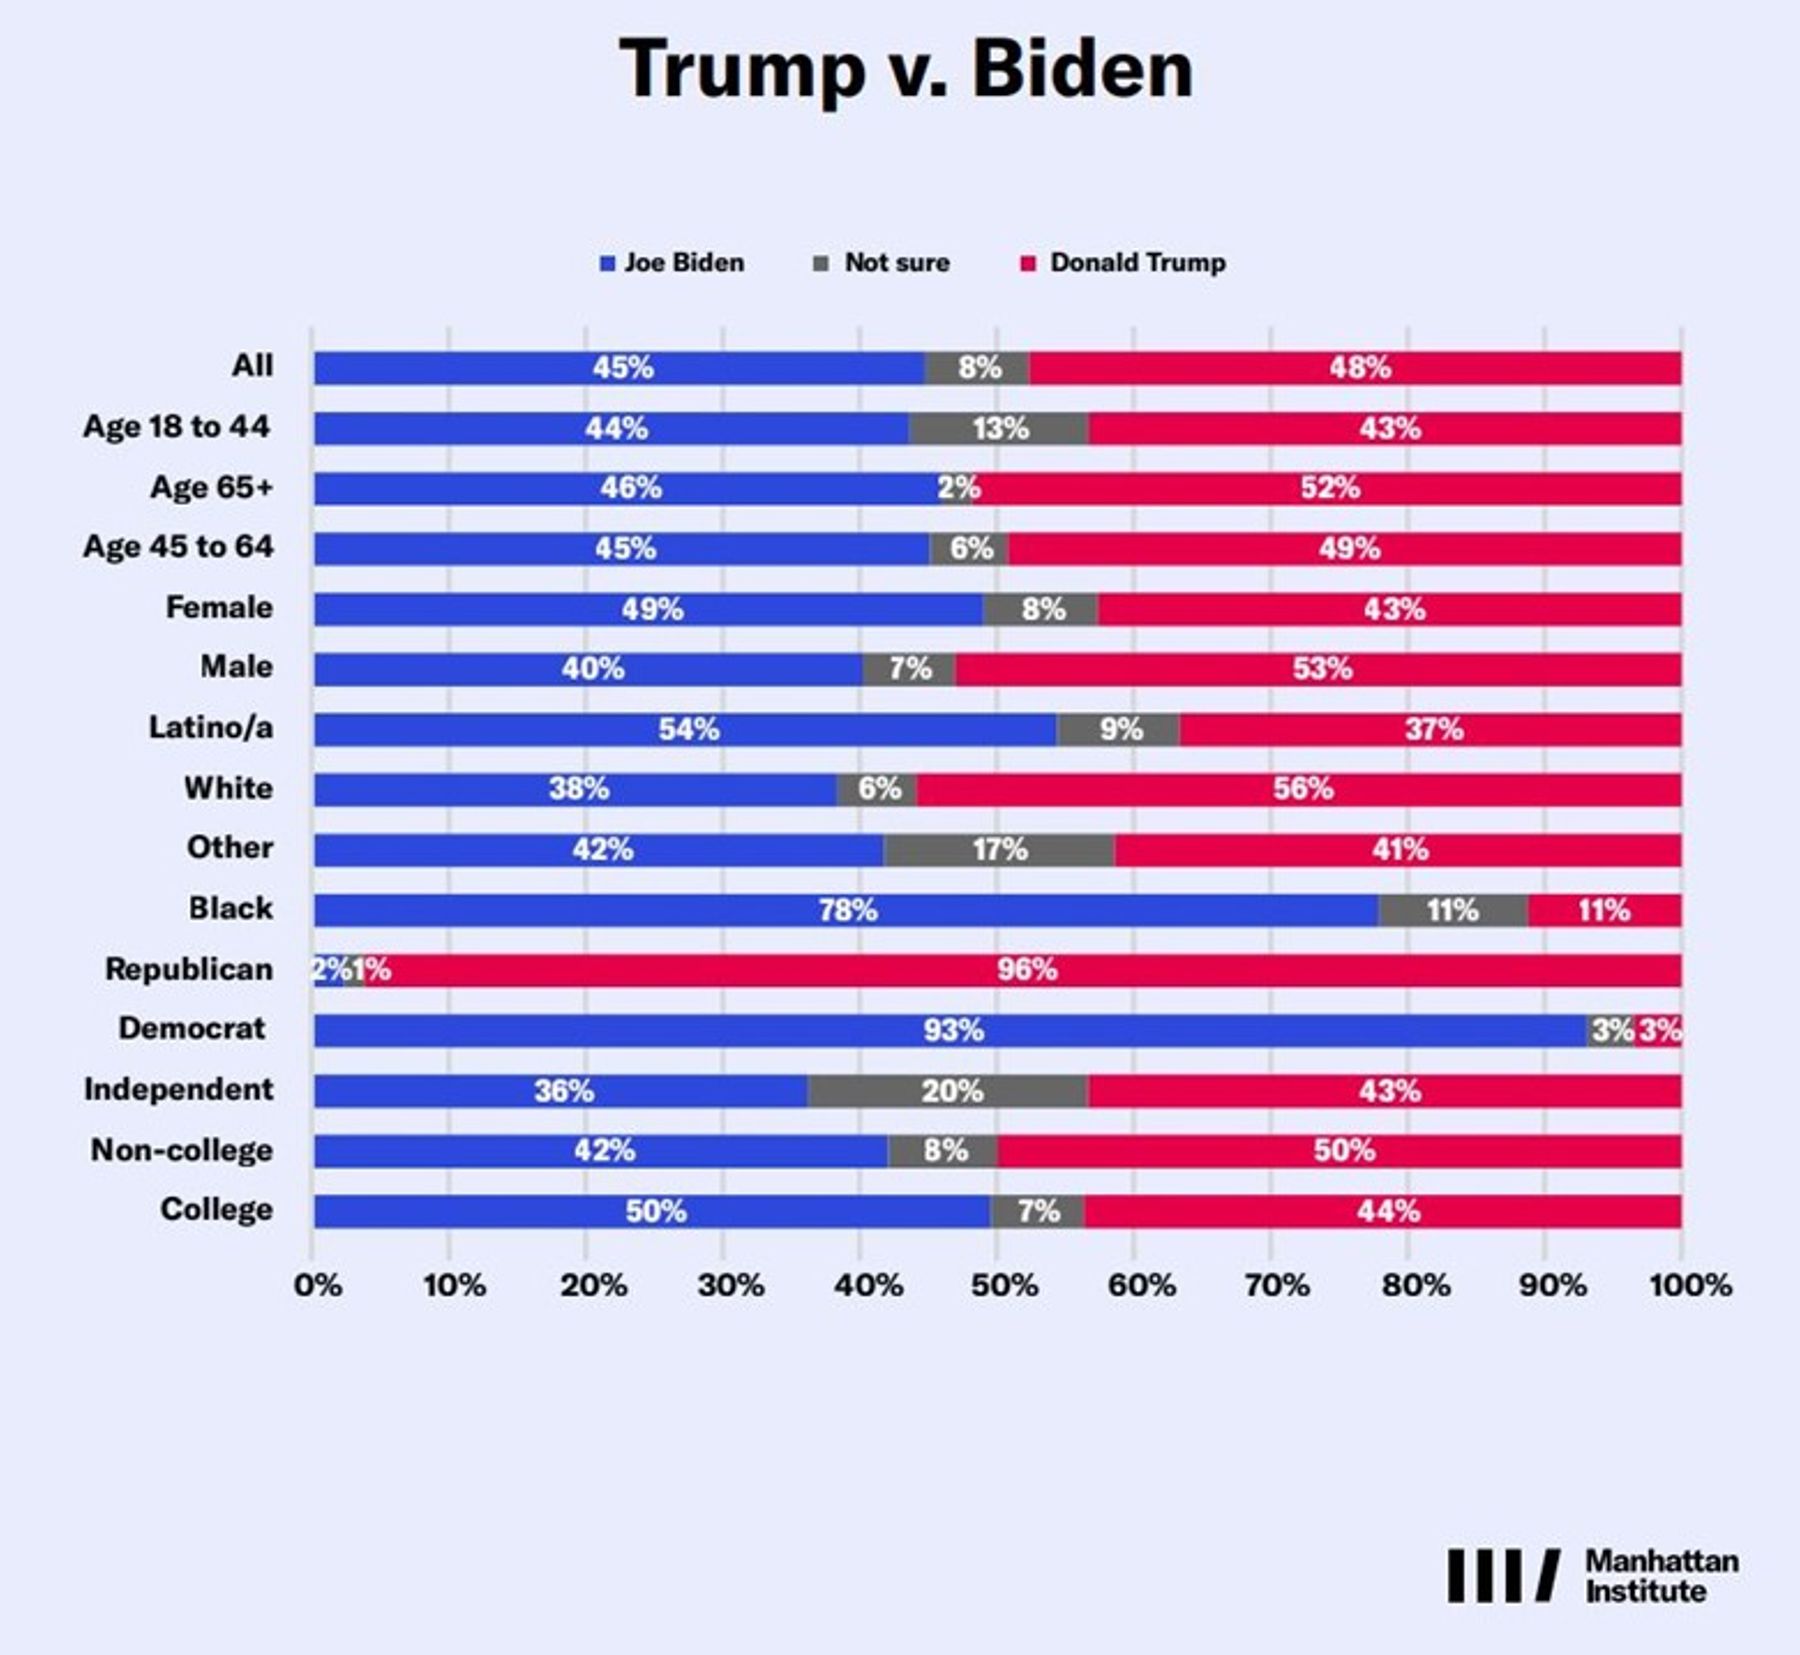
Our poll finds that, overall, Trump leads President Biden in the 2024 presidential race (Figure 1). He also bests high-profile Democrats who could be substituted in for their party’s nomination, like Vice President Kamala Harris or Michigan Governor Gretchen Whitmer. Consistent with other polling, Harris (46% Harris, 48% Trump) and Whitmer (43% Whitmer, 47% Trump) do not significantly out-perform Biden (45% Biden, 48% Trump).
Fifty-two percent of Biden voters say they are voting for him because they trust him to make the right decisions, while 48% say they trust the body of people around him to make the right decisions. For Trump, it is a different story. More than three-quarters of his supporters say they back him because they trust the former president to make the right calls. Less than a quarter say their support is motivated primarily because they have faith in his team.
Figure 1
Presidential Policies
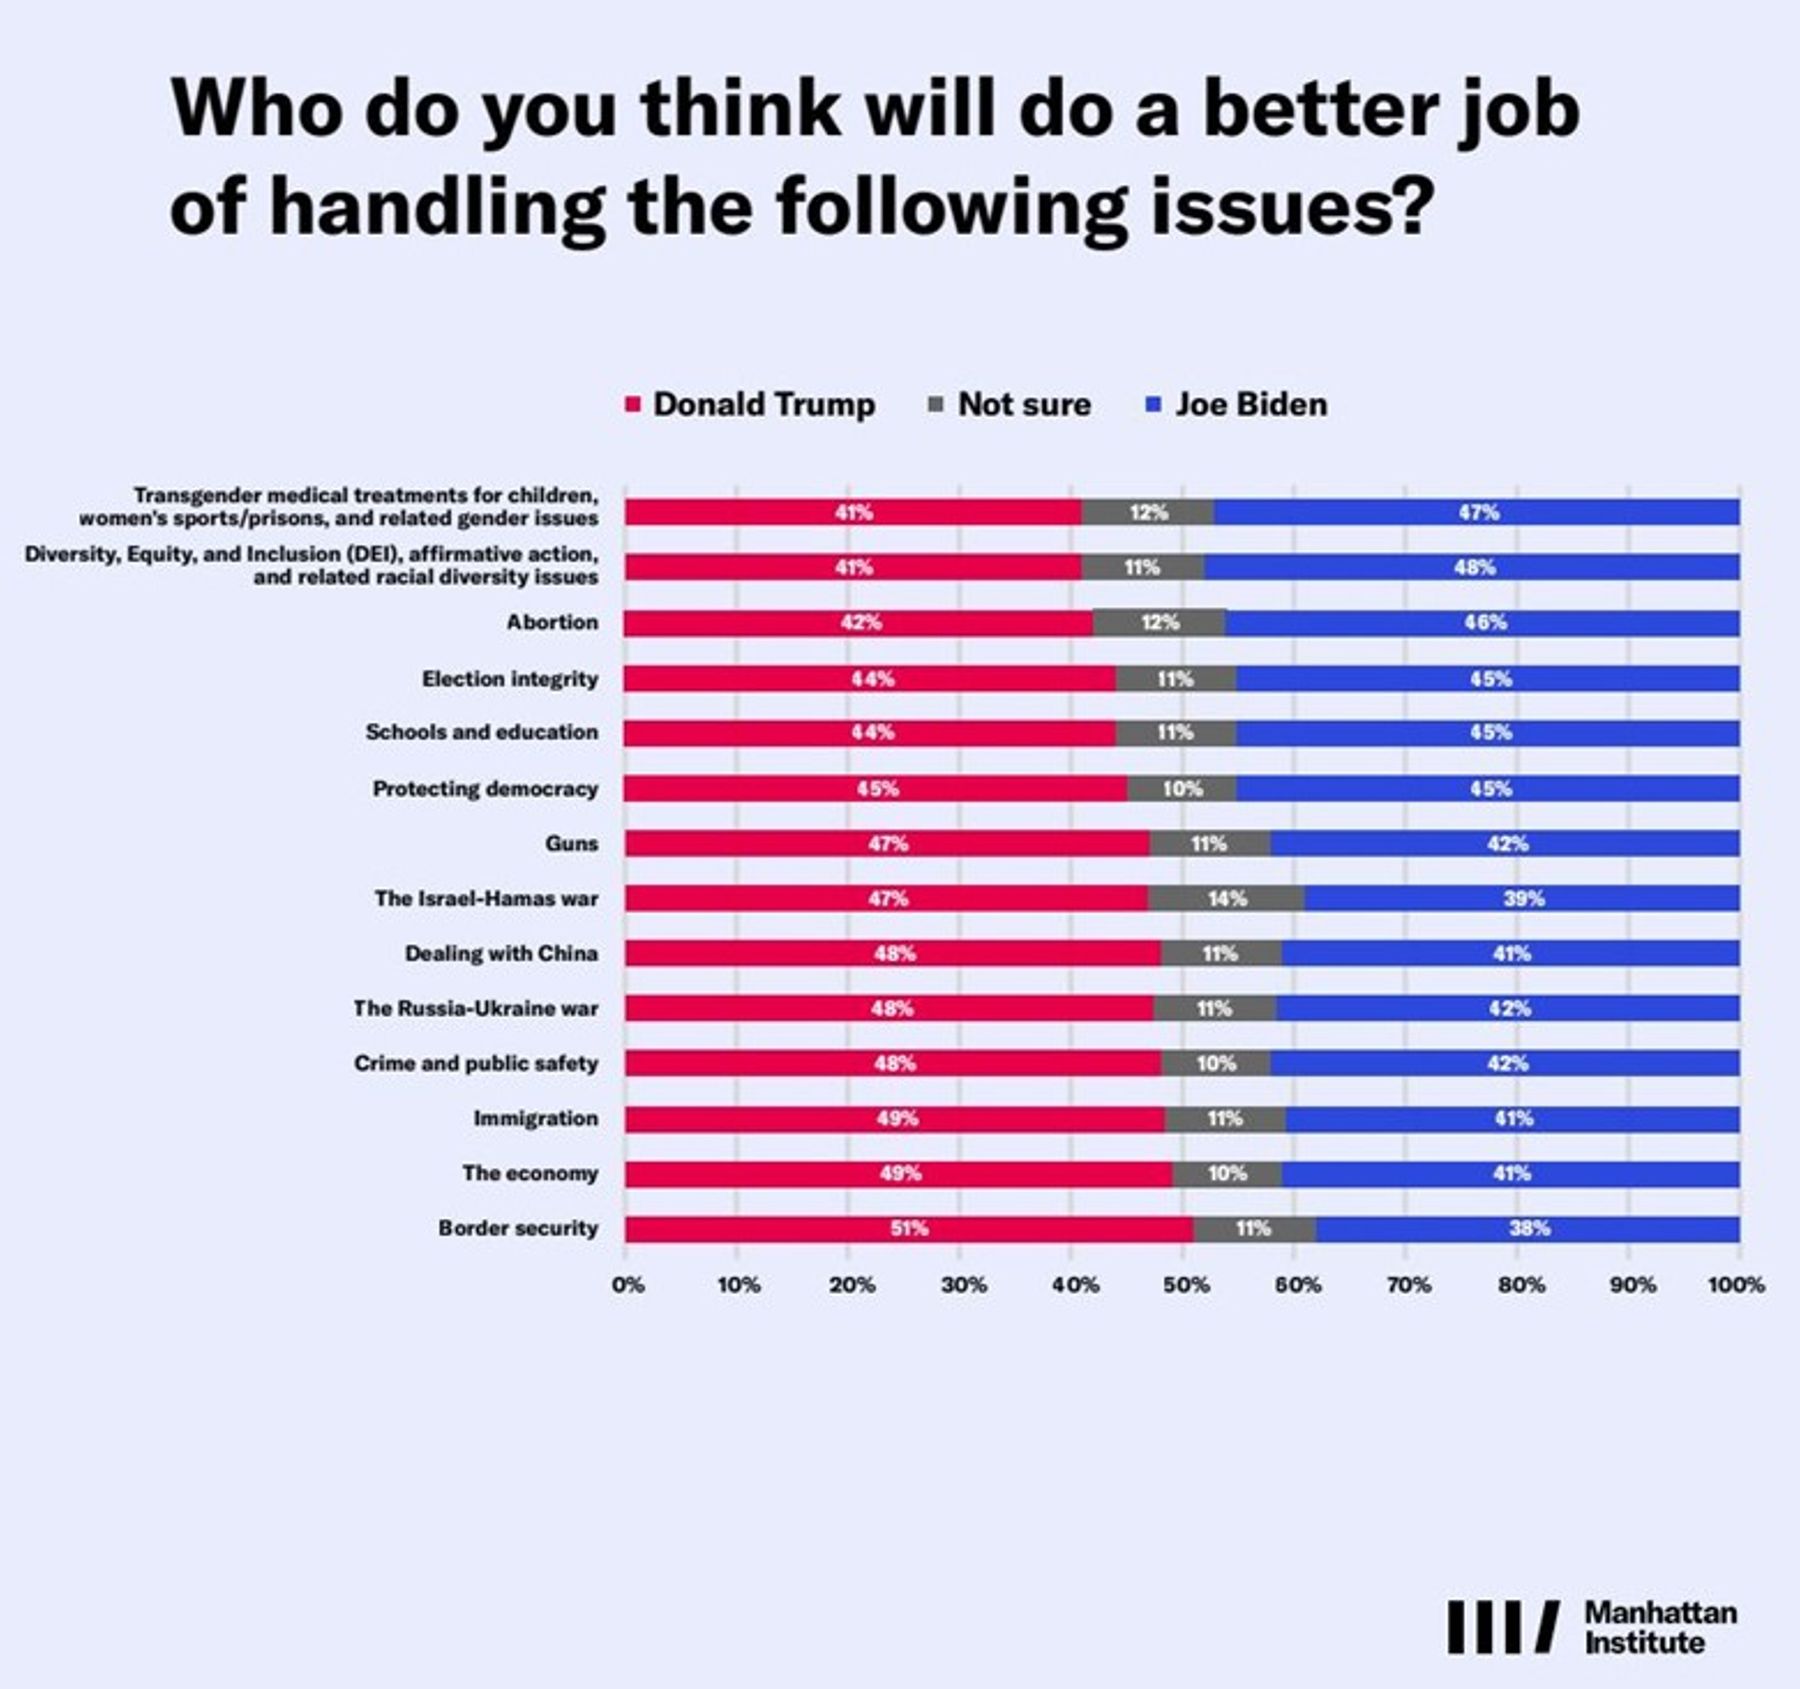
Trump has a wide lead on the issues that have been widely reported as top concerns in 2024: border security (51% Trump to 38% Biden), the economy (49% to 41%), immigration (49% to 41%) and crime (48% to 42%). He lags on abortion (42% to 46%) and election integrity (44% to 45%). Voters indicate they trust Biden over Trump narrowly on matters relating to transgenderism (41% to 47%) and racial diversity (41% to 48%) (Figure 2), but when probed about how they feel about these topics, respondents overwhelmingly express a right-of-center policy perspective. They endorse colorblind meritocracy over race-conscious affirmative action and exhibit intense skepticism with respect to pediatric gender medicine. More on this later.
Figure 2
Looking to the future of the GOP, a majority of Republicans (76%) identify as a supporter of the Make America Great Again (MAGA) movement. Fourteen percent do not, while another 10% say they are unsure. By contrast, 23% of independents and 4% of Democrats say they are MAGA supporters.
Presidential Fitness
Worryingly for Democrats, likely voters have deep concerns about Biden’s cognitive and mental capacities, with a slim majority of independents (54%) reporting that they do not believe he has the mental and cognitive capacities to be president—just one-in-four say the president is up to the job. Only 60% of Democrats believe Biden has the mental and cognitive capacity to be president. On the other hand, the vast majority of Republicans (94%) and a plurality of independents (44%) believe Trump is mentally fit to be commander in chief.
A majority of voters agree that ”it is a major problem that Joe Biden is cognitively impaired because it’s not clear who is running the country,” including 56% of independents. Only 55% of Democrats and 23% of independents agree that Biden is not cognitively impaired and is actually doing the job of running the country.
Crime
We find that the appetite for soft-on-crime policies has diminished significantly from when progressive reform prosecutors were winning elections in cities across the country. Voters, scarred from Covid-era crime increases, want to see policy makers take more aggressive action on public safety measures to bring down crime.
When asked which was more important, reducing crime or reducing mass incarceration, a majority of voters across the partisan spectrum chose reducing crime (62%) over reducing mass incarceration (24%). Even among Democrats, 46% selected reducing crime (only 39% selected reducing mass incarceration). Among black voters, 50% said reducing crime was more important (versus 33% who chose reducing mass incarceration).
Similarly, 57% of voters say the criminal justice system is not tough enough (including 52% of independents, 42% of black voters and 38% of Democrats), while only 11% say it is “too tough” (including 16% of Democrats, 16% of black voters and 14% of independents).
Immigration
Poll respondents view immigration as one of the most important policy topics of the 2024 campaign. Our survey finds that likely voters believe the southern border presents a major crisis and the U.S. needs to deal with the problem of illegal immigration first and foremost. However, we also find evidence that likely voters are open to more high-skilled immigration, particularly for roles that help boost the economy. We also find that policies to prevent those with extreme ideologies from entering the country have robust support.
Sixty percent of likely voters (including 56% of independents and 42% of Latinos) say that illegal immigration and the southern border is a “major” problem and 28% say it is a “minor” problem.
Respondents were divided on how to address immigrants in the country illegally. Forty-five percent of likely voters (including 41% of independents and 32% of Latinos) believe that all or most of the migrants who are in the country illegally should be deported, while 46% believe they should be allowed to stay—20% through a work authorization that stops short of citizenship, and 26% through a pathway to citizenship.
Focusing on legal immigration, only 23% of likely voters support a reduction in legal immigration, while 39% support keeping it at its current level and 24% support increasing it. Latinos are split (24% increase, 40% the same, 22% decrease) at roughly the same level as the population as a whole.
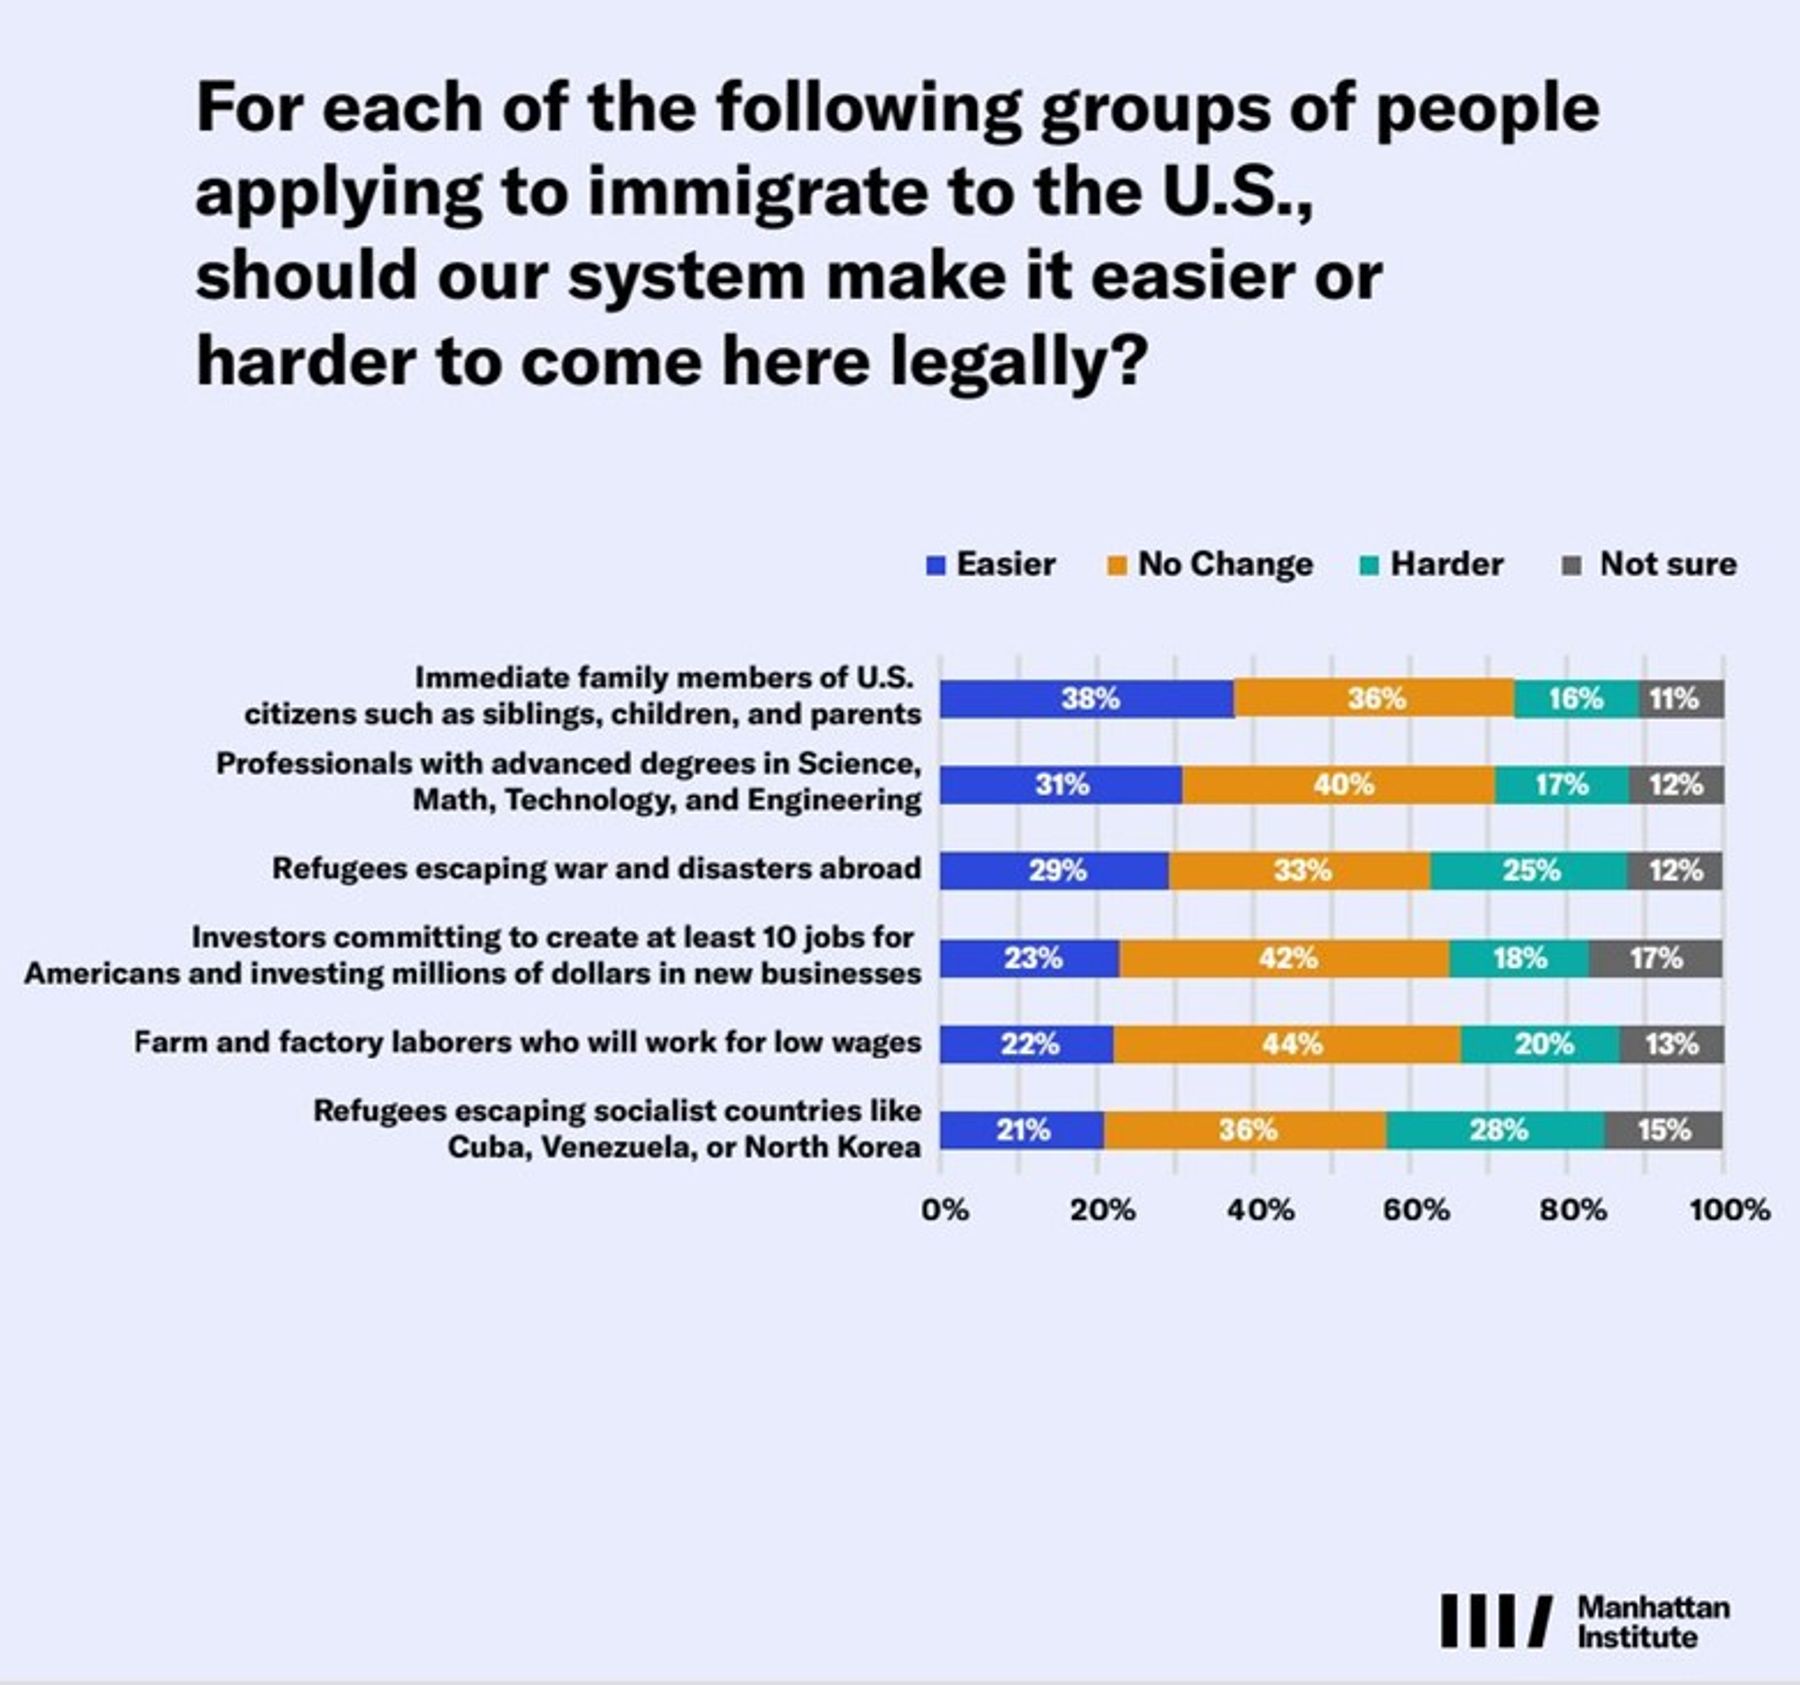
We find that high-skilled immigration has popular support, while other forms of immigration are viewed more skeptically by likely voters (Figure 3). Our respondents are amenable to increasing high-skilled legal immigration—admitting immigrants with advanced degrees or extensive experience, like engineers and doctors (32% increase, 43% maintain the same, 11% decrease). However, they are more skeptical when it comes to low-skilled legal immigration—admitting people without advanced degrees or extensive experience, like farm laborers and factory workers (19% increase, 44% maintain the same, 22% decrease).
Figure 3
The most important factor for determining who should be allowed into the country was that they would not need to rely on public welfare benefits (29%), followed closely by eagerness to integrate into American society (24%).
On the issue of immigration more broadly, most likely voters say better border security and stronger enforcement of our immigration laws (54% of all likely voters, 50% of independents) should be a higher priority than creating a way for illegal immigrants already in the U.S. to become citizens if they meet certain requirements (37% of all likely voters, 37% of independents).
Respondents support policies to prevent Hamas supporters and others with hateful ideologies from immigrating to the United States. For instance, 62% of likely voters (57% of independents) support mandating that consulates ask about Hamas and ISIS during visa applications. Voters also support (61% overall and 55% of independents) including anti-Semitic activities as a criterion for inadmissibility, barring those who had conducted anti-Semitic activity from being eligible for citizenship.
Guns
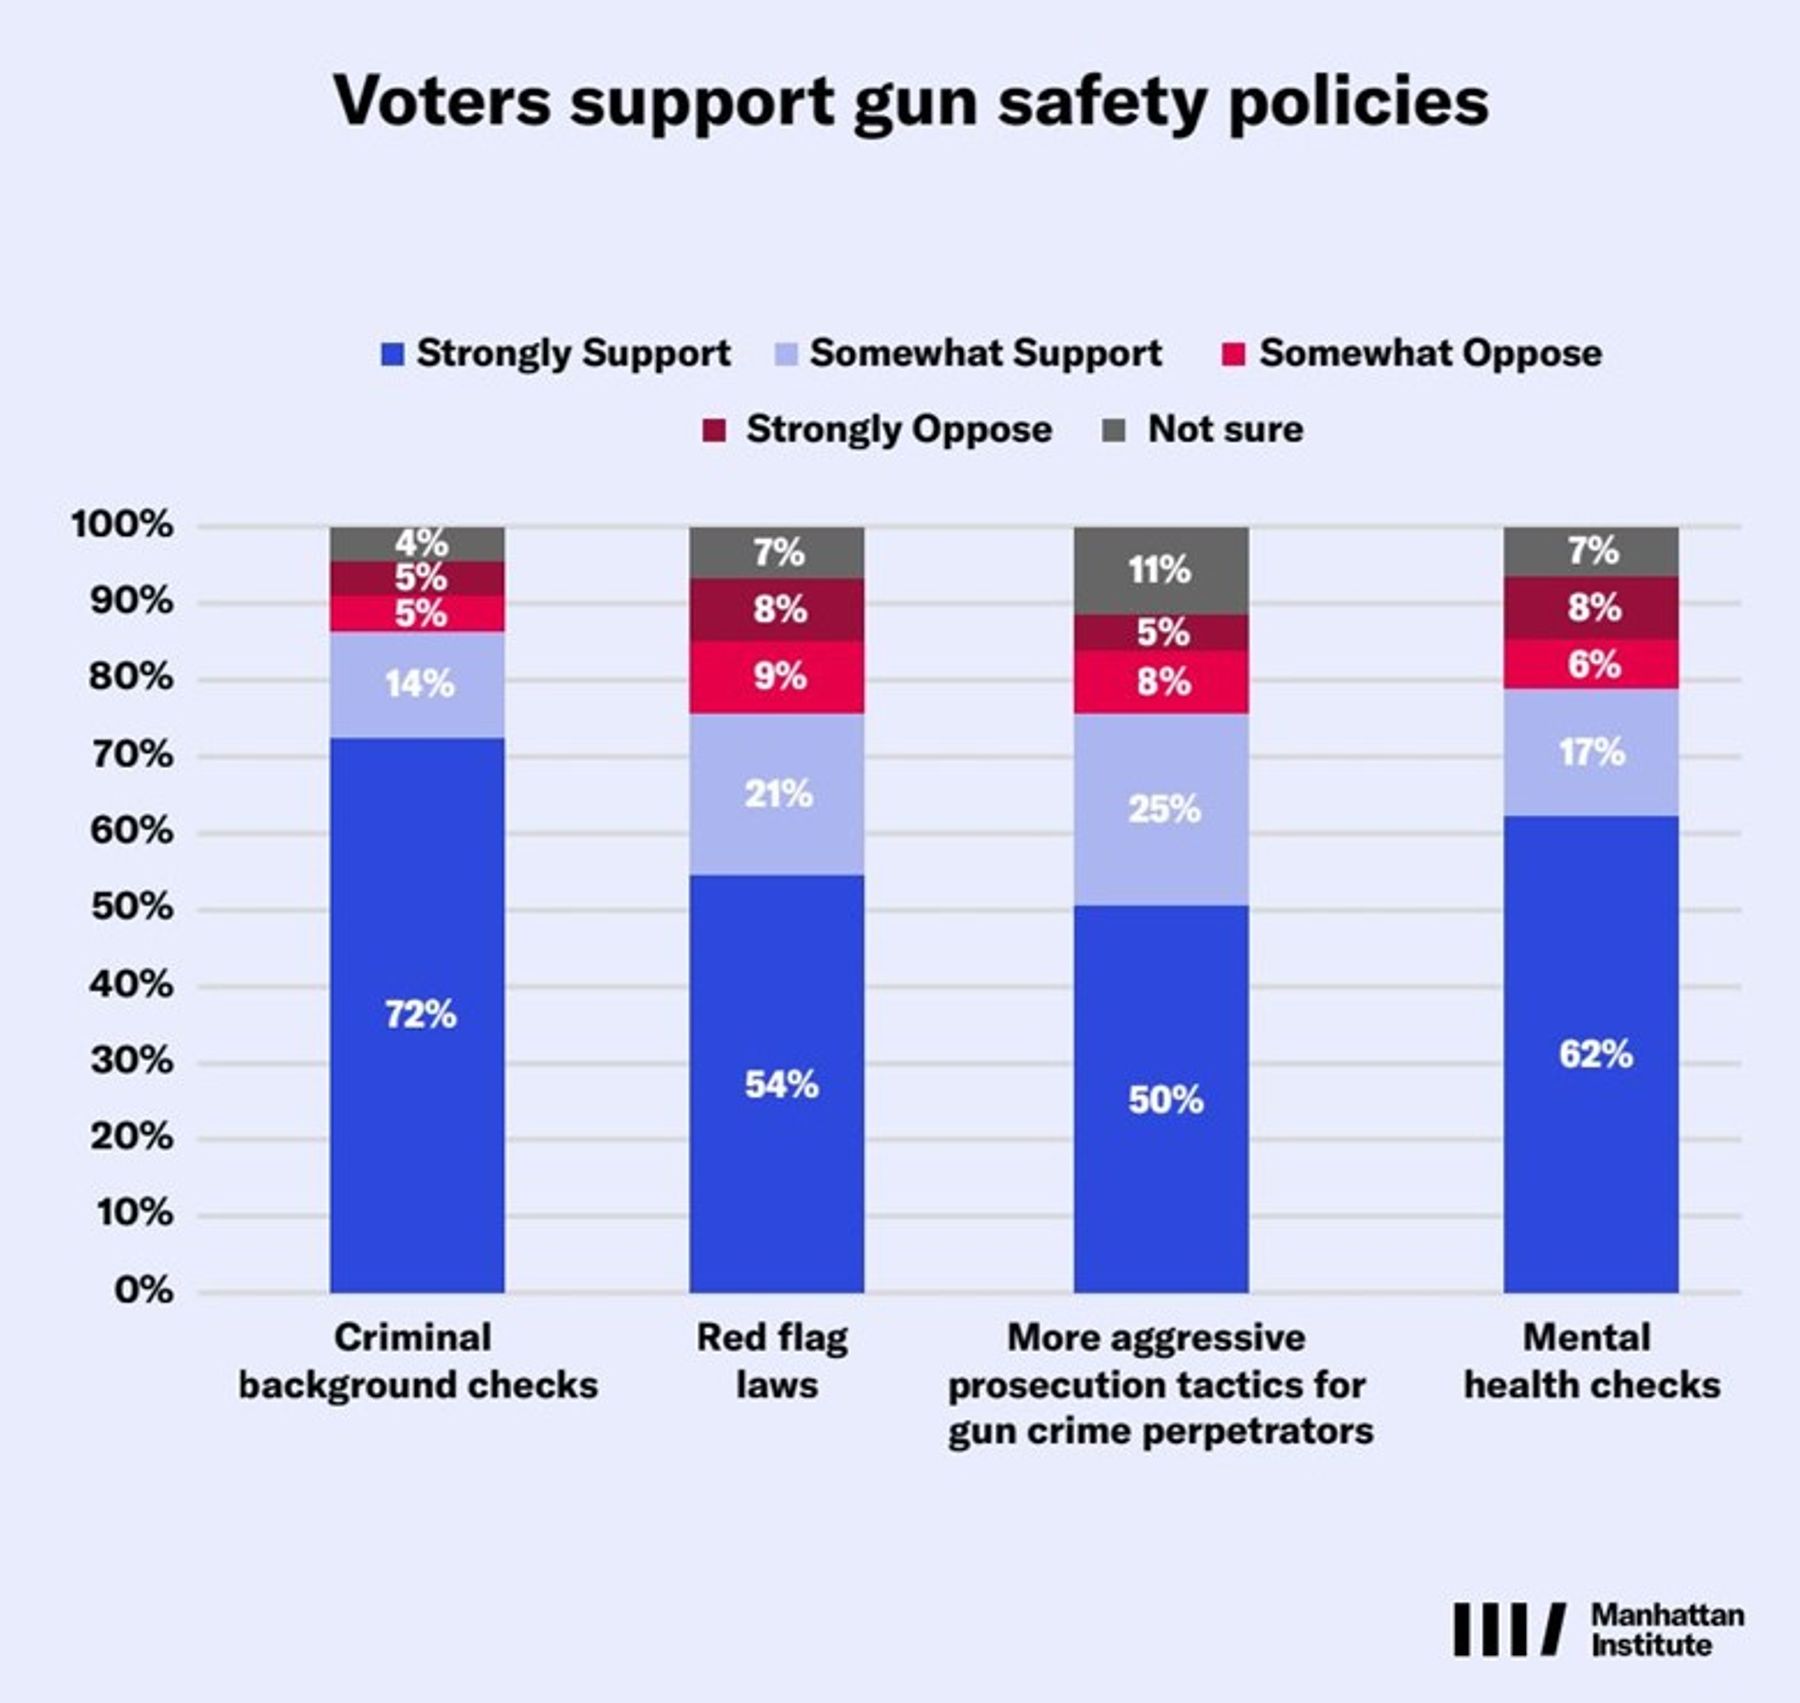
Voters of all political stripes support toughening certain gun laws and their enforcement (Figure 4). They support requiring criminal background checks on all gun buyers (86% support, 9% oppose), implementing red flag laws (76% support, 18% oppose), employing more aggressive prosecution tactics in dealing with perpetrators of gun crimes (76% support, 13% oppose), and mandating mental health checks on gun buyers (79% support, 15% oppose).
Figure 4
Abortion
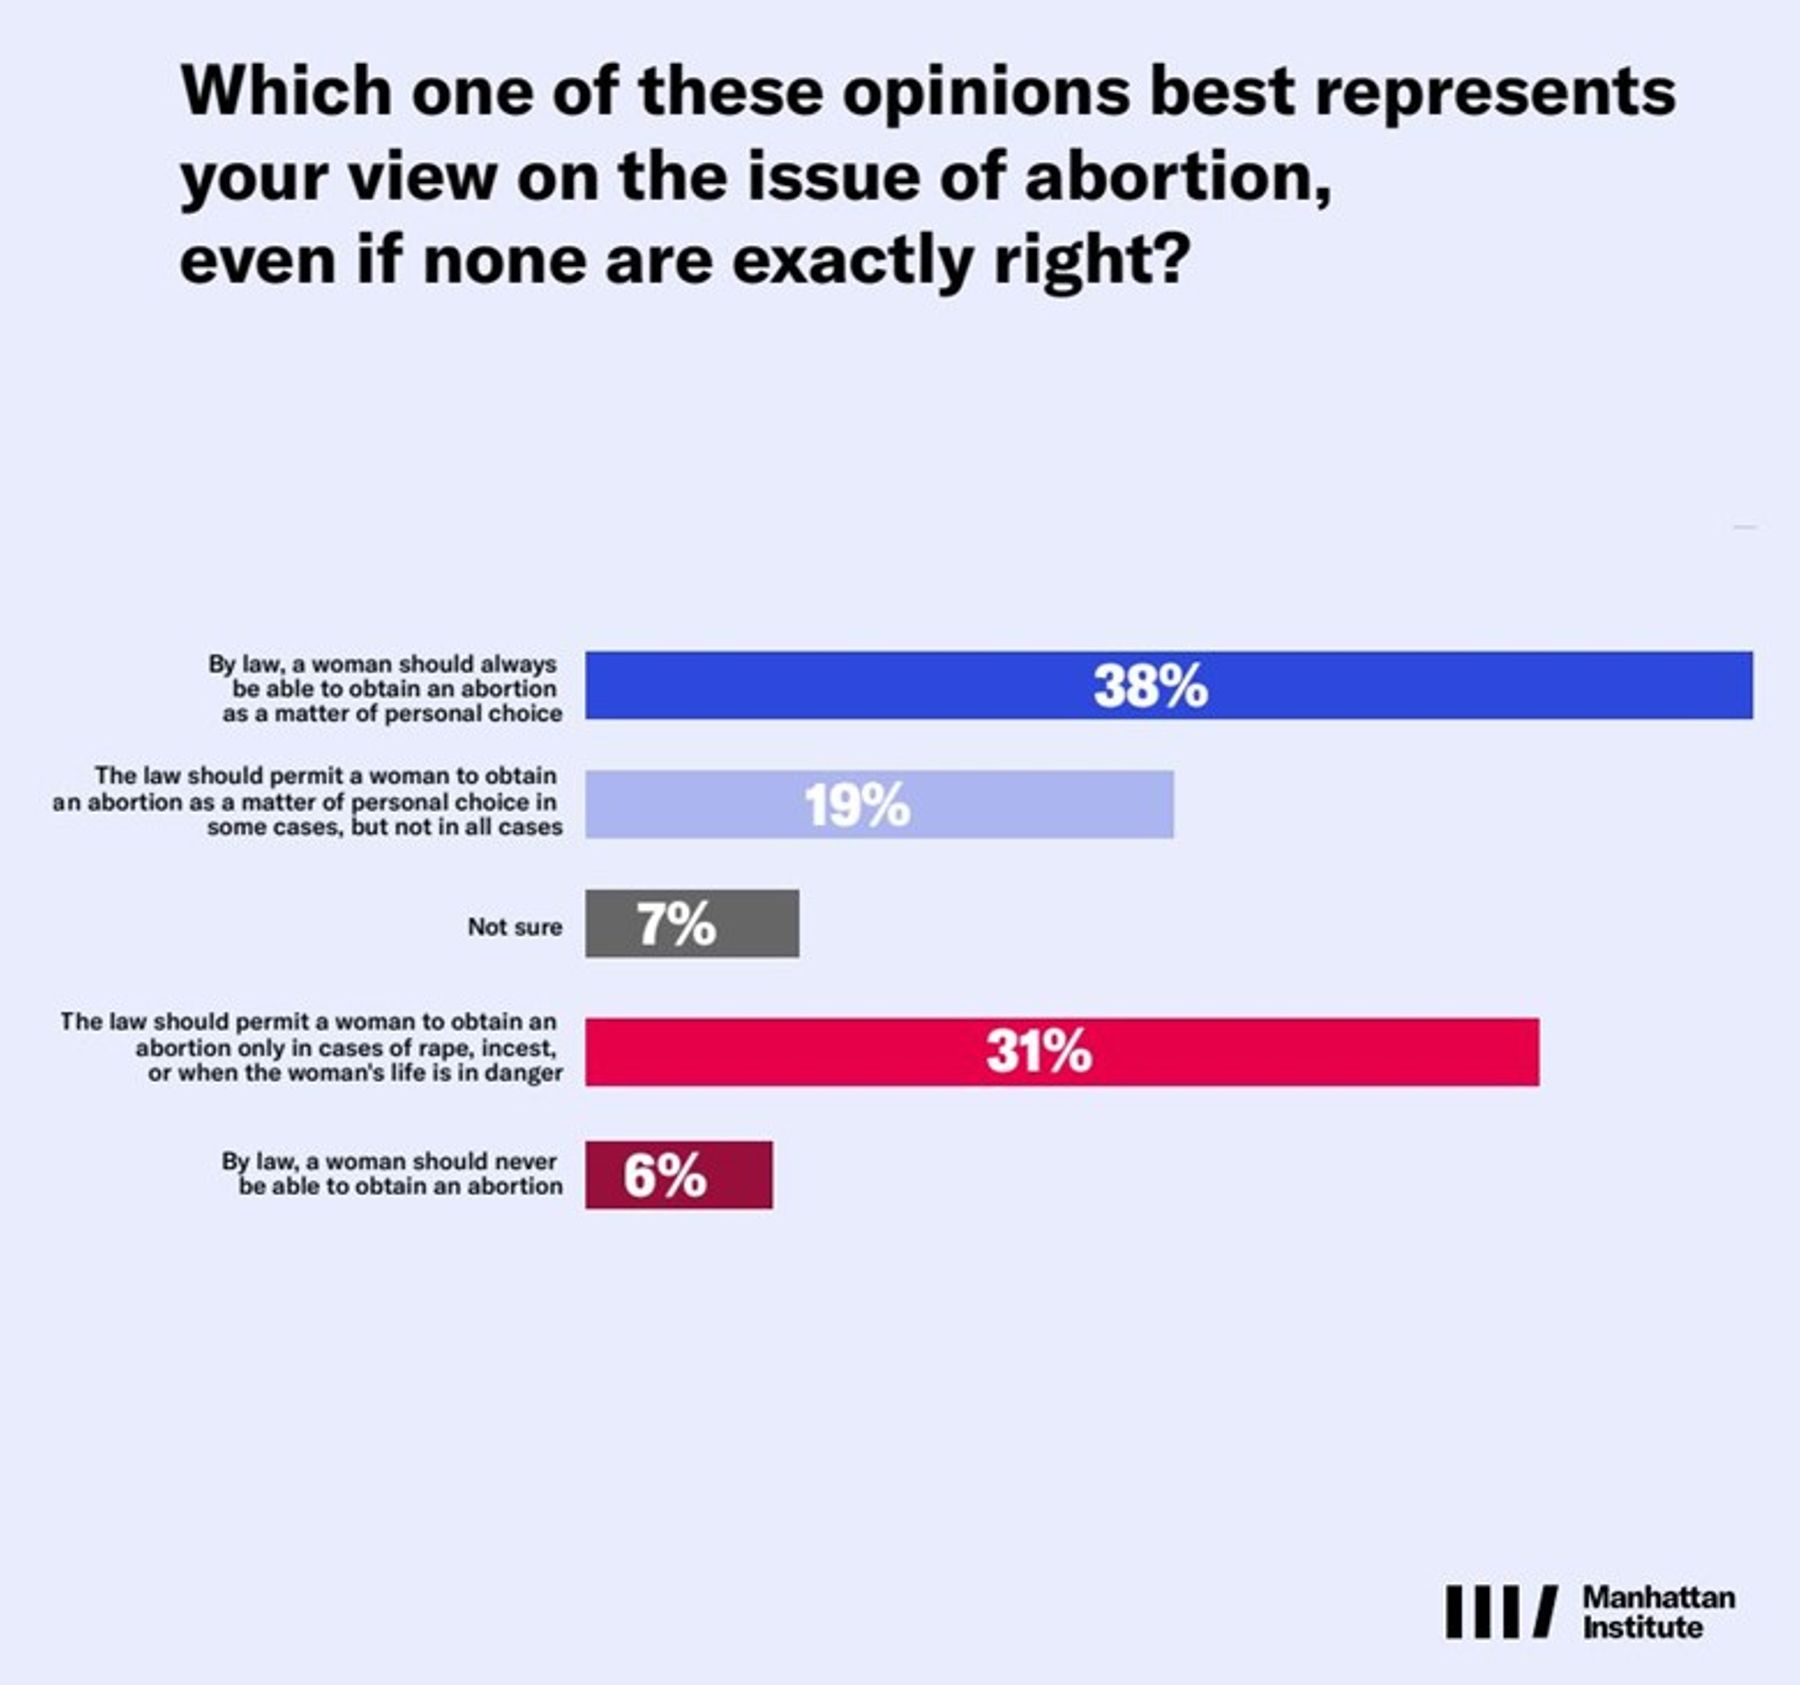
The Supreme Court’s Dobbs decision to kick abortion laws back to the states reignited a conversation about abortion, particularly among social conservatives. Our poll finds that there are clear areas where social conservatives can win, but must tread carefully because likely voters identify with many pro-choice positions.
The majority of likely voters identify as generally pro-choice (52% total, including 50% of independents), with around a third (37% total, 34% of independents) as pro-life. Latinos are split (44% pro-choice to 42% pro-life). However, few Americans are ardently pro-choice in the sense that only 38% say abortion should “always” be allowed (37% of independents) as a matter of personal choice (Figure 5).
Figure 5
Voters—including large majorities of Republicans—support new federal laws to make in vitro fertilization (IVF) (68% support, 15% oppose) and contraception (77% support, 15% oppose) legal nationwide by wide margins. We also find interesting bipartisan support for the Swedish model of abortion up until the 18th week of pregnancy at the request of the woman, with abortions afterwards being approved by the National Board of Health and Welfare. This model was supported by 47% of Democrats, 53% of independents and 46% of Republicans.
Transgenderism
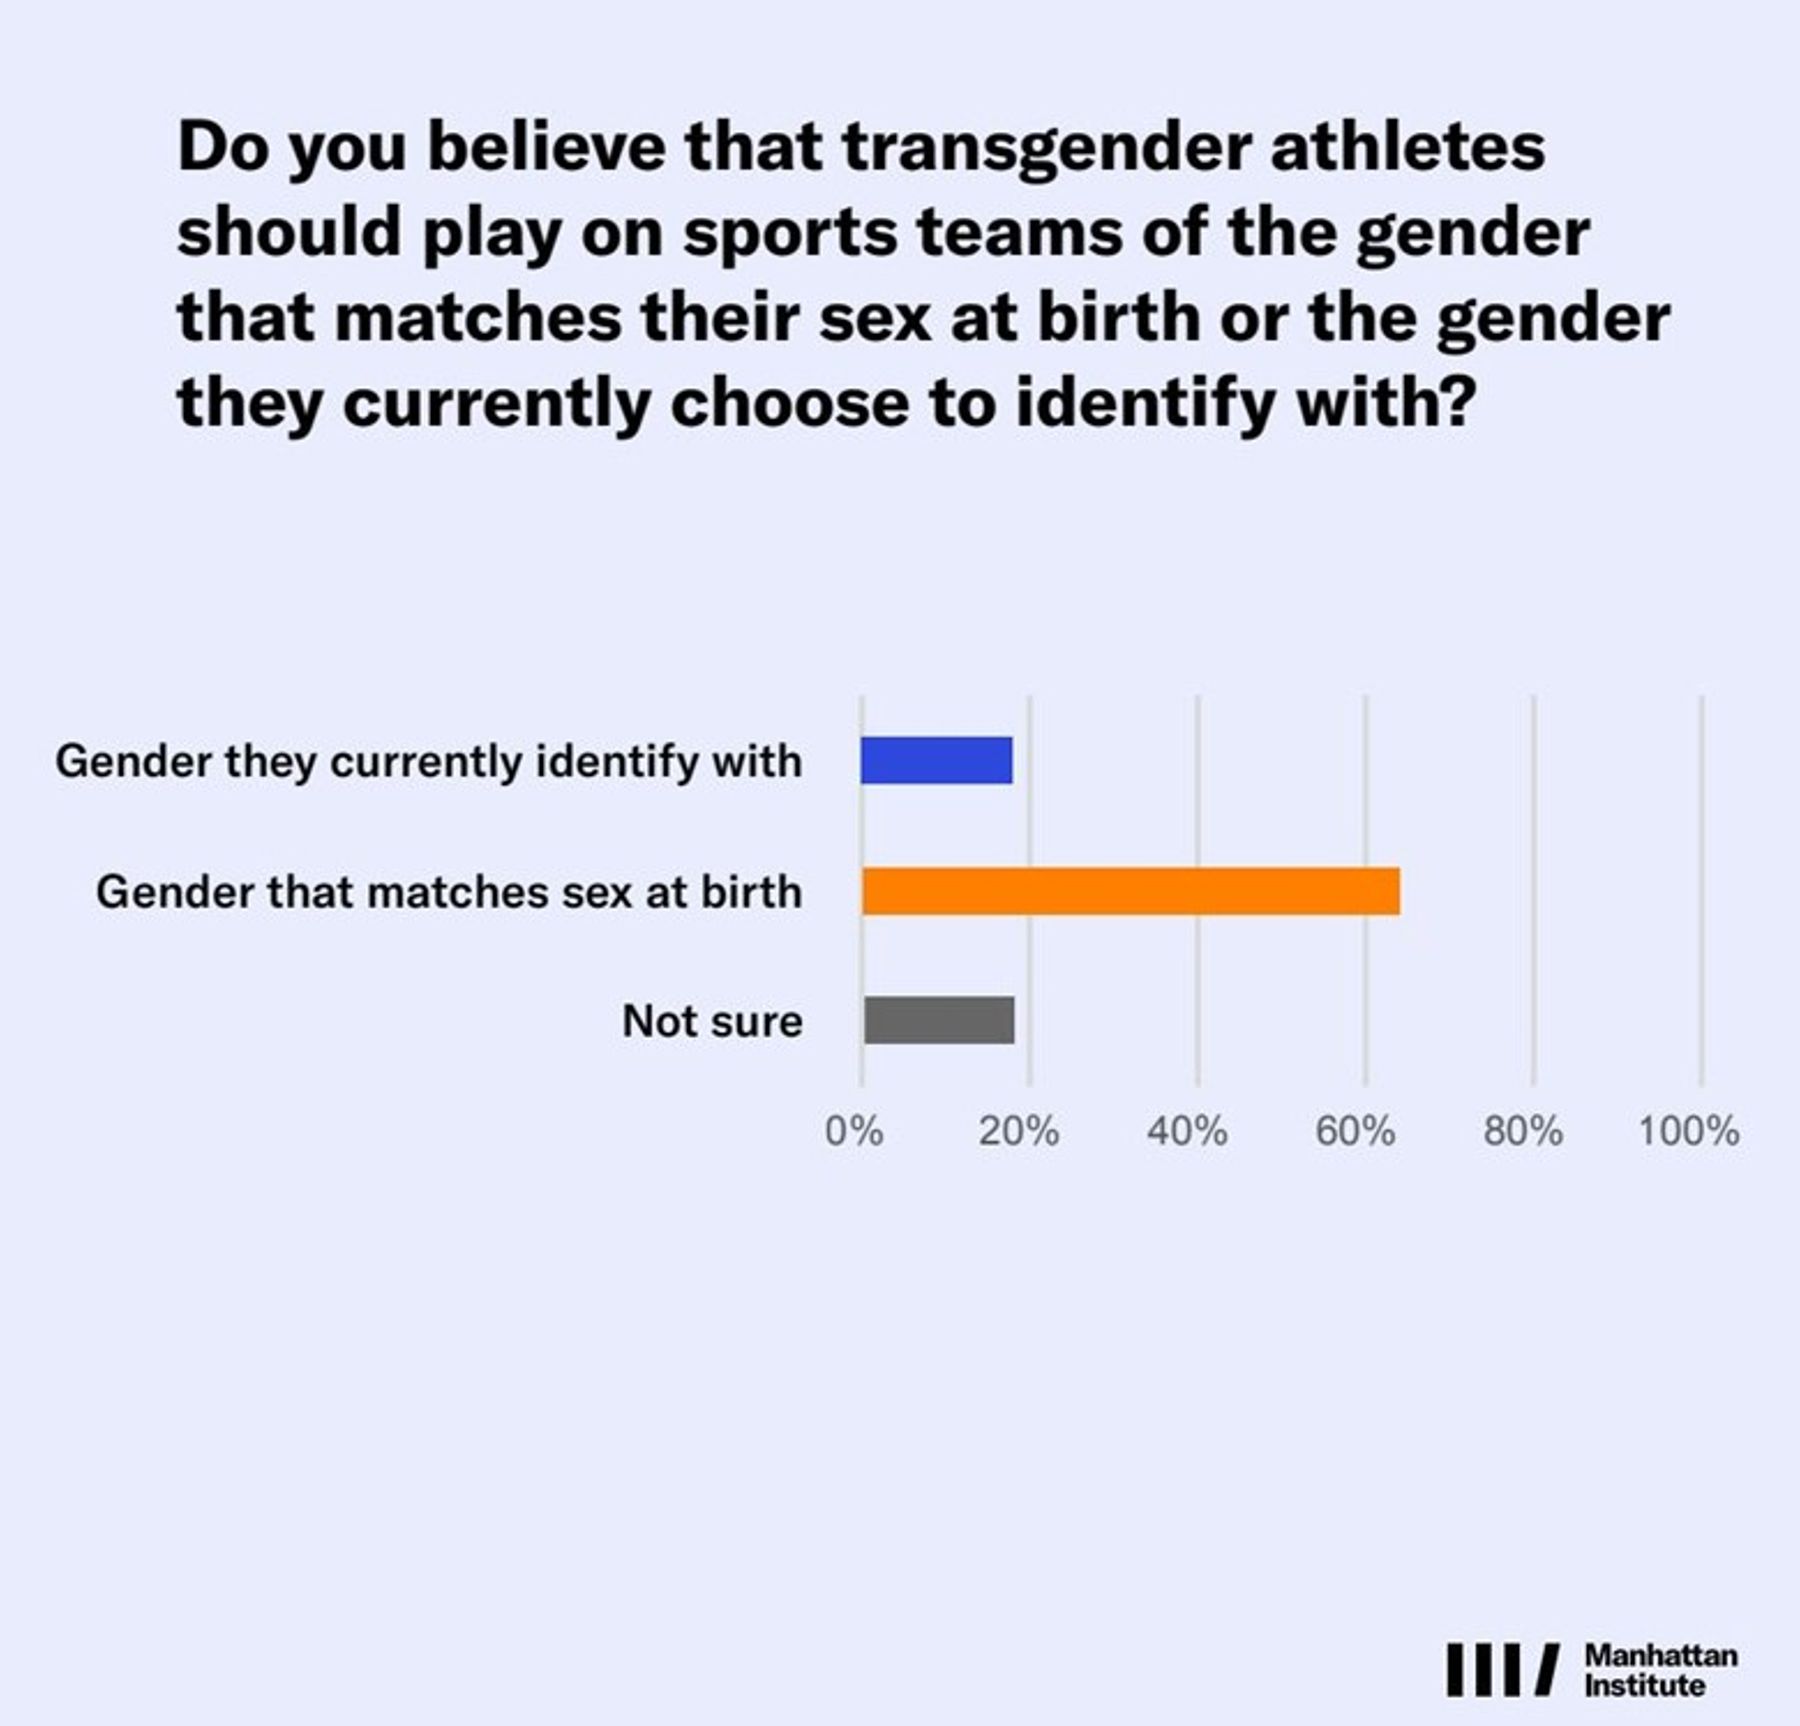
Transgender issues, particularly relating to children and sports teams have become an increasingly salient issue for voters. Social conservatives have the upper hand on the matter, with independents, black and Latino voters consistently siding with those who are concerned that important, life-changing decisions about gender are being made too early in a child’s life.
A strong majority of likely voters believe that trans athletes should play on a team that matches their sex at birth (64%) rather than the gender they identify with (18%) (Figure 6). This includes a 64%–15% majority of independents, 41%–31% plurality of Democrats, and 50%–21% majority of black voters.
Figure 6
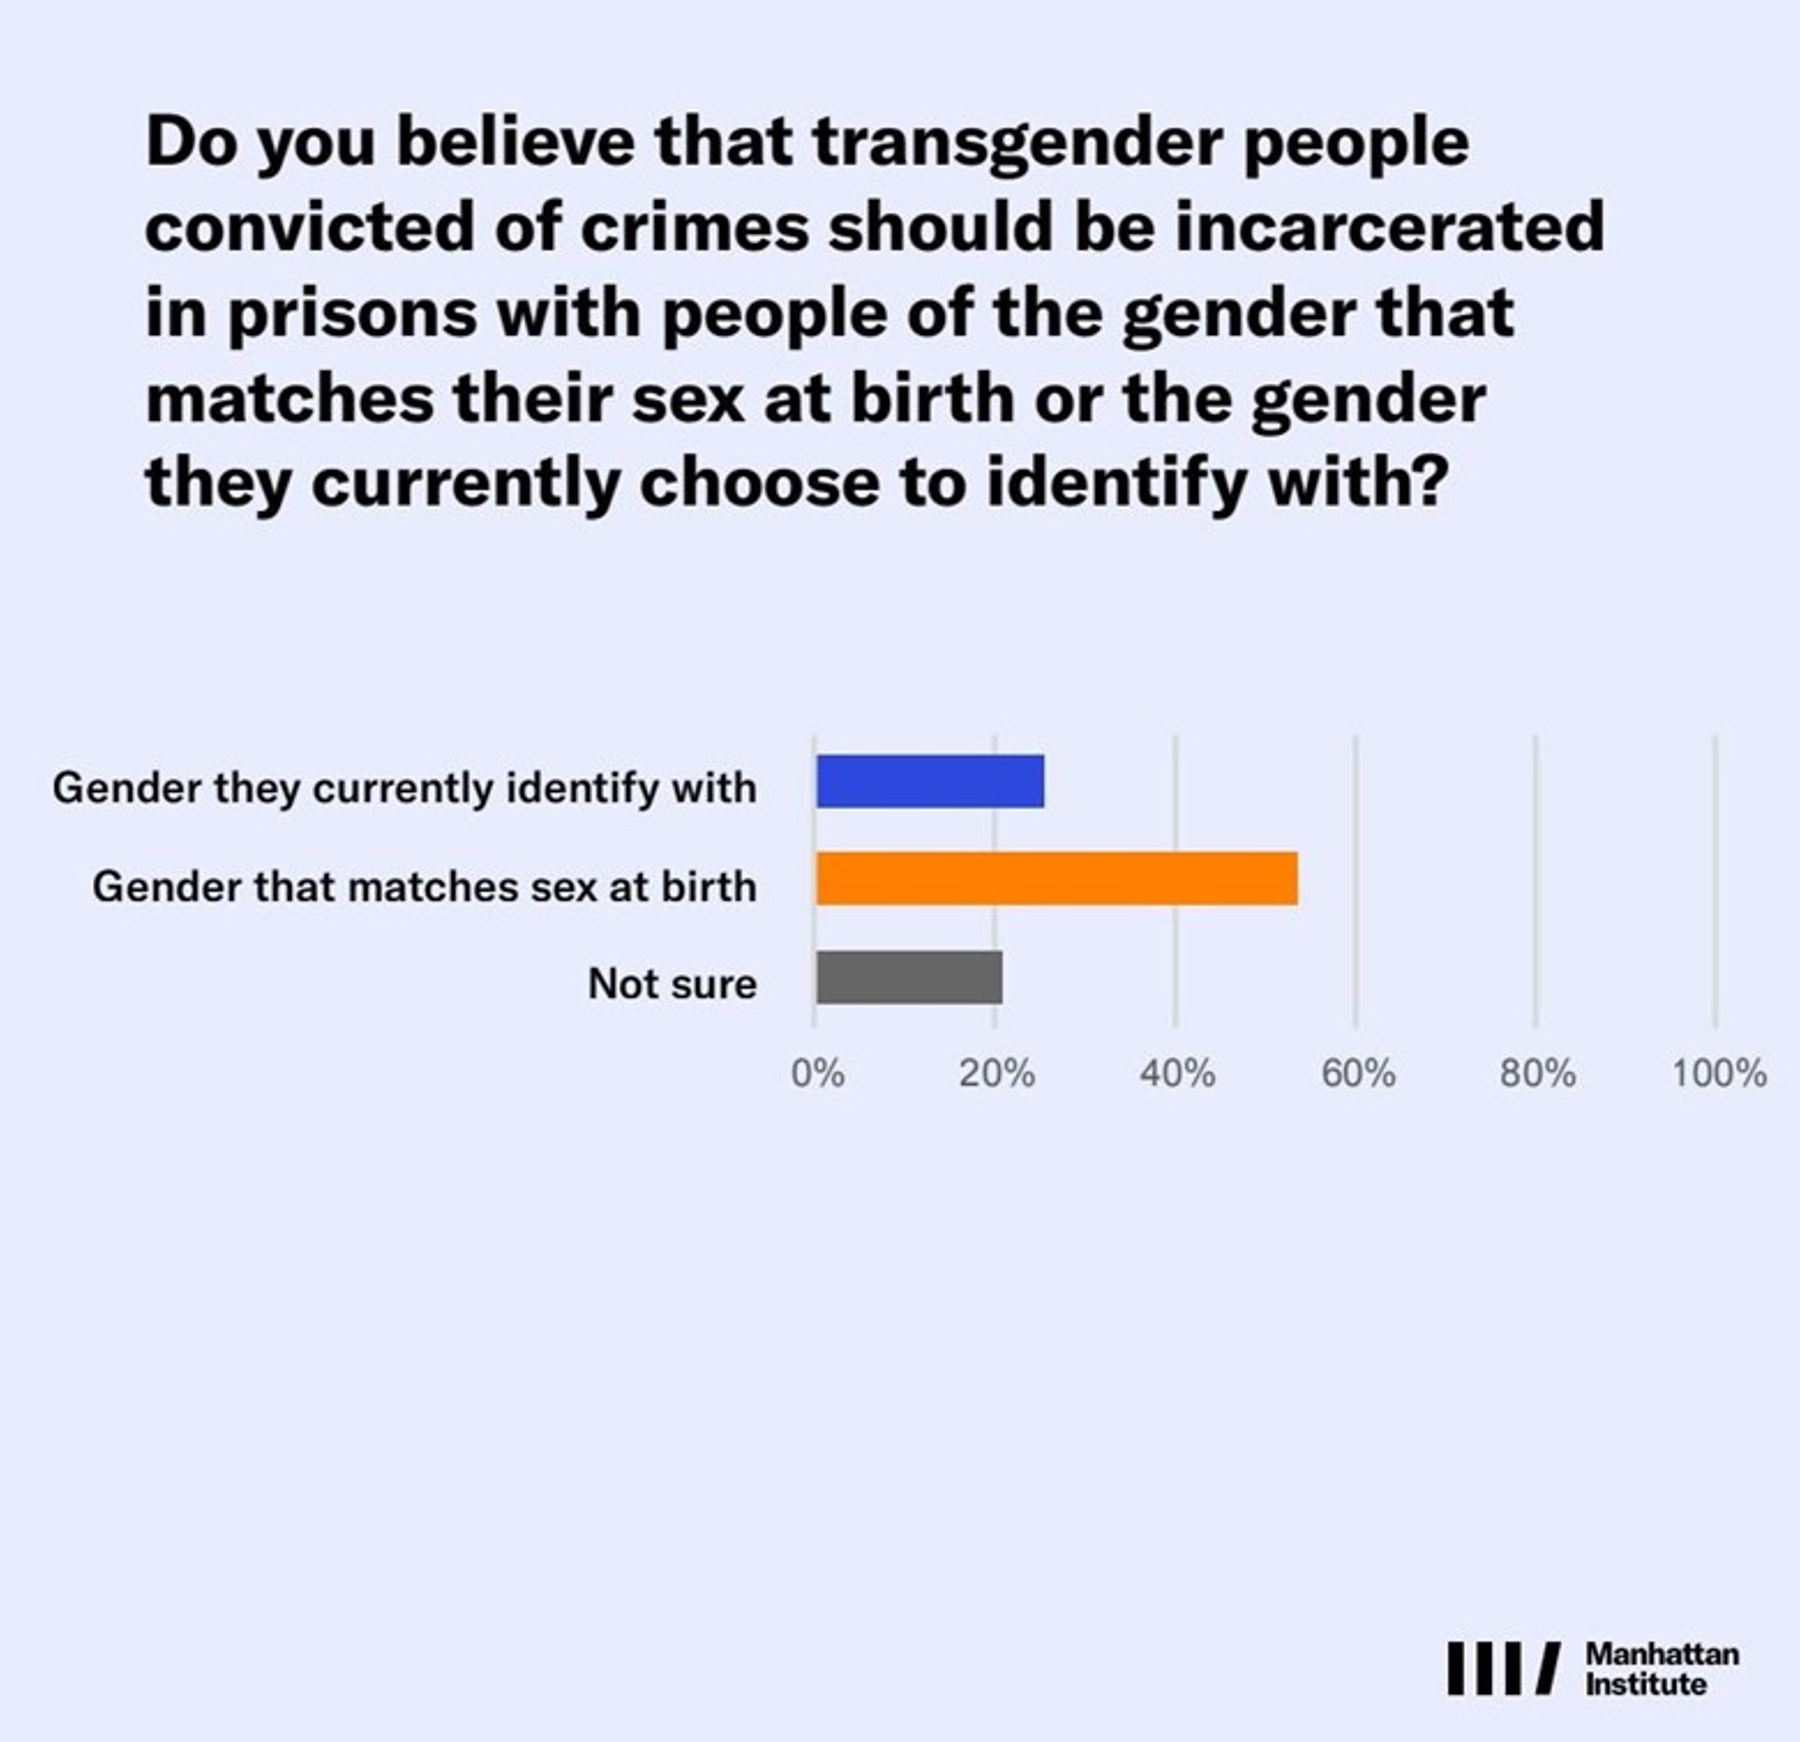
Likely voters also believe (54% overall, 52% of independents) that individuals in prisons should be assigned to facilities that match their sex at birth, not the gender with which they identify. A quarter, 25%, of likely voters overall, and 20% of independents, say inmates should be assigned to facilities based on the gender with which they currently identify (Figure 7).
Figure 7
Likely voters across the partisan spectrum believe that schools should be required to inform parents if children are using different gender pronouns at school than they are at home, with 60% of all respondents agreeing and 24% disagreeing. These overall figures include net support among Democrats (44% should, 34% should not), independents (56% should, 27% should not), and black voters (55% should, 18% should not).
Likely voters also believe that trans children should not receive treatments to transition before age 18. This includes a narrow plurality (39% to 37%) of Democrats, but overwhelming majorities of independents (64% to 19%), black (50% to 23%) and Latino (55% to 31%) voters.
Vanishingly few likely voters believe that children are old enough to decide to transition genders under the age of 16 (5%), 10% believe they are old enough at 16, but most believe transition should be decided at 18 (28%) or over 21 (32%) at the earliest.
Voters largely believe that policymakers who are seeking to limit access to puberty blockers and passing parental notification laws are motivated by a desire to protect children (52%), not anti-trans bigotry (29%).
Climate and “Environmental Justice”
There is widespread skepticism among voters over core objectives of today’s progressive “environmental justice” movement.
A majority of respondents (55% to 12%) do not believe it is appropriate for the government to rely on racial justice NGOs to distribute taxpayer money, including a majority of independents (53% not appropriate, 11% appropriate) a plurality of black voters (37% not appropriate, 23% appropriate) and Latino voters (43% not appropriate, 27 appropriate).
Only 35% of likely voters support the U.S. Environmental Protection Agency’s program to give $50 million to the environmental justice group Climate Justice Alliance to distribute, with 41% opposed. When likely voters hear about the views of the Climate Justice Alliance, which include support for defunding the police, only 25% support allowing them to distribute taxpayer money, with 49% opposed.
Mask Bans and Campus Chaos
The recent protests against Israel and the United States in big cities, on college campuses, and at Jewish community institutions feature a growing number of participants using masks, keffiyehs, and other facial obscurants to shield their identities. This has sparked conversations about freedom of assembly rights, comparisons to the tactics of the Ku Klux Klan, and laws regarding masking in public places.
A majority of respondents (51% overall, including 45% of independents) support banning masks and other facial coverings in public places, while 31% of respondents overall (and 35% of independents) oppose such a ban.
More than half of likely voters say that protestors should not be allowed to cover their faces because they are shielding their identities from the public and making it easier to commit crimes (56%), the same menacing tactics once used by the KKK. Only 29% of voters said that protestors should be allowed to cover their faces because that is their right. These respondents say that protesting anonymously is acceptable and there are also health reasons to wear a face mask in public.
Beyond support for mask bans, the public is also fed up with campus chaos and urban disorder. There is majority support among likely voters for police clearing illegal encampments set up by both homeless people (56% support, only 33% oppose) and campus protestors (62% support, only 27% oppose) in public spaces. When it comes to the university encampments, even a large plurality (49%) of Democrats are on board with having the police shut them down. There is also plurality support for the government taxing university endowments.
Sports Betting
Several states across the country have recently legalized sports betting, raising concerns about gambling addiction and calls for regulation. Likely voters believe that regulations on sports betting should either be kept roughly the same (31%) or increased (29%), and support for more regulation does not fall on strict partisan lines, though women are less likely to favor less regulation (7%) than men (16%).
Voters take a personal-responsibility approach to gambling addiction, largely blaming gamblers themselves, rather than large companies. They do not argue that sportsbetting is a disease.
Children, Cellphones, and Therapy
The use of cellphones in schools is a growing concern for American parents. A majority of likely voters say they are either extremely (26%) or very (24%) concerned about cellphones in schools, with voters 65 and older the most concerned (34% extremely, 27% very). Likely voters across the partisan spectrum believe that schools should take actions to limit these devices in schools, with 73% of all voters believing schools should limit access to cellphones, including 71% of Democrats, 66% of independents, and 80% of Republicans.
Respondents favor therapy for children, with 56% saying therapy can benefit any child and only 30% saying that “therapy should be a rare exception, not the rule for children. Too many young people are being subjected to unnecessary therapy, which may hinder their ability to develop resilience and independence.”
Race Consciousness vs. Colorblindness
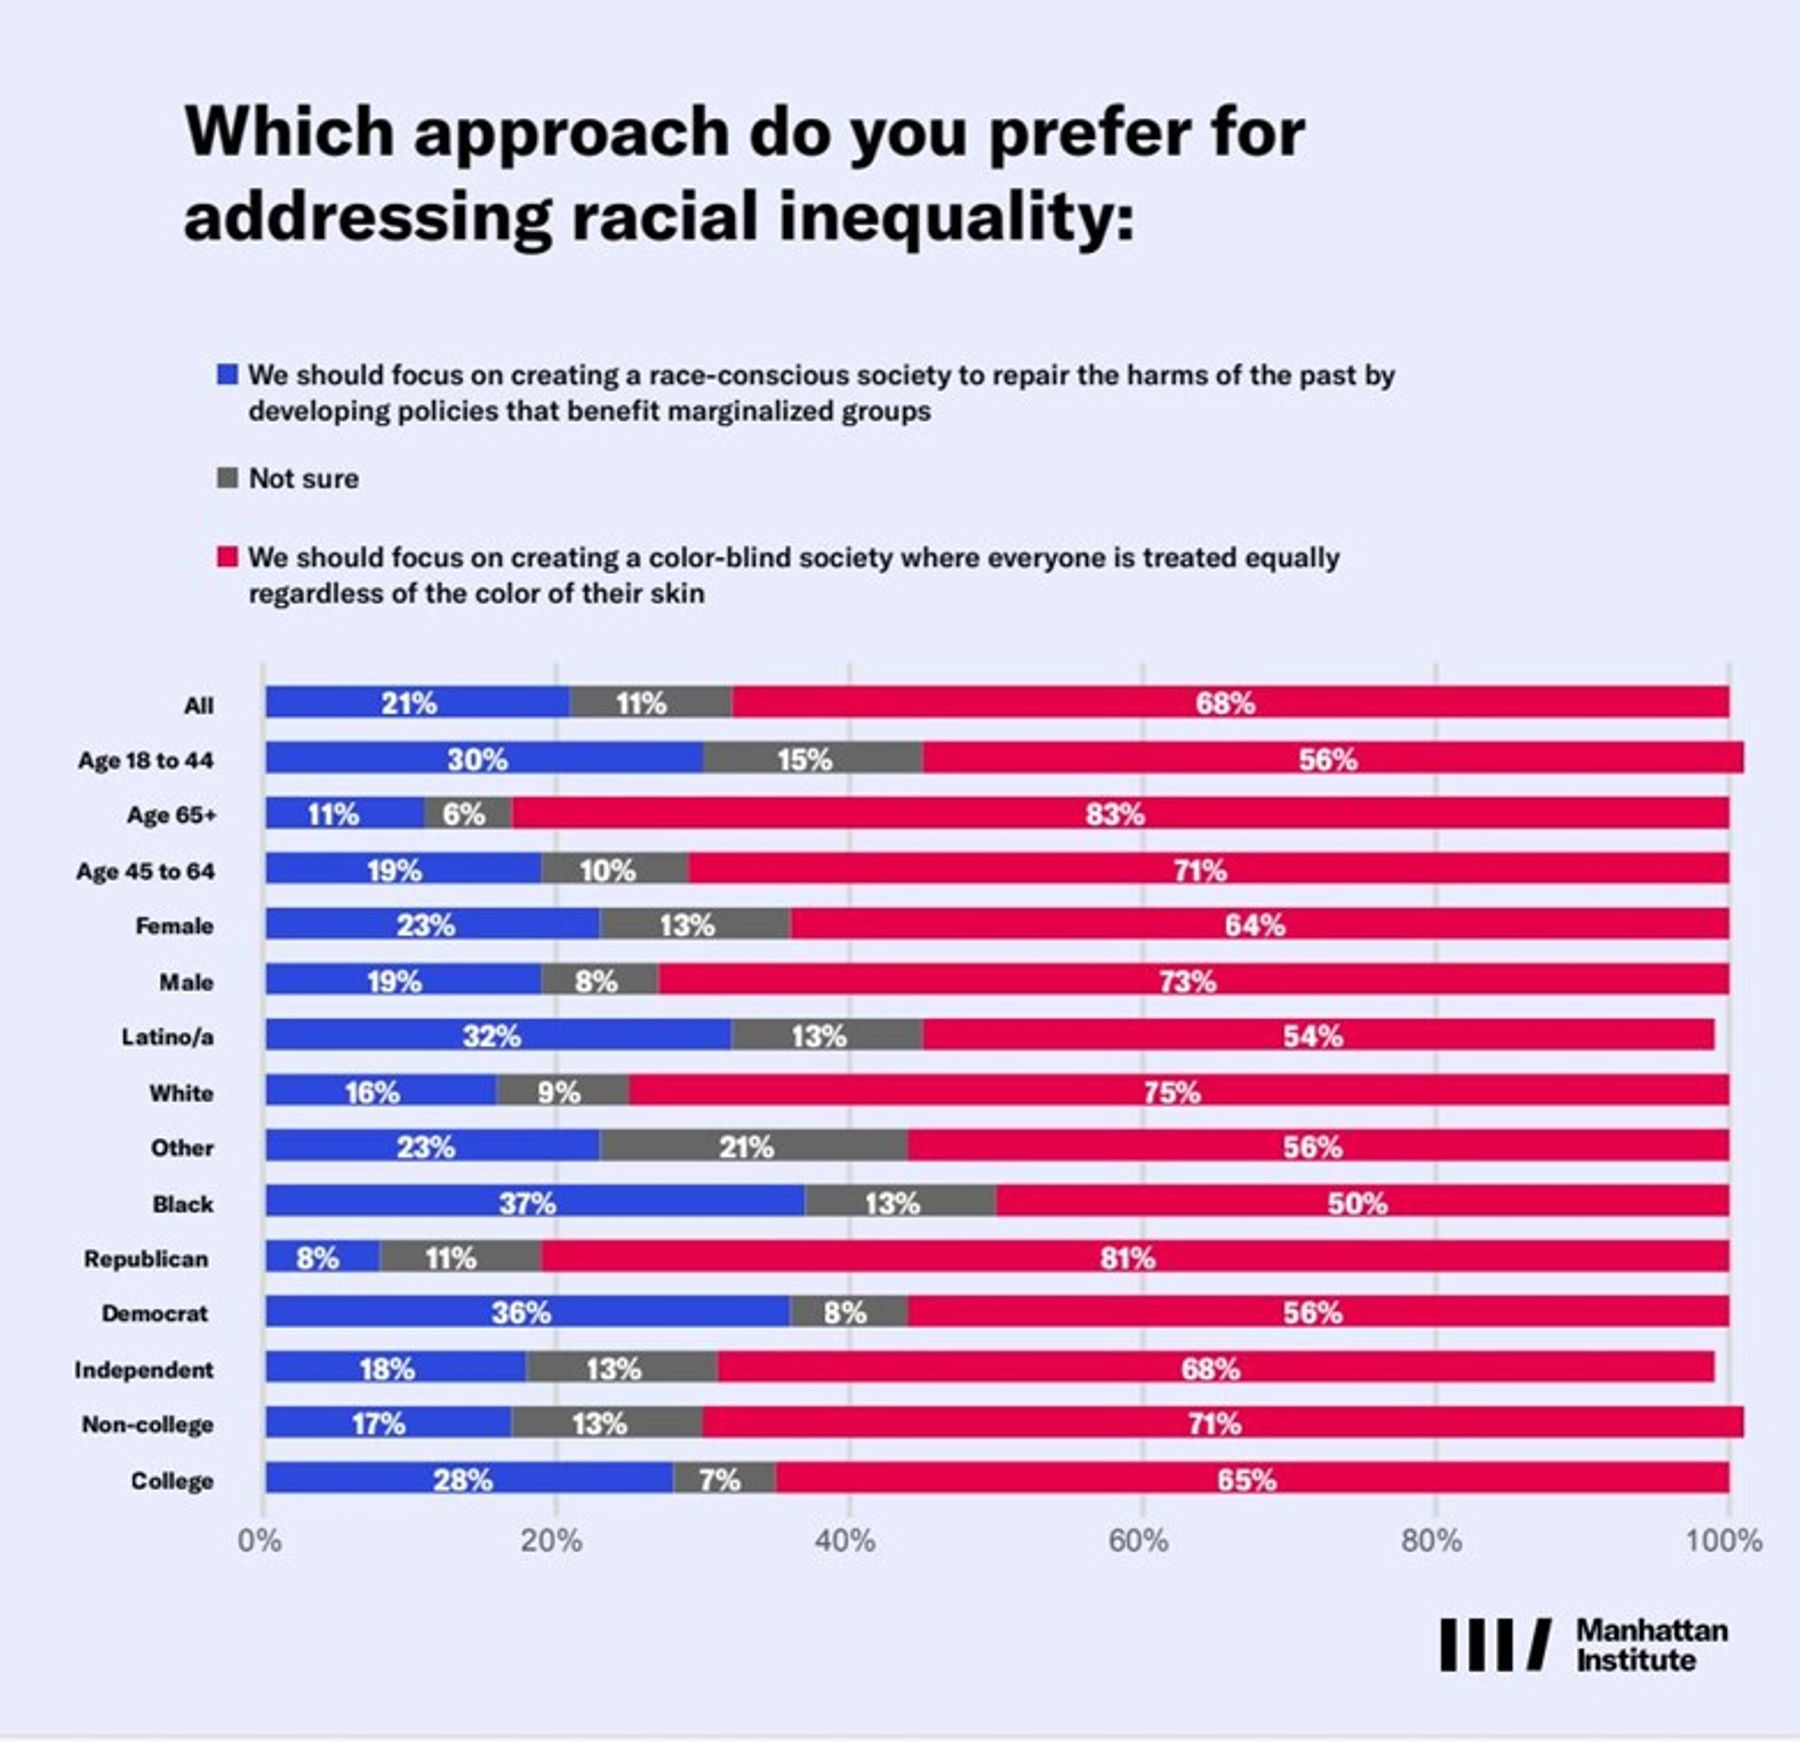
In recent years, the history of race in the U.S. has become a topic of intense conversation, with many progressive leaders promoting concepts like Critical Race Theory and the idea that the U.S. is a nation built on white supremacy. We find that these ideologies are largely rejected by the American public, including by the black and Latino people such philosophies are intended to elevate. Voters prefer a colorblind America.
Poll respondents across the partisan spectrum reject race-conscious policies and race essentialism (Figure 8). Less than a quarter (21%) agree with the statement, “We should focus on creating a race-conscious society to repair the harms of the past by developing policies that benefit marginalized groups,” and even Democrats (36%), African Americans (37%) and Latinos (35%) are largely opposed. Instead, majorities of likely voters across all demographic groups agree with the sentiment, “We should focus on creating a color-blind society where everyone is treated equally regardless of the color of their skin.”
Figure 8
Vanishingly few (11%) agree that “whether I succeed or fail in life is mostly due to things outside of my control like my race and gender,” including 27% of black and Latino voters and 13% of women. Again, majorities across all demographics instead feel that “whether I succeed or fail in life is mostly due to the choices I make.”
Overall, likely voters do not believe that black and Latino people are “permanently oppressed” by white supremacy (only 24% of voters agree and 23% of independents), though 56% of black voters and 34% of Latino voters agree with the statement. Most Americans (58%) instead say that “no group is permanently oppressed. Jewish, Italian, and Asian people, and others have worked their way up; Black and Latino people can do the same.”
Diversity, Equity, and Inclusion (DEI)
Three-quarters of respondents (and 70% of independents) believe that children should be taught about the fraught history of race with good and bad, not that the U.S. is a fundamentally racist nation. A majority of Democratic (63%), black (55%), and Latino (60%) likely voters agree, while only 17% say that children should be taught the U.S. is a fundamentally racist nation built on white supremacy.
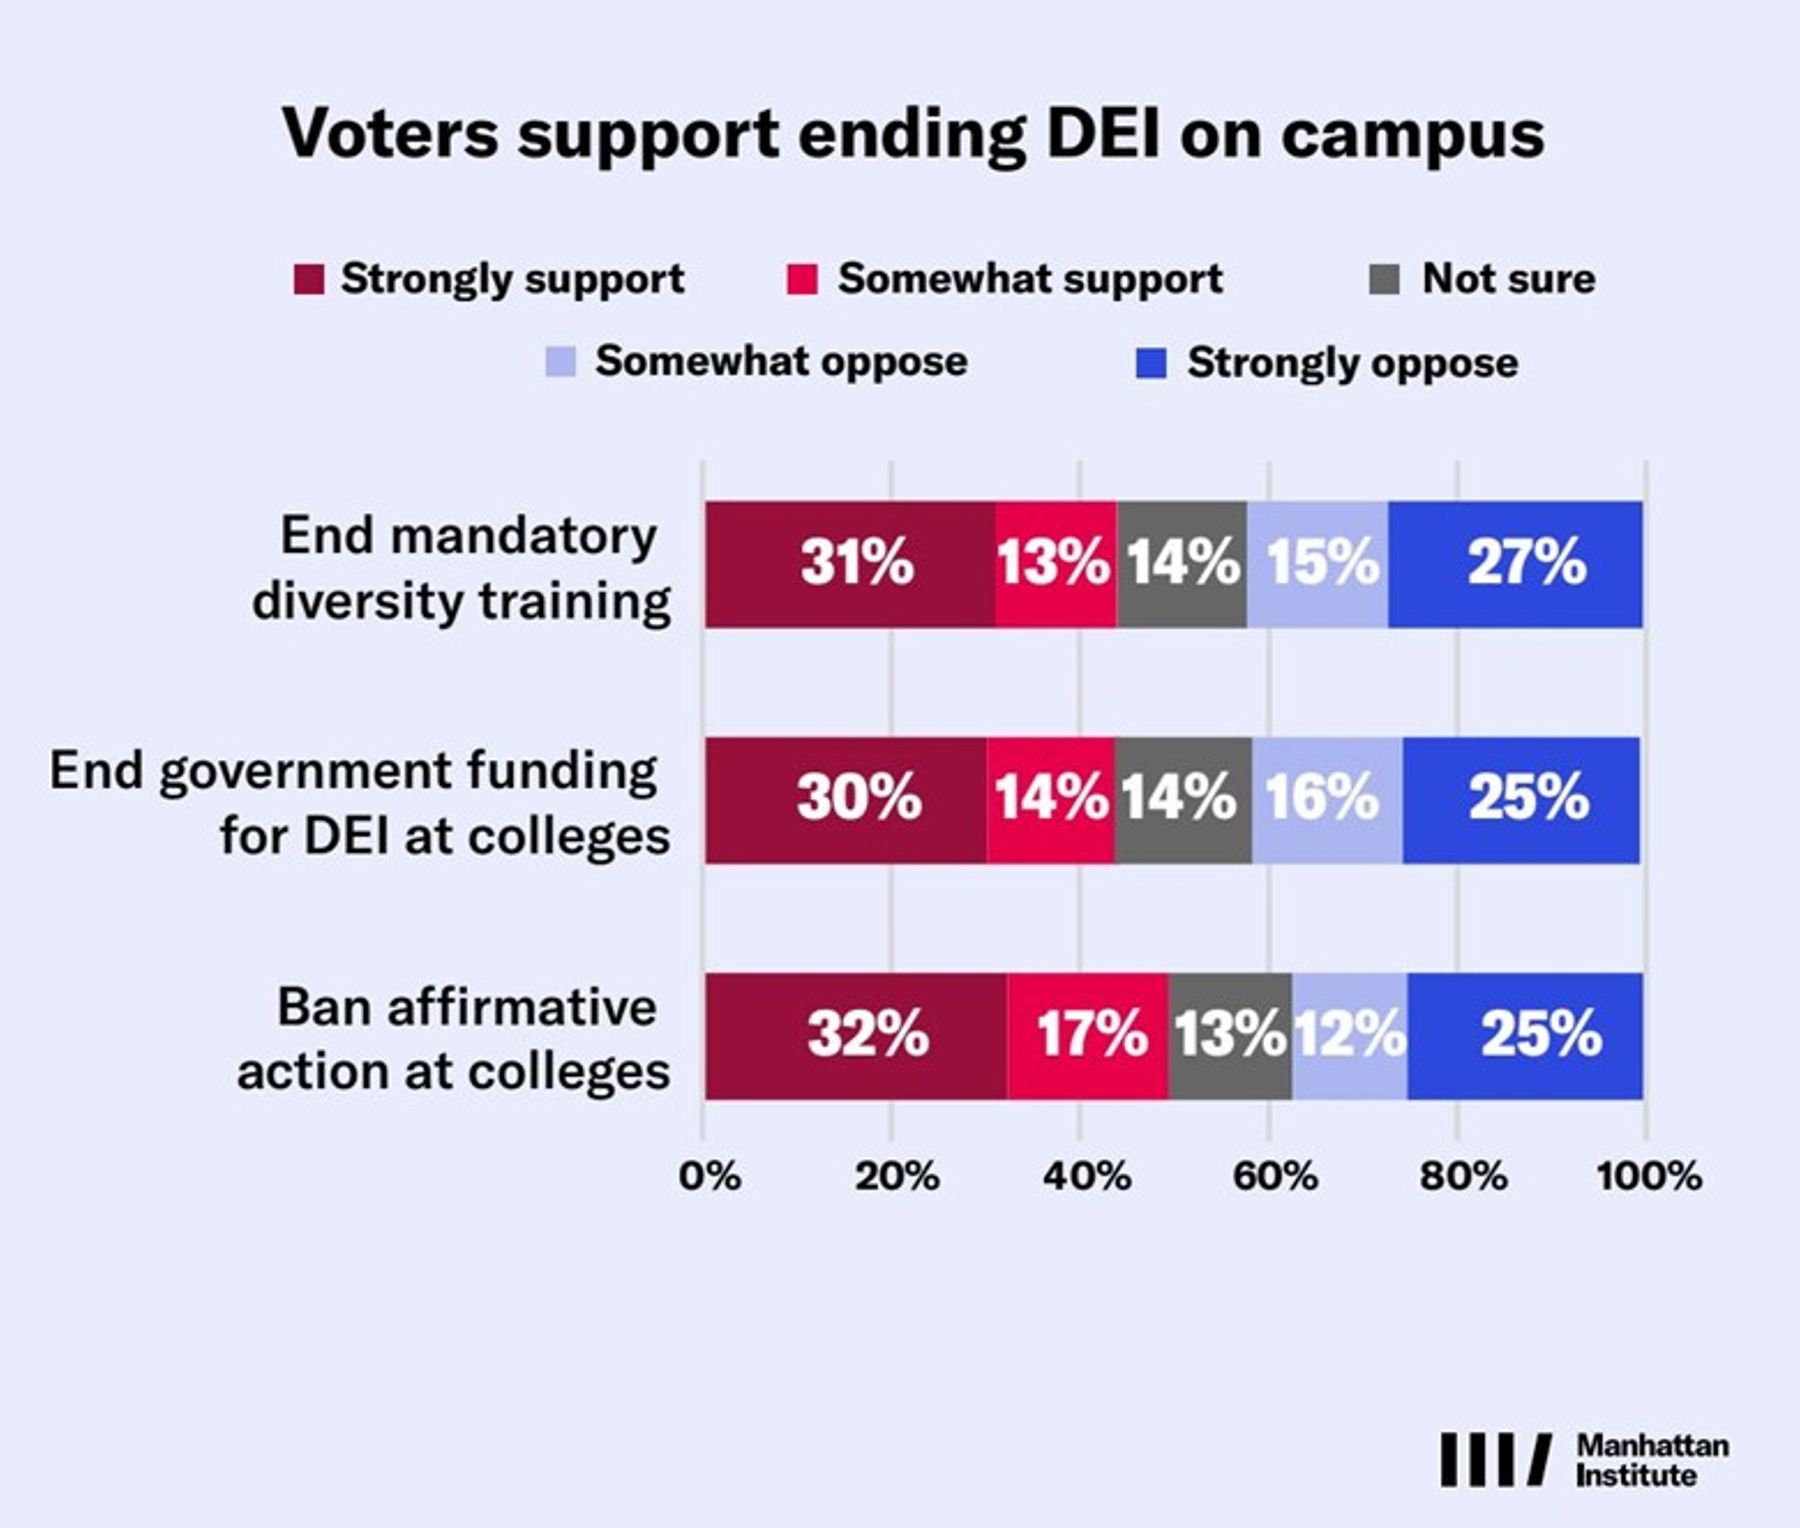
Half of likely voters support (50% support, 37% oppose) banning colleges and universities from considering the race of an applicant when making decisions about admissions and employment (Figure 9). Likely voters also support ending government funding for DEI at public universities (44% support, 41% oppose) and ending mandatory diversity training at schools (44% support, 42% oppose). Independents, on net, oppose DEI in all cases.
Figure 9
Minority Contracting
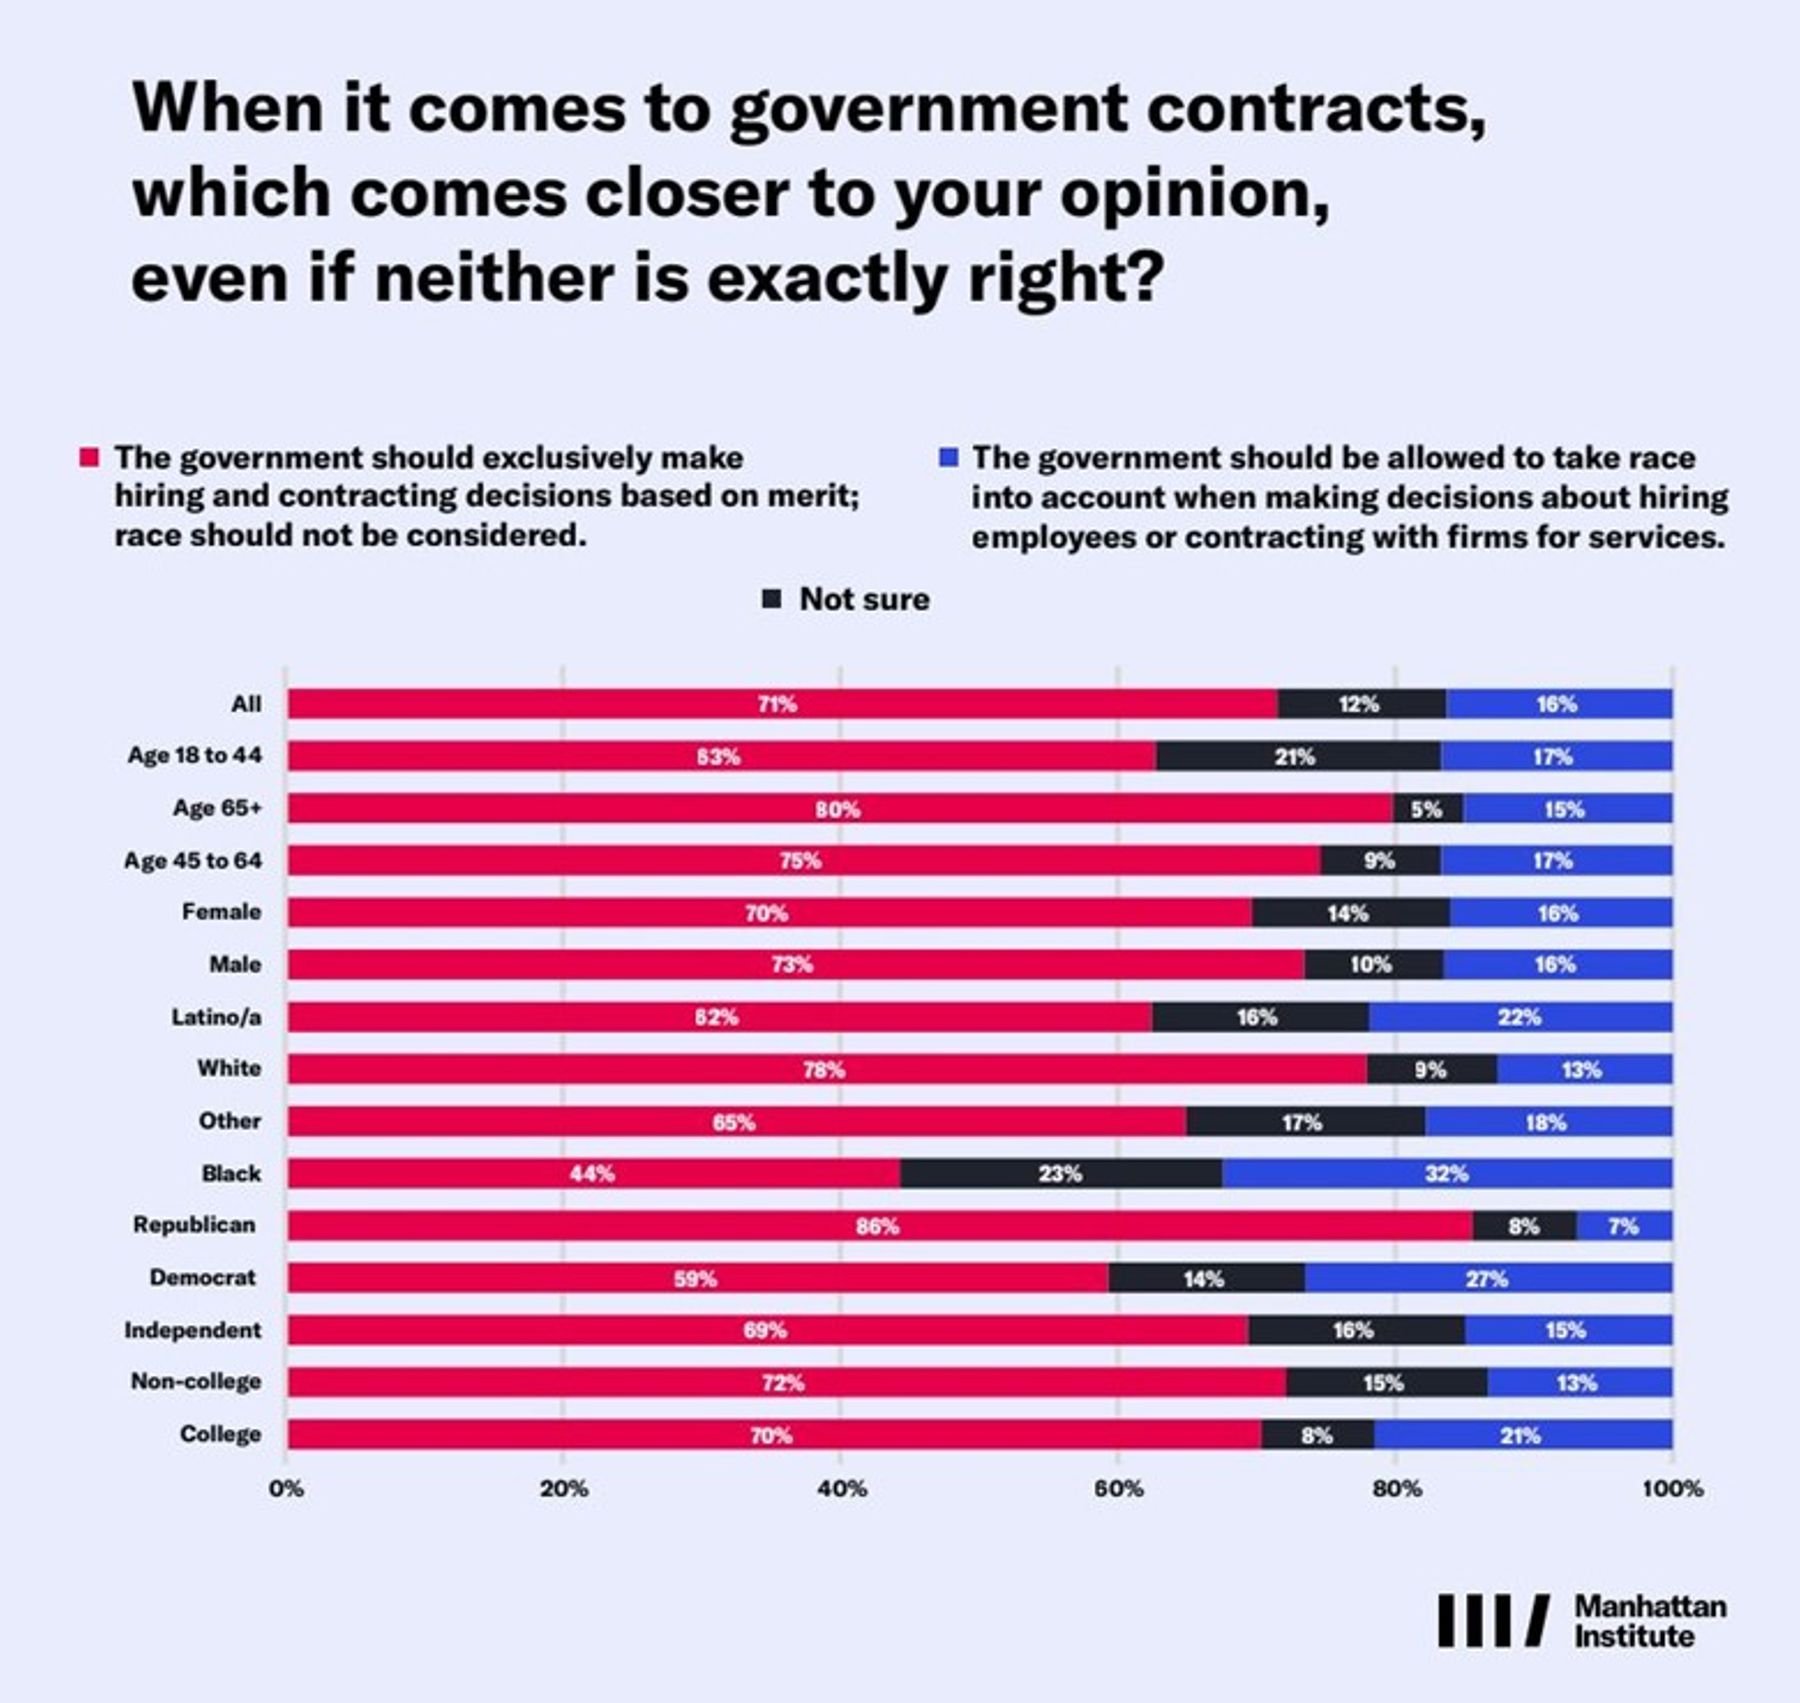
Voters reject the idea that the government should take race into account when making hiring and contracting decisions, with 16% in support of taking race into account and 71% believing only merit should be considered (Figure 10). Democrats (59% merit), independents (69%), black (43%) and Latino (64%) voters all support merit being the only factor taken into account.
Figure 10
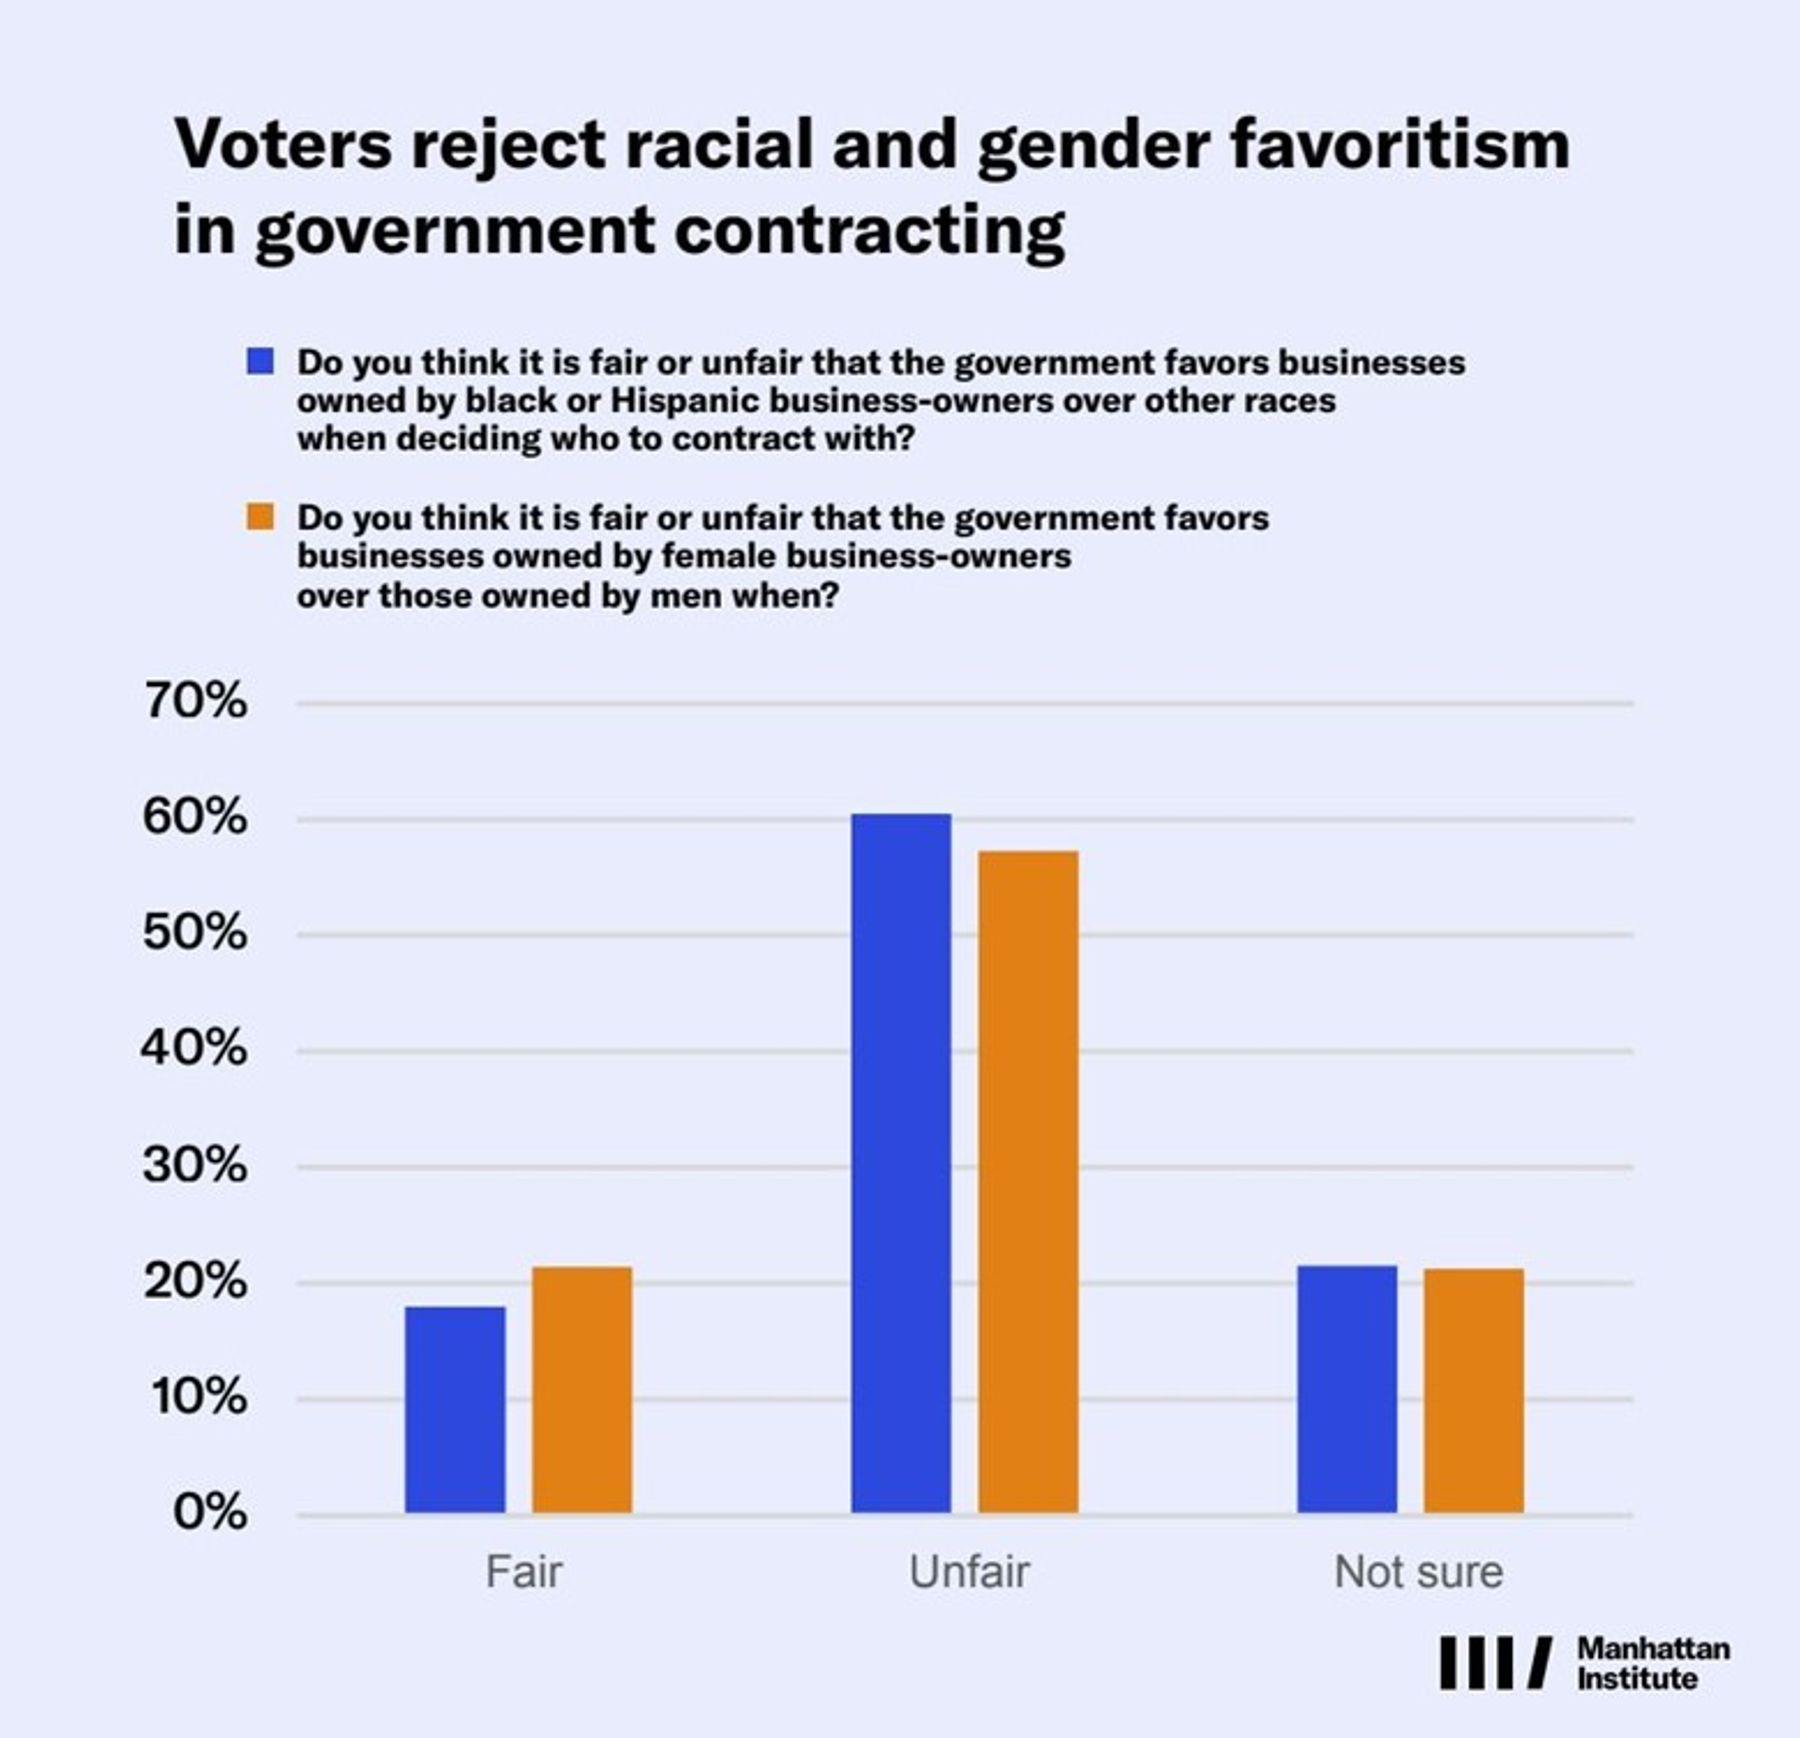
Sixty percent of likely voters believe it is unfair that the government favors businesses owned by black and Hispanic business-owners (Figure 11). Democrats (39% unfair, 32% fair) and Latinos (49% unfair, 30% fair) narrowly lean unfair, while black voters (37% fair, 30% unfair) narrowly lean fair.
Figure 11
Fiscal Issues
It is likely that budget constraints will be a driving force in 2025, regardless of who is elected and which political party is in the majority. The Trump tax cut renewal, combined with the large and growing federal deficit will force D.C. to have a conversation about spending. While there has been some discussion about a new populist approach to fiscal issues—renewed by Senator JD Vance’s recent nomination as the 2024 Republican vice presidential nominee—we find voters are broadly supportive of numerous traditional right-leaning policy inclinations with respect to fiscal restraint, at least on paper.
Fifty-five percent of likely voters (and the same share of independents) prefer spending less for lower taxes over spending more for more government services (27% overall, 20% of independents). Meanwhile, 68% support the government reducing the deficit even if it means reducing spending, while only 13% support keeping spending the same.
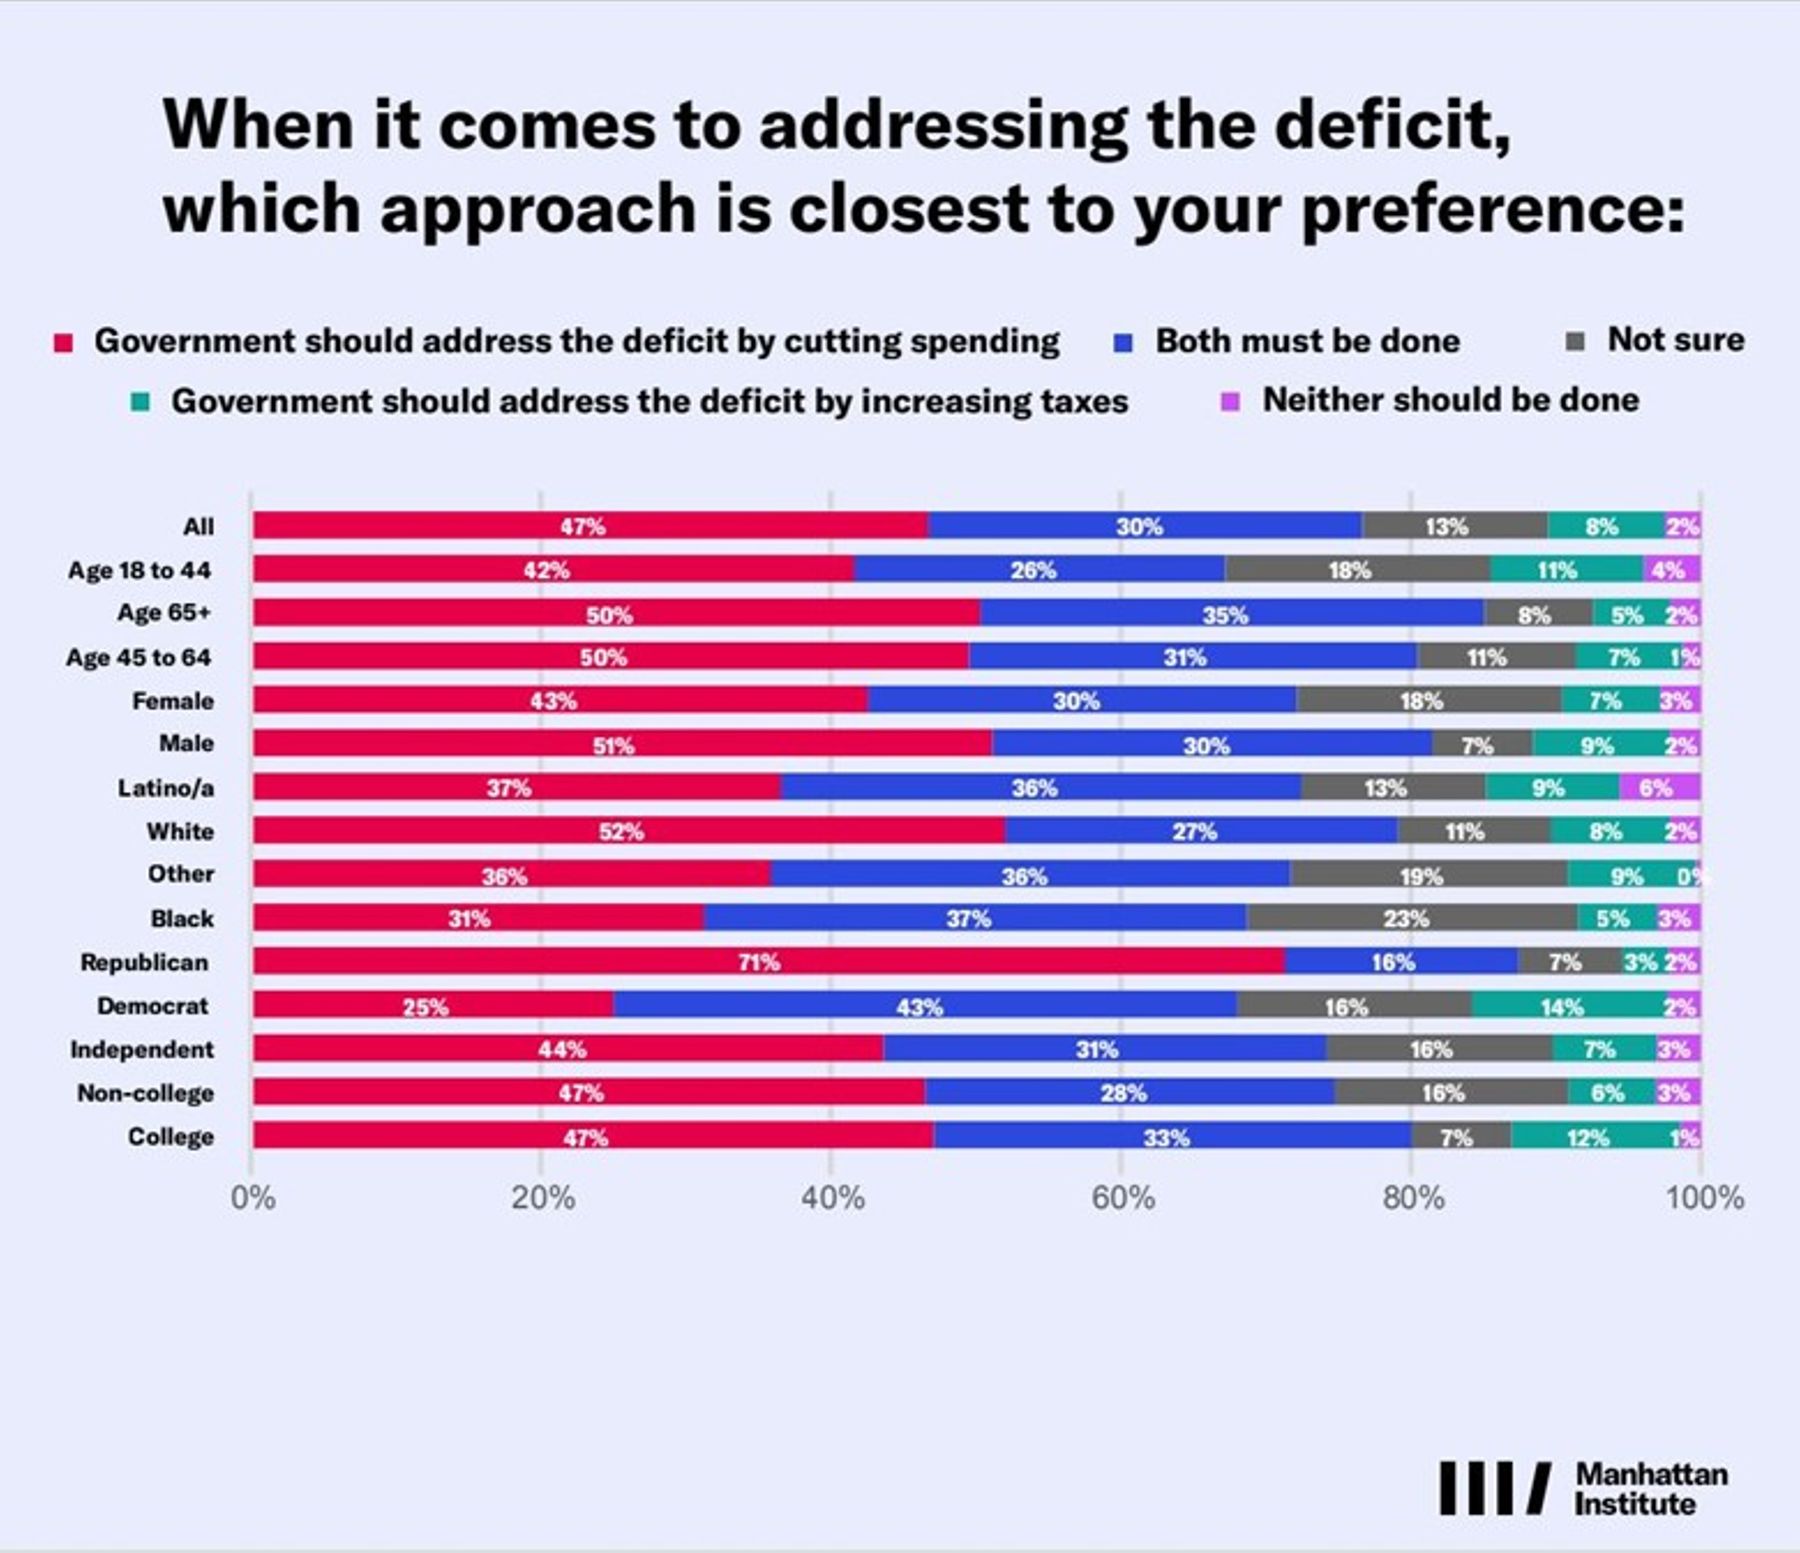
To reduce the deficit, 47% of likely voters support cutting spending (including 44% of independents) while only 8% support increasing taxes and 30% support both (Figure 12). Half of all respondents (75% of Republicans, 52% of independents) say the government does too many things, while just 29% of Americans (14% of GOP, 22% of independents) say the government should seek to do more.
Figure 12
Forty-nine percent of all likely voters (78% of Republicans, 51% of independents, and 21% of Democrats) feel that “nobody should pay higher taxes; we should cut spending because government is ineffective at spending money.” Conversely, 35% of all voters (12% of GOP, 29% of independents, and 63% of Democrats) feel “people in the middle to upper income brackets should pay higher taxes so we don’t have to cut government services.”
However, Americans are still weary of any cuts to the nation’s biggest entitlement programs. Half of our poll’s respondents say they would prefer that no changes be made to Medicare spending, even if that means increasing taxes over time. Only 28% say they would prefer no tax increases, even if that means spending less on Medicare over time. Even among Republicans, only a narrow majority (40% for no tax increases, 37% for no Medicare spending changes) opt for the second option.
Photo: EvgeniyShkolenko / iStock / Getty Images Plus
Are you interested in supporting the Manhattan Institute’s public-interest research and journalism? As a 501(c)(3) nonprofit, donations in support of MI and its scholars’ work are fully tax-deductible as provided by law (EIN #13-2912529).