Who Pays for Reparations? The Immigration Challenge in the Reparations Debate

Photo: Vadym Plysiuk/iStock
Executive Summary
Since the 2020 “racial reckoning,” there has been increased political momentum behind reparations for slavery. Debates about reparations have moved from the halls of academia to legislatures in California and a number of cities. Americans and their leaders are increasingly asking: Are reparations justified at all? And, if so, who should get how much?
This report concerns itself with a different question: Who pays for reparations? Reparations are a form of compensation for historical injustice. But many Americans did not have any ancestors present in the country at the time that injustice was committed. It is hard to argue that Americans whose ancestors arrived after 1860 should be on the hook for the costs of reparations.
What fraction of nonblack Americans have ancestors who arrived after the end of the Civil War? Using demographic modeling techniques, this report pegs the figure as high as 70%, including more than half the non-Hispanic white population. These Americans are the descendants of immigrants who came to the U.S. either in the first great wave of immigration in the late nineteenth and early twentieth centuries, or in the second great wave, begun in 1965 and still ongoing today.
Many of these more recent arrivals are at the top of America’s economic distribution. Indeed, the recent-arrival share of top wealth earners is likely only to grow in coming years, given the prevalence of immigrants and children of immigrants at the head of top businesses. This means that the base of people and wealth that could plausibly be taxed for reparations is shrinking and will continue to shrink for the foreseeable future.
This dynamic plays out in other areas of social policy. Any transfer or subsidy proposal that is justified by historical injustice—e.g., affirmative action—will lose legitimacy as the population changes. This is an important, and often overlooked, feature not only of the reparations debate but of debates about such proposals in general.
Introduction: The Reparations Moment
Reparations for slavery are having a moment. Since the summer of 2020’s “racial reckoning,”[1] the idea of paying black Americans some form of recompense for historical injustice has gained new political currency. Support for reparations was a hallmark of Democratic campaign platforms in 2020.[2] The state of California empaneled a dedicated reparations task force, which in June, 2023 recommended that eligible black residents receive payments totaling $1.2 million each.[3] The city of Boston has a similar task force, while the Chicago suburb of Evanston has committed to paying out $10 million to its roughly 12,000 black residents in reparations for discriminatory housing policy.[4]
The idea of reparations for slavery is not new. Proponents trace it to General William Tecumseh Sherman’s Field Order 15, which reserved 400,000 acres of land to the formerly enslaved people freed by the Civil War—the origin of “forty acres and a mule.”[5] The modern history of reparations advocacy, though, originates in the Black Power movement of the 1960s and 1970s. As early as 1960, Malcolm X called on the U.S. government to “compensate us for the labor stolen from us.” In 1966, the Black Panther Party’s 10-Point Program demanded “the overdue debt of forty acres and two mules.” In the decades since, there have been several scholarly cases for reparations, including Boris Bittker’s The Case for Black Reparations (1973), Randall Robinson’s The Debt: What America Owes to Blacks (2000), and Ta-Nehisi Coates’s “The Case for Reparations” (The Atlantic, 2014).[6]
Arguments for reparations are first and foremost arguments about justice: some people (black Americans descended from enslaved people) are owed something (usually money, although sometimes land) as recompense for some wrong (their ancestors’ enslavement and its attendant horrors). Treatments of the topic tend to devote much attention to detailing the extent of slavery’s evil and arguing that those harms still hold black citizens back today. Some advocates and scholars have made efforts to estimate the exact size of the amount due (as detailed in the next section).
Opponents of reparations also make arguments grounded in justice. They contend that it is unfair to impose on people today the costs of crimes committed by their ancestors, or (relatedly) that it is unreasonable that today’s black Americans should receive recompense for harms done to their ancestors. A 2021 UMass Amherst poll demonstrates that the public has additional concerns about reparations, including that the price tag is too high; that reparations would be difficult to administer; and that black Americans already receive equal treatment, such that reparations are unnecessary.[7] (A variation of the last argument is that black Americans have already received substantial “reparations” by virtue of being net beneficiaries of transfer spending.)
This report addresses a different, albeit related, challenge to the reparations project: Who pays for it? Even most advocates for reparations agree that nongovernmental institutions (like businesses and universities) could not plausibly pay for reparations; the funds would come from the U.S. government. But the same advocates tend to ignore the fact that U.S. government spending is ultimately funded by taxpayers. This means that “who pays” is a question of justice, too: granting, for the sake of argument, the legitimacy of the reparations idea, which Americans deserve to foot the bill? On whom should the burden of paying for reparations fall?
A substantial proportion of the nonblack population—as much as 70%, as estimated below—is descended from people who arrived after the end of slavery. These include descendants of the European arrivals in the first great period of American immigration, from the late nineteenth century to 1924, and those who have arrived or are descendants of arrivals during the second great period, beginning in 1965 and extending to the present. This second group, furthermore, is represented among the wealthiest Americans and American households, challenging the feasibility of a “soak the rich” approach to reparations.
Even if we otherwise grant the arguments for reparations, this basic demographic fact—that a majority of nonblack Americans are attributable to post–Civil War immigration—throws a wrench into the reparations project. Publicly funded reparations for slavery will entail taking money from tens of millions of people who are not—even under assumptions of inherited guilt that are already wildly at odds with the American tradition—plausibly responsible for slavery. To ask the question “Who pays?” produces uncomfortable answers for those who would like to see reparations paid.
How Much, for Whom, and from Where?
It is worth exploring some of the hard questions about reparations for slavery: How much? Who gets it? And where, in general, do advocates think the money comes from?
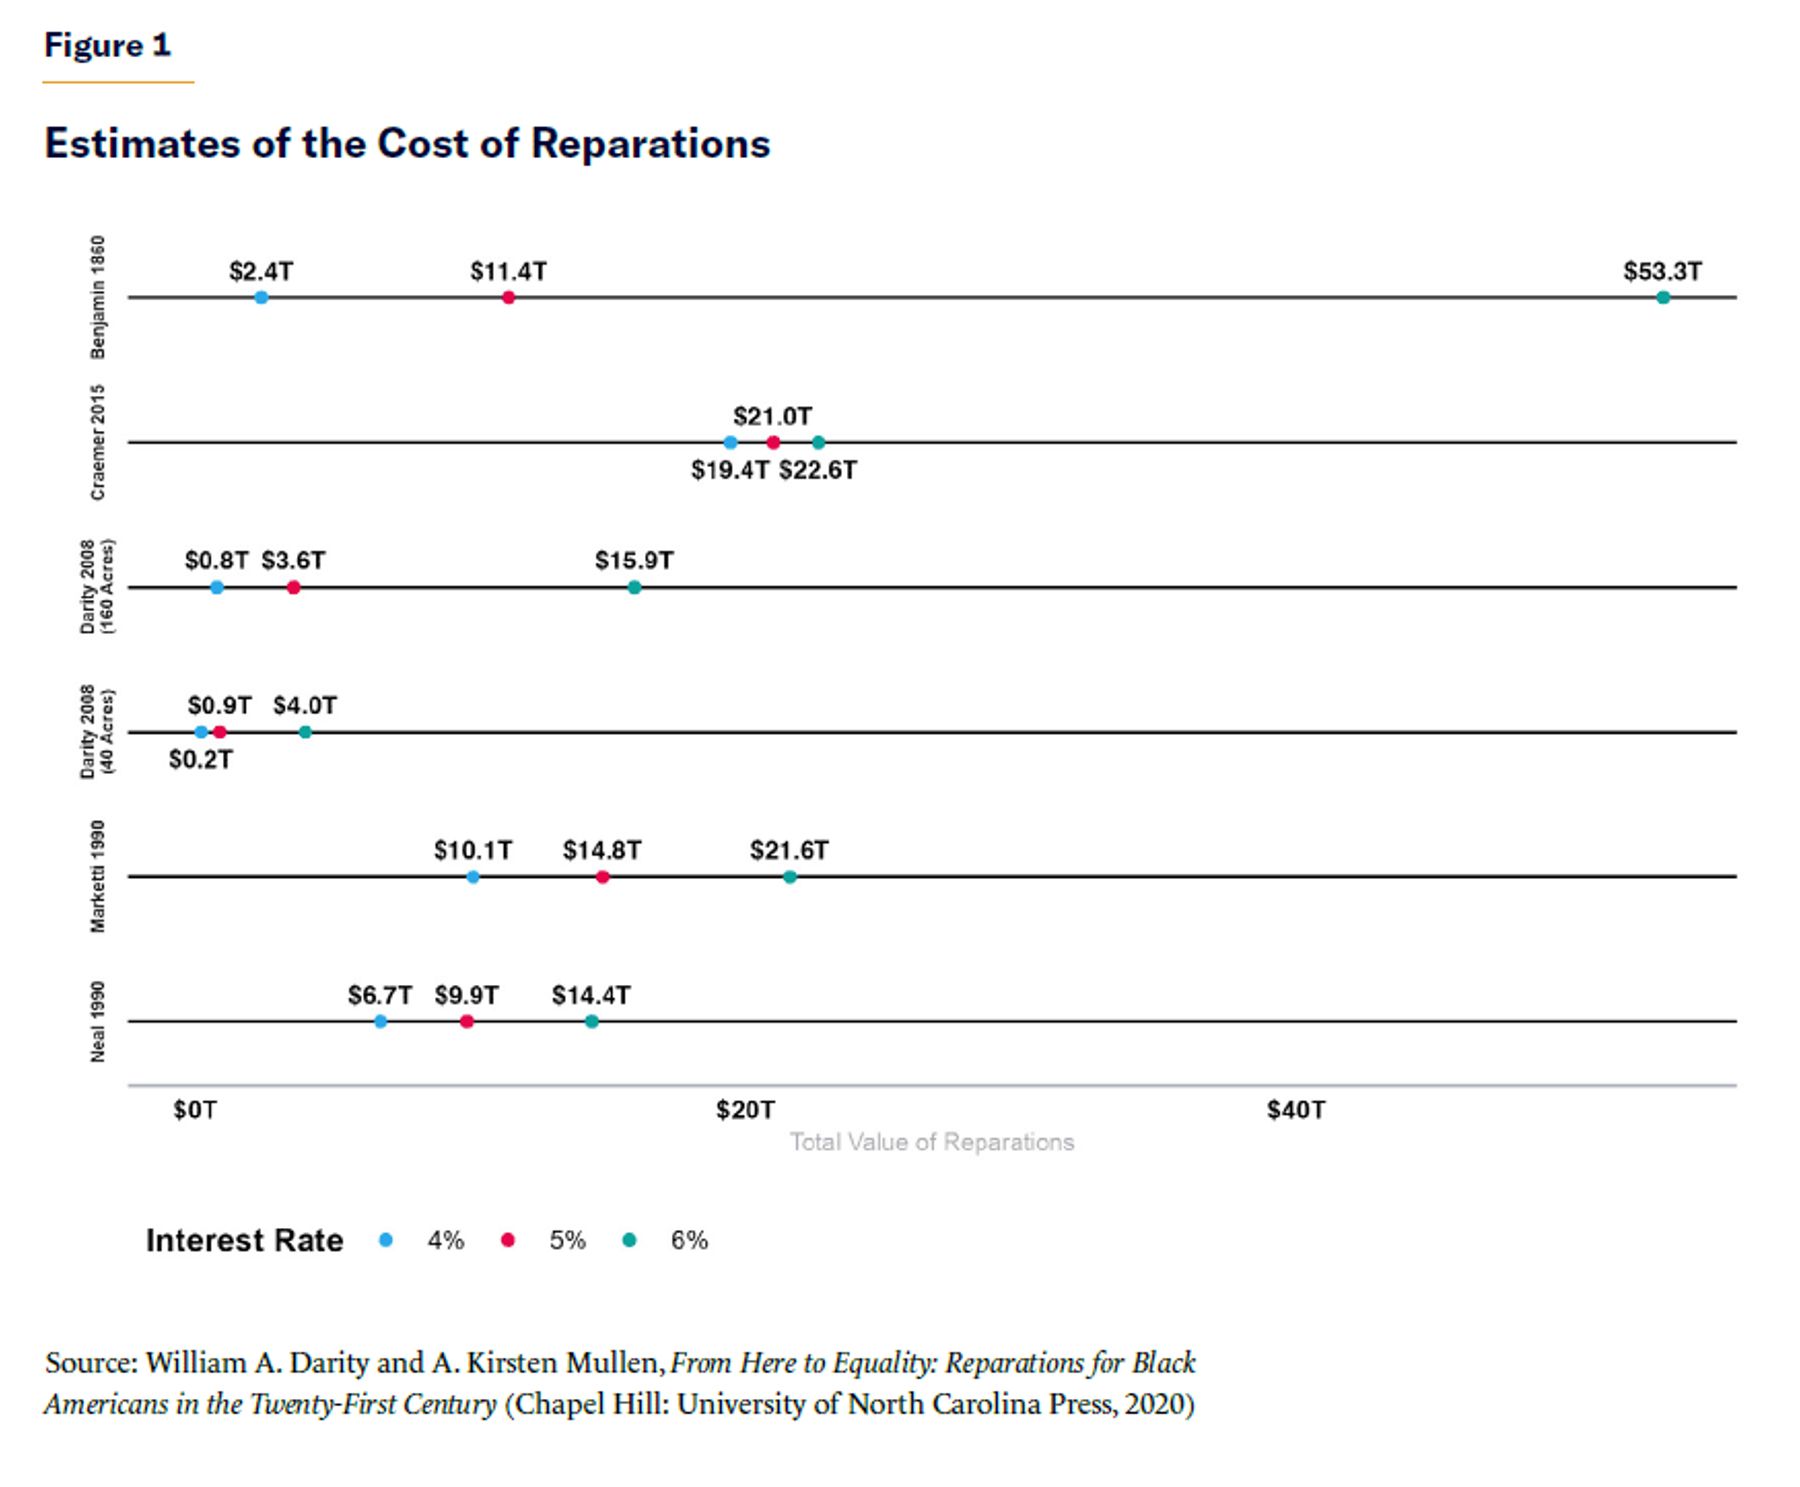
How much will reparations for slavery cost? In From Here to Equality: Reparations for Black Americans in the Twenty-First Century, economist William Darity and folklorist A. Kirsten Mullen identify a range of estimates, a subset of which are depicted in Figure 1.[8] These estimates use a variety of methods: the value of work done by slaves; the value of promised 40 acres not delivered on; even the total value of the stock of slaves claimed by Confederate Secretary of State Judah P. Benjamin on the eve of the Civil War.[9] In each case, Darity and Mullen take the original estimate of the value and add compounding interest in the amount of 4%, 5%, and 6% annually, an exercise I extend to 2023.[10]
The result is a wide range of estimates: the value of 40 acres in 1865, compounded at 4%, would yield a reparations bill of $196 billion; the estimated value of all slaves in 1860, compounded at 6% annually, puts the figure at $53.3 trillion, more than twice the U.S. gross domestic product. The mean across all estimates is $12.9 trillion, including a mean of $6.6 trillion if we use a 4% interest rate, $10.2 trillion for 5%, and $22 trillion for 6%. By way of comparison, it has been estimated that closing the black–white wealth gap would cost $15 trillion.[11]
To whom would this money go? On this topic, there seems to be a fair amount of consensus: black Americans who are descendants of slavery.[12] Darity and Mullen, for example, specify three criteria: that the person be a U.S. citizen; that the person “had at least one ancestor who was enslaved in the United States after the formation of the Republic”; and that the person publicly identified—e.g., on the census—as black or an equivalent category at least 12 years before enactment of the reparations program.[13] Similarly, Brookings Institution senior fellows Rashawn Ray and Andre Perry, in a 2020 report, say that reparations should go to “a Black person who can trace their heritage to people enslaved in U.S. states and territories,” adding: “Black people who can show how they were excluded from various policies after emancipation should seek separate damages.”[14] California’s reparations task force, the nation’s first statewide effort to produce a plan for reparations, also proposed that eligibility be restricted to “only those individuals who are able to demonstrate that they are the descendant of either an enslaved African American in the United States, or a free African American living in the United States prior to 1900.”[15]
How many people qualify under these conditions? As of the 2021 American Community Survey (ACS), roughly 40 million Americans self-identified as black.[16] Although identifying what fraction have enslaved ancestors requires more detailed genealogical work than is within the scope of this report, some ballpark estimates can be made. For example: 57% of black Americans believe that their ancestors were enslaved, while just 8% are certain that they were not.[17] Among those who reported an ancestry on the 2021 ACS, 78% of black people said that they were “Afro-American,” “African-American,” or from the United States, which may indicate sufficiently deep roots to be slave-descended. A similar share, 78.7%, reported that both their parents were native-born in the 2022 Annual Social and Economic Supplement to the Bureau of Labor Statistics’ Current Population Survey (CPS-ASEC).[18]
To a first approximation, then, it is plausible that 75%–90% of black Americans are eligible for reparations for slavery, or 30–36 million. For the estimate of the value of reparations above, $12.9 trillion, that works out to $360,000–$430,000 per person. The highest estimate, $53.3 trillion, is proportionally higher: $1.48–$1.78 million per person.
These large sums raise an important question: Where, exactly, does all this money come from? In a 2022 Pew survey on reparations, large majorities of those who favored them said that the money should come from “the U.S. federal government,” and majorities supported payments by businesses and banks “that profited from slavery.” A bare majority, and a minority of white and Asian respondents, supported charging colleges that had benefited. Less than half favored charging “descendants of families who engaged in the slave trade,” although even this position was supported by 60 percent of black respondents.[19]
As far as paying for reparations, colleges and businesses are nonstarters. Although they may make token gestures at reparations,[20] colleges do not have anything approaching the wealth or cash flow required. The cumulative endowment value of the colleges surveyed each year by the National Association of College and University Business Officers—the only colleges with endowments worth speaking of—added up to $838 billion in 2021, about 6% of a $12.9 trillion reparations bill.[21] Corporations are bigger earners, but total annual U.S. corporate profits—not just those of companies that were around circa 1860[22]—total about $2.8 trillion.[23] If every corporation were soaked of all its profits for 4.5 years, it could pay the cost of reparations—under the unlikely assumption that all those companies would still exist and pay taxes in the U.S., of course.[24]
The U.S. government is the only entity with sufficient capital, or access thereto, to make a six-figure payment to almost every black American. This option is far more popular, in the Pew poll, than charging the individual descendants of slaveholders. Yet on its face, this popularity makes little sense. After all, government revenues—whether raised by the income tax, duties and excise taxes, or even a (dubiously constitutional) wealth tax[25]—must eventually come from the taxpayer. If those taxpayers are not the long-term beneficiaries of slavery—the descendants of slaveholders—the tax burden will unfairly fall on people who owe no ostensible debt. If the purpose of reparations is to undo the damage of slavery, and if the benefits of reparations accrue to those ostensibly disadvantaged by the legacy of slavery, it is only fair that those who benefited from that legacy should pay the price, and manifestly unfair if those who did not benefit pay.
One common objection to this argument posits, first, that contemporary nonblack Americans are still indirect beneficiaries of slavery; and second, that reparations should be paid not only as recompense for slavery but also for post–Civil War institutional discrimination against blacks (e.g., Jim Crow). Therefore, on this view, all contemporary nonblack Americans should contribute to reparations, even if their ancestors arrived well after emancipation. Even if we grant the validity of this argument, however, there is still a question of who pays how much. It would be absurd, for example, to tax the new arrival from Ecuador and the sixth-generation descendant of slaveholders the same amount to cover the cost of reparations. Estimating how much each person has benefited—either from slavery itself or from post-slavery segregation—still yields a distribution of debt owed that is not uniform across the population but a function of the recency of the arrival of his or her first American ancestors.
Another objection is that the government could pay for reparations not out of tax revenue but by printing money (e.g., by issuing debt that would then be purchased by the Federal Reserve with printed money). Darity and Mullen, citing Vox’s Matt Yglesias, suggest that even this process could be end-run, with the Fed simply being directed to fund reparations directly.[26] But there are no free reparations: printing $13 trillion—when the current money supply is approximately $20 trillion[27]—would guarantee substantial inflation, the costs of which would still be borne by all Americans. Indeed, that inflation would fall regressively on those whom reparations are meant to benefit, meaning that it is possible that reparations-by-inflation may leave black Americans no better off in real terms than they were before.
We cannot, in short, avoid the distributional question: Who owes what for reparations? Which people should be on the hook for the taxes that pay for reparations? As the next several sections discuss, this question is far more complicated than it may first seem.
Who Pays? Some Considerations
At first blush, the problem of who pays for reparations seems a straightforward one. As previously discussed, perhaps 33 million black Americans would receive reparations paid for, in some way or another, by the other 300 million Americans. But are all those people plausibly beneficiaries of slavery? Or, alternately, should they all be equally on the hook?
Most obviously, it is hard to argue that most Asian and Hispanic Americans benefited, at least to the same degree as the average white person. Asian American immigration to the U.S. did not meaningfully begin until after the Civil War. As of the 1860 census, there were just 30,000 Asians in the country, mostly Chinese-origin residents of California. Similarly, there were just 186,000 Hispanics in the U.S. in 1860. These were overwhelmingly Mexican nationals, who, as of 2021, made up less than 60% of the 62-million-strong Hispanic population.
One could pare down the paying population to all non-Hispanic whites, or even all non-Hispanic white residents of the old Confederacy.[28] But here, too, immigration poses a problem.
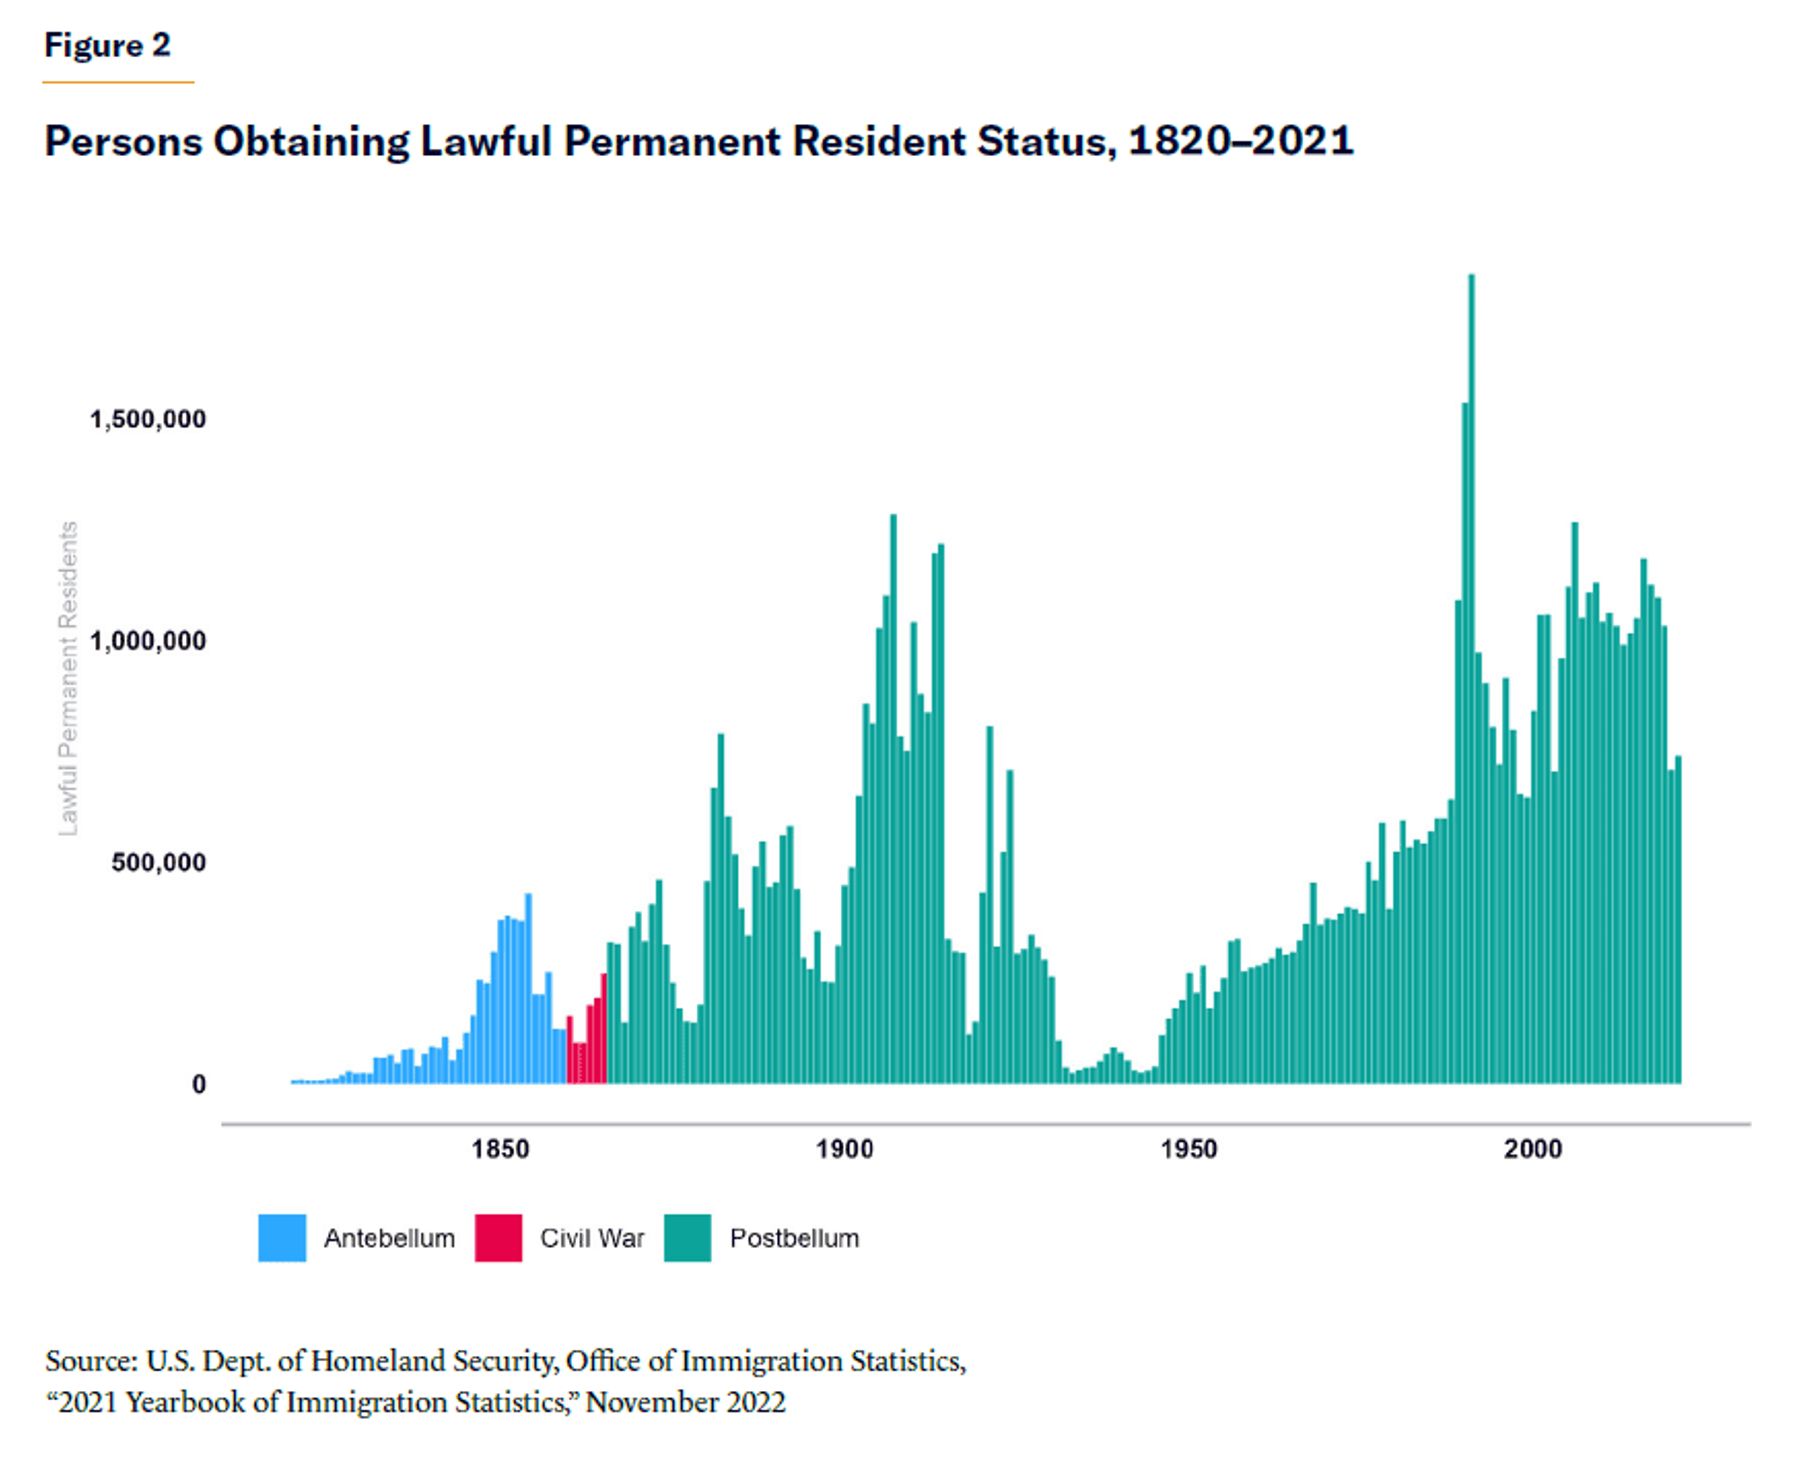
On the eve of the Civil War, there were approximately 27 million nonblack people in the U.S., the overwhelming majority of whom were white. This population was largely the product of natural increase. As Figure 2 shows, there was relatively little immigration to the U.S. in the antebellum period. The 1860-vintage nonblack population also resembled the Founding nonblack population in ethnic origin. The latter group was mostly British (86% from the United Kingdom nations), with the remainder being German, Dutch, French, and a small fraction Swedish.[29] Between 1820 and 1859, 91% of new arrivals were from Ireland, Germany, the United Kingdom, France, or Canada.[30]
The antebellum levels of infrequent, ethnically homogenous, immigration did not persist. Following the end of the Civil War, the U.S. entered its first great age of migration, powered by advances in technology and the promise of prosperity. Between 1866 and 1924—the year the Johnson-Reed Act effectively ended immigration for a generation—more than 30 million people arrived in the United States. This represented a substantial addition, compared with the 38 million already here as of 1870. As before 1860, the vast majority of these new immigrants—90% from 1860 to 1919—were European; a further 5% were Canadian. But they came from many more countries, including Italy (12% of arrivals); Austria-Hungary (12%); Germany (12%); Russia (9%); the United Kingdom (9%); Ireland (7%); and the joint kingdom of Norway-Sweden (5%).[31] A large number of Jews also arrived from across Eastern Europe.
In other words, by the time of the mid-twentieth-century immigration pause, the white population of the U.S. had a substantial component whose arrival to the country could be dated to the years following the Civil War. In 1900, the Pew Research Center has estimated, 49% of the U.S. population was foreign-born or the children of the foreign-born.[32] And white immigration continued following the liberalization of the system through the 1965 Hart-Celler Act. As of 2021, there were about 9 million foreign-born non-Hispanic white people in the U.S., about 5% of the non-Hispanic white population.
Today’s U.S. white population, then, is made up, to a substantial extent, of people whose earliest American ancestors arrived after the end of slavery—and who therefore are as little obliged to pay reparations as are their Hispanic and Asian peers in a similar situation. How many people, exactly, does that cover? What fraction of the U.S. population might be said to be on the hook for slavery? The next section turns to modeling tools to provide an estimate of the answer.
Modeling Post-1860 Population Growth
What fraction of today’s nonblack population is descended from people who were here in 1860?[33] One way to think about this question is to ask a related one: What would the nonblack American population look like today, absent post–Civil War immigration? To answer this question, we can turn to the tools of population modeling. One simple approach often used by demographers is a so-called cohort component projection, which is built on the observation that, for any group, the population at time t + 1 is a function of the population at time t.[34] More precisely:
Population t + 1 = Population t + (Births – Deaths) + (Immigration – Emigration)
The question of what fraction of the post-1860 population is descended from the 1860 population is equivalent to the question of what population today would be if net immigration (immigration less emigration) had been 0 between 1860 and today. If America had sealed its borders at the start of the Civil War, how many people would live there in 2023? To answer that question, we need to estimate the counterfactual “natural increase” (births less deaths) in that period, beginning with the 1860 population. The following section attempts to construct birthrates and death rates for the intervening 160 years, and then applies them to the 1860 population to obtain estimates of the population attributable to that period.[35]
Deaths
Systematic efforts to estimate American mortality rates date to 1880, when the census bureau began tracking deaths in Massachusetts, New Jersey, the District of Columbia, and several large cities. By 1900, the total number of “death registration” states had expanded to 10. In the intervening years, the census bureau collected death data from these areas decennially. Beginning in 1902, the census bureau began collecting figures annually.[36] By 1933, all states were included in the death-registration areas.[37] Consequently, comprehensive counts of deaths prior to 1933 are somewhat hard to come by. Instead, demographers tend to rely on actuarial tools constructed using partial data known as “life tables,” which estimate the risk of death for a given age-period.
To estimate rates of death in the nonblack population between 1860 and present, I use three sources of life tables. The Human Life Database provides abridged life tables for each year 2002 through 2017, and for each three-year period surrounding the decennial censuses from 1940 to 2000.[38] To fill in the remainder of the twentieth century, I use the life tables from Centers for Disease Control (CDC) for 2018, 2019, and the three-year period around the 1900, 1910, 1920, and 1930 censuses.[39] Last, for the years between 1860 and 1899, I use the life tables constructed by demographer David Hacker.[40] Hacker’s tables are top-censored such that the probability of death of anyone over 80 is 100%; I correct for this, as subsequently detailed.
In all these data, I use observations of death rates for the white population. This is because we are interested in the survival rates of the nonblack population from 1860 onward. At the time, this population was overwhelmingly white. In 1860, there were just 339,000 natives, 155,000 Hispanics, and 35,000 Asians in the United States.[41] In total, this accounts for slightly less than 2% of the nonblack population. As such, and because there are no reliable estimates of the death rates for these very small subpopulations for early periods, the white rate is applied to the whole population.
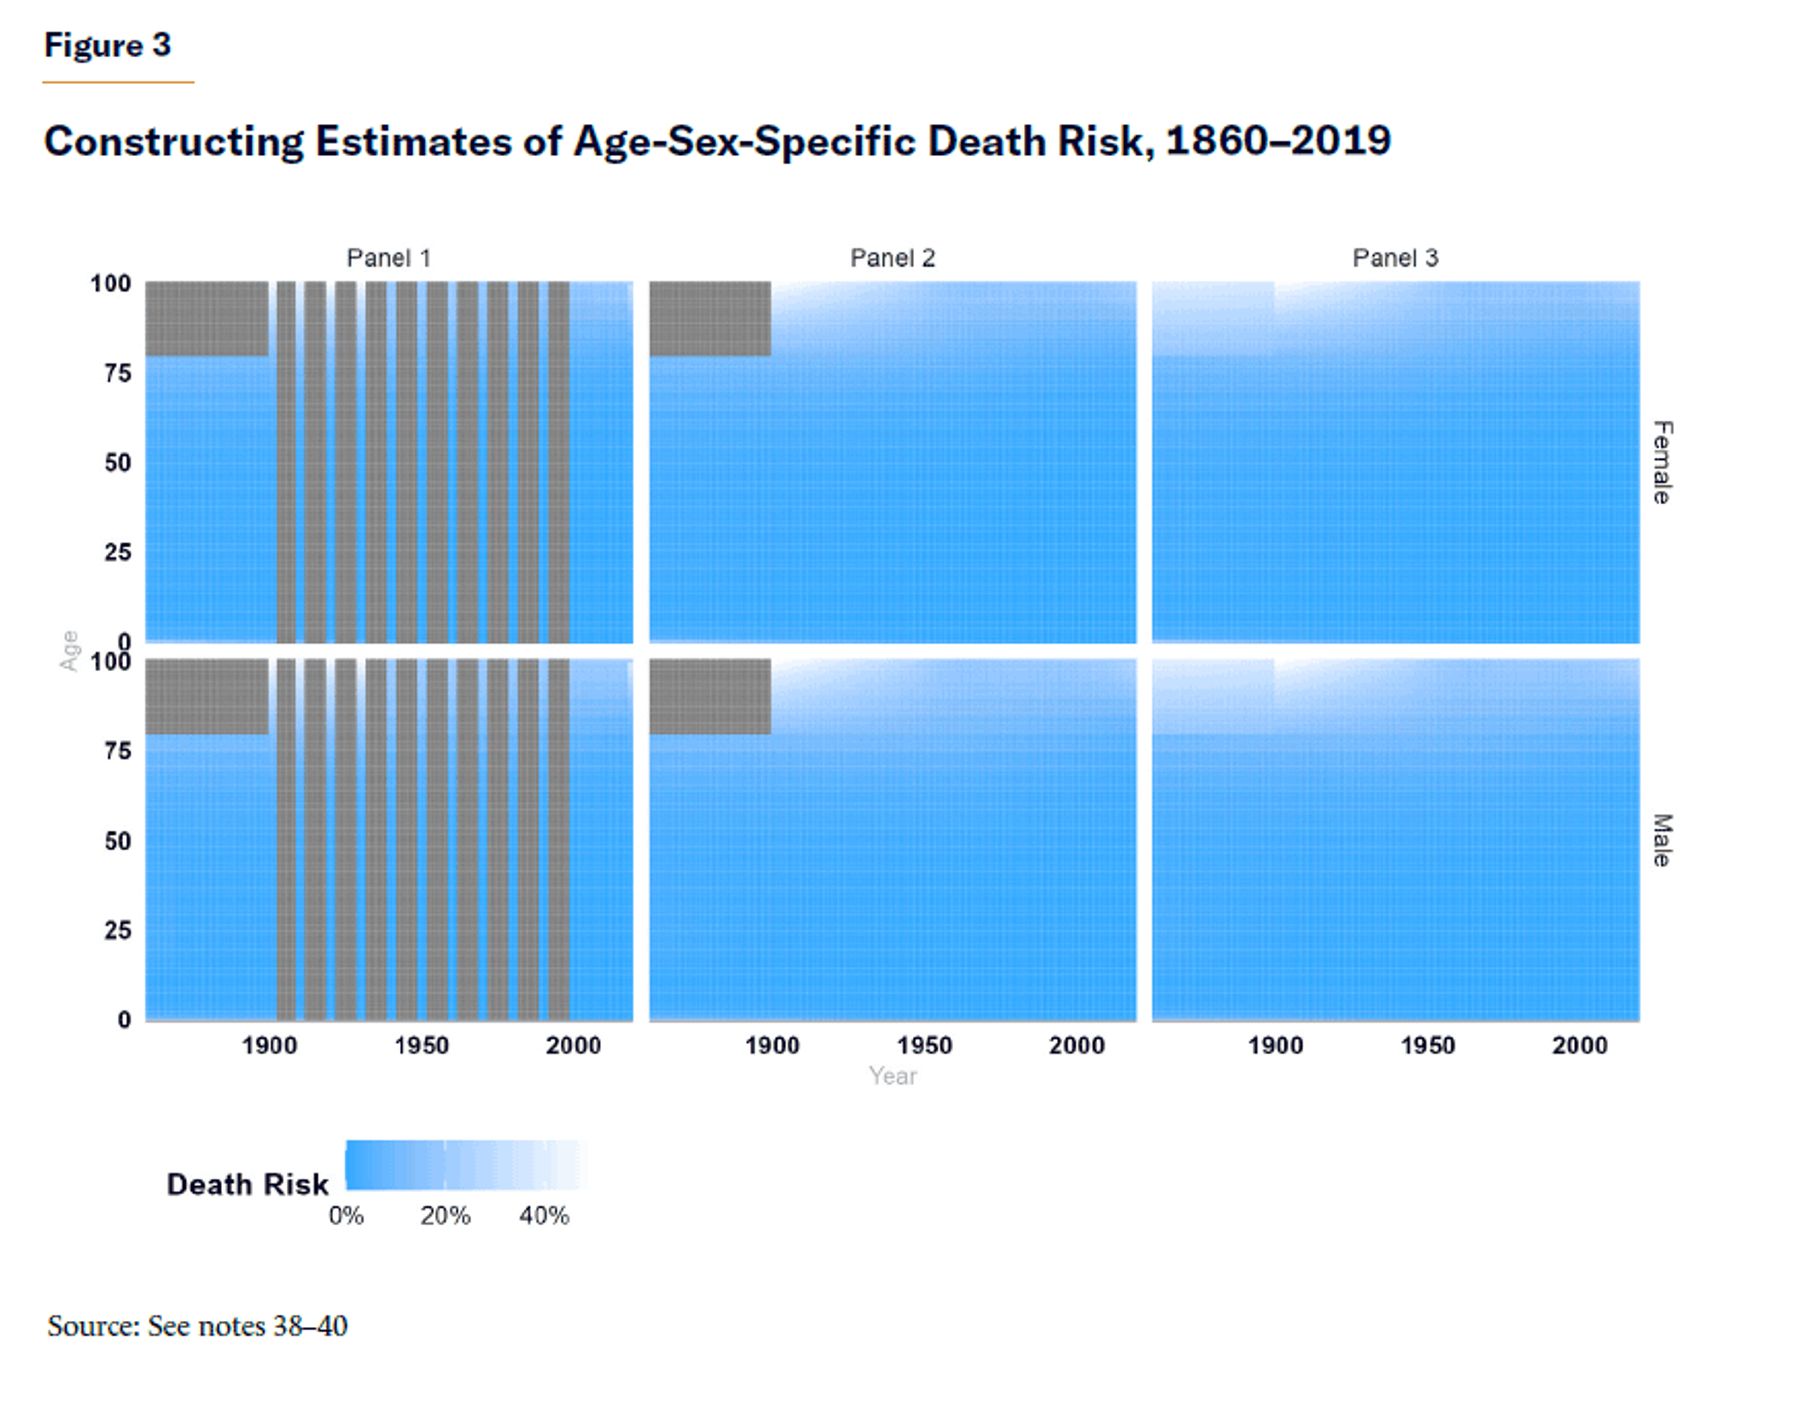
The first column of Figure 3 visualizes initial data available. In particular, it captures the risk of death (as represented by the intensity of the coloring) for each observed sex, year, and age combination. To construct a table of annual sex-age-year death risks, the unobserved risks need to be interpolated. I do so by generating a LOESS model for each age-sex combination, which, in effect, draws a smooth line describing the change in death risk for that combination over time. The predicted values from the LOESS model then become the death risks for each sex-age-year combination, as depicted in the second column. Last, I “backfill” the pre-1900 over-80 death risks by training another LOESS model on the new data set, and then filling in the predicted death risk for the missing sex-age-period cells. The result is depicted in the third column.
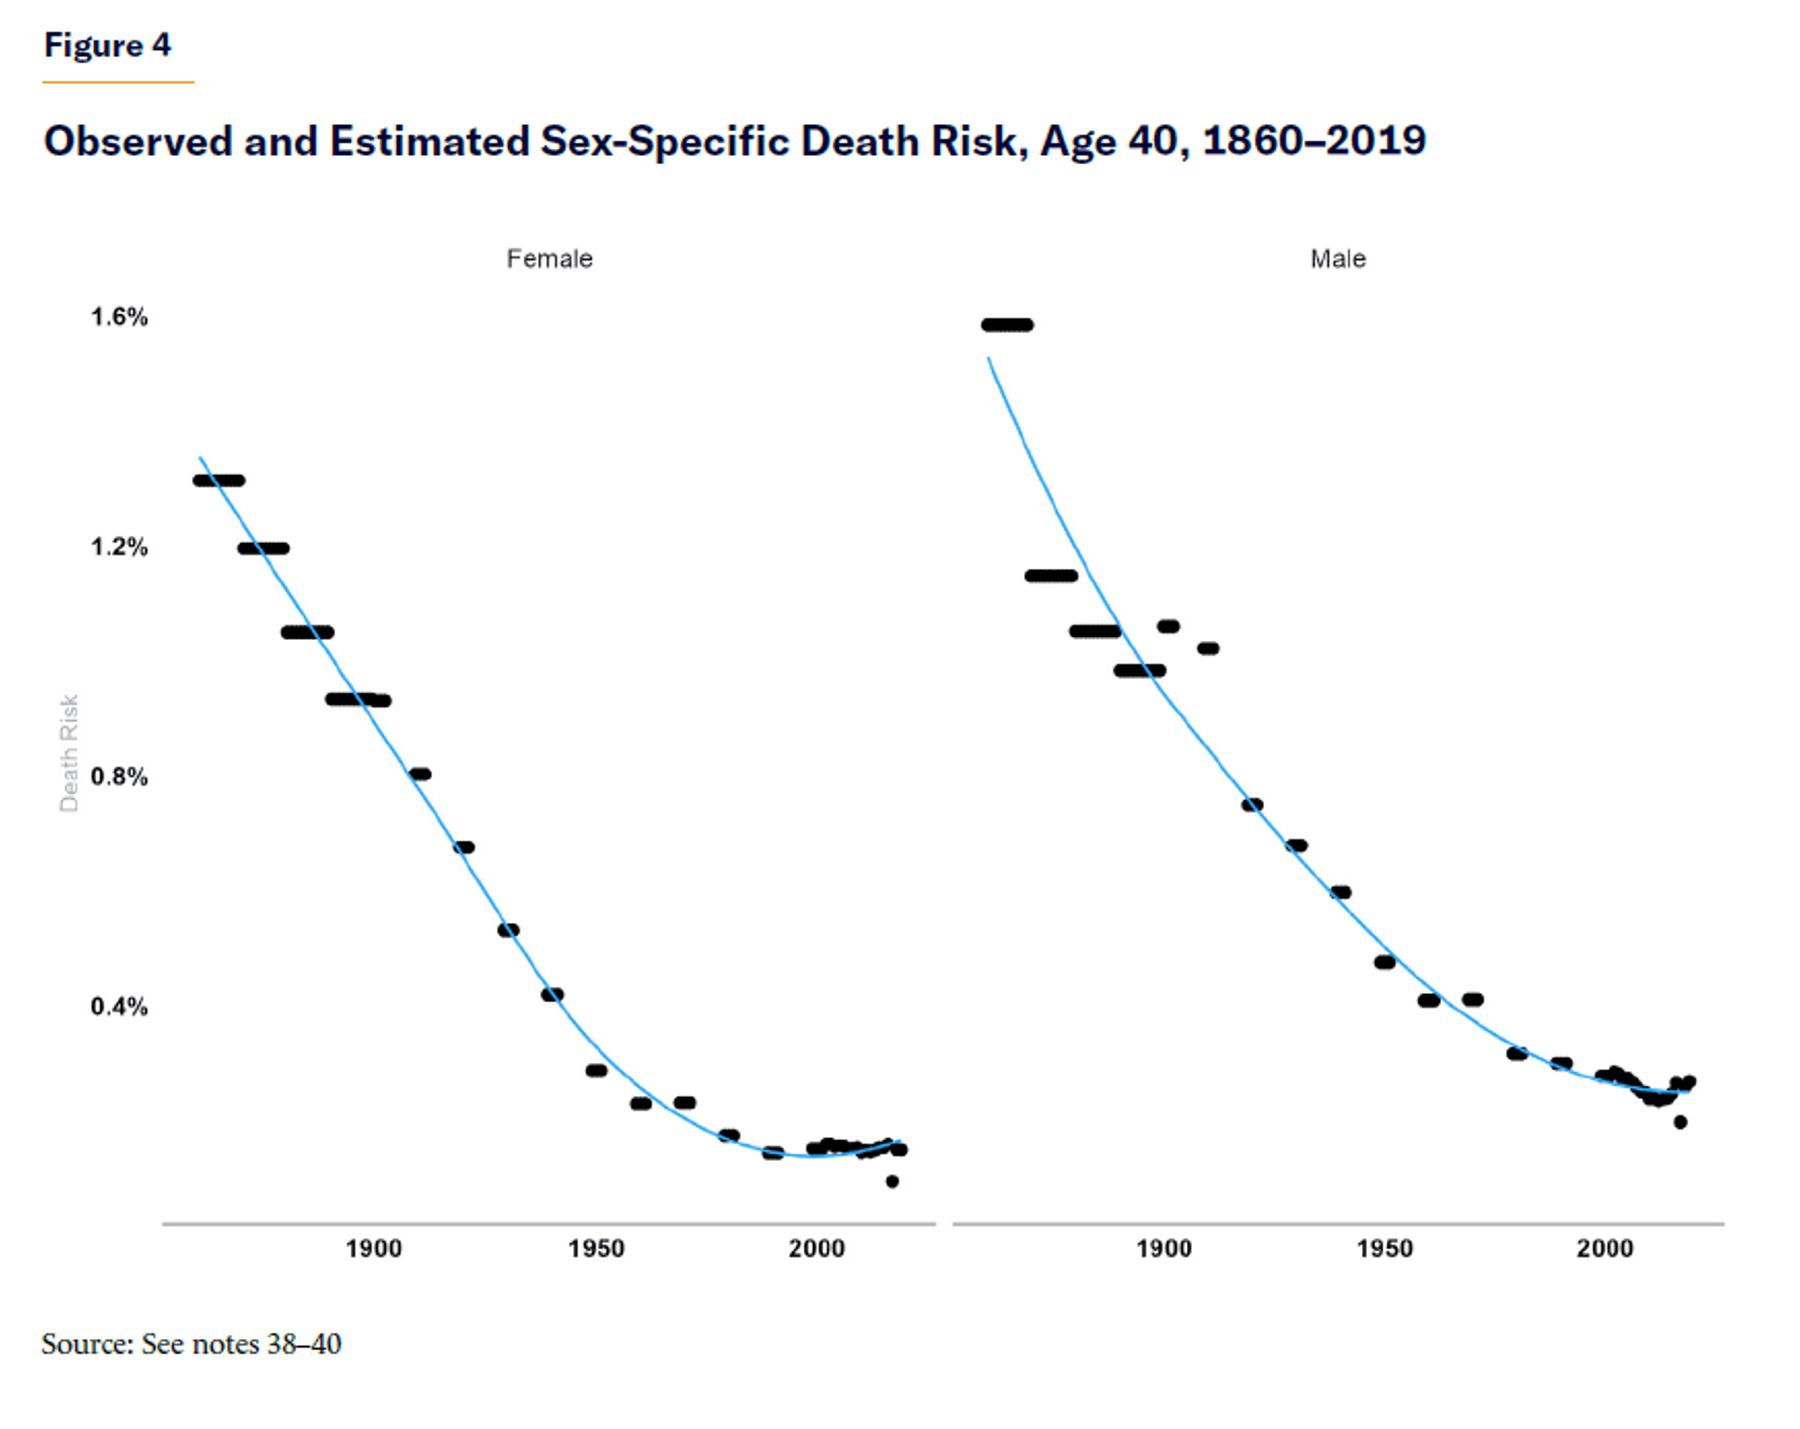
One result of this exercise in depicted in Figure 4, which shows the observed (points) and model-predicted (line) death risks for 40-year-olds by sex and year. This figure illustrates that the model roughly follows the observed course of historical death rates, and so is likely an accurate proxy of the historical norm.
Births
Constructing estimates of the number of births attributable to the nonblack 1860 population and its descendants poses a particular challenge. This is because immigrants often have different rates of fertility from the native-born population. This is true in recent years: in 2019, the immigrant total fertility rate was about 20% higher than the native-born fertility rate; it was 30% percent higher in 2002–04.[42] But it is historically true as well. In 1900, European immigrants of a variety of backgrounds had more children than native-born Americans.[43] In 1900–1910, foreign-born whites had a total fertility rate 35% higher than native-born whites, equivalent to 1.2 children more.[44] Consequently, simply using historical crude birthrates (i.e., births over population), or even historical white crude birthrates, will tend to overestimate the fertility of the pre-1860 stock. We can attempt to correct for this issue, but there are limitations (which will be discussed toward the end of the modeling exercise).
Estimating the crude birthrate requires two figures: the total number of children born in a year (the numerator); and the total population from which those children came (the denominator). To account for the differences in native and foreign-born birthrates, I estimate the total number of white children born to parents who were themselves native-born as the numerator, and the total white native-born population as the denominator—as close as possible to the white native-born birthrate as can be estimated.[45] These crude birthrates can then be applied to my synthetic population to estimate the births generated by that population in any given year.
To obtain counts of white children born of native parents, I use two distinct data sources. Between 1880 and 1970, the U.S. Census asked respondents about their parents’ birthplace. From 1994 through present, CPS-ASEC also asks these questions.[46]
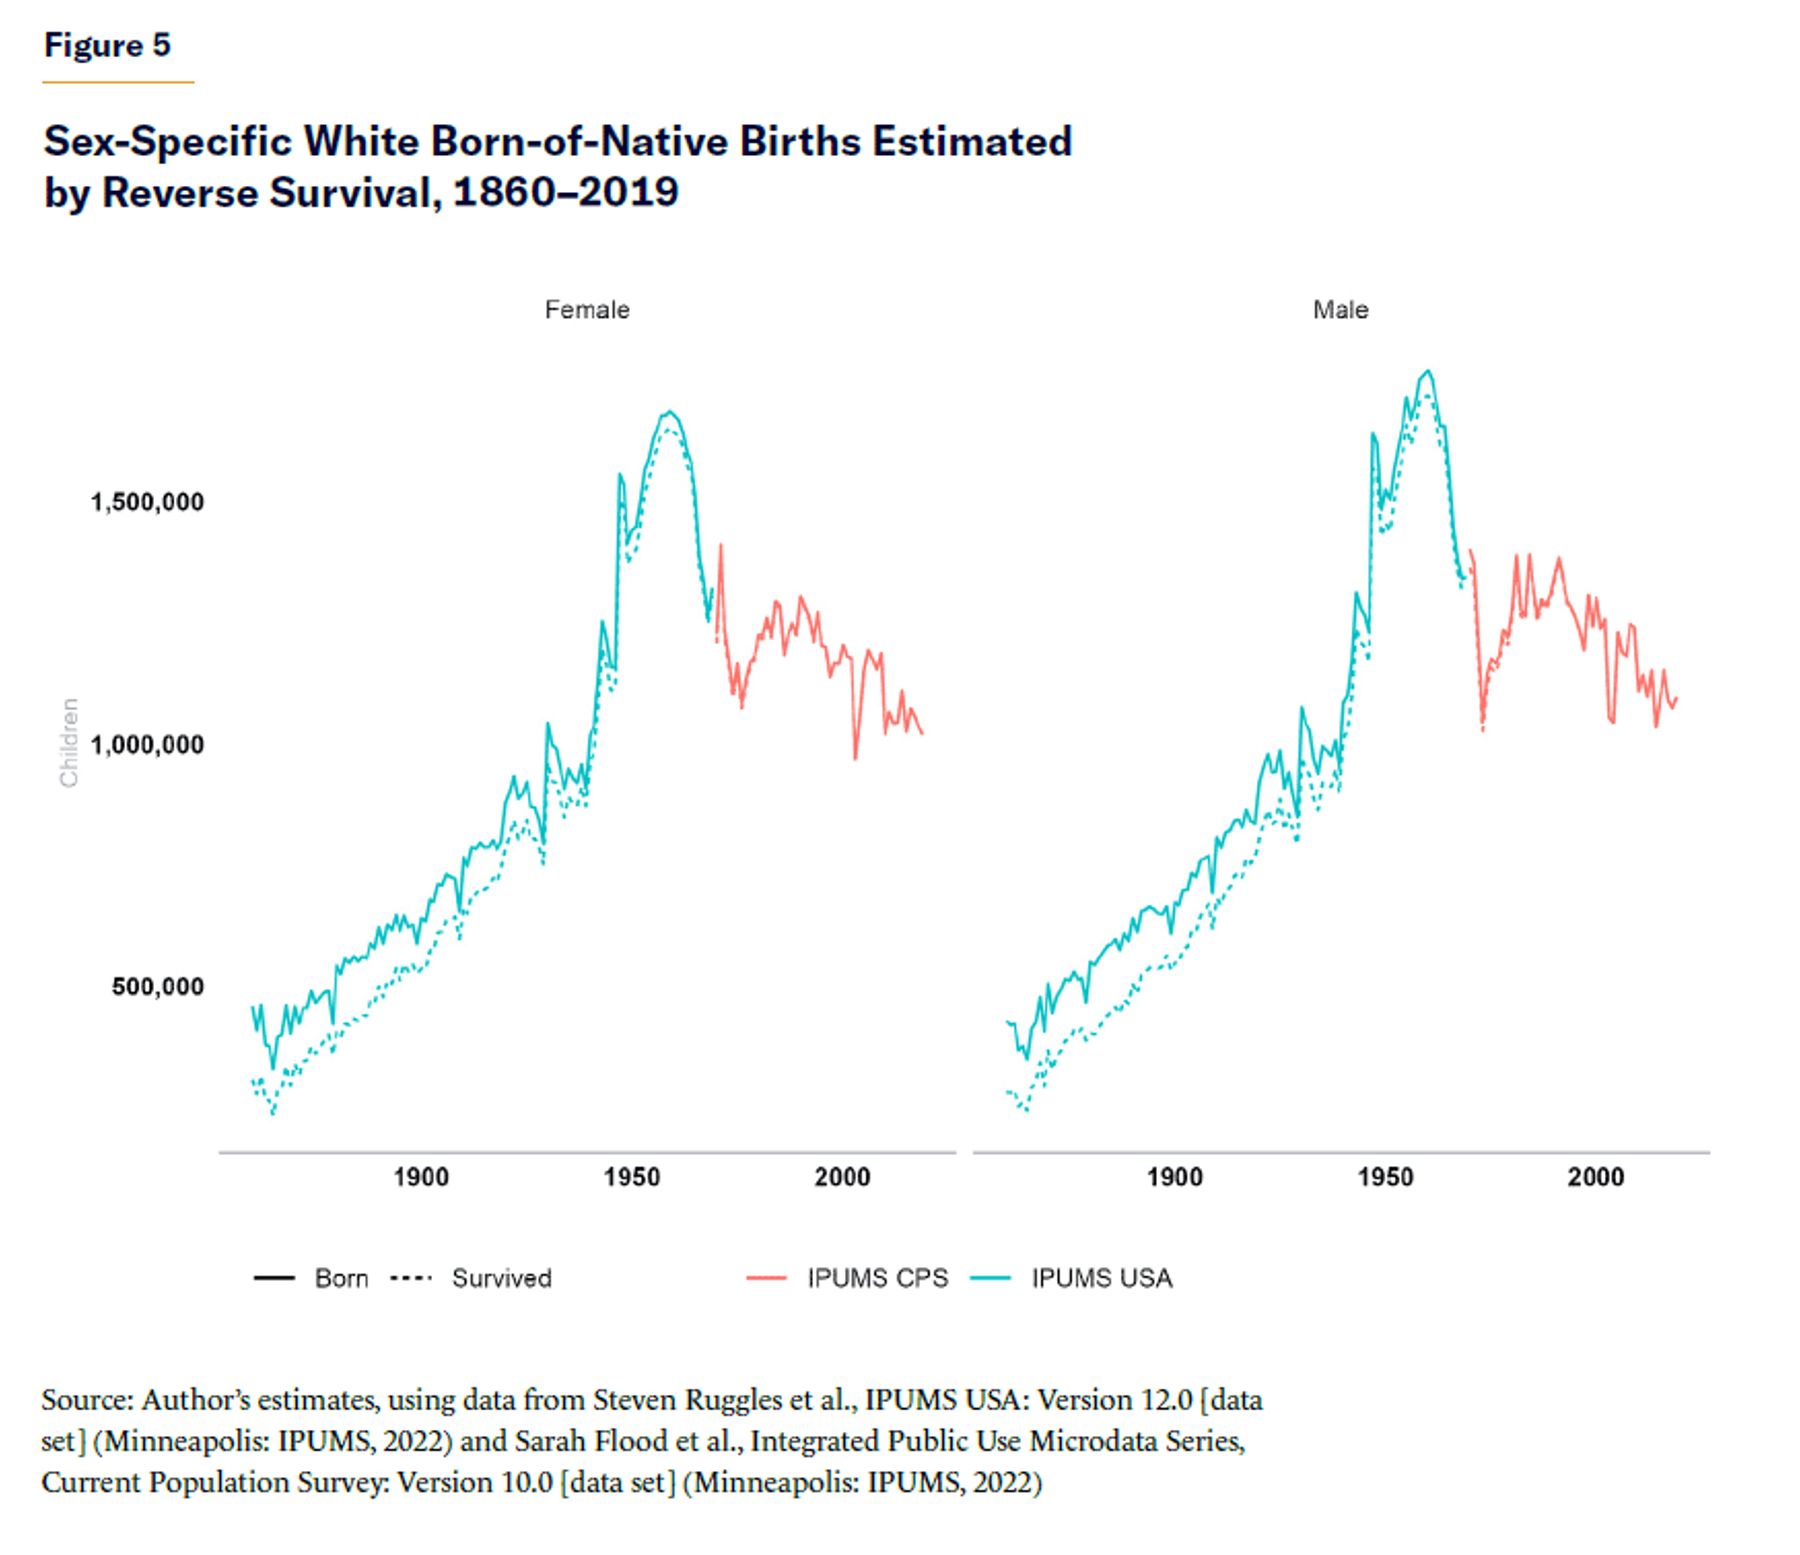
For each census in which data are available, I obtain counts of respondents who were born in the intercensal period, e.g., counts of white, born-of-native children aged 1–10 in the 1970 census. I then use the single-year-age life tables constructed in the previous section to obtain estimates of each cohort’s count at birth. To fill the “gap” in response coverage between 1970 and 1994, I do the same exercise with the 1994-vintage data. For 1995 onward, I simply use counts of born-of-native whites who are age 0 at the time of the survey. Figure 5 shows the results of this exercise, including counts of surviving population and estimated births.
Constructing the native-born population—the denominator of the new crude birthrate—is a more straightforward proposition. To do so, I use Census and ACS counts of the population that reports being born in the U.S. (decennially 1860–2000, and then annually through 2019). As above, I fit a LOESS model to these data, and then use the predicted results to interpolate an estimated native-born population for each year in the whole period 1860–2019.
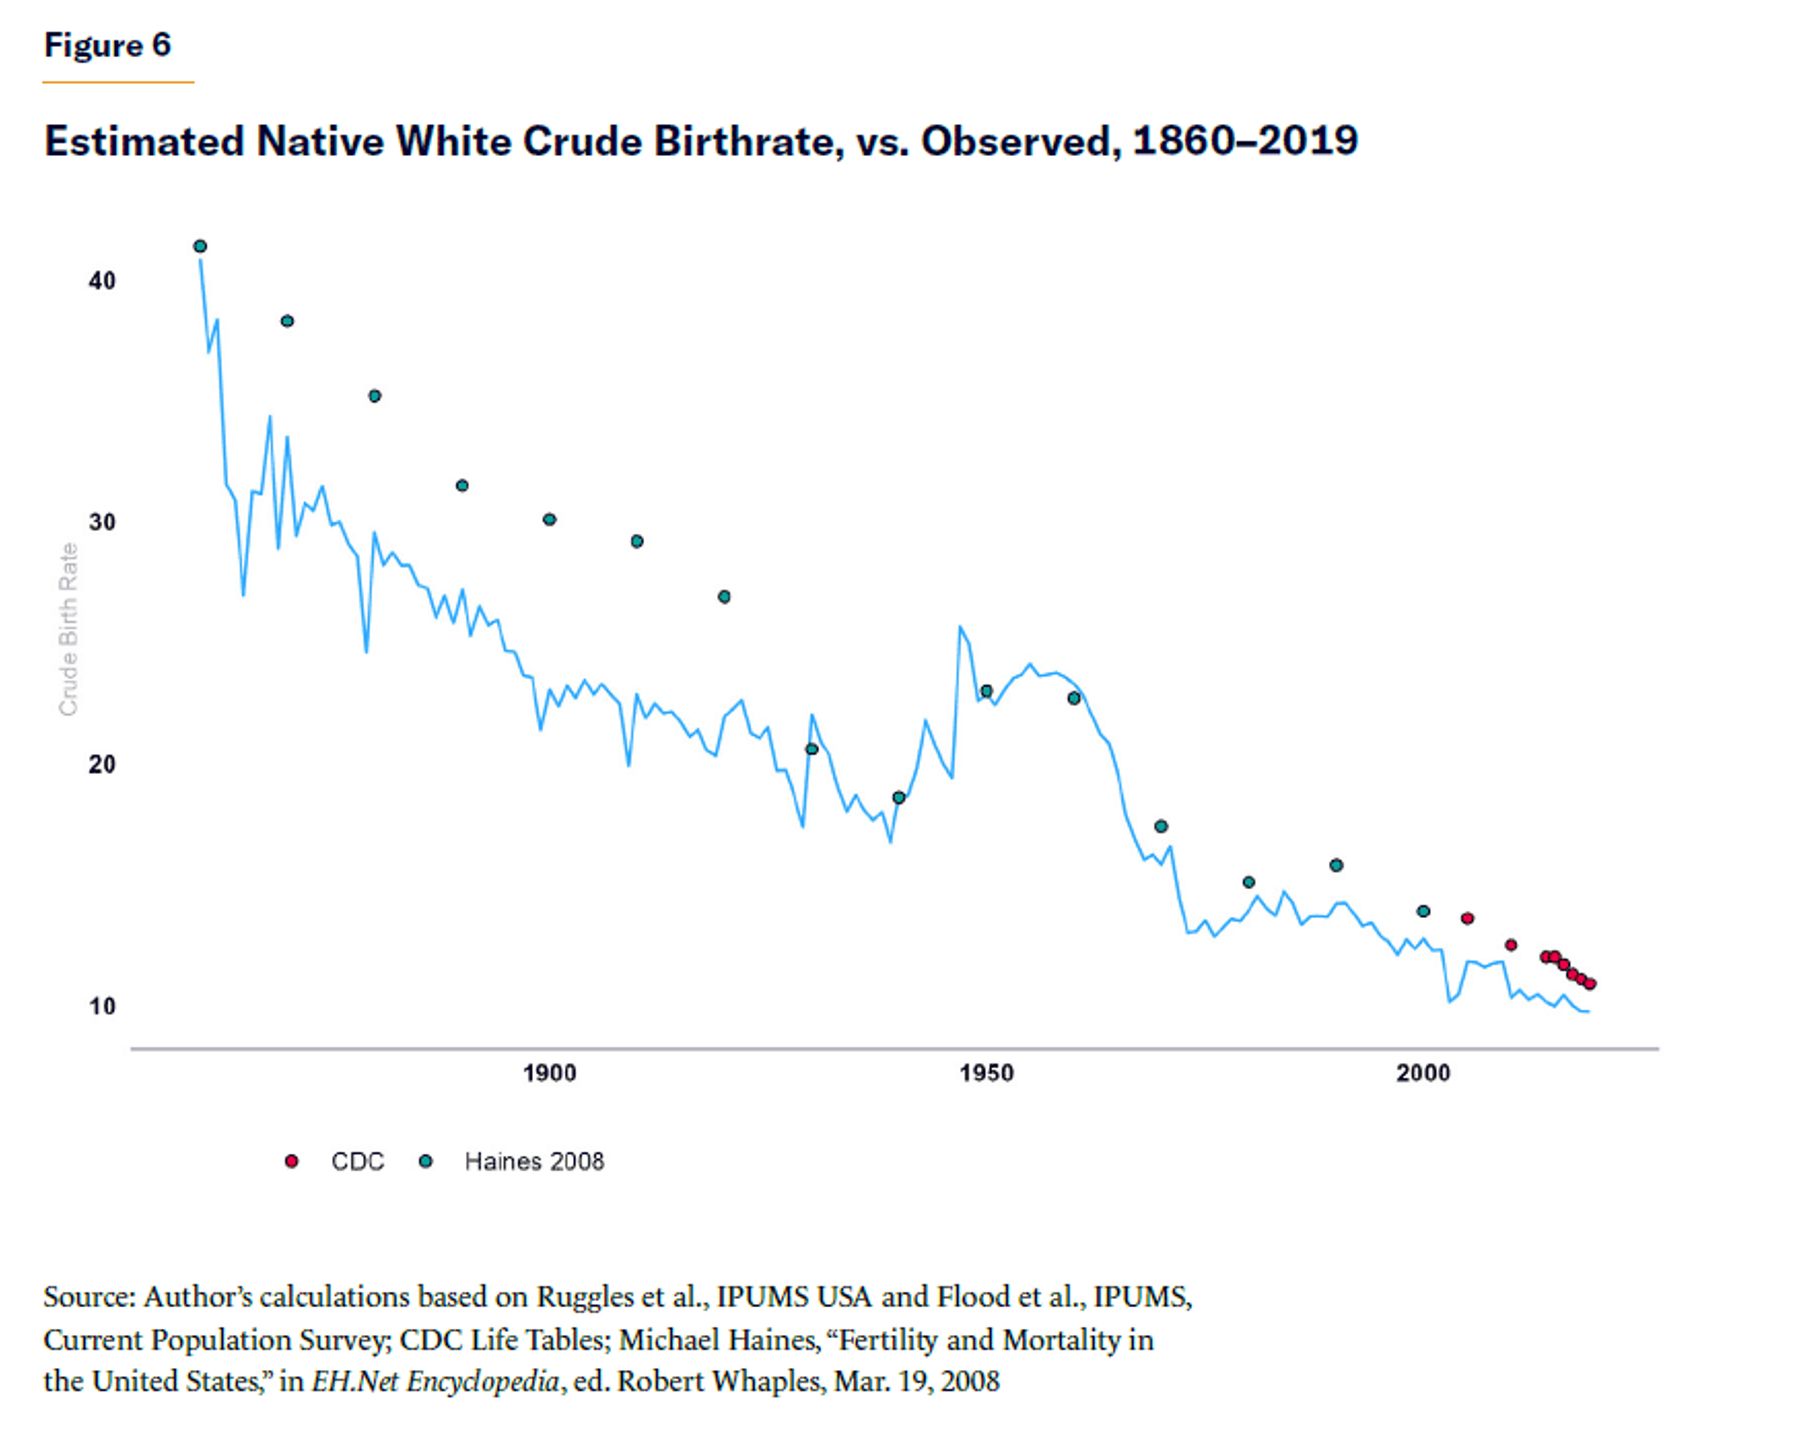
Dividing the estimates from Figure 5 by this population produces the native-born crude birthrate, depicted in Figure 6 as the rate per 1,000 population. Imposed on top are historical estimates of the white birthrate (from demographer Michael Haines through 2000 and from CDC after that).[47] These figures suggest that overall white fertility was substantially higher than native-born white fertility in 1870–1920—i.e., the postwar period with the highest levels of white immigration. Observed birthrates then converge to estimates in the moratorium period, before rising slightly in the period following the 1965 immigration reform.
Modeling Population Advancement
Having constructed annual estimates of the birthrates and death rates, it is now possible to model the growth of the 1860 population absent immigration. Doing so is as simple as starting with the nonblack population, divided by sex and single-year age group. For each cell, I reduce the population by the estimated fraction of deaths for that sex-age-year group. I then increment each cell by one year in age. Finally, I estimate the number of children attributable to the survived population, using the previously estimated crude birthrates. Repeating this process while incrementing the year produces a model of the population’s growth through the period of estimated death rates and birthrates.
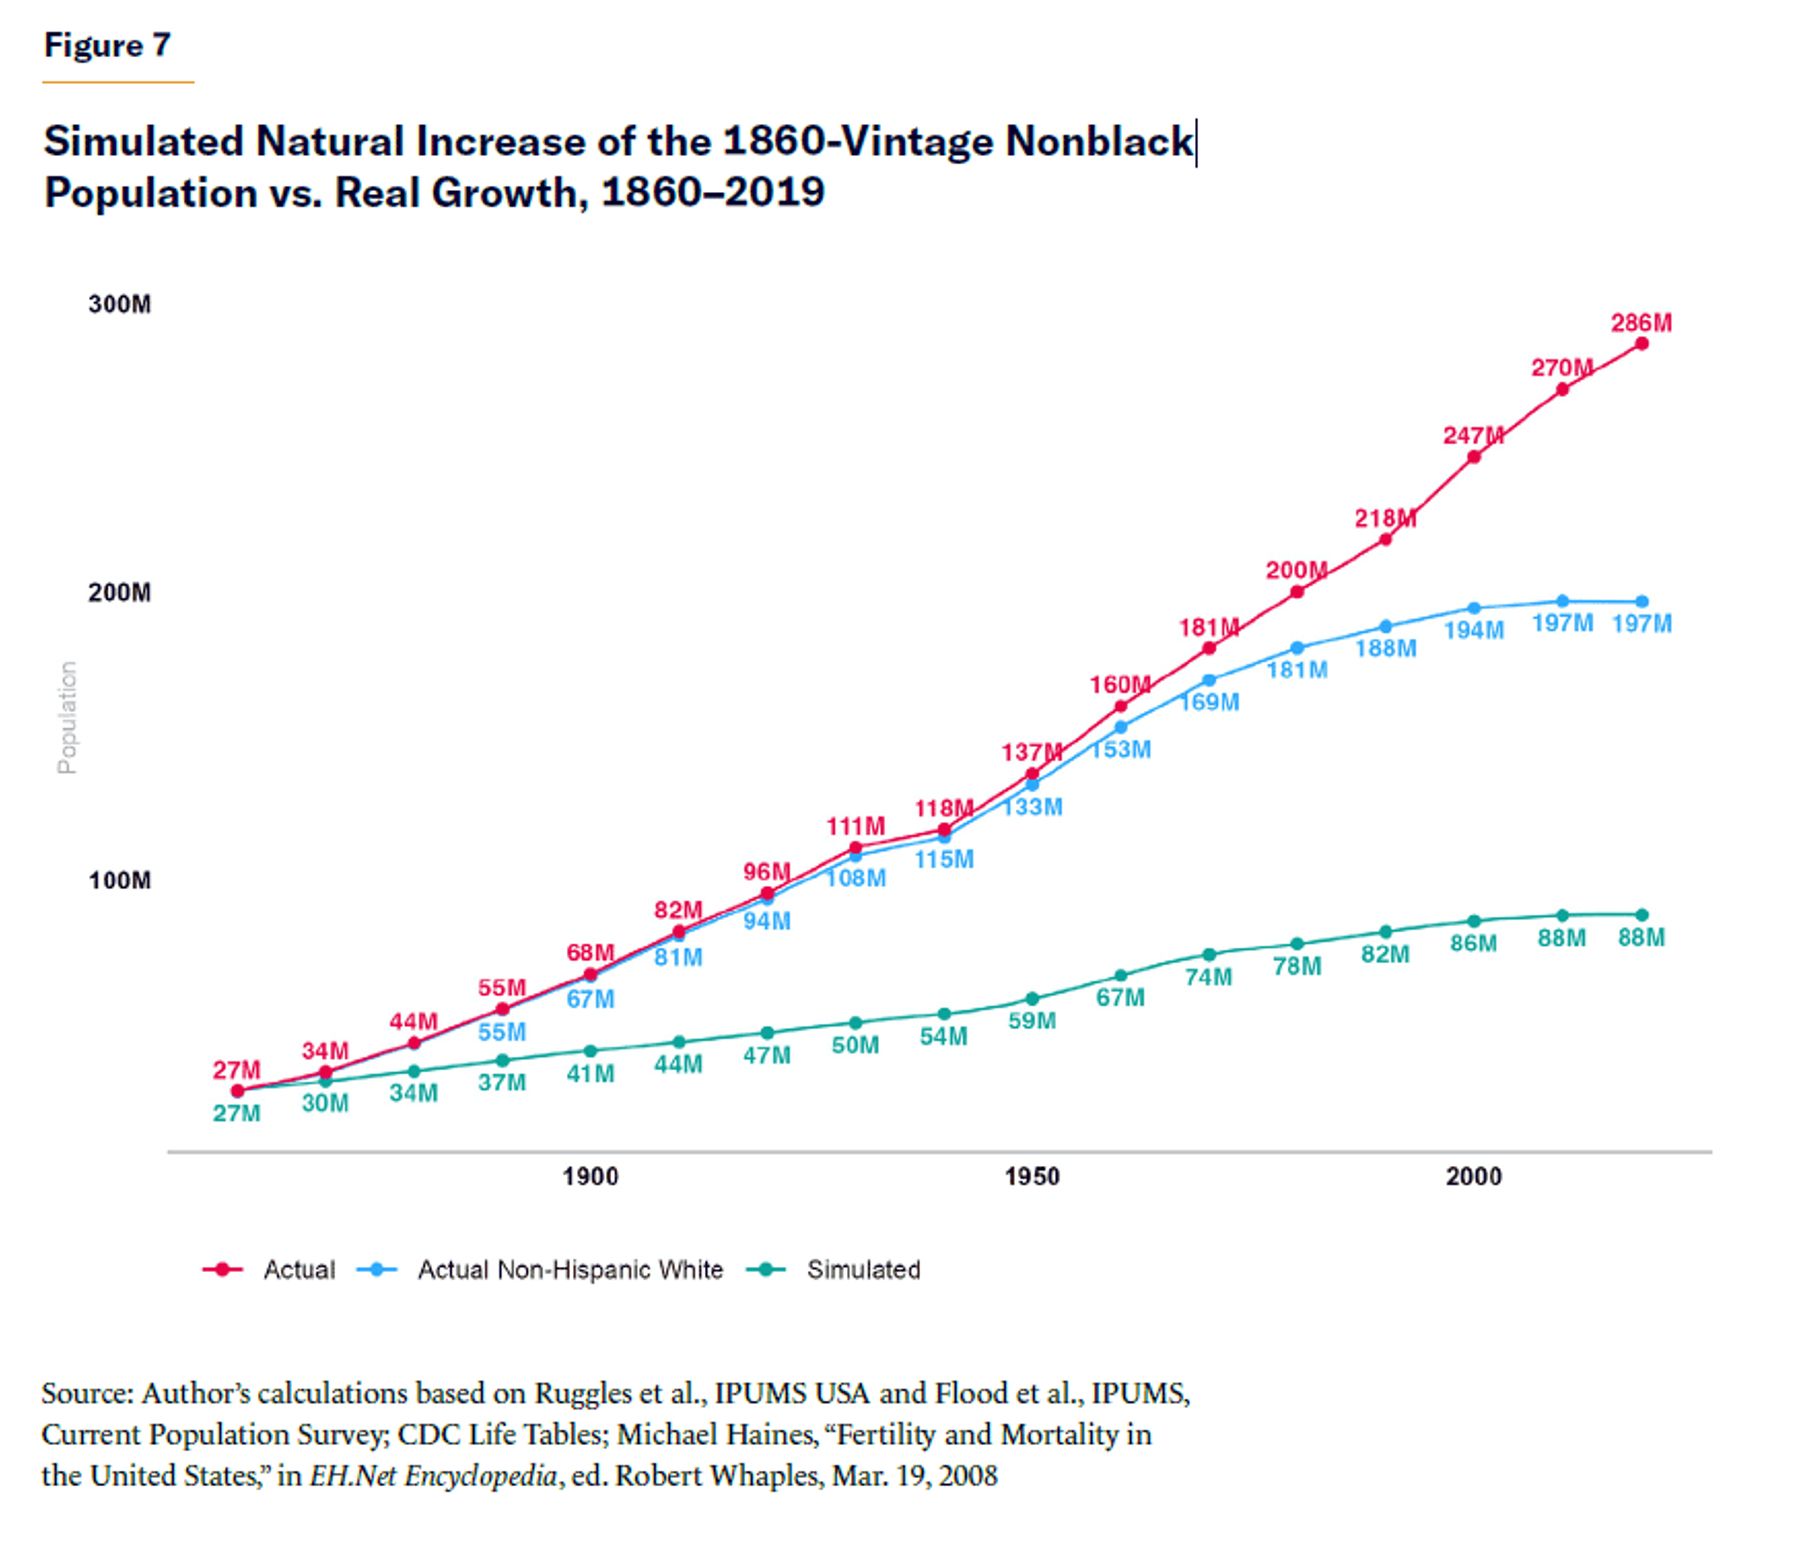
Figure 7 shows the results of this exercise. Assuming the accuracy of the above birth- and death-rate estimates, a circa-1860 population that grew only by natural increase would today number about 88 million. The actual nonblack population as of 2019, by contrast, was about 286 million. In other words, by this estimate, roughly 31% of today’s nonblack population is attributable to the natural increase of the 1860-vintage population. The remaining 69% are—again, assuming the accuracy of these estimates—attributable to immigration since 1860, either by direct arrival or by the natural increase of the immigrating population. Figure 7 further shows the real trends in the non-Hispanic white population, roughly 45% of which is attributable to the pre-1860 population—a plausible estimate, given the high levels of white immigration and their higher fertility rates.
To be sure, readers should not take this estimate as gospel. There are many limits to the data. In general, using observed death rates and birthrates (in the actual population) to estimate the rates in the counterfactual population requires the assumption that the two populations are fundamentally similar, even though they may not be. Early twentieth-century immigrants seem to have had higher death rates than their native-born peers; subsequent immigrants had lower death rates.[48] (I do not address these disparities, given the dearth of reliable death-registration data at the level of nativity in the early part of the period of interest.) As discussed, immigrants have different fertility rates from nonimmigrants, a discrepancy for which I partially correct. However, the above estimate is highly sensitive to how the native-born white crude fertility rate is estimated. Furthermore, the use of crude fertility rates, as opposed to total fertility rates, omits the influence of age structure on fertility.[49]
On the other hand, the estimate above is prima facie plausible, given the high rates of immigration in much of the twentieth century, the higher rates of fertility among those immigrants, and the fact that those immigrants’ children were, due to declining childhood mortality, more likely to survive to adulthood and reproduce than were the children of Americans prior to 1860. Recall that between 1866 and 1924, the U.S. added, by immigration alone, a number of people equivalent to roughly 80% of its 1870 population. Between 1960 and 2020, the foreign-born population nearly tripled, from 5.6% to 14.5%. These new arrivals, along with their children and children’s children, must have contributed substantially to the share of the nonblack population attributable to post-1860 arrivals.
In short, it seems likely that some substantial fraction of the nonblack population—as much as 70%—is descended from those who arrived after the end of slavery. Putting the remaining 88 million on the hook for reparations would represent a substantial fiscal burden—roughly $147,000 per person, assuming $12.9 trillion in reparations. By way of comparison, the 2021 median household income—where households generally contain several people—for native-born whites who reported British, English, French, Dutch, German, Irish, or Swedish ancestry[50] was $93,000. The amount of $147,000 represents roughly the 73rd percentile of annual household income for this group.
Immigration and Wealth
This last calculation highlights a larger point: whether the antebellum-descended nonblack population can plausibly fund $12.9 trillion in reparations depends on the size of that population and its total wealth. If reparations were funded by a progressive income or a wealth tax,[51] would there be enough money to cover the cost? Intuitively, we assume that, all else being equal, people whose families have been here longer will have more wealth and that the wealthiest among us are also those with the longest lineages. Testing this intuition, by measuring the ancestry composition of wealth, requires more detailed records than are available, but there are reasons to be skeptical that this is true.
Start with the most recent arrivals: foreign-born Americans as of 2021. On average, they are quite economically similar to their native-born peers. Immigrant and native-born households have similar median household incomes ($69,622 and $69,734, respectively) and poverty shares (14% and 13%).[52] Immigrants are underrepresented at the top of the distribution but not nonexistent: one 2017 paper estimates that about 5.2% of those in the top 1% by wealth are immigrants, compared with a population incidence of 14.6%.[53]
Today’s foreign-born population is, of course, just a fraction of the post-1860 attributable population. One way to assess the relationship between wealth and recency of arrival is simply to estimate median household income by self-reported ancestry. As shown in the Appendix, many of the poorer ancestry groups are likely attributable to post-1965 arrivals, coming from Africa and Latin America. But many of those at the top of the distribution are also recent arrivals: Asian Indians, Taiwanese, Israelis, and Australians. Indeed, of the top 25 spots on the list, only six even plausibly represent pre-1860 arrivals: those who self-identified as Western Europeans, Northern Europeans, Europeans, Alsatians, or from the British Isles.
What about the extremely rich? Consider the top of the Forbes list of billionaires.[54] Although detailed genealogies of these individuals are not generally available, informed guesses based on reports of ancestry and details like surnames provide insight. Among the top 50 billionaires Forbes identifies as U.S. residents, seven are immigrants—Tesla’s Elon Musk (South Africa), Google’s Sergey Brin (Russia), Chanel’s Alain and Gérard Wertheimer (France), News Corp’s Rupert Murdoch (Australia), Nvidia’s Jensen Huang (Taiwan), and Interactive Brokers’ Thomas Peterffy (Hungary).
At least another two—Microsoft’s Steve Ballmer and Bridgewater’s Ray Dalio—are the children of immigrants. Another 15 are of Jewish descent, which makes it more likely that their families arrived after 1860.
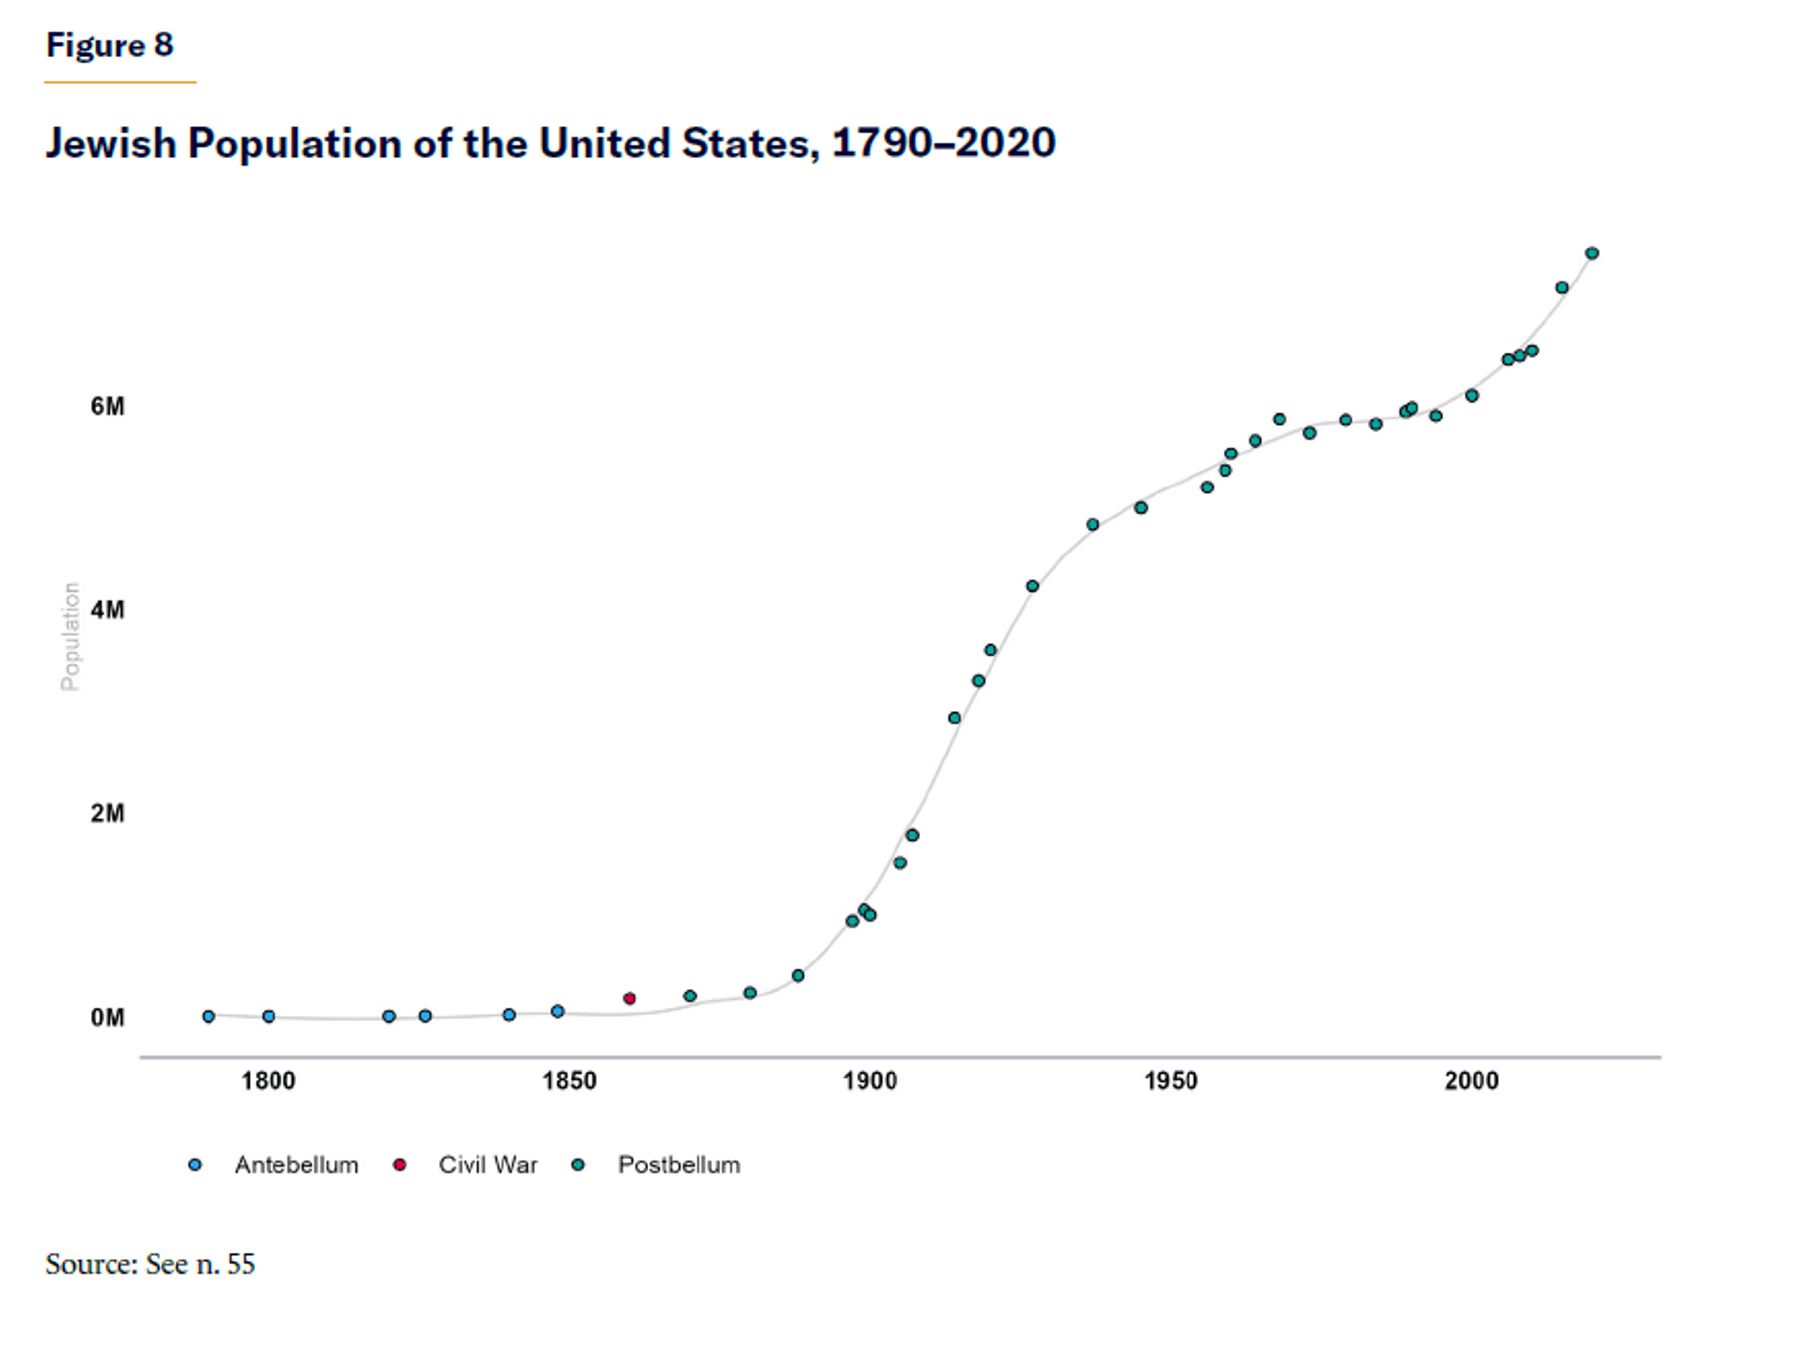
This last point—the prevalence of Jews as a post-1860 arrival group among the very wealthy—is worth briefly expanding on. Jews are, in general, higher earners than the rest of the population. Roughly one in four reports a household income of over $200,000 per year, for example, compared with 4% of the population.[56] This is important for our purposes because most Jewish Americans can trace their origins to the wave of Jewish immigration from Eastern Europe in the late nineteenth century. As Figure 8 shows, the Jewish population was relatively small (150,000–200,000) in the lead-up to the Civil War, consisting mostly of the small, often Sephardic, founding stock and German Jewish immigrants in the interceding years.[57] In the ensuing years, however, it exploded, an increase attributable to mass immigration—half a million Jews arrived in Baltimore, New York, and Philadelphia alone between 1885 and 1899—and natural increase.[58]
It is from this stock that the overwhelming share of contemporary Jewish Americans come. In a 2020 Pew survey, in fact, 86% of Jews identifying with an ancestry group labeled themselves Ashkenazi, as opposed to 4% who called themselves Sephardic; 90% of Jews were born in the U.S., and 68% were born of native-born parents.[59] Jews are, in this regard, plausibly the group that is—on account of their wealth and race—most likely to be made liable for reparations, even though the overwhelming majority are not attributable to the antebellum population.
But what about the rest of the very wealthy? Many of the names on the Forbes billionaire list, and many of the ancestries listed near the top of median household incomes in the Appendix, are plausibly of antebellum extraction. This suggests that they may be funders of reparations.
Yet there is reason to believe that the top of the American economic pyramid will not be pre–Civil War forever. New high-earners are often recent arrivals: roughly half of Fortune 500 companies were founded by immigrants or the children of immigrants, for example.[60] Robust research suggests that high-skilled immigrants, in particular, disproportionately drive innovation, the benefits of which should continue to make the top of the distribution less native-born (or born-of-native-born) over time.[61] In other words, whether measured by wealth or number of people, the plausible pool to pay for reparations will continue to dwindle.
Conclusion: Immigration and the Reparations Project
In mid-2014, commentator Ta-Nehisi Coates reignited the reparations debate with his landmark Atlantic essay, “The Case for Reparations.”[62] The essay attracted widespread attention, praise, and criticism. Two years later, in an interview with Coates, another prominent black American dissented for reasons that should by now be familiar to the reader:
The bottom line is that it’s hard to find a model in which you can practically administer and sustain political support for [reparations]. And what makes America complicated as well is the degree to which this is not just a black/white society, and it is becoming less so every year. So how do Latinos feel if there’s a big investment just in the African American community, and they’re looking around and saying, “We’re poor as well. What kind of help are we getting?” Or Asian Americans who say, “Look, I’m a first-generation immigrant, and clearly I didn’t have anything to do with what was taking place.”[63]
President Barack Obama’s point is, in more succinct terms, the point of this report: America’s demographic transformation poses an insurmountable problem for the reparations agenda. But the problem generalizes, applying not only to reparations but to transfers legitimated by historical injustice more generally.
On the eve of the Civil War, the nonblack American population was little changed from its composition at the Founding, save for the few residents of the West added by annexation and some immigrants drawn primarily from the same national origin groups who constituted the Founding stock. Not all these people participated in the “peculiar institution”; indeed, a great many of them fought against it, both before and during the war. But they at least coexisted with that institution, and so—within reparations’ strange logic—their descendants might be accountable for making payment for that wrong.
In the decades following the war, America experienced two great waves of immigration. The first consisted of millions of Europeans, including Southern and Eastern European groups previously all but absent from the United States. The second, still ongoing, has meant the arrival of millions more, introducing to the country a substantial population that is neither white nor black. This wave will have profound implications for, among other factors, the ancestry composition of the American population. By 2065, the Pew Research Center has projected, 54% of Americans will be either first-generation immigrants (18%) or their children (36%).[64]
The argument of this report has been that this population change substantially erodes the base of people who might reasonably be held responsible for paying reparations for slavery. Many millions of Americans do not have ancestors who were present in the U.S. prior to the abolition of slavery; even granting the tenuous proposition that it might be reasonable to demand someone pay reparations, it is certainly not them. Furthermore, this population change is not slowing. With each passing year, immigration further shrinks the population share plausibly eligible to pay a debt for slavery.
Reparations are but the most extreme version of a more general category: race-specific benefits justified by reference to past harm (affirmative action, hiring preferences, funding for black-owned businesses, etc.). The argument for such benefits is, roughly, that black Americans are today disadvantaged by injustices meted out to their ancestors. Consequently, policy should seek to ameliorate the lasting effects of those injustices and, in so doing, make recompense for them. But even though the harm is real, it is contingent on the payer being a beneficiary, or at least having some historical connection to the harm. As America grows ever more diverse, and as more and more of its population—especially its richest population—is descended from more recent arrivals, that grows less true. Thereby, the justification by reference to past harm loses more and more of its legitimacy.
This tension between arguments from historical guilt and immigration is already having an effect. As some have argued, the recent end of affirmative action in college admissions was a product not merely of the composition of the Supreme Court but the inexorable logic of demographic change.[65] In this view, the project of affirmative action—of race-based preferences in admissions—was only possible in an America where a large, white majority had no substantial claim to being meaningfully harmed by the saving of a few spots for a small, historically oppressed, black minority. But the racial rebalancing of the U.S. brought about by post-1965 immigration cut the legs out from under affirmative action because it put black beneficiaries in direct competition with other minorities who were substantially disadvantaged by the existence of those benefits. Immigration, in other words, made the arguments that grounded affirmative action unsustainable.
Rapid demographic change will continue to erode the legitimacy of such historical guilt arguments for decades to come. This reality is a problem for the advocate of reparations, but it is an asset to critics of reparations and other race-conscious transfer programs. The theoretical justification for those programs declines in potency each day; the constituency against them grows.
About the Author
Charles Fain Lehman is a fellow at the Manhattan Institute, working primarily on the Policing and Public Safety Initiative, and a contributing editor of City Journal. His work has appeared in outlets including The Atlantic, the Wall Street Journal, National Affairs, and National Review. He has discussed public safety policy before the U.S. House of Representatives and the U.S. Commission on Civil Rights, and at colleges including Carnegie Mellon and Cornell. He is a 2023–24 Robert Novak fellow with the Fund for American Studies. Prior to joining the Manhattan Institute in 2021, Lehman was a staff writer at the Washington Free Beacon. He is originally from Pittsburgh, Pennsylvania, and now lives outside Washington, D.C., with his wife and son.
Appendix: Median Household Income by Self-Reported Ancestry, 2021
This table reports median household incomes by ancestry group in the 2021 ACS (IPUMS extract). Replication codes are available in the report’s Github repo.
| Rank | Ancestry | Median Household Income |
| 1 | Asian Indian | $158,900 |
| 2 | Taiwanese | $134,000 |
| 3 | Eastern European | $131,216 |
| 4 | Israeli | $125,000 |
| 5 | Australian | $124,000 |
| 6 | Belorussian | $120,300 |
| 7 | Western European | $120,000 |
| 8 | Iranian | $118,000 |
| 9 | Filipino | $116,000 |
| 10 | New Zealander | $115,635 |
| 11 | Latvian | $114,018 |
| 12 | Luxembourger | $113,670 |
| 13 | South African | $113,410 |
| 14 | Japanese | $112,100 |
| 15 | Punjabi | $111,014 |
| 16 | Chinese | $111,000 |
| 17 | Northern European | $110,782 |
| 18 | Okinawan | $107,300 |
| 19 | British Isles | $107,000 |
| 20 | Russian | $106,365 |
| 21 | Maltese | $106,060 |
| 22 | European | $106,000 |
| 23 | Alsatian, Alsace-Lorraine | $105,355 |
| 24 | Malaysian | $105,000 |
| 25 | Hong Kong | $105,000 |
| 26 | Greek | $104,227 |
| 27 | Croatian | $104,000 |
| 28 | Gambian | $103,675 |
| 29 | Pakistani | $103,500 |
| 30 | Korean | $103,000 |
| 31 | Lebanese | $102,600 |
| 32 | Estonian | $102,280 |
| 33 | Lithuanian | $102,000 |
| 34 | British | $102,000 |
| 35 | Austrian | $102,000 |
| 36 | Canadian | $101,632 |
| 37 | Chamorro Islander | $101,206 |
| 38 | Sri Lankan | $100,360 |
| 39 | Bulgarian | $100,027 |
| 40 | Asian | $100,000 |
| 41 | Zimbabwean | $100,000 |
| 42 | Southern European | $100,000 |
| 43 | Serbian | $100,000 |
| 44 | Italian | $100,000 |
| 45 | Belgian | $100,000 |
| 46 | Other | $99,910 |
| 47 | Turkish | $99,720 |
| 48 | Guyanese/ British Guiana | $99,121 |
| 49 | Swiss | $98,500 |
| 50 | Czechoslovakian | $98,400 |
| 51 | Tibetan | $98,397 |
| 52 | Portuguese | $98,000 |
| 53 | Scandinavian, Nordic | $97,900 |
| 54 | Danish | $97,732 |
| 55 | Albanian | $96,325 |
| 56 | Other Arab | $96,230 |
| 57 | Flemish | $96,172 |
| 58 | Thai | $96,000 |
| 59 | Indonesian | $95,668 |
| 60 | Swedish | $95,455 |
| 61 | Samoan | $95,113 |
| 62 | Slovak | $95,000 |
| 63 | Romanian | $95,000 |
| 64 | Other Asian | $94,000 |
| 65 | Icelander | $93,864 |
| 66 | Polish | $93,700 |
| 67 | Hmong | $93,560 |
| 68 | Irish, various subheads | $93,300 |
| 69 | Norwegian | $93,000 |
| 70 | English | $93,000 |
| 71 | Finnish | $92,806 |
| 72 | Slovene | $92,787 |
| 73 | Hawaiian | $92,174 |
| 74 | Armenian | $92,100 |
| 75 | Mixture | $91,970 |
| 76 | Scottish | $91,800 |
| 77 | Argentinean | $91,798 |
| 78 | Macedonian | $90,302 |
| 79 | Dutch | $90,100 |
| 80 | German | $90,000 |
| 81 | North American | $89,980 |
| 82 | Ukrainian | $89,000 |
| 83 | Basque | $87,946 |
| 84 | Prussian | $87,467 |
| 85 | Vietnamese | $87,100 |
| 86 | Moldavian | $87,100 |
| 87 | French Canadian | $87,018 |
| 88 | French | $87,000 |
| 89 | Hungarian | $86,900 |
| 90 | Laotian | $86,436 |
| 91 | Welsh | $86,000 |
| 92 | Scotch Irish | $86,000 |
| 93 | Fijian | $85,650 |
| 94 | Kurdish | $85,192 |
| 95 | Brazilian | $85,000 |
| 96 | Barbadian | $85,000 |
| 97 | Costa Rican | $85,000 |
| 98 | Central European | $84,787 |
| 99 | Yugoslavian | $84,500 |
| 100 | Bolivian | $84,000 |
| 101 | Syrian | $83,327 |
| 102 | Cambodian | $83,000 |
| 103 | Kenyan | $83,000 |
| 104 | Germans from Russia | $82,981 |
| 105 | Pacific Islander | $82,000 |
| 106 | British West Indian | $82,000 |
| 107 | Ghanian | $81,700 |
| 108 | Uncodable | $81,000 |
| 109 | British Virgin Islander | $80,595 |
| 110 | Chilean | $80,500 |
| 111 | Nepali | $80,100 |
| 112 | Sierra Leonean | $80,000 |
| 113 | Nigerian | $80,000 |
| 114 | Spanish | $80,000 |
| 115 | Colombian | $80,000 |
| 116 | Slav | $80,000 |
| 117 | South American Indian | $79,800 |
| 118 | Ugandan | $79,800 |
| 119 | Polynesian | $79,499 |
| 120 | Peruvian | $79,400 |
| 121 | Eskimo | $79,060 |
| 122 | Trinidadian/Tobagonian | $78,917 |
| 123 | West Indian | $78,500 |
| 124 | Panamanian | $78,191 |
| 125 | North African | $78,095 |
| 126 | Cameroonian | $78,025 |
| 127 | Jamaican | $77,400 |
| 128 | White/Caucasian | $77,300 |
| 129 | Cantonese | $77,023 |
| 130 | Bohemian | $77,000 |
| 131 | Sicilian | $77,000 |
| 132 | Texas | $76,900 |
| 133 | Grenadian | $74,896 |
| 134 | Rom | $74,841 |
| 135 | Uruguayan | $74,000 |
| 136 | Spaniard | $74,000 |
| 137 | Cossack | $74,000 |
| 138 | United States | $73,900 |
| 139 | Other Pacific | $73,396 |
| 140 | Acadian | $72,623 |
| 141 | Middle Eastern | $72,000 |
| 142 | Nicaraguan | $72,000 |
| 143 | South American | $71,929 |
| 144 | Uzbek | $71,804 |
| 145 | Palestinian | $71,200 |
| 146 | Ecuadorian | $71,182 |
| 147 | Egyptian | $70,100 |
| 148 | Tongan | $70,000 |
| 149 | Assyrian/Chaldean/Syriac | $70,000 |
| 150 | Cuban | $70,000 |
| 151 | West African | $69,600 |
| 152 | Venezuelan | $69,401 |
| 153 | Cape Verdean | $69,200 |
| 154 | Other Sub-Saharan Africa | $69,000 |
| 155 | Spanish American | $68,400 |
| 156 | Other West Indian | $68,198 |
| 157 | Eritrean | $68,017 |
| 158 | Central American Indian | $68,000 |
| 159 | Hispanic | $67,800 |
| 160 | Moroccan | $67,000 |
| 161 | Bahamian | $67,000 |
| 162 | Salvadoran | $67,000 |
| 163 | Haitian | $66,939 |
| 164 | Micronesian | $66,000 |
| 165 | Bengali | $66,000 |
| 166 | Ethiopian | $66,000 |
| 167 | Mexican | $65,700 |
| 168 | Latin American | $65,532 |
| 169 | Togo | $65,430 |
| 170 | Guamanian | $65,000 |
| 171 | Paraguayan | $65,000 |
| 172 | Georgian | $65,000 |
| 173 | Liberian | $64,968 |
| 174 | Mexican American | $64,500 |
| 175 | Chicano/Chicana | $63,467 |
| 176 | Belizean | $63,300 |
| 177 | Jordanian | $62,000 |
| 178 | Bhutanese | $61,572 |
| 179 | Puerto Rican | $60,890 |
| 180 | Marshall Islander | $60,040 |
| 181 | Iraqi | $60,000 |
| 182 | St. Lucia Islander | $60,000 |
| 183 | Dominican | $60,000 |
| 184 | American Indian (all tribes) | $59,900 |
| 185 | Sudanese | $59,676 |
| 186 | Afghan | $58,000 |
| 187 | Dutch West Indies | $57,228 |
| 188 | Arab | $57,089 |
| 189 | Nuevo Mexicano | $56,000 |
| 190 | Guatemalan | $55,867 |
| 191 | Anguilla Islander | $55,782 |
| 192 | African | $55,500 |
| 193 | Senegalese | $55,396 |
| 194 | Congolese | $55,000 |
| 195 | African-American | $54,600 |
| 196 | Honduran | $53,500 |
| 197 | Mongolian | $53,300 |
| 198 | Burmese | $52,900 |
| 199 | Afro-American | $52,000 |
| 200 | Yemeni | $51,636 |
| 201 | Algerian | $50,000 |
| 202 | Somalian | $45,100 |
| 203 | Guinean | $41,700 |
| 204 | Saudi Arabian | $33,390 |
| 205 | Libyan | $24,000 |
Endnotes
Photo: Vadym Plysiuk/iStock
Are you interested in supporting the Manhattan Institute’s public-interest research and journalism? As a 501(c)(3) nonprofit, donations in support of MI and its scholars’ work are fully tax-deductible as provided by law (EIN #13-2912529).