The Students for Fair Admissions Fallout: An Analysis of Freshman Enrollment by Race

Photo by: Spencer Grant/GHI/UCG/Universal Images Group via Getty Images
Introduction
The U.S. Supreme Court’s decision in Students for Fair Admissions v. Harvard—which effectively banned racial preferences in higher education—is nearly three years old, with effects that are still reverberating throughout selective colleges and universities. Many wondered whether the ruling would reshape the demographic landscape of elite colleges or encourage schools to shun standardized tests, as well as whether white or Asian enrollment would benefit more from declines in the share of underrepresented minorities.
Since the decision, data trickled in as individual schools divulged information about their new freshman classes—but these numbers were not standardized or even universally available.[1] Far more comprehensive numbers have now become available from the federal government’s Integrated Postsecondary Education Data System (IPEDS), in which schools are required to participate as a condition of receiving federal funds. These numbers allow a much more sweeping analysis of enrollment trends. Preliminary enrollment numbers for the fall of 2024,[2] the first class affected by the ruling, were recently released.
This brief examines more than 1,000 American four-year colleges and divides them into six categories of academic selectiveness, primarily by constructing an index of the test scores that they reported in the 2010s, before the pandemic and the SFFA ruling disrupted testing practices. The six categories are: the Ivies; non-Ivy schools that fall into the top 30 universities ranked by the test-score index; the rest of the top 100; the rest of the top half; the bottom half; and military schools (which were initially exempt from the ruling).
For each category, this brief describes freshman enrollment trends by race and ethnicity from 2010 to 2024. It also explores the numbers for some high-profile individual schools, as well as the evolution of test-score requirements after Covid and the ruling.
The upshot is that, at the nation’s most selective schools, black and, to a lesser extent, Hispanic enrollment tended to decline, though not as drastically as many feared, while both white and Asian enrollment often grew—a finding in keeping with some earlier research into this topic.[3] For instance, within the Ivy League, the black share fell from roughly 11% to 8% and the Hispanic share from 16% to 15%, while the white share rose from 35% to 37% and the Asian share from 30% to 32%. However, the changes varied immensely across individual schools, with some seeing little change or even shifts in the unexpected direction, which does not prove noncompliance but warrants further scrutiny.
As for test-score requirements, their well-publicized resurgence at top schools is not yet visible in the IPEDS data, but an analysis of 2010–24 trends suggests that these requirements may have effects on demographics similar to SFFA’s: shifting enrollment away from black and Hispanic applicants.
The IPEDS Data
In this section, I describe the nature and limitations of the data and how I processed the data to set up the following analyses.
IPEDS collects a variety of test-score statistics—such as the 25th percentile of enrollees’ verbal SAT scores.[4] I combined these numbers to rank colleges by their academic selectivity. Since the pandemic drastically altered the testing landscape, I opted to calculate my ranking based on the data reported from 2010 to 2019, accessed via the education data R package. I assigned each school a single ranking that does not change over time, in order to avoid having schools switch categories from year to year, which would muddy the interpretation of trend lines. Note that in starting with these data, I drop schools that did not provide any test scores during this period, including open-enrollment schools and others that did not use tests.[5]
The ranking is calculated using a technique called the NIPALS (Nonlinear Iterative Partial Least Squares) algorithm, which collapses the various pieces of test-score information that schools report into a single number, even though schools differ in exactly which test-score data points are available. Each test has numbers reported for several percentiles and subtests, and schools may have data for some tests or years but not others. All these variables—the 25th percentile of the SAT math for 2012, the 75th percentile ACT composite for 2017, etc.—are fed into the algorithm simultaneously. The resulting ranking makes a great deal of sense, with Caltech, MIT, and Harvey Mudd topping the list, Harvard and Yale coming next, and the remaining Ivies all falling into the top 30.
Since elite schools play a special role in the creation of the American governing elite and because most colleges are not selective enough to employ affirmative action to any great extent, my categorization scheme based on these rankings is designed to provide more detail at the top. Ivies get their own category; non-Ivy schools that nonetheless fall into the top 30 by test scores get another; and they are followed by the rest of the top 100, the rest of the top half, and then the bottom half (the least selective of my sample). Military schools get a separate category as well, partly because the academies were not initially affected by the SFFA ruling.[6]
With these rankings in hand, I turned to the files available from the IPEDS website,[7] which run through the most recent releases. For 2010–24, I combined the files containing data on fall enrollment and admissions considerations. To analyze racial shares, I calculated the share of known-race, full-time freshman enrollment for whites, blacks, Hispanics, and Asians (with international students and others with unknown races removed from the denominator) for each school and, within each of my six categories of schools, over time. To measure the evolution of test-score requirements, I opted for a simple dichotomous measure of whether scores are required, since the question wording regarding other types of systems (such as test-optional, test-blind, and test-“recommended”) has changed in recent years.
Following the SFFA ruling, the share of college students declining to state their race increased by about 2 percentage points.[8] It is not obvious what or who is driving the change; in theory, the ruling might have reduced the incentive for underrepresented minorities to state their race, or it might have discouraged whites and Asians from providing their race by bringing attention to discrimination in admissions. California experienced a similar phenomenon after banning affirmative action by referendum in the 1990s. One analysis found that, before and after the ban, missing-race students were almost entirely white and Asian, a conclusion that it reached by imputing students’ races from their names.[9] If this is true again, my analysis might understate increases in enrollment for whites and Asians; the Appendix shows an alternative version of this report’s first figure to illustrate this dynamic.
I look first at demographics and next at test-score requirements, restricting the dataset to schools with full data over 2010–24. Since some schools with complete demographic data have incomplete test-requirement information, the test-score analysis relies on a slightly smaller (by about 8%) sample; but in both cases, I am analyzing a set of more than 1,000 schools throughout the country. The data are also limited to schools that, as of 2024, primarily granted BAs and higher (and did not exclusively grant post-BA degrees).
Demographic Shifts of Incoming Freshmen After SFFA
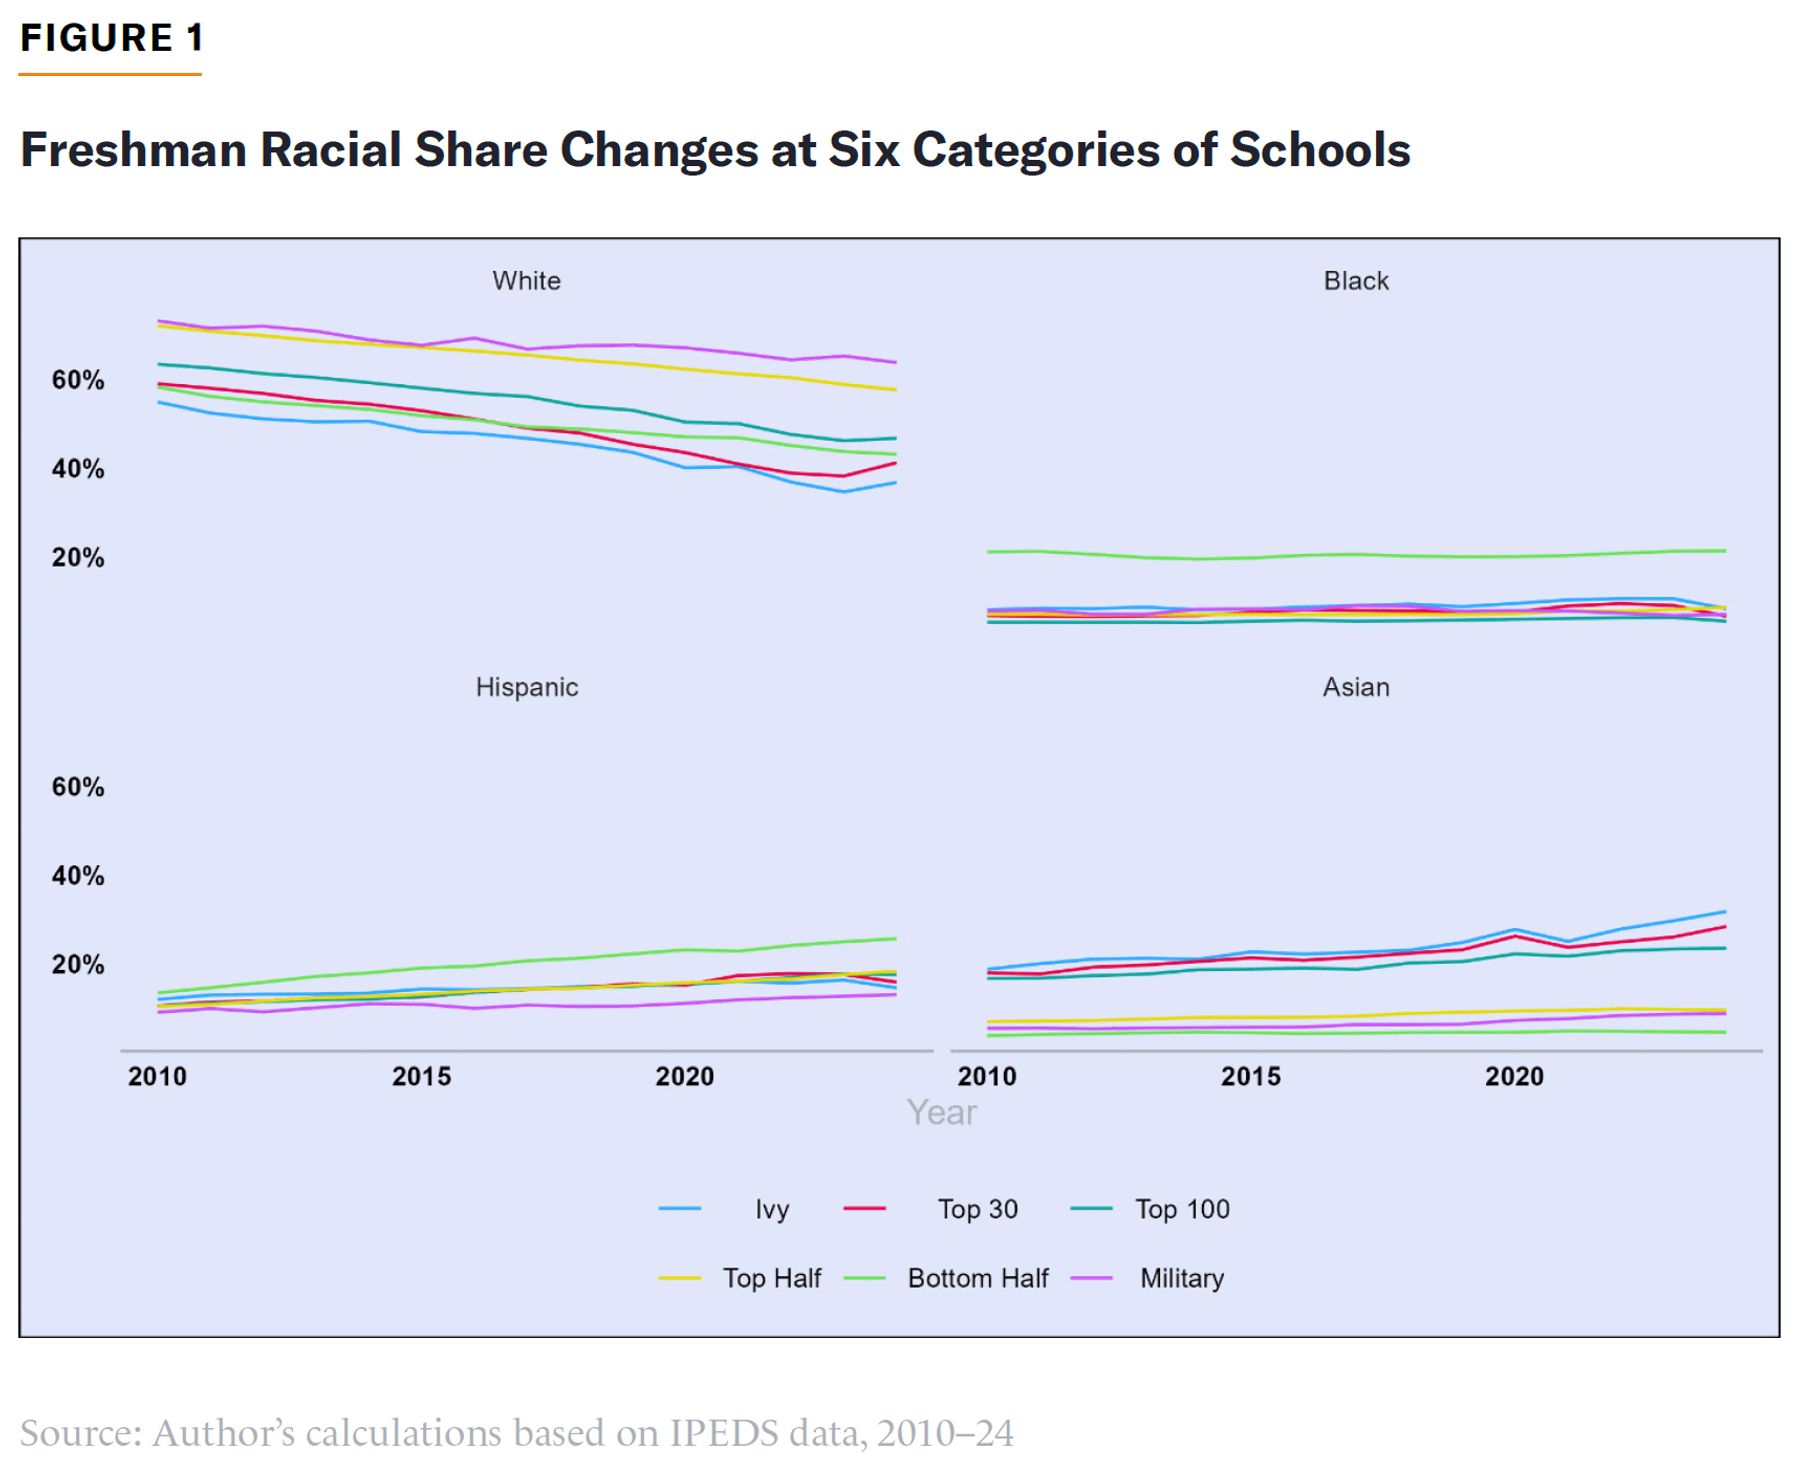
Figure 1 provides a straightforward timeline of demographic shares among freshmen within each category of school. Some fundamental patterns are evident. Like the nation as a whole, colleges have become less white and more Hispanic and Asian over time, and different racial groups have long tended to be concentrated in schools of different selectivity levels, reflecting gaps in academic preparation evident at the high school level.
Of special interest are the abrupt shifts seen at the final data point in each trend line. At the most selective schools, white and Asian shares increase—though it is difficult to distinguish the latter effect from the preexisting upward trend—while black and Hispanic shares notably decline. Looking at the Ivy League, the black share fell roughly three points and the Hispanic share two, while whites and Asians both saw two-point increases, patterns extremely similar to those seen in the non-Ivies of the elite top 30 category. At schools where selection is less intense, effects are, unsurprisingly, small to nonexistent; most U.S. colleges admit most students who apply, and schools that engage in less selection necessarily had less leeway to practice affirmative action even before the ruling.[10]
In interpreting this chart, one must think through what the SFFA ruling implies for racial demographics. Colleges are effectively barred from directly considering race as an admissions qualification but are not required to keep the rest of their admissions processes exactly the same as they were before; they are free to adopt new race-neutral policies, with future court cases likely to decide how much administrators can consider racial effects as they design such policies. Still, it is certainly worth noting that Harvard’s expert estimated during the SFFA trial that the share of black students in the school’s incoming freshman class would fall by more than half if it dropped racial preferences while changing nothing else.[11] And when the case went to the Supreme Court, Yale and other elite schools joined a brief arguing that race-neutral policy tweaks would not be sufficient to keep black student shares from falling substantially.[12]
It would be unfair to assume that elite schools are cheating unless their black student shares fall to almost nothing—but it is fair to be skeptical if they report little change at all. More detailed information about how different students fare during the admissions process is needed to truly prove whether any given school’s admissions policies pass legal muster, which is why the Trump administration has sued some individual schools[13] while seeking to compel greater disclosure of information that can flag potential discrimination, such as admissions data cross-tabbed by race, sex, and test scores.[14]
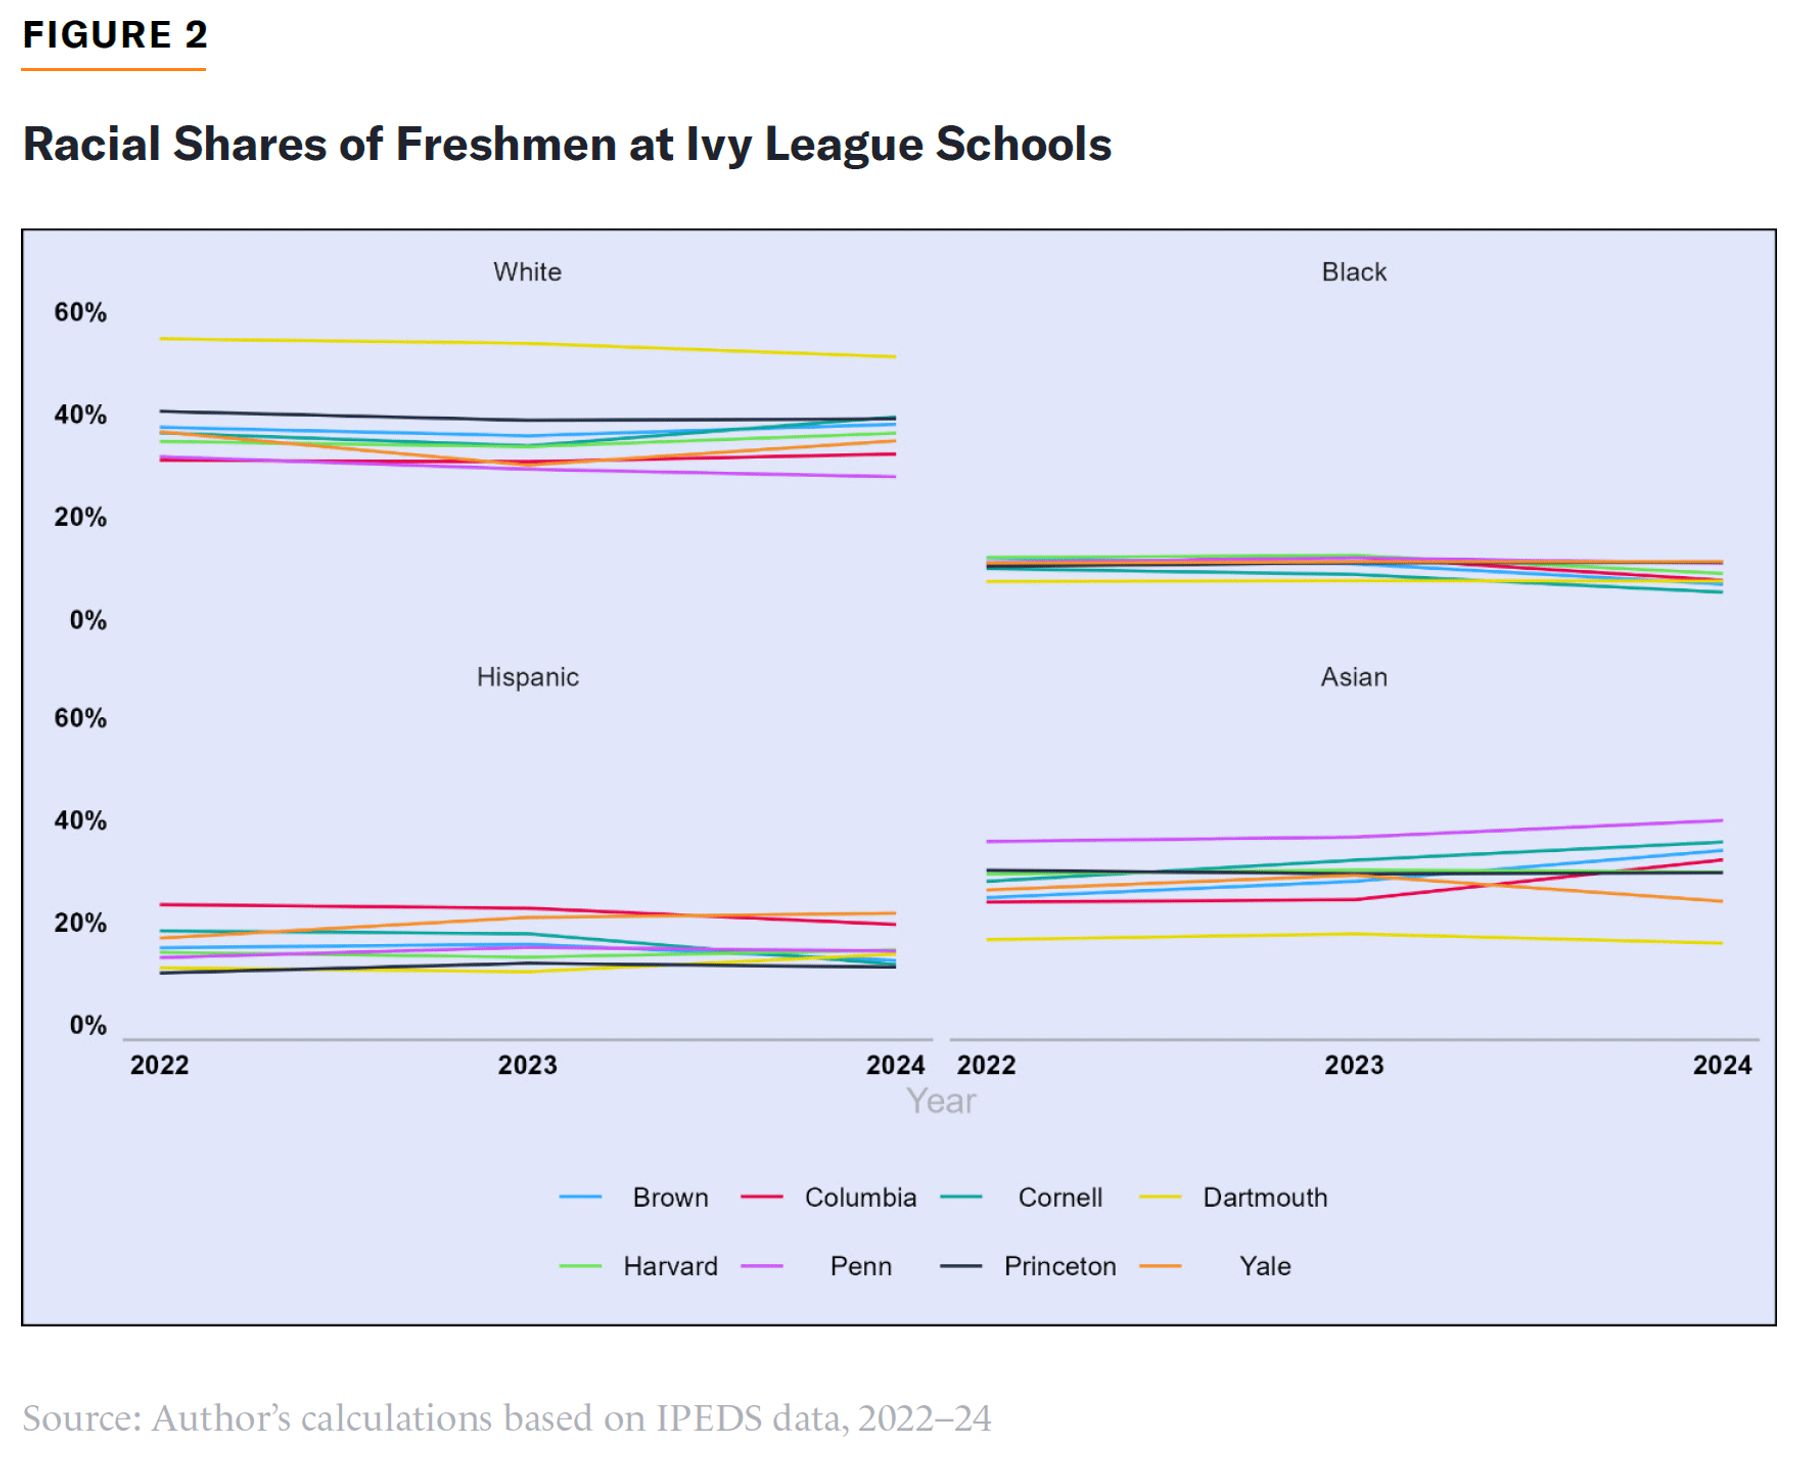
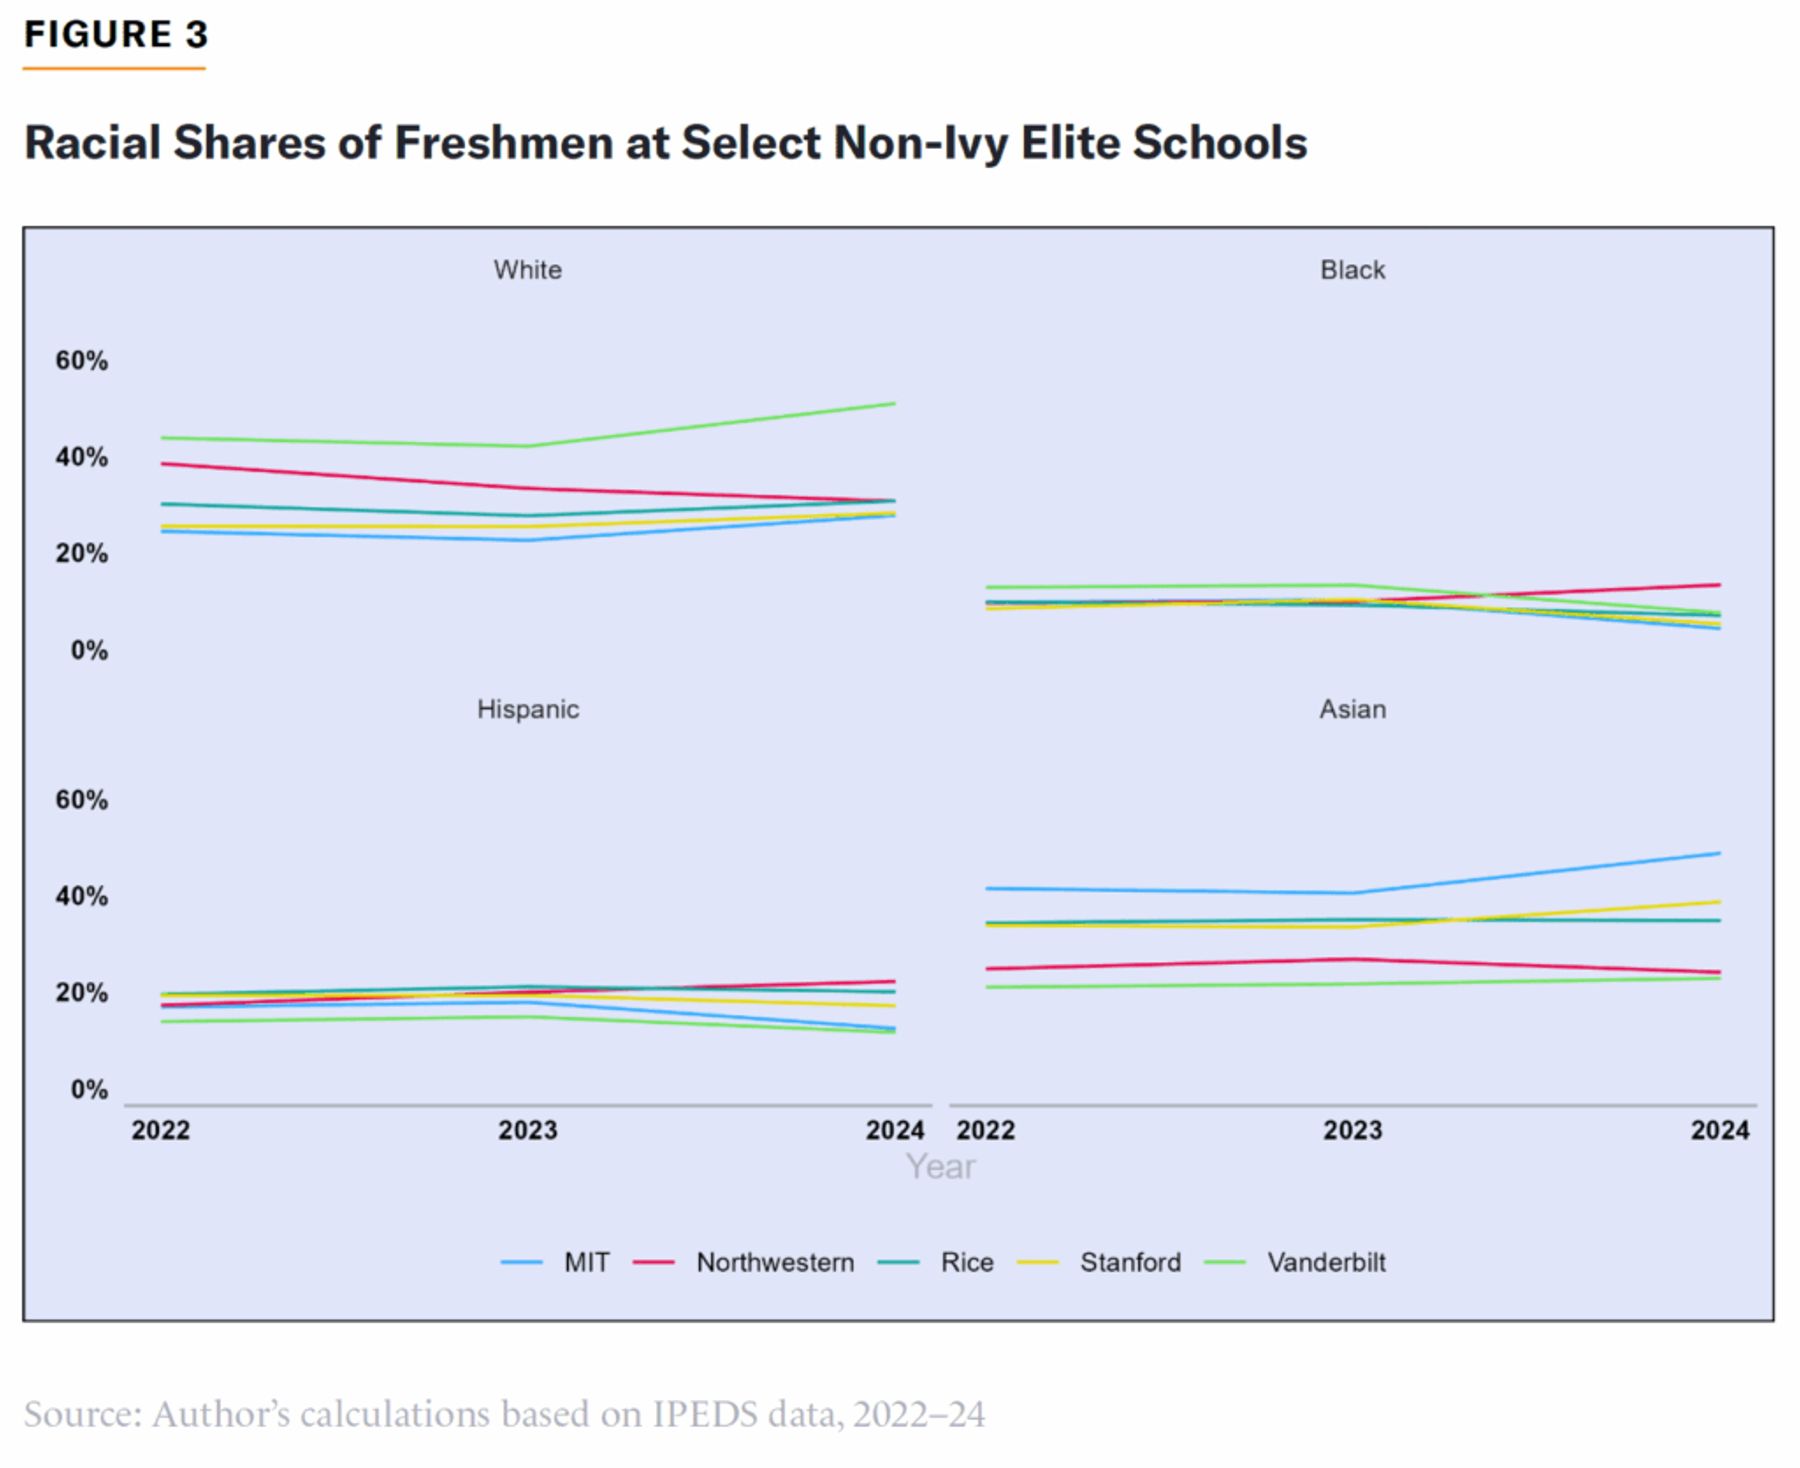
With all that in mind, Figures 2 and 3 show freshman racial shares at a variety of high-profile individual schools, zoomed in to trends since 2022 to make the recent changes more legible: the Ivies in Figure 2; and five elite non-Ivies, chosen to illustrate diversity in results without cluttering the chart, in Figure 3. These charts highlight that the effects seen in Figure 1 are not equal across schools; certain schools seem to have been unusually adept at maintaining their previous demographic mixes despite a new ban on considering race. Yale, Princeton, and Dartmouth saw little change in their share of incoming students who are black, for example; perhaps most notably, Northwestern increased its black share from about 10% to 13% in these data (though less dramatically, from 14% to 15%, in its own tally reported in autumn 2024).[15] Meanwhile, Asian student shares actually fell at some schools, including Yale (29% to 24%), while rising markedly at others, such as Columbia (from 24% to 32%).
As noted, California had already banned affirmative action at public schools before the ruling—as had eight other states, though there are debates over how well the schools in these states have complied.[16] One might expect public schools in these states to be less affected by the ruling.
To test this, I collapsed the Ivy, top 30, and top 100 categories down to a single “elite” category to boost statistical power, and ran separate Poisson[17] models to predict the count of black, white, Hispanic, and Asian freshman enrollment across the 2023 and 2024 years. The three categories of schools in this analysis are elite, top half, and bottom half. The models account for national changes in enrollment for members of a given race separately at three categories of school (in technical terms, this is a category-year fixed effect). The models also account for each school’s baseline demographics (through a college fixed effect), as well as the fact that when overall enrollment at a school goes up, the enrollment of each racial group will be expected to go up as well (via an “offset” for total known-race enrollment). I left out military schools because they were not banned from considering race even for the 2024 cycle. The independent variable of interest is whether the school was newly subject to an affirmative action ban.[18]
The models are designed to answer this question: What happened to the enrollment of the black, white, Asian, and Hispanic racial groups in 2024 at schools where affirmative action was newly banned, relative to what happened at schools in the same category of selectivity (elite, top half, or bottom half) with a ban already in place?
A key limitation is that only four schools with preexisting affirmative-action bans fell into the elite category: the University of Michigan–Ann Arbor, plus University of California’s Berkeley, Los Angeles, and San Diego. In the raw data, these schools’ overall black share remained nearly steady between 2023 and 2024 (declining from 3.8% to 3.7% of incoming freshmen), versus a decline from 7.6% to 6.3%, or nearly a fifth, at other elite schools.
The regression results, presented in Table 1, reaffirm the picture painted in the overall trend lines above that the SFFA ruling had some effects in the expected direction—such as a roughly 5% increase in the white enrollment count, as well as a likely decline in black enrollment, at elite schools—while confirming that things did play out a little differently at schools that had been already subject to a similar policy. These effects in Table 1[19] can roughly be interpreted in percentage terms; e.g., 0.05 would mean that the group’s enrollment count increased by about 5% relative to what happened in schools that had already been subject to an affirmative-action ban. Another study from earlier this year, using somewhat different data sources and methods but similarly leveraging preexisting bans, reached similar conclusions.[20]
TABLE 1
Regression Analysis Results: Banning Affirmative Action and Enrollment of Four Racial Groups
| Black | Asian | Hispanic | White | |
| New Ban in Effect x Elite | –0.168• | 0.019 | –0.008 | 0.048* |
| New Ban in Effect x Top Half | 0.026 | 0.032* | 0.002 | 0.003 |
| New Ban in Effect x Bottom Half | –0.009 | 0.049 | 0.01 | –0.006 |
| Observations | 2,632 | 2,546 | 2,632 | 2,656 |
Note: These Poisson models include university and category-year fixed effects (the categories being elite, top half, and bottom half), as well as an offset for total known-race enrollment. Standard errors are clustered by university.
•p < 0.1; *p < 0.05.
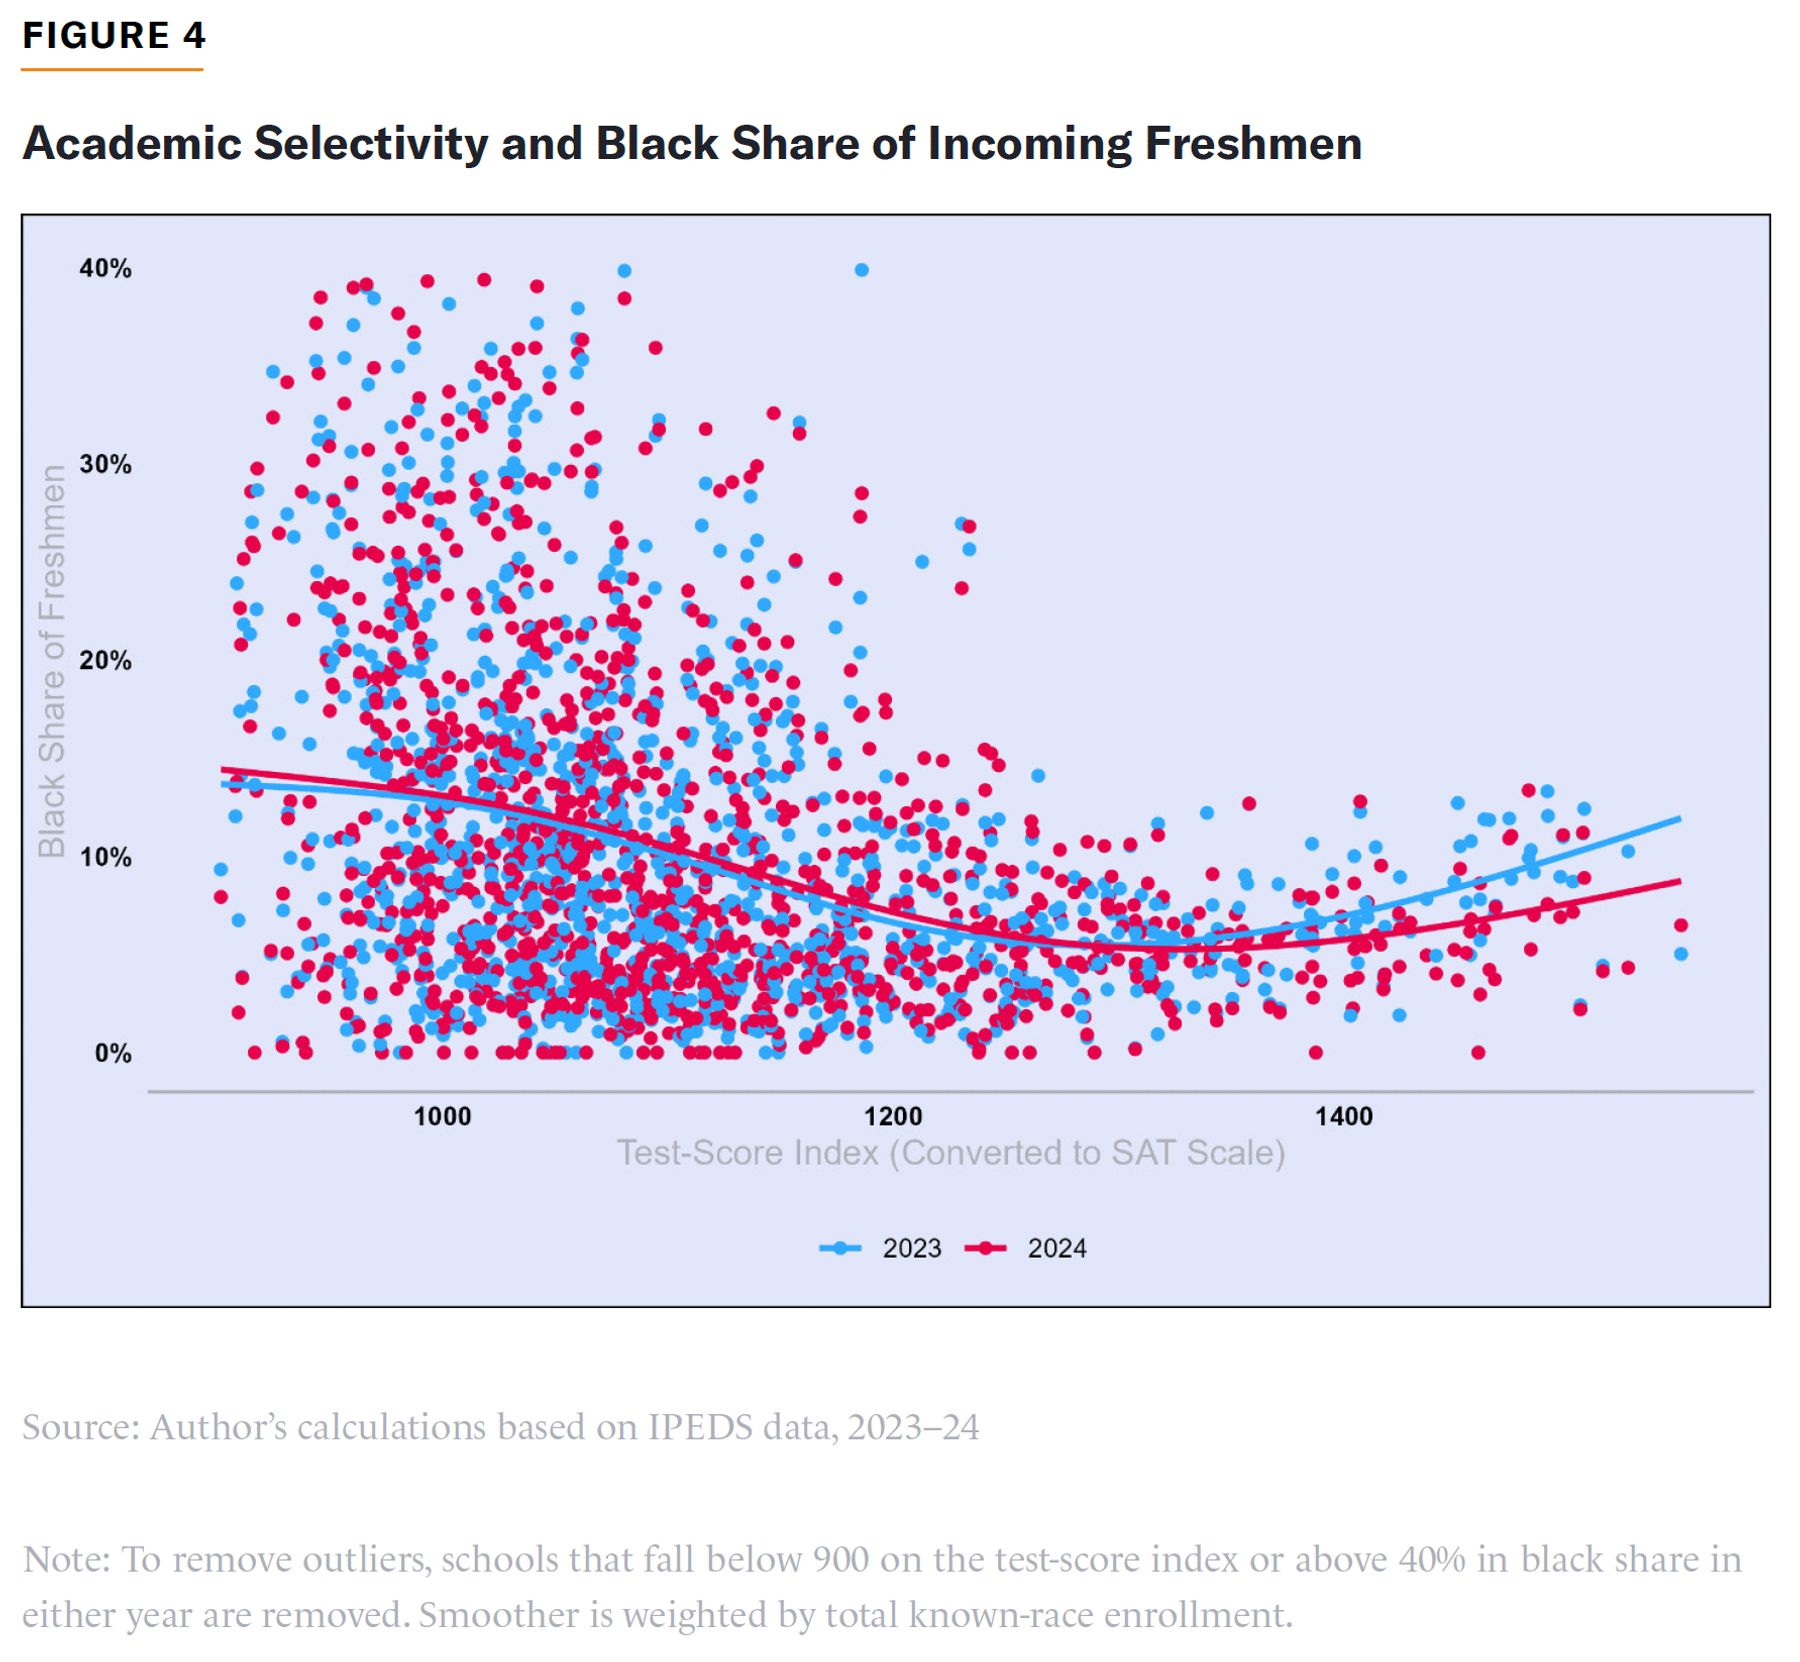
An additional way of analyzing these data is worth exploring, though it requires some backstory. In a 2011 study, Peter Arcidiacono et al. pointed out an irregularity in the link between schools’ average test scores and their black enrollment shares. Because of the racial gap in test scores, one would statistically expect black representation to decline as schools became more academically demanding. This was true in the data—except at the very most demanding and elite schools, which appeared, presumably through racial preferences, to be enrolling more black students than slightly less prestigious schools. The resulting chart formed a sort of backward checkmark or U shape, and it illustrated affirmative action’s “cascade” phenomenon, in which elite schools poach minority talent from schools a rung down the selectivity ladder via preferences, which now face another obstacle to achieving the demographic balance that their own administrators may want.[21]
Using the test-score index that I used to create the rankings discussed above (again, a single number assigned to each school that does not change over time) and roughly converting it to the SAT scale for readability,[22] I conducted a new version of this analysis, comparing demographic shares in 2023 with those in 2024, shown in Figure 4. Consistent with Figure 1’s results at elite schools, the results suggest a shift in the curve’s shape at the right side, though it does not totally flatten and the difference in slopes is borderline in terms of statistical significance.[23] The demographic changes at the nation’s most elite schools appear to have been large enough to shift the relationship here, though future data releases will again be illuminating.
What Role for Test-Score Requirements?
Before the SFFA ruling, many commentators, including the present author,[24] expressed fear that the end of affirmative action could cause schools to reduce or eliminate the use of test scores, in favor of noisier (and perhaps more manipulable) measures of college readiness—measures that would produce smaller racial gaps but predict college performance far less accurately. Most schools had already paused their use of tests—thanks to the 2020 pandemic—making this shift even easier to implement if schools wanted to do so.
A spate of news stories in mid-2024 suggested that this fear might have been overblown. Numerous elite schools announced that test-optional policies had not worked—for example, lower-income students sometimes failed to submit scores that would help them, and admissions officers had trouble assessing transcripts earned at subpar public schools—and that they would be bringing test requirements back, often starting with the fall 2025 freshman class.[25]
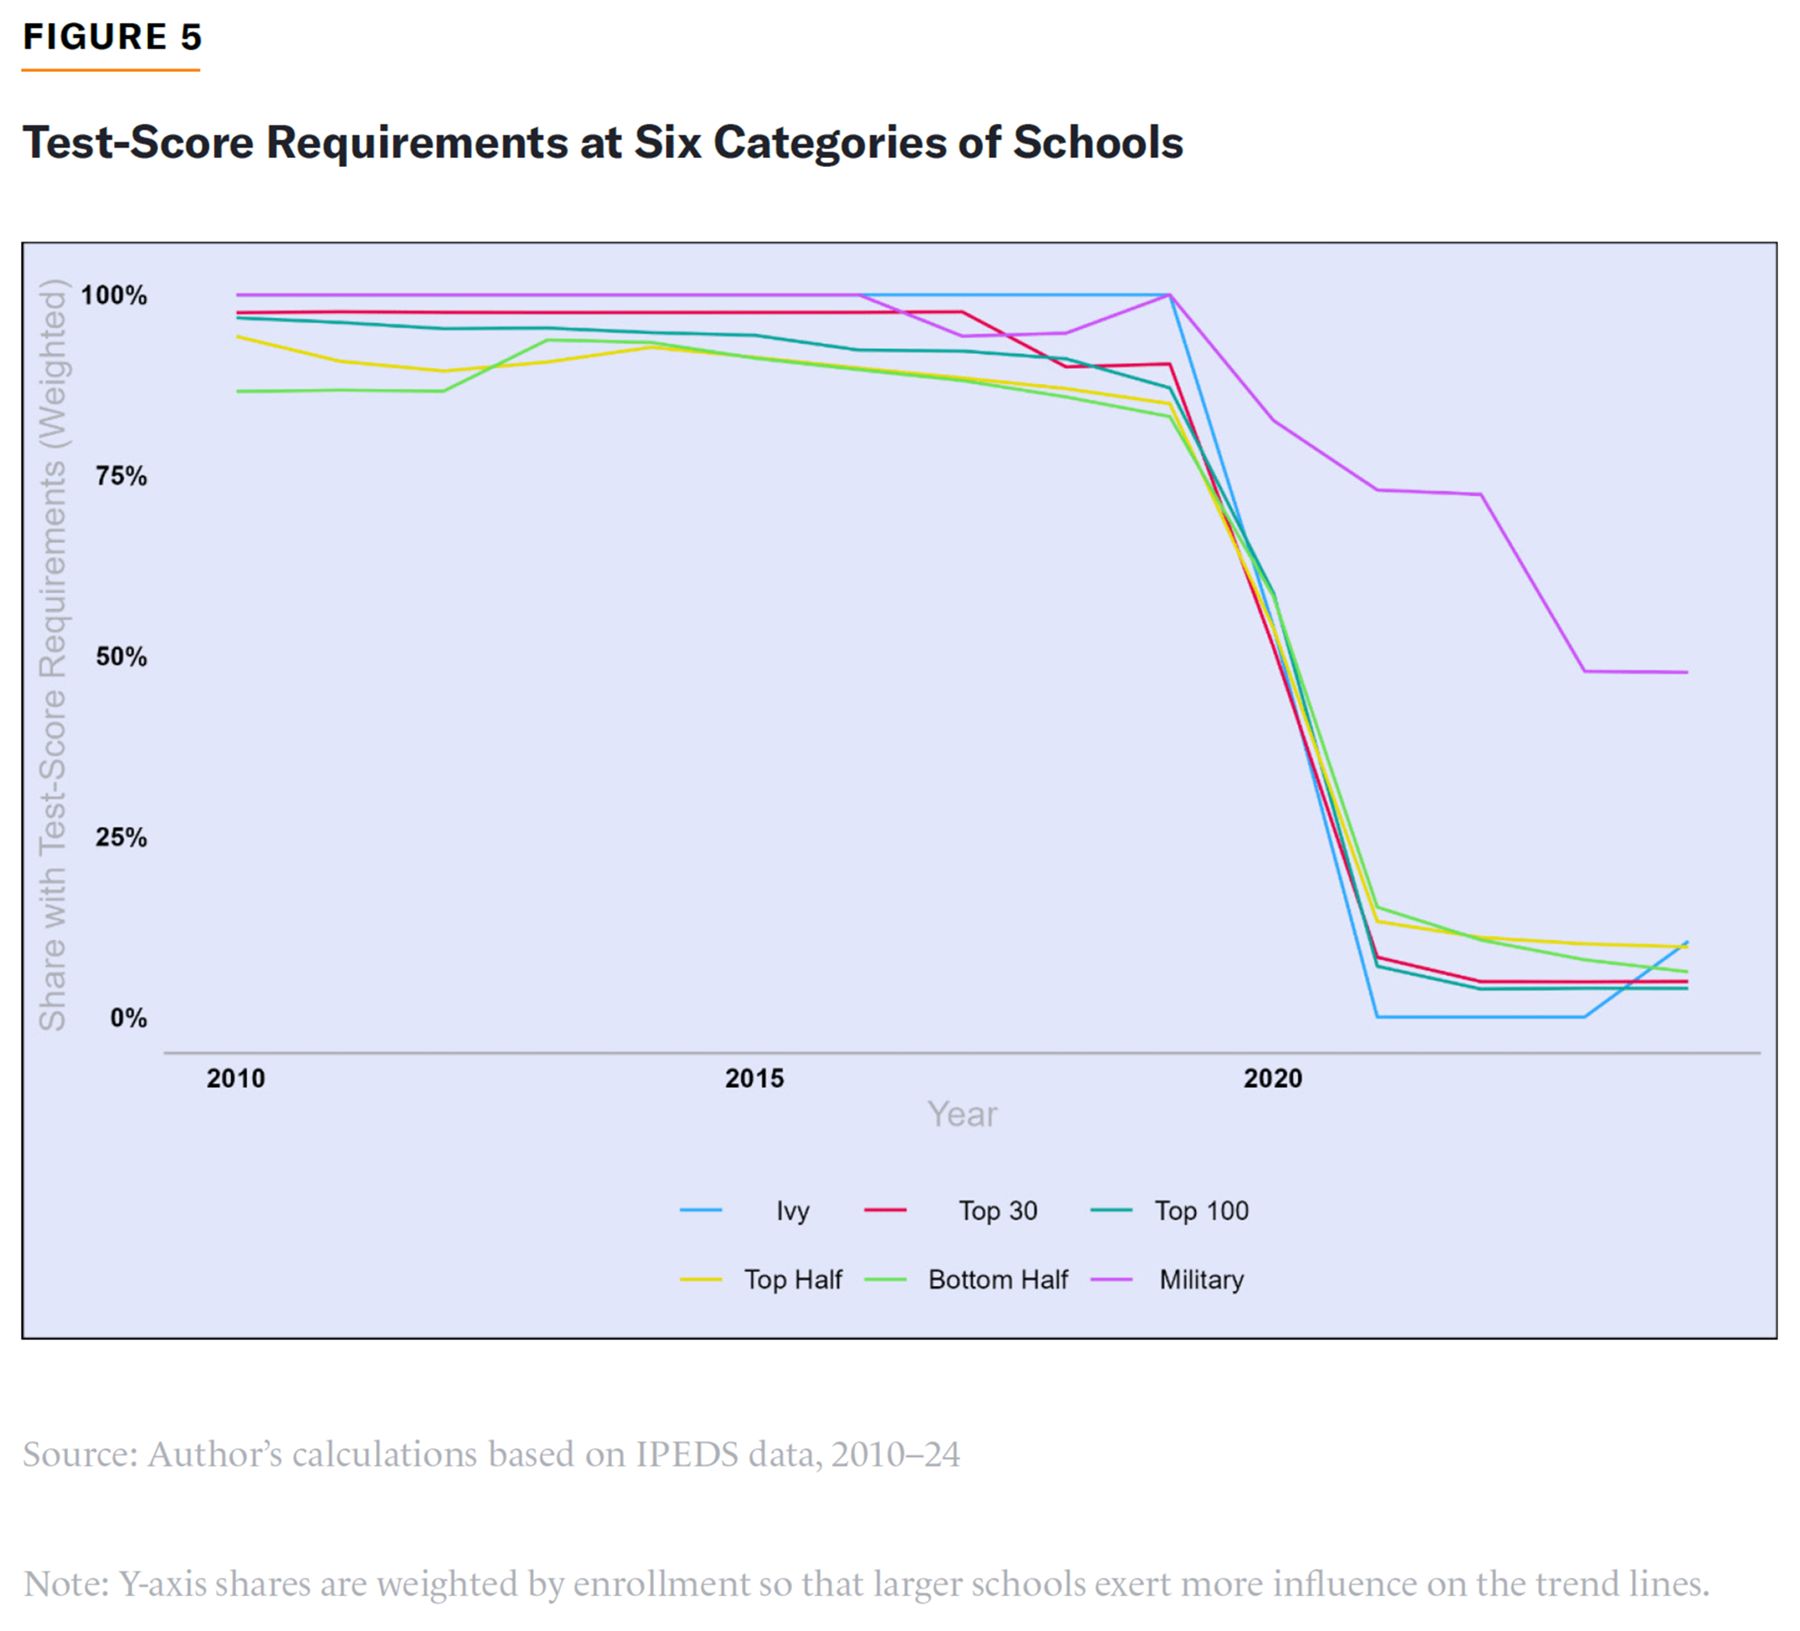
Unfortunately, given the delay in IPEDS reporting, these restored requirements do not yet appear in the data, shown in Figure 5. The next two years’ releases should show us how deeply this countertrend penetrated into the nonelite segment of the higher-ed sector.
In addition, the new data allow for a new, extended version of the analysis that I presented in a previous issue brief,[26] modeling how test-score requirements affect the ultimate enrollment of members of each racial group at about 1,200 colleges during this period.
The models in Table 2 are quite similar to those in Table 1, except that they cover a longer time frame, and each model tests whether enrollment of members of a given racial group tends to be particularly high or low in years when a school requires tests[27] (in contrast to the regression analysis in Table 1, which analyzed the effect of SFFA turning on at schools with no preexisting affirmative-action ban).
Another change from the previous analysis is that we now have four categories: elite, top half, bottom half, and military.
TABLE 2
Regression Analysis Results: Standardized Test Requirements and Enrollment
| Black | Asian | Hispanic | White | |
| Required x Elite | –0.038 | 0.063• | –0.034 | 0.006 |
| Required x Top Half | –0.133*** | 0.070• | –0.065*** | 0.000 |
| Required x Bottom Half | –0.068*** | –0.067** | –0.033• | –0.001 |
| Required x Military | –0.195• | 0.219• | –0.125* | 0.021 |
| Observations | 18,567 | 18,492 | 18,638 | 18,578 |
Source: Author’s calculations based on IPEDS data, 2010–24
Note: Poisson models include university and category-year fixed effects (the categories being elite, top half, bottom half, and military), as well as an offset for total known-race enrollment. Standard errors are clustered by university.
•p < .1; *p < 0.05; **p < 0.01; ***p < 0.001.
The results are, again, generally consistent with what one might expect (and fit into a small and mixed body of research on the topic):[28] test-score requirements do correlate with reduced black and Hispanic enrollment, with the most dramatic effects seen in top-half schools and very little apparent effect on white students at any type of school. Asian enrollment at more selective schools may increase as well, alongside a more surprising decline at less selective schools that impose testing requirements. I.e., colleges that prize their academic selectivity, on the one hand, and the demographic mix that they were able to achieve under affirmative action, on the other hand, likely face a trade-off between the two.
Yet another similar model (without the offset for total enrollment) can be used to gauge the impact of test-score requirements on total applications, though IPEDS does not disaggregate this number by race. There is little need to elaborate on this model except to say that my results are all statistically insignificant—although, consistent with expectations, the elite category has the largest point estimate, resulting in a decline in the number of applications submitted by students by about 4% when a testing requirement is in place (p=0.19).
Conclusion
It is still early days since the SFFA ruling; in the years ahead, universities will refine their reactions to the end of affirmative action, and the executive and judicial branches of the federal government will develop new enforcement approaches. Thus far, the fallout appears to have been mixed—with selective schools seeing modest changes, on average, but significant school-to-school variation. Over the next several years, researchers and enforcement agencies should continue to monitor these trends, observe how broadly standardized-test requirements are reinstated, implement new expansions of the IPEDS data collection, and investigate any signs of wrongdoing.
Appendix: Unknown Races
As noted above, the share of students declining to state their race in the IPEDS data rose between the 2023 and 2024 collections. A previous study of a similar phenomenon in California suggests that these students are mostly white or Asian, but it is impossible to say for certain. This brief removes students with unknown races when calculating racial shares.
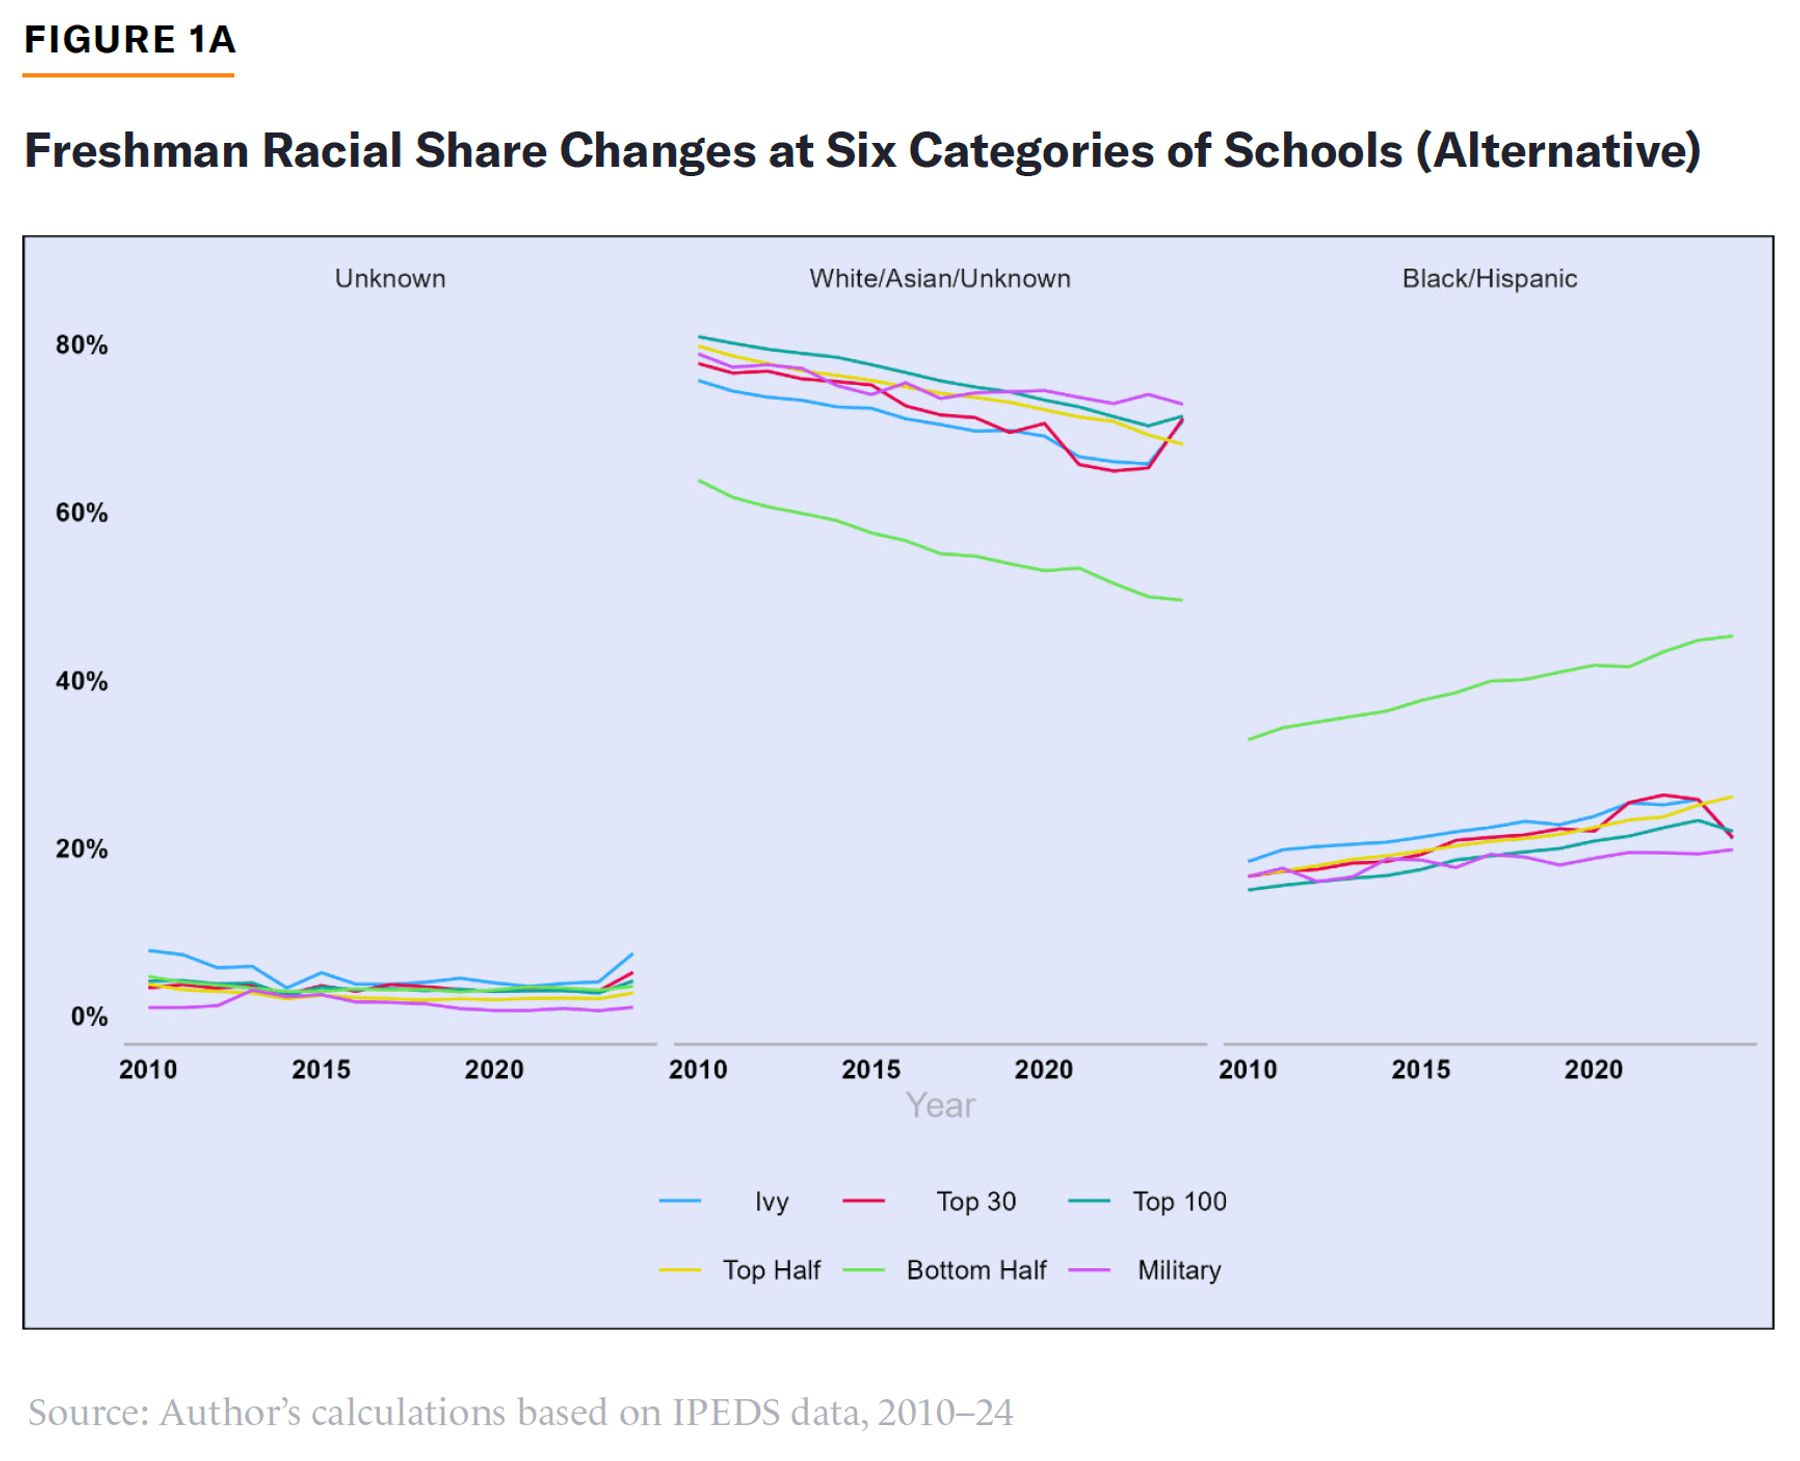
Figure 1A is an alternative version of Figure 1. This figure is derived from the total non-international enrollment (including domestic students with unknown races) as the denominator and assumes that unknown-race students are either white or Asian. It shows the percentage of students with unknown races in the left panel; the shares of students who are white, Asian, or unknown in the middle panel; and the combined black and Hispanic share in the right panel.
As expected, the increase in white/Asian enrollment at more selective schools is more dramatic when placing the unknown-race students in that group.
Endnotes
Are you interested in supporting the Manhattan Institute’s public-interest research and journalism? As a 501(c)(3) nonprofit, donations in support of MI and its scholars’ work are fully tax-deductible as provided by law (EIN #13-2912529).