The Earning Curve: Variability and Overlap in Labor-Market Outcomes by Education Level

Foreword
by Oren Cass, American Compass
In November 2019, the Associated Press published “Poll: Many Youths Say High School Diploma Is Enough,”[1] an article accompanied by a Tweet warning that “researchers say that hasn’t been true for decades.”[2] “Experts,” reported AP, are concerned that “young Americans don’t seem to be getting the message that college pays off.” The youth are correct, and the experts are wrong. More precisely, most young people exhibit a nuanced grasp of the pros and cons of various educational pathways, unlike the experts demanding college attendance.
AP found that young Americans recognize the wide variety of routes to career success and that the right answer is usually: it depends. Nearly all respondents (93%) said that on-the-job experience prepares workers for success “extremely/very well” (73%) or “somewhat well” (20%). This was followed by postgraduate degrees (66% “extremely/very well,” 22% “somewhat well”), vocational or trade programs (60%/29%), bachelor’s degrees (60%/27%), associate’s degrees (47%/36%), high school diplomas (45%/31%), and military service (39%/38%).
These responses are entirely reasonable (though military service should probably score much higher). Indeed, nothing substitutes for on-the-job experience, and a graduate degree often leads to high earnings—provided the degree is in the right field. Vocational programs, bachelor’s degrees, and associate’s degrees are rightly clustered together. All can be good preparation, if the program is of high quality and the student completes it. A high school diploma scored lower than all these other options, but a plurality still believed that it prepares a person very well for success.
The experts, however, focused on the difference in average earnings for high school and college graduates: “Federal labor data shows a wide earnings gap between Americans who do and do not have a college degree, and unemployment rates are far lower for those with a bachelor’s or master’s degree.” Thomas Brock, director of the Community College Research Center at Columbia University, explained that “there’s just such a strong association between employment rates, as well as earnings, and education.”[3]
These experts portray a labor market with high-earning and low-earning pools, the former of which can be entered only by completing a college degree. This is doubly wrong. First, although the average college graduate has higher earnings, these averages mask enormous variation within each group that leaves the distributions overlapping substantially. Roughly speaking, the top half of the high school pool overlaps the bottom half of the college pool, with everyone in the top quarter of high school graduates outearning everyone in the bottom quarter of college graduates.
Second, the earner at the average in each pool is not the same person, and obtaining a degree does not transform one into the other. To the contrary: the personal characteristics that make them so different mostly explain why, in the first place, one went to college and the other did not.
Key Findings
- The earnings of the top half of high school–only workers overlap those of the bottom half of college graduates.
- The 75th-percentile earner among high school–only workers outperforms the 25th-percentile college graduate earner—that is, every individual among the top 25% of high school graduates outperforms every individual in the bottom 25% of college graduates.
- High school–only workers who reach the top of their earnings distribution often do so in occupations where entry-level positions offer a pathway to advancement. Many college graduates, by contrast, are employed in positions that do not require a degree.
At the margin, moving from the top of the high school pool into the bottom of the college pool provides little, if any, earnings boost. While the college degree remains the gold standard in the public consciousness, more than 40% of recent college graduates wind up in jobs that do not require a degree.[4] That’s on top of the roughly half of college attendees who fail to earn a degree at all.[5] This makes other, cheaper routes a much better proposition for many students, especially when considering the cost of college—not only tuition, but also forgone earnings and experience.
The first step in combating the notion that everyone should go to college is to look at the data. Using original analysis of U.S. census data, this report examines one of the facts about the labor market that surprises policy experts the most: millions of high school graduates are doing better than millions of college graduates. This is not because older workers earn more than younger ones, or because workers in prosperous cities earn more than those in struggling towns. No matter how the data are cut, the reality remains that the labor market is complex: for many people, a high school diploma can be adequate preparation; for many people, a college degree accomplishes little.
Most important, for policymakers, this is how the picture looks before any substantial effort to construct noncollege pathways for the workforce. Today, regardless of aptitude or preparedness, a high school graduate enrolling in college can receive enormous subsidies to help fund a campus experience that can appear more amusement park than education. That same high school graduate, making the often wise choice to move instead toward a job, gets nothing. The asymmetry in investment is even more shocking, given that most young Americans still do not earn even a community-college degree. How much better would be the lives of these students—the majority of American youth—if we invested in them, too? Unfortunately, all they receive now are incessant pleas, along with financial incentives, to go to college. But as this paper underscores, “opportunity” and “college” are far from synonymous.
Introduction
Conventional wisdom regards a college degree as necessary for a well-paying job and a good life—“the key to getting a good job that pays a good income,” in the words of President Barack Obama.[6] In testimony before Congress, Obama’s chief labor economist, Betsey Stevenson, reported that “college graduates earn 65% more than high school graduates” as support for the claim that “the rate of return for investing in a college education is at an historically high level.”[7] According to PolitiFact, “higher educational attainment equals higher wages . . . no matter which data set is considered.”[8]
By focusing on average earnings, this conventional wisdom obscures the enormous variability in outcomes at each education level; in fact, the top half of high school graduates earn in the same range as the bottom half of college graduates. Those who invoke these figures on higher earnings for college graduates implicitly treat them as supporting a causal claim: if you get more education, you will earn more as a consequence. But the median earner among high school graduates has very different abilities from the median earner among college graduates: in fact, the former would likely struggle to complete college. Someone with only a high school diploma, who might find a job paying at the 75th percentile among that cohort, would not raise his income by earning a bachelor’s degree and finding a job paying at the 25th percentile for college graduates.
The U.S. Bureau of Labor Statistics presents summary data for earnings by education level at the 10th, 50th, and 90th percentiles. These data show that the upper portion of the high school range ($726 at the 50th percentile to $1,491 at the 90th percentile) sits substantially above the lower portion of the college range ($593 to $1,187).[9] A worker is not better off in the pool of below-average college graduates than in the pool of above-average high school graduates.
This report uses original analysis of U.S. census data to give a detailed picture of the range of outcomes in earnings for those with different levels of education. We show that the substantial overlap in income between college graduates and noncollege graduates holds even after controlling for age; that is, it is not an artifact produced by late-career high school graduates outearning early-career college graduates. We then show that geographic differences in overlap are generally small. Areas with the highest levels of overlap are typically smaller regions dominated by industries that pay high wages to high school workers, while areas with the lowest overlap are large cities with high wages for skilled workers.
Finally, we examine the typical occupations of workers in different segments of the distribution. We show that high-earning high school graduates are typically employed in predominantly noncollege occupations, rather than in occupations that also employ large numbers of college graduates. The bottom earners among college graduates tend to work in fields that do require a degree but do not pay high wages, or in fields that do not require a degree.
These data provide a textured picture of the diverse pathways within the American labor market. College graduates, on the whole, unquestionably remain the economy’s winners. But the question of whether any given individual should go to college—especially given the expense of tuition and the years of forgone salary—depends on individuals’ own aptitudes and interests; college is far from a surefire moneymaker.
Earnings Distributions
We study earnings data from the 2017 five-year American Community Survey, which provides a nationwide sample of 15.8 million records for individuals surveyed between 2013 and 2017, including their wage income in the year before they were surveyed. We focus specifically on those between the ages of 25 and 64 who reported working full-time during the prior year and whose highest level of completed education is a high school diploma (hereafter, HS), some college but less than a bachelor’s degree (hereafter, SC), or a bachelor’s degree but no advanced degree (hereafter, BA). Those populations include a total of 1.35, 1.16, and 1.07 million records, respectively, with median wage earnings of $37,231, $43,487, and $62,051.
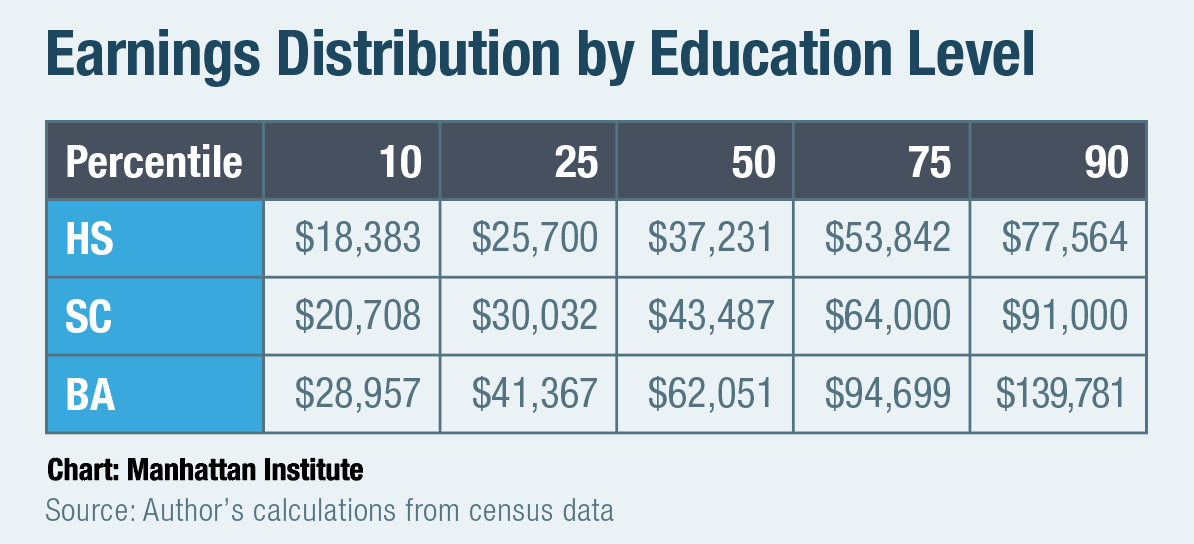 Figures 1 and 2 present the distribution of earnings within these populations. Consistent with the aggregate BLS data, the 50th–90th-percentile range for HS is higher than the 10th–50th distribution for BA. Roughly speaking, the top half of HS outperforms the bottom half of BA. Table 1 shows also that the 75th-percentile earner for HS outperforms the 25th-percentile earner for BA and the 50th-percentile earner for SC. That is, every individual among the top 25% of HS outperforms every individual in the bottom 25% of BA and outperforms most of SC.
 We quantify these relationships with a metric that we call the crossover point: the largest percentage of a lower-education group that earns more than the same percentage of the higher-education group. If, for instance, the highest-income 25% of workers with only a high school education earned more than $50,000 per year, while the lowest-income 25% of workers with a BA earned less than $50,000, the crossover point would be 25. Higher crossovers mean more overlap; a crossover point of 50 means that both groups have the same median.
Nationally, the crossover point between HS and BA is 33.2. The crossover point between HS and SC is 44.3.
Age
Overlaps in the earnings distributions could plausibly be an artifact of comparing people at different life stages or in different locations. However, neither age nor geographic diversity makes much of a difference. To control for age, we consider the earnings distributions of age-specific subpopulations within HS, SC, and BA, looking specifically at full-time workers toward the beginning (aged 25–34) and end (aged 55–64) of their careers.
Controlling for age leaves the crossover points virtually unchanged. Within the early-career groups, the crossover point between HS and BA is 31.7; between HS and SC, it is 44.5. Within the late-career groups, these crossover points are, respectively, 32.4 and 42.8. For both ranges, it remains true that the upper half (50th–90th percentile) of the HS distribution is higher than the lower half (10th–50th percentile) of the SC and BA distributions.
Geography
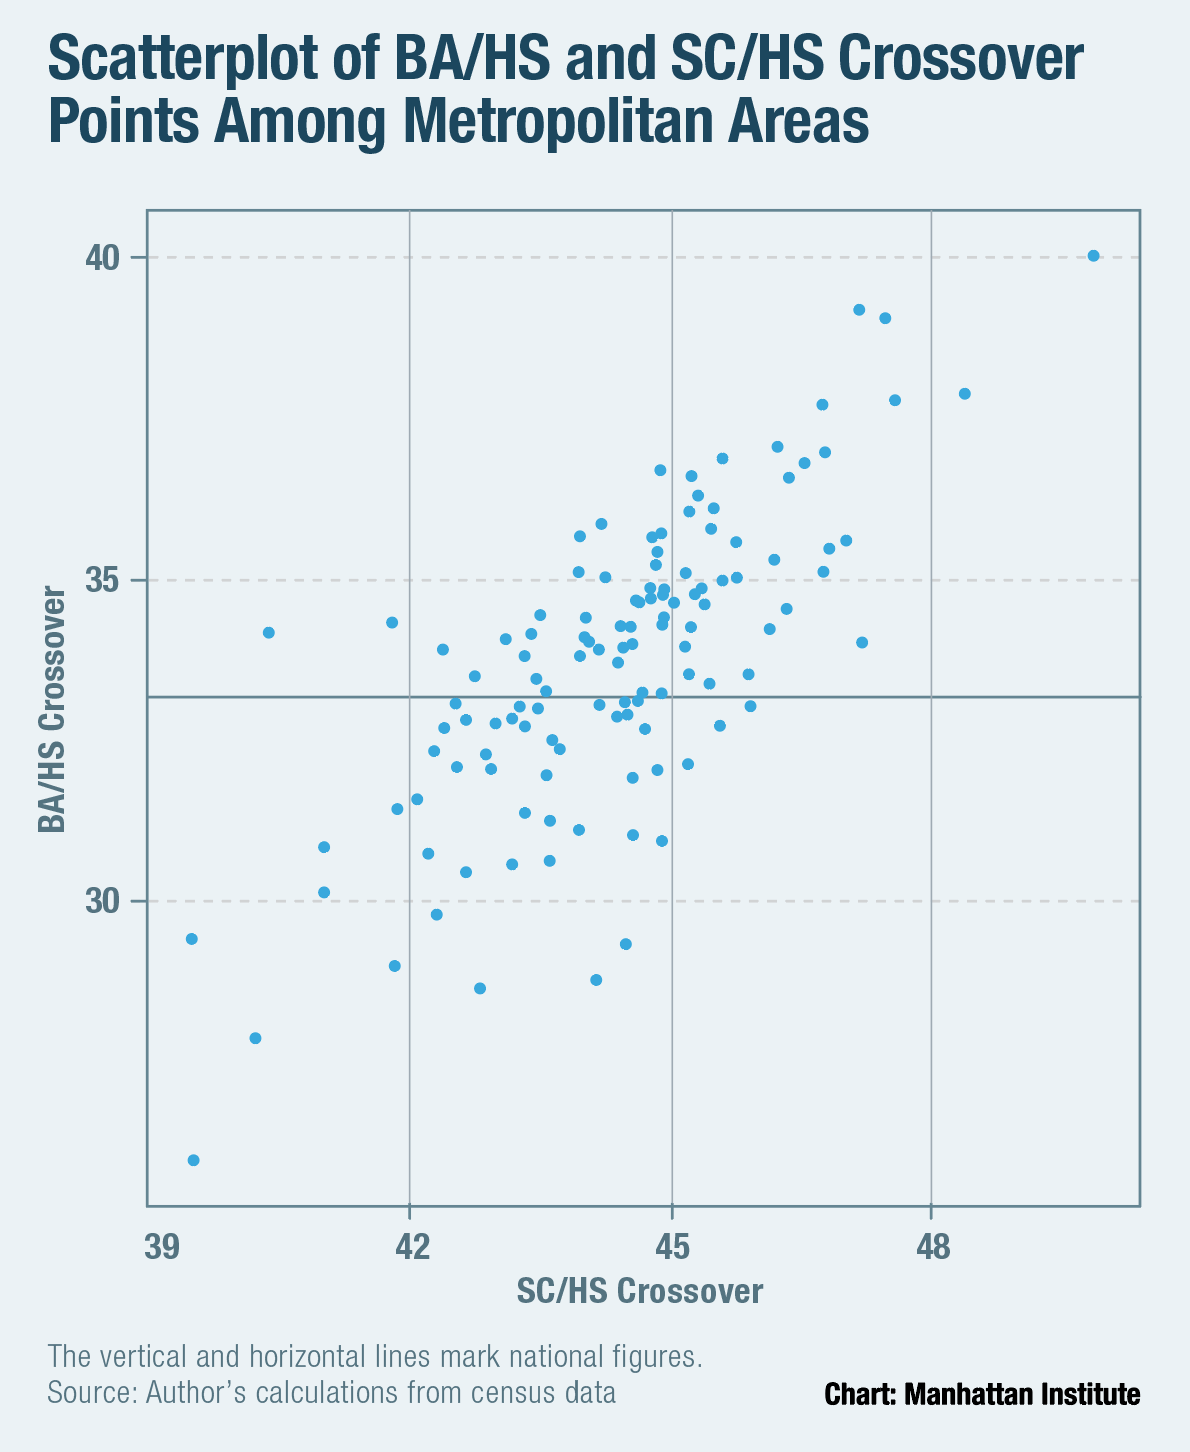 To control for geography, we consider the earnings distributions in the 122 census-defined Metropolitan Statistical Areas (MSAs) with at least 1,000 survey records for each of HS, SC, and BA. As shown in Figure 3, BA/HS crossover points for MSAs vary from 26.0 to 40.0, with half clustering in the interquartile range between 32.6 and 35.0; the SC/HS crossovers range from 39.5 to 49.8, with half between 43.3 and 45.2. BA/HS and SC/HS crossover points are highly correlated among metropolitan areas.
Likewise, crossover points within the early-career age range cluster between 30.4 and 34.9 for BA and between 43.1 and 46.2 for SC. Within the late-career range, they cluster between 31.1 and 33.3 for BA and between 41.9 and 43.9 for SC, close to the nationwide results.
Variation in overlap within individual MSAs, though generally slight, offers an added dimension to the labor-market picture. Regions with especially high overlap are typically smaller regions dominated by industries that pay high wages to high school workers. For example, Lafayette, Louisiana, which has the highest overlap for both SC and BA, is a major producer of oil and natural gas. Springfield, Missouri, which has the second-highest BA crossover and sixth-highest SC crossover, is a nationwide center for freight logistics. Though excluded from our analysis because of low sample sizes, the Odessa and Midland, Texas, metropolitan areas, located in the Permian Basin oil field, also have very high levels of overlap.
At the spectrum’s other end, the two metropolitan areas with the lowest BA/HS overlap are San Francisco and San Jose (26.0 and 27.9, respectively), which together constitute the San Francisco Bay Area. The low overlap here is driven by the technology industry, which pays high salaries to workers holding BAs. Other metro areas with low overlap include Huntsville, Alabama (28.7), as well as other large metropolitan regions such as Los Angeles (30.2) and Dallas–Fort Worth (30.5).
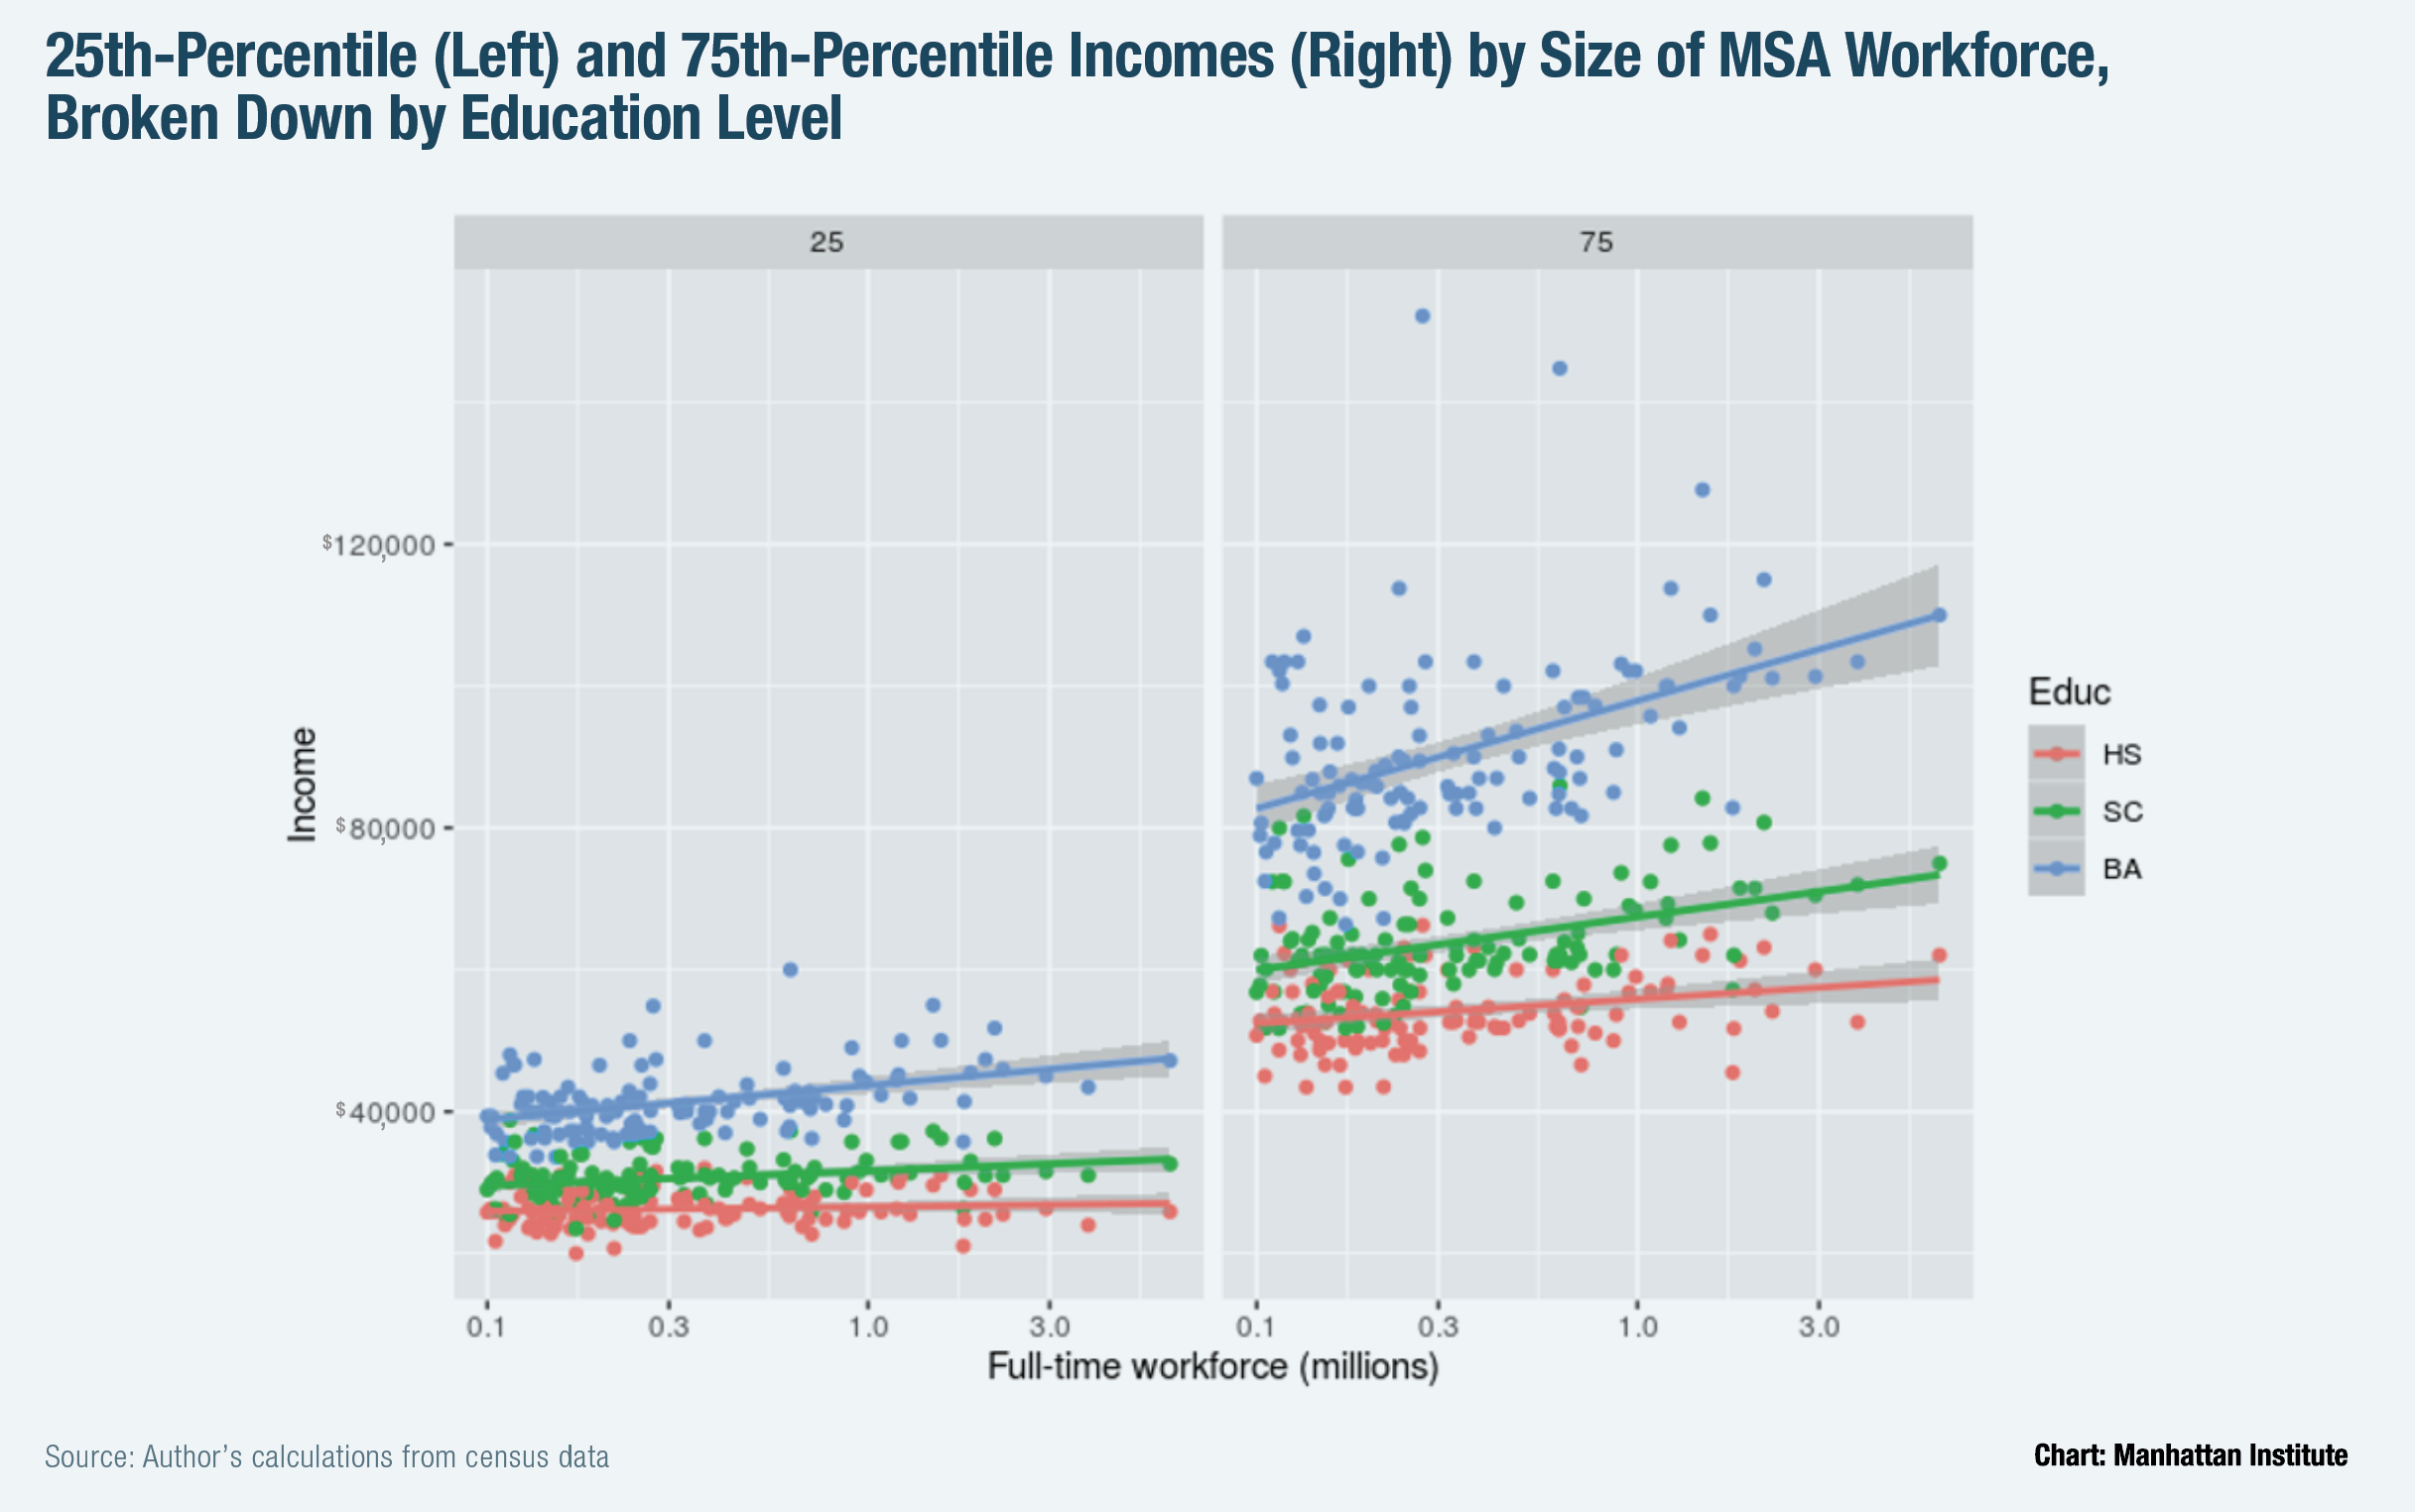
 As shown in Figures 4 and 5, overlap decreases moderately as the overall size of the MSA workforce increases, driven mostly by higher incomes for workers with BAs in larger MSAs, not lower incomes for those without BAs. Every 10% increase in the size of an MSA workforce corresponds with an average reduction of 0.094 in BA/HS overlap; the correlation between overlap and workforce size is -0.39.
This finding aligns with recent work by David Autor and colleagues, showing that while workers of all education levels once received higher wages in denser cities, this premium has vanished for workers without college degrees.[10] Similarly, Peter Ganong of the University of Chicago and Daniel Shoag of Harvard University,[11] as well as Federal Reserve economists Keith Wardrip, Kyle Fee, and Lisa Nelson,[12] have shown that incomes for more educated workers keep pace with the higher cost of living in larger cities, while those for less educated workers do not.
Occupation
Who are these workers in the overlapping areas of the wage distributions, and what are they doing? Figures 6 and 7 list the top 10 occupations for the highest-earning third of HS workers (those with incomes of $47,573 and above) and the lowest-earning third of BA workers (those with incomes of $48,000 and below). For the top of HS distribution, the most common occupations include truck driver, secretary, freight laborer, electrician, and sales representative, as well as first-line supervisor in sales, production, construction, and office administration, along with unclassified managers.
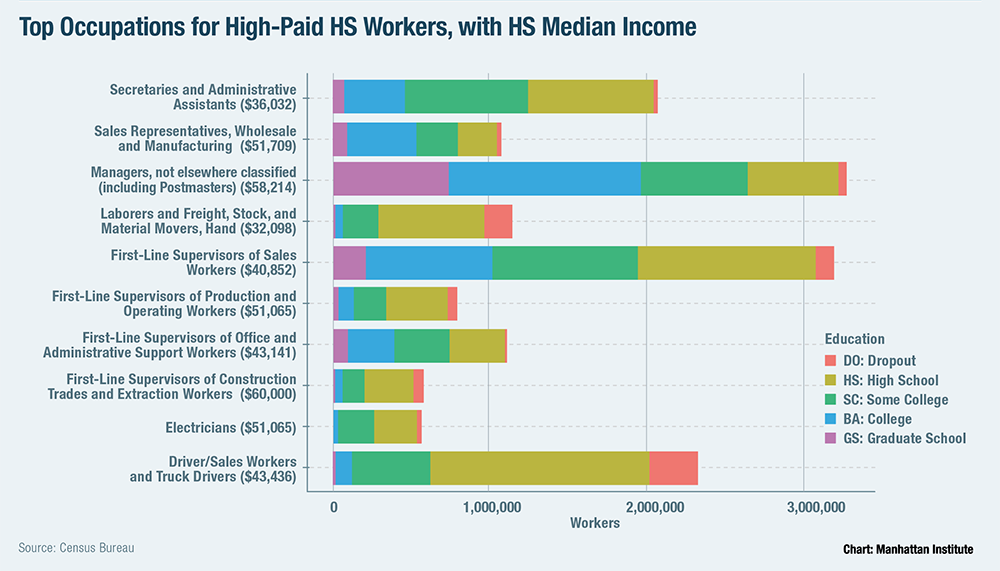
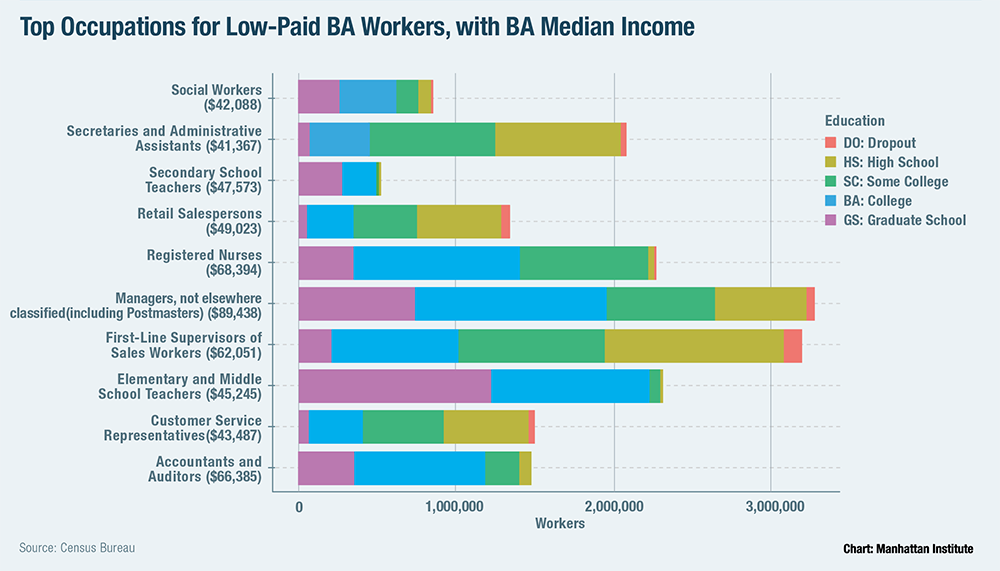
*Note: An earlier version of this report incorrectly described the median income figures presented in figures 6 and 7. The numbers presented there correspond to median incomes for HS and BA workers within each occupation, not to median incomes for the occupation as a whole. The report has been updated.
These fields are not niches that require specialized training. They employ large numbers of HS workers from all parts of the earnings distribution; they have as many workers who do not land in the top third as those who do. The prevalence of managerial positions also underscores the opportunity to earn high wages after moving up just one rung on the career ladder.
Most occupations that employ substantial numbers of HS workers have substantial variation in pay, and the vast majority have at least some HS workers earning at the high end of the distribution. While in some fields, almost no HS workers reach the top third of the HS distribution (e.g., just 4% of maids and housekeepers income and just 10% of hairdressers), the vast majority do offer opportunity to achieve earnings in that range.
The picture for BA workers in the bottom third of their distribution is somewhat different. There are two distinct categories of occupations in this group: those that require a college degree but often pay low salaries; and those that require no college degree and have more HS than BA workers in them. The first group includes elementary school teachers, social workers, accountants and auditors, and designers. The second group includes secretaries, customer service representatives, retail salespeople, and supervisors, as well as the catchall “manager” category.
This pattern of low-income BA workers filling jobs that do not require BAs persists across even a much larger range of occupations. For instance, among the top 50 occupations for BA workers in the bottom third of the BA distribution, only 27 have more BA than HS workers in them. By contrast, 21 of the top 25 and 39 of the top 50 occupations for HS workers in the top third of their distribution are populated predominantly by HS workers. In other words, HS workers do not reach the top of their distribution by moving into BA-dominated fields; plenty of well-paying occupations exist for which a high school diploma is enough. By contrast, while some low-paying fields require BAs, the low end of the BA distribution is more filled with workers who have fallen into the HS-dominated segment of the labor market.
Conclusion
While college graduates typically earn much more than individuals with only high school diplomas, individual incomes also depend to a large extent on choice of occupation and performance in it. The occupations for most HS workers offer opportunities to reach the top third of their cohort’s earnings distribution, and this is especially true where entry-level positions offer a pathway to first-line supervisor. Many BAs, meanwhile, use their college degrees in fields that pay less than well-paying HS jobs, or they work in fields for which a degree is unnecessary.
Although college remains a good choice for those who will succeed there and put their degrees to use, many who pursue college today might be better served by alternative pathways toward occupations that require less formal education and offer a chance for advancement. This is true despite a monomaniacal focus on college preparation and attendance in the American education system. Perhaps the most significant implication of these data is that policymakers should focus their attention not on yet more investment to get yet more people into college, but rather on desperately needed investment in noncollege pathways, which, in many cases, could offer greater opportunity for economic success.
Endnotes
Are you interested in supporting the Manhattan Institute’s public-interest research and journalism? As a 501(c)(3) nonprofit, donations in support of MI and its scholars’ work are fully tax-deductible as provided by law (EIN #13-2912529).