The Case for Mayoral Control in New York City Education

Photo: JGI/Jamie Grill / Tetra images via Getty Images
Introduction
The world’s best school systems make it clear who is responsible for educational results. In contrast, most U.S. schools are governed through local boards, a structure that is uncommon internationally. Centralized authority allows systems to maintain consistent policies and hold leaders directly accountable for the outcome of students’ education.[1] A global study of 25 school systems found that long-term reform depends on both spending and consistent, system-wide leadership.[2] More than 40 years ago, the federal report “A Nation at Risk” warned that U.S. schools were falling behind globally.[3] Despite decades of reform, the fragmented structure of how most schools are run in the U.S. may still be holding back much of the nation.
The system of responsibility and accountability in American education does not need to be this fragmented. Mayoral control has enabled New York City, the nation’s largest school district, to implement system-wide reforms that were impossible under previous governance models. First adopted in Boston in 1992, then expanded to NYC in 2002 and later to Washington, D.C., in 2007, mayoral control shifted authority from elected boards to the mayor.[4] In this model, mayors set school district priorities and are directly responsible for the results.[5] This makes it possible to carry reforms across a large city, ensure stable leadership, and follow through on long-term plans. With the 2025 mayoral election approaching, the future of mayoral control in NYC remains uncertain, making the nation’s largest school district the most consequential test of this governance model.
What Is Mayoral Control?
More than 99% of U.S. school districts are governed by locally elected boards. Fewer than 1%, limited to some large cities, operate under mayoral control.[6] In the traditional local board model, approximately five to nine elected board members share authority over school policy, budgets, and school superintendents. Boards serve staggered terms: board members are up for election every cycle. This traditional model of school governance was designed to closely represent local communities; however, turnout for school board elections averages only 5–10% of the voting population, so a small subset of voters makes decisions for the entire community.[7] As a result, an unrepresentative portion of the public determines who governs schools.
Charter schools are structured differently from traditional district schools. Rather than being run by elected boards, they are governed by appointed nonprofit boards with accountability concentrated at the school level.[8] District boards distribute district-based decision-making across multiple elected members. Charter schools illustrate how governance affects accountability. Mayoral control takes accountability from the district level to the city level, placing responsibility for student outcomes in the hands of the mayor.
In NYC, the mayor appoints the schools chancellor and most of the members of the Panel for Educational Policy, which serves as a citywide replacement for a traditional school board.[9] This structure makes the mayor directly responsible for school leadership and student outcomes. It also allows for reforms across an entire district to be implemented right away rather than waiting for multiple board members, who all have competing agendas, to vote. Clear lines of authority and accountability are critical for sustaining large-scale reforms.[10] Boston was the first U.S. city to adopt mayoral control in 1991, and the education outcomes have improved over time.[11] Boston’s eighth-grade reading performance increased from 22% of students at or above proficiency in 2003 to 30% in 2019, an eight-point percentage gain, according to the National Assessment of Educational Progress (NAEP).[12] This success laid the foundation for mayoral control in the nation’s largest city, NYC.
NYC Under Mayoral Control
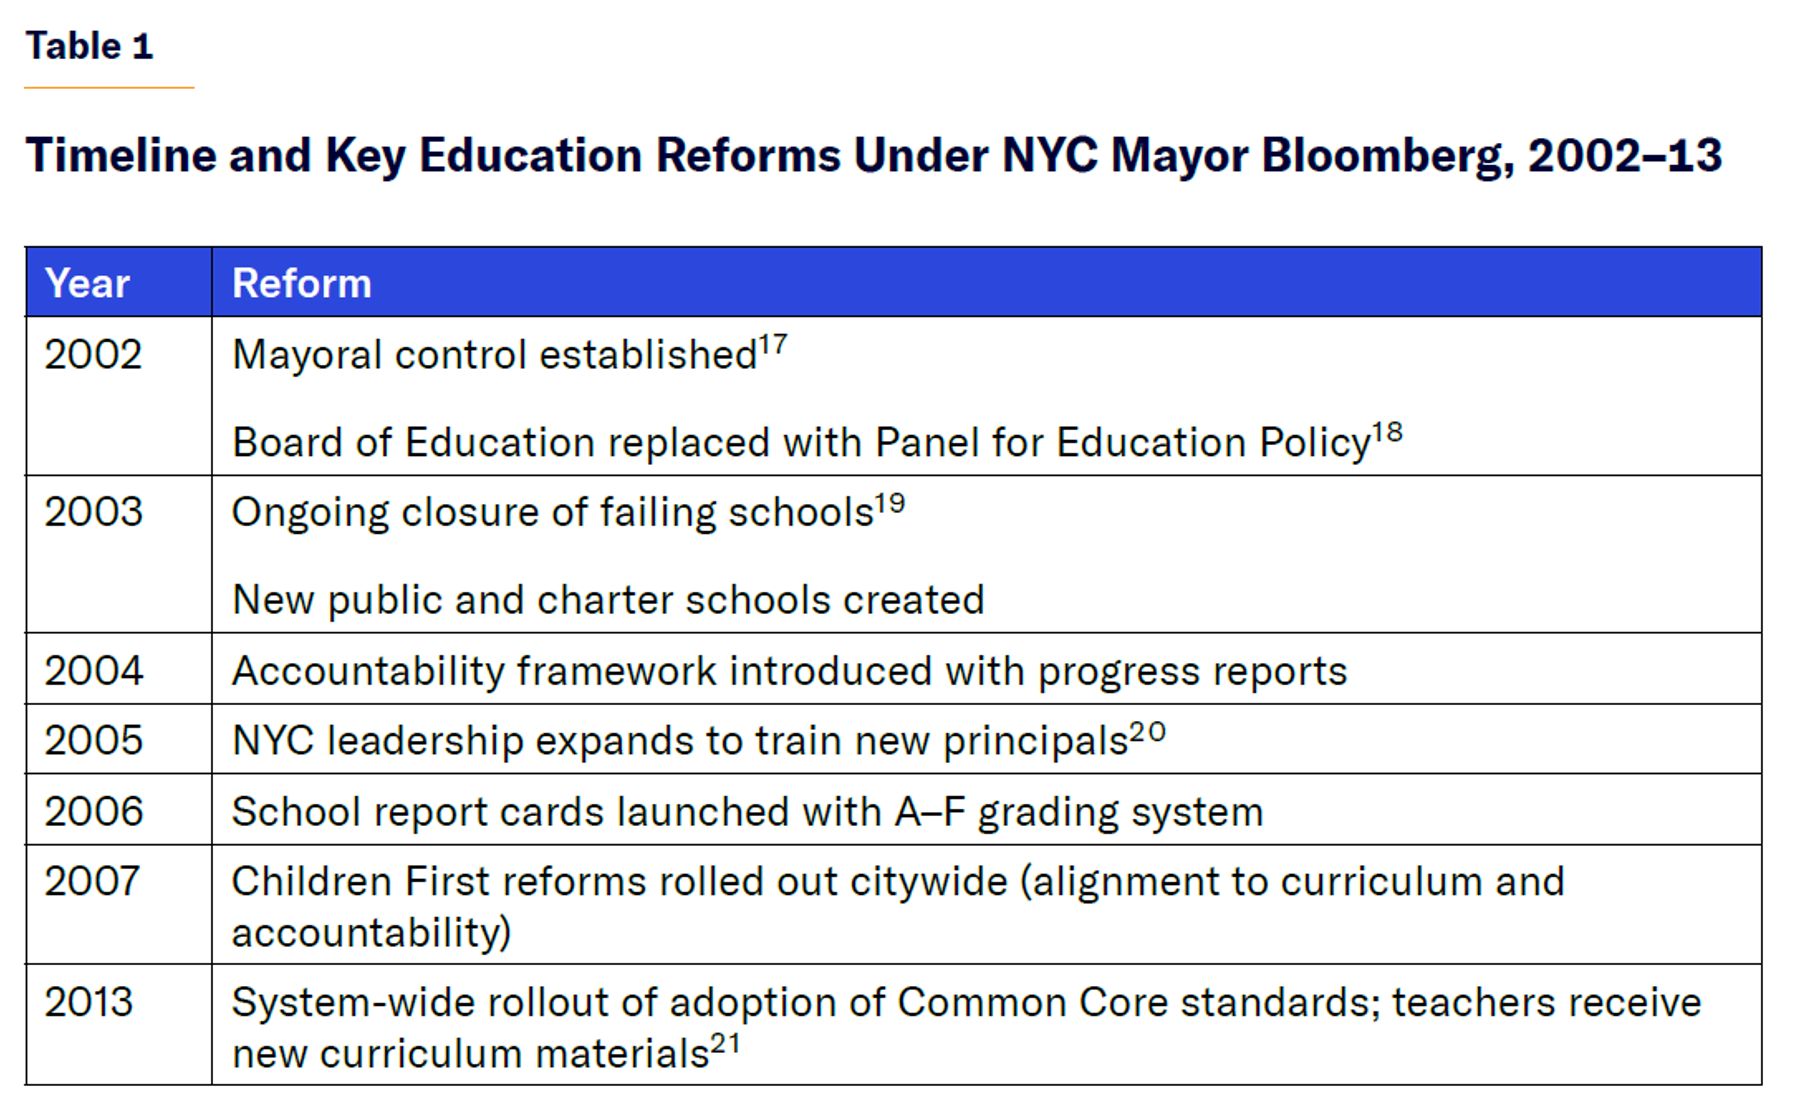
Mayoral control was enacted by New York State in 2002, following Mayor Michael Bloomberg’s push to centralize school governance under the mayor’s office.[13] During his time as mayor, reforms (Table 1) included closing failing schools,[14] opening new public and charter schools, launching citywide accountability and curriculum frameworks,[15] and early adoption of Common Core.[16]
When Mayor Bill de Blasio took office in 2014, he used mayoral control to advance his own priorities, including the implementation of universal pre-K. In its first year, this initiative provided free, full-day preschool to more than 70,000 4-year-olds.[22] In 2017, the initiative expanded to include 3-year-olds in certain neighborhoods.[23]
While mayoral control did not guarantee effective policy, it did guarantee the capacity for system-wide initiatives. This was evident in the Renewal Schools program, which cost more than $770 million under de Blasio.[24] It did not improve education outcomes and was phased out in 2019. The centralized model enabled the city to make changes once the program’s failure became evident.
Since Mayor Eric Adams took office in 2022, he has prioritized citywide literacy reforms. In May 2023, he launched NYC Reads, requiring every elementary school to use one of three science-of-reading curricula.[25] By the 2024–25 school year, full implementation had been achieved across all 1,200 elementary schools.[26] To the contrary, the second-largest U.S. public school system—Los Angeles Unified School District (LAUSD), which is not under mayoral control—began encouraging the use of science-based reading curricula in 2022. By the end of 2024, 50% of schools had adopted this within their school systems.[27]
NYC Public School Outcomes
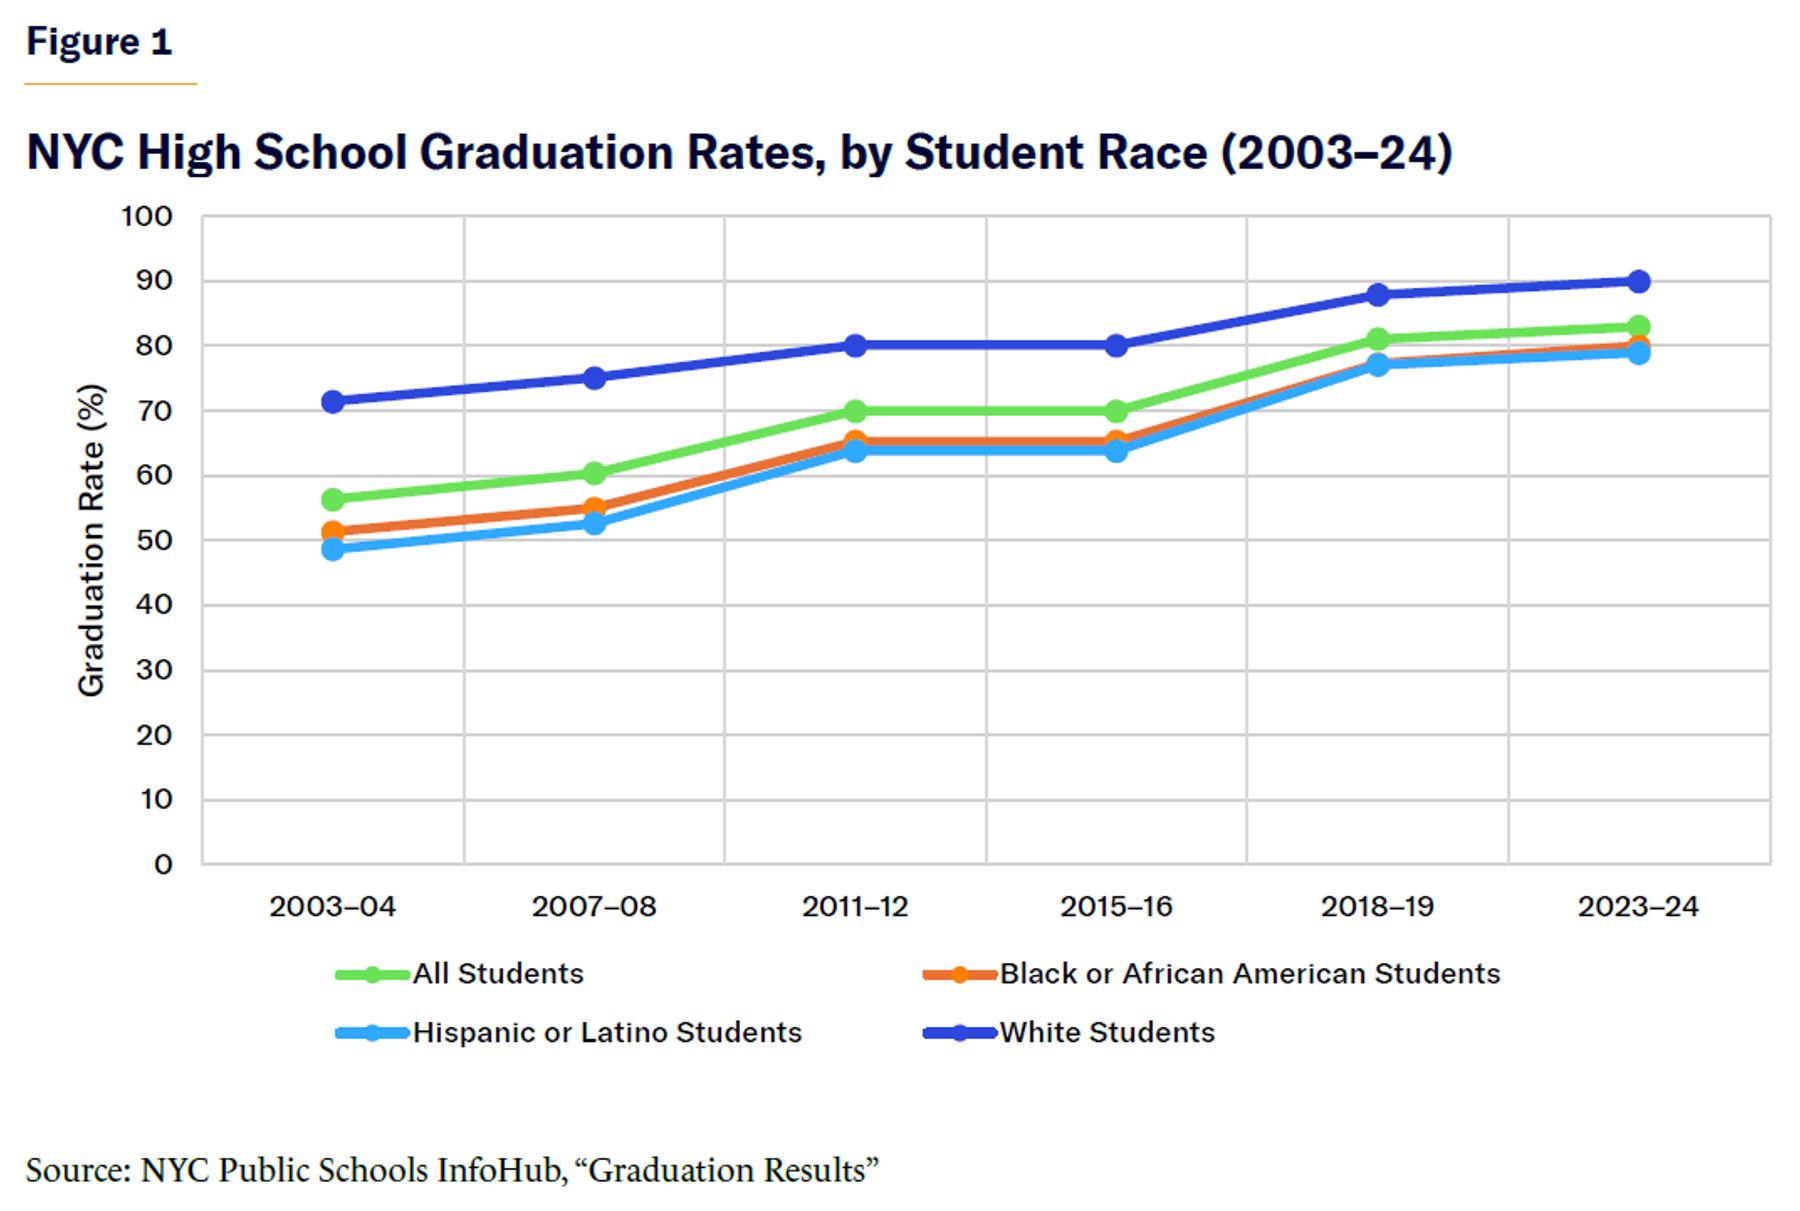
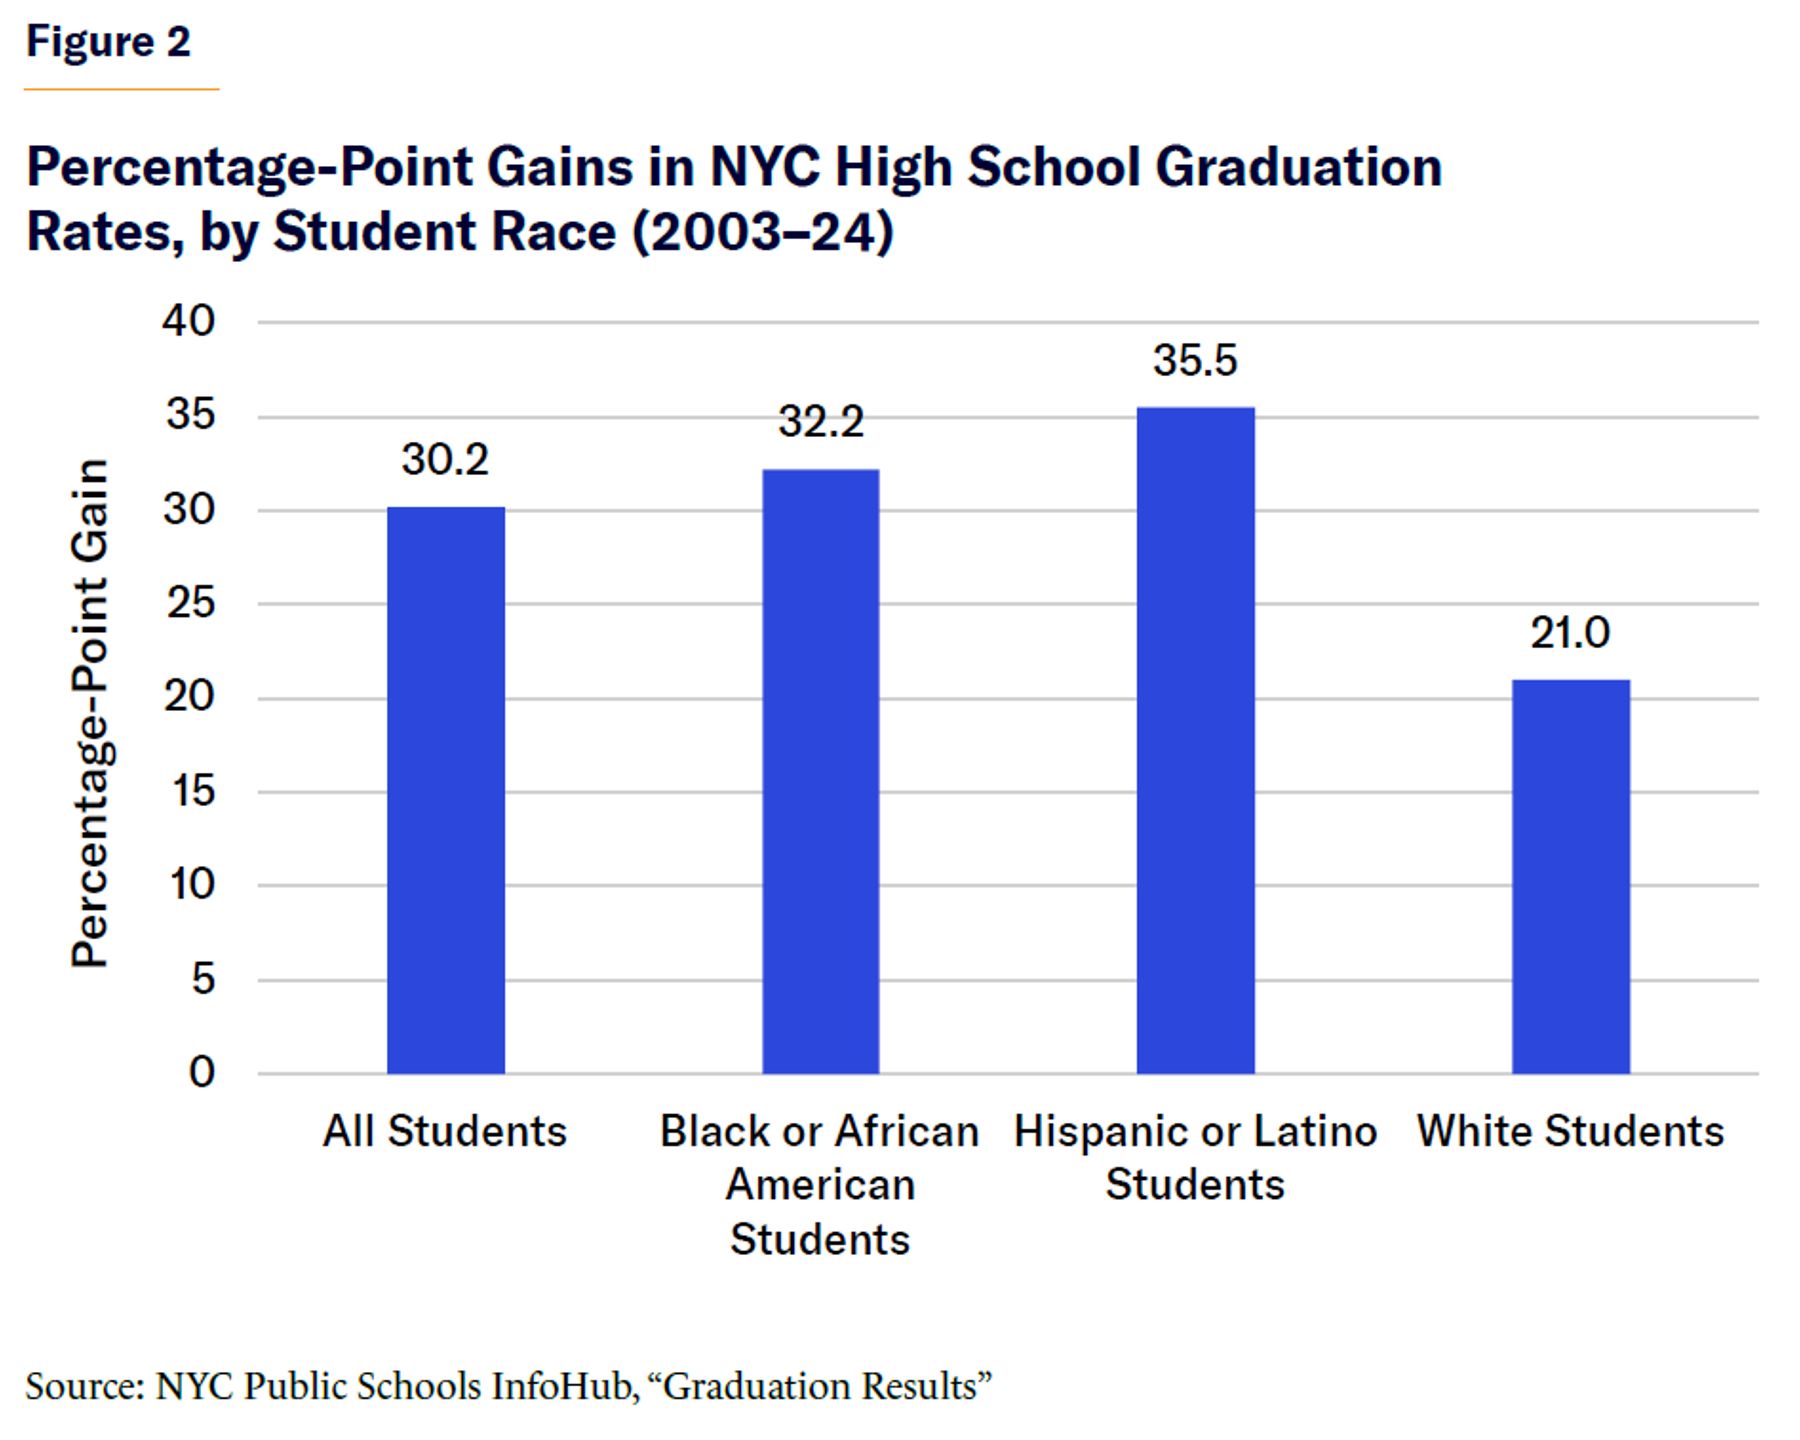
The impact of mayoral control in NYC is most evident in graduation rates (Figure 1). In 2003, 53% of all students graduated from high school, and this increased to 83% by 2024. The gains were more significant for black and Hispanic students, who saw increases by more than 30 percentage points over the same period, narrowing racial gaps (Figure 2). NYC also caught up with the national graduation rates: in 2003, NYC was about 20 points below the national average, but by 2024, the gap had decreased to 4 points.[28]
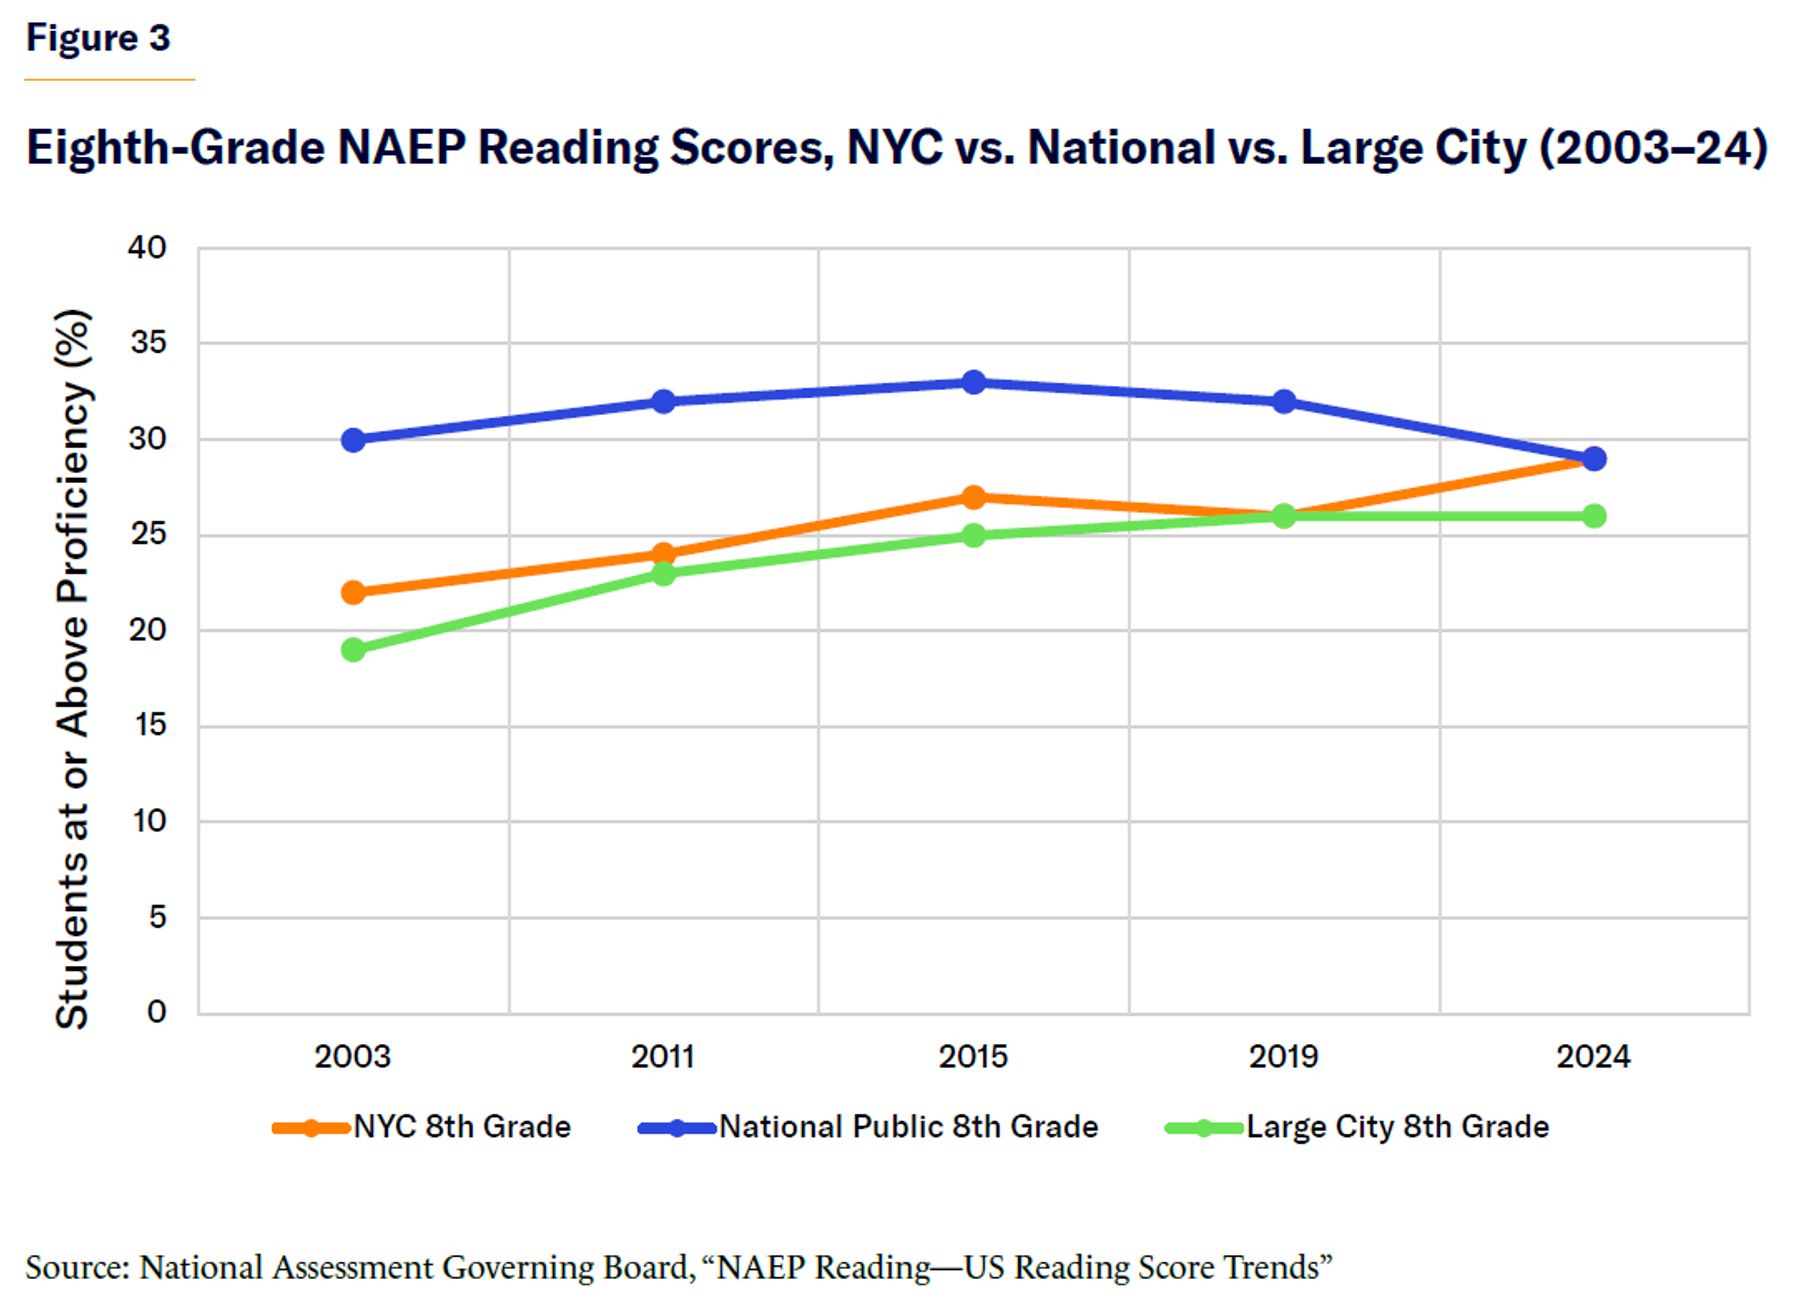
Beyond graduation rates, the city’s progress under mayoral control can also be seen in national measures of student achievement. Eighth-grade results are especially critical, as they capture how well students are prepared for high school. NYC reading performance on the NAEP shows a general long-term increase under mayoral control (Figure 3). In 2003, 22% of NYC eighth graders scored at or above proficiency, which was below the national average of 30%. By 2015, NYC had increased to 27%, closing the gap with both national and large-city schools. Although scores decreased in 2019, by 2024 NYC reached 29% of students at or above proficiency, one percentage point lower than the national public school average and above the large-city average (26%).[29] While NAEP scores rose in many states and cities during this period, NYC’s trajectory is notable because the city’s eighth graders began significantly behind the nation but closed the gap. Achieving this across such a large district requires consistent reforms, which would be more difficult in board-governed systems.
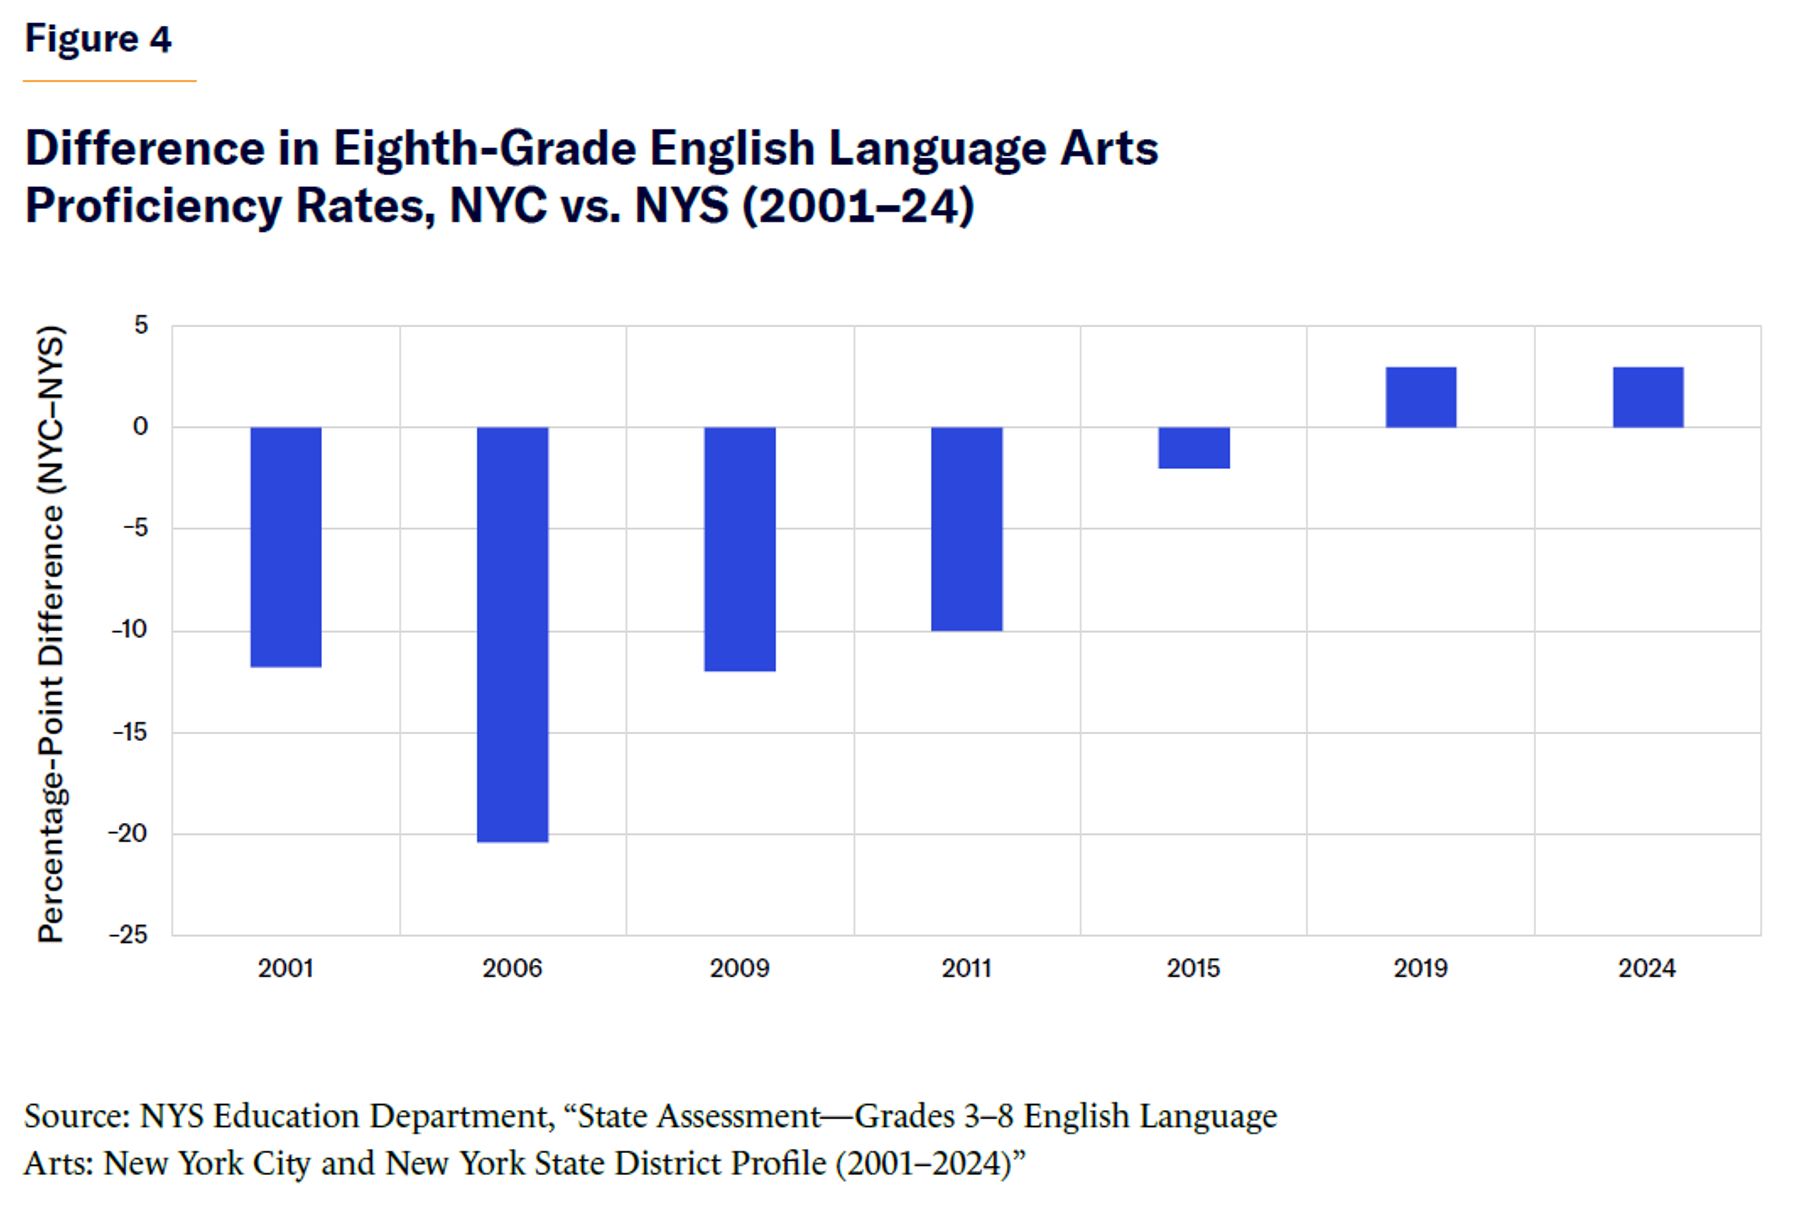
NYS assessments provide a consistent measure of NYC’s progress under mayoral control (Figure 4).[30] In 2001, just before mayoral control began, NYC’s eighth graders were 12 percentage points behind the statewide average. In 2006, the gap increased to 21 percentage points. The federal accountability system under the No Child Left Behind Act required states to include all subgroup performance in their accountability measures. The gap began to shrink but was still significant in 2009 (12 percentage points) and 2011 (10 percentage points). By 2015, that gap decreased to 2 points. Four years later, the city exceeded the state for the first time by 3 points and maintained that edge in 2024.
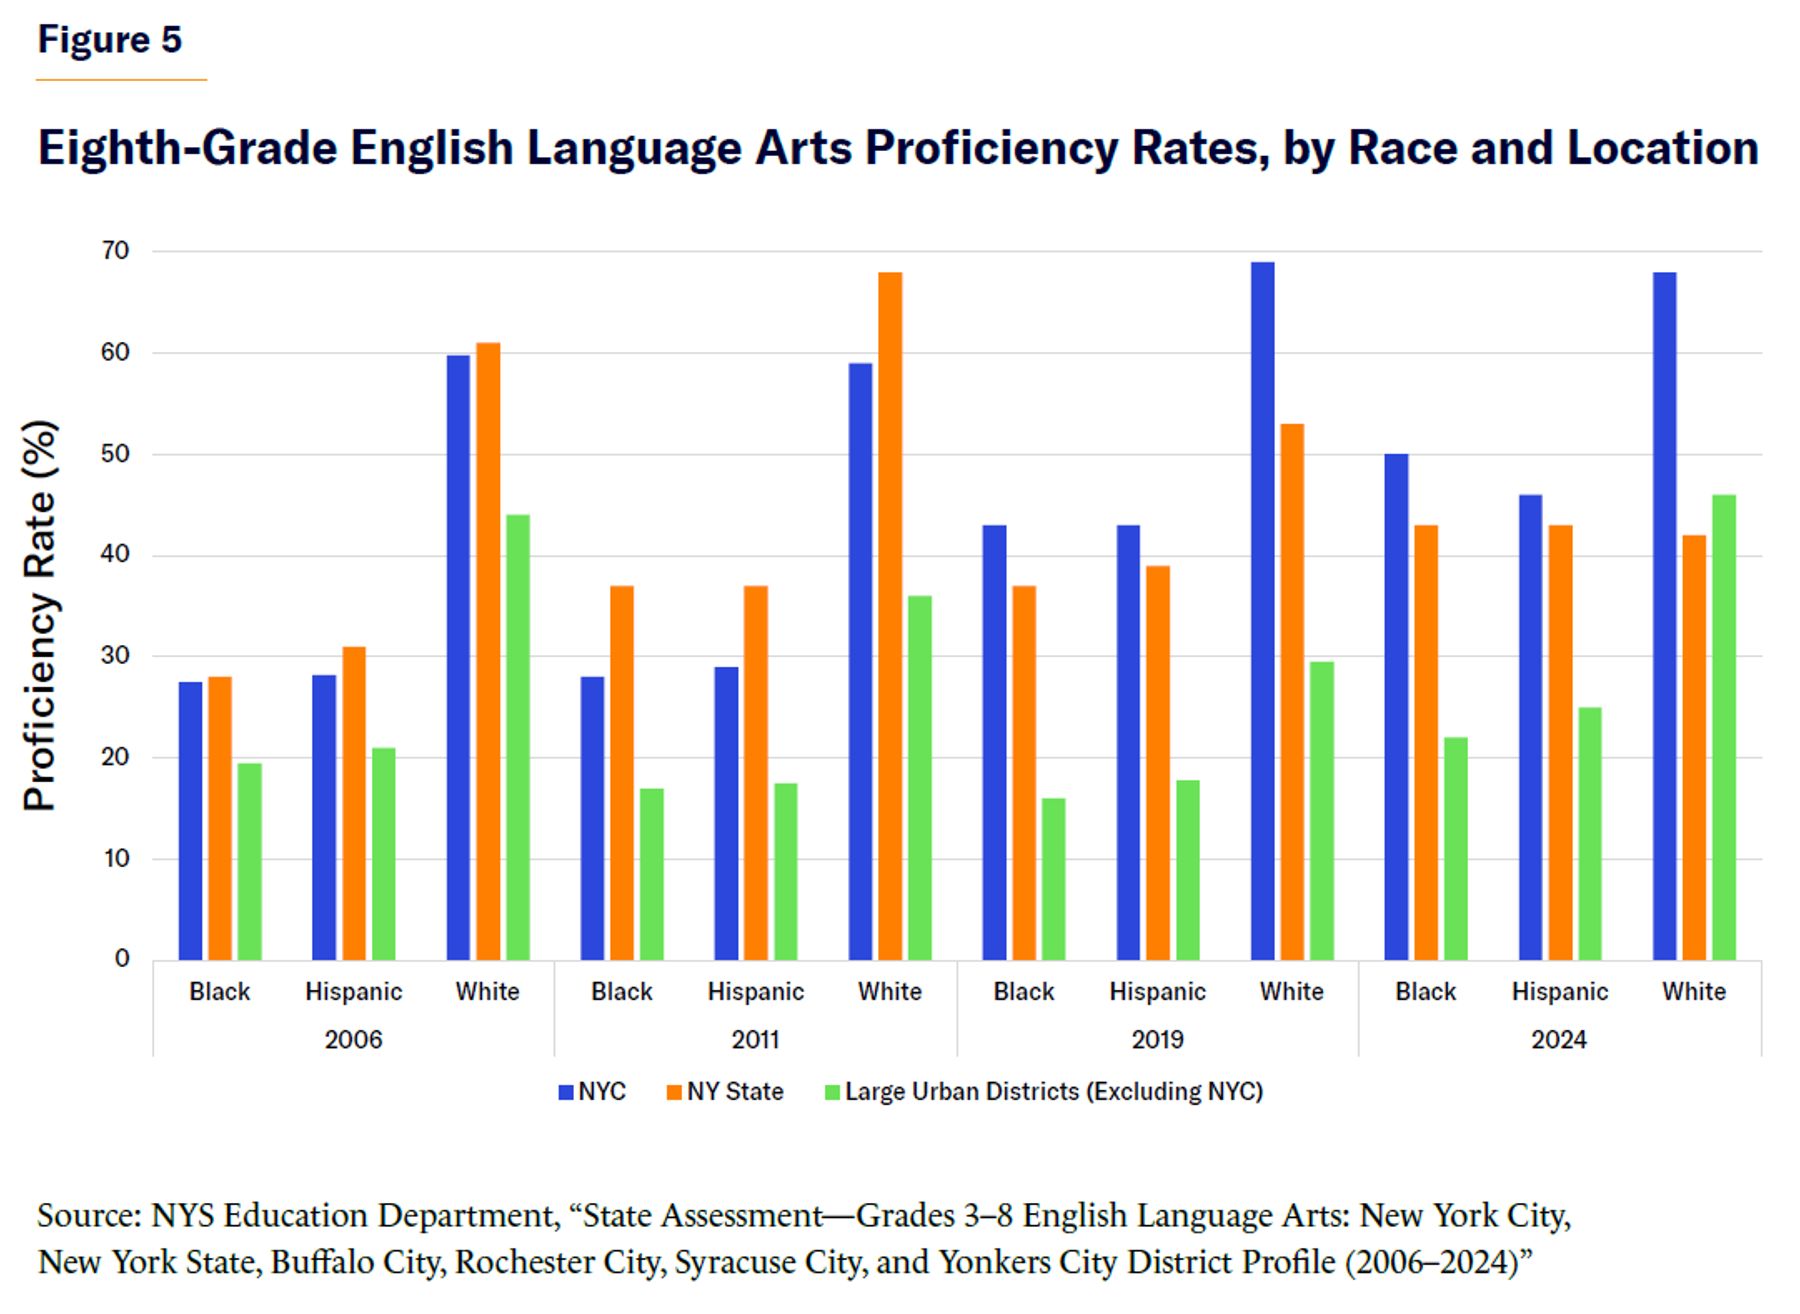
Changes in eighth-grade English Language Arts proficiency by race and ethnicity show similar trends (Figure 5). Consistent subgroup results for NYC first became available in 2006, when the No Child Left Behind Act required states to disaggregate performance by race and ethnicity.[31] That year, black and Hispanic eighth graders in NYC scored nearly the same as their statewide peers. All groups performed significantly better than students in other large urban districts. In 2011, only 28% of black and Hispanic eighth graders in NYC reached proficiency, 10 points below the statewide average (38%). By 2019, 43% of black and 42% of Hispanic students in NYC reached proficiency, surpassing the rest of the state (37% and 39%, respectively) and outperforming other large urban districts within the state, known as the Big 5 (ranging from 16%–18%). By 2024, NYC students in every group outperformed the rest of the state. Proficiency rates were 50% for black students, 46% for Hispanic students, and 68% for white students, compared with statewide results of 43%, 43%, and 42%, respectively. The results suggest that under a centralized system, achievement gaps decreased, closing the gap for often underserved students compared to both the state and other large urban districts.
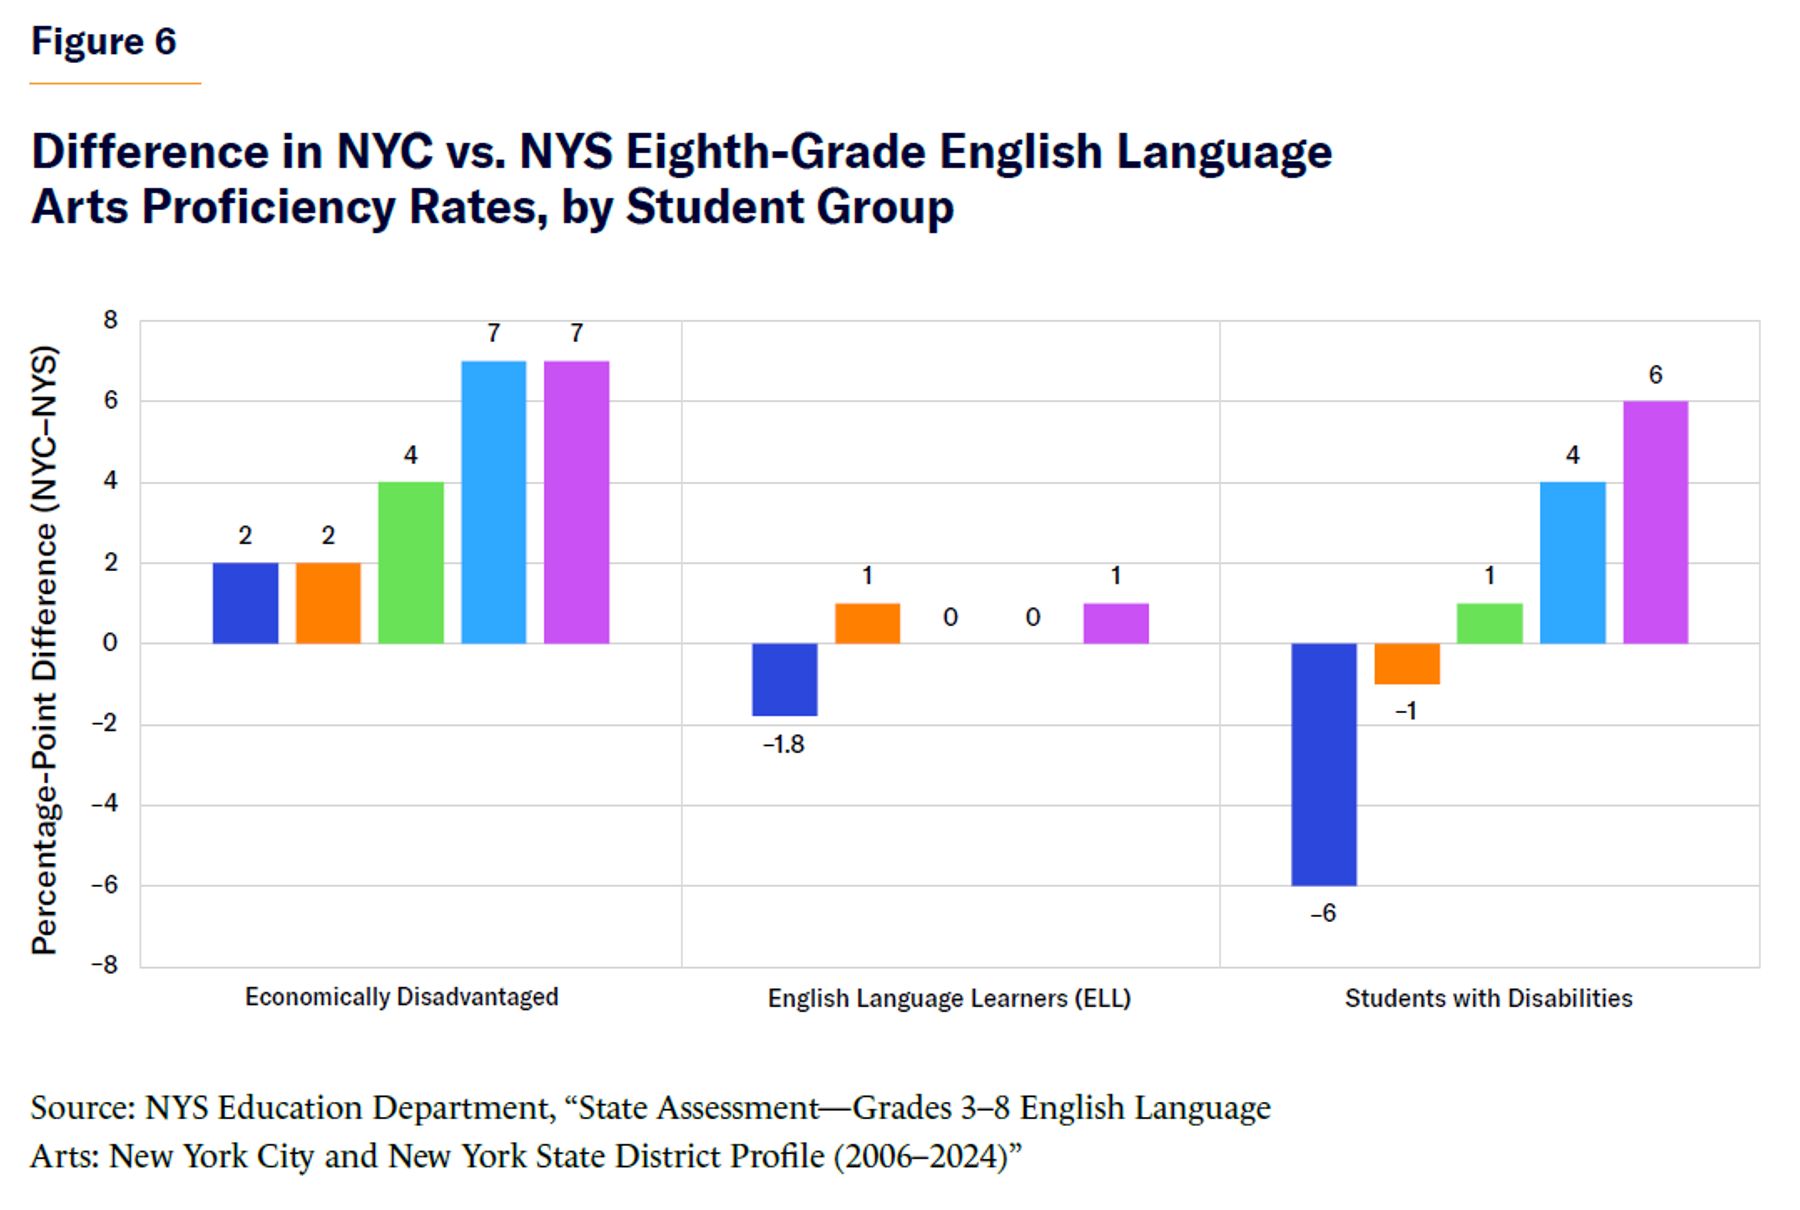
These trends also hold when disaggregated by subgroup (Figure 6). In 2006 and 2011, economically disadvantaged students in NYC scored 2 points above the state average. By 2024, NYC was seven proficiency points ahead of NYS. Students with disabilities also demonstrated progress over the past two decades: in 2006, these students’ proficiency rates were 6 points below the state average; by 2011, they scored only 1 point lower than the overall state proficiency rate; and by 2024, they had surpassed the state proficiency average by 6 points. English Language Learners achieved gains more challenging statewide, but NYC remained consistent with the state average. These results demonstrate that system-wide reforms have reached historically underserved groups, narrowing and reversing long-standing gaps with the state, under mayoral control.
NYC is the only district in the state that operates fully under mayoral control, making its trajectory distinct from all other districts still governed by local school boards. While the state has periodically revised its proficiency benchmarks, the comparison remains valid because all districts were subject to the same changes.[32] NYC has surpassed the state under the same standards, which is evidence that mayoral control has helped sustain reforms in ways that traditional local board governance has not.
A Governance Comparison
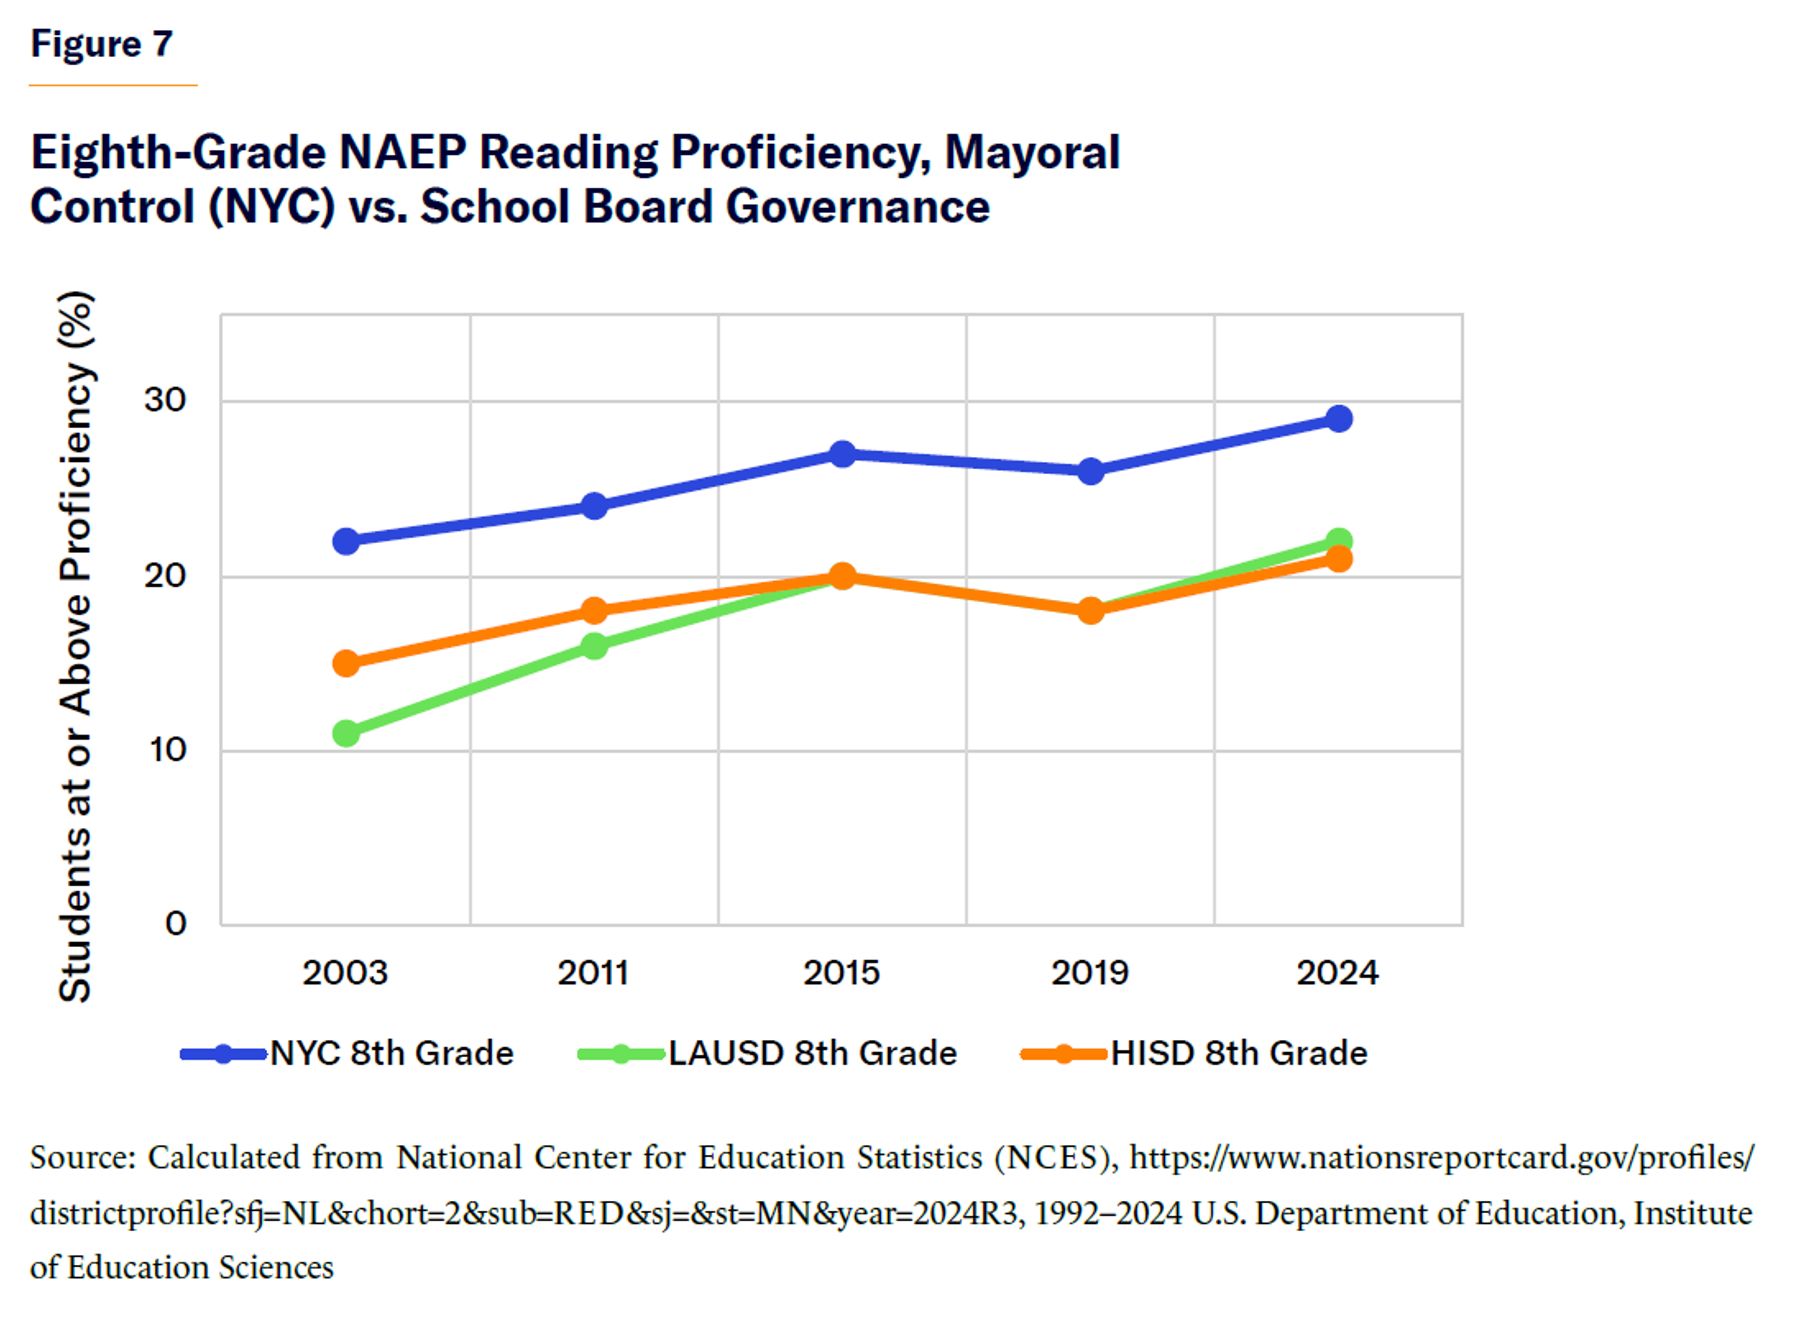
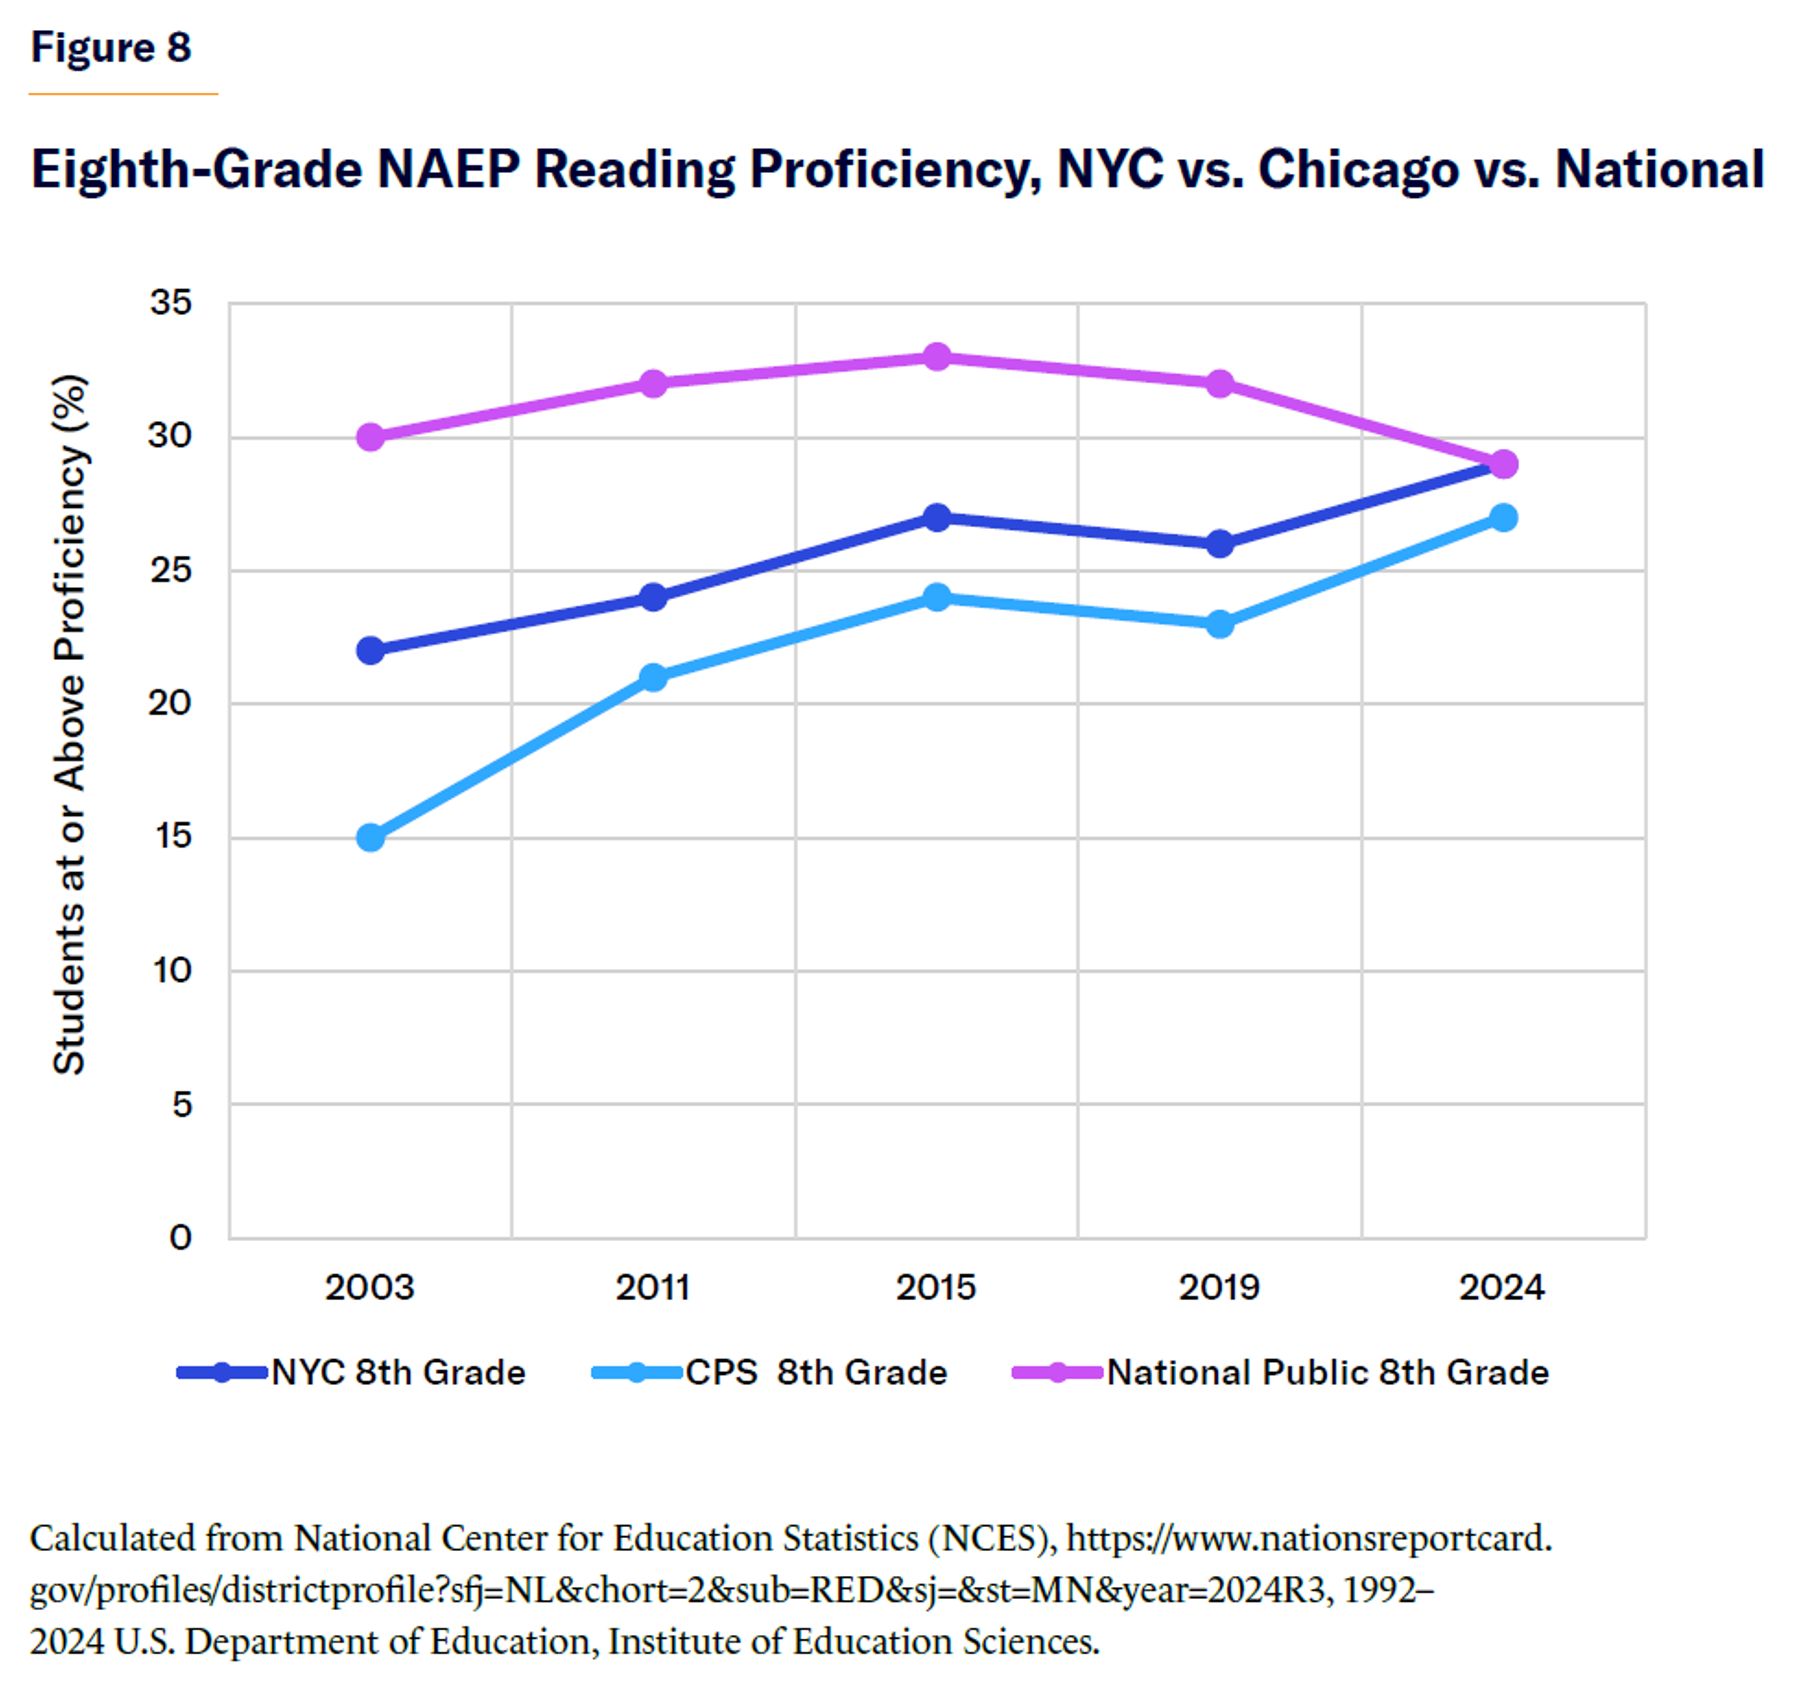
While NYC academic results are strong in isolation, a larger test of governance is to compare NYC to other large systems, as seen in Figures 7 and 8. Between 2003 and 2024, eighth-grade reading proficiency in NYC increased from 22% to 29%, consistent with the national average. Over the same period, LAUSD increased from 11% to 22%, and Houston Independent School District (HISD) rose from 15% to 21%; however, both remained below the national average. Underperformance and governance breakdown in Houston led the Texas Education Agency to remove the locally elected school board and replace it with a state-appointed board of managers in 2023.[33] These results indicate that mayoral control in NYC supported reforms that helped the district reach the national average, where other large school systems under a board-governed system remained well behind.
Chicago Public Schools (CPS) started operating under mayoral control in 1995. Since 2003, Chicago’s eighth-grade students have increased their reading proficiency by 12 percentage points (from 15% to 27%), 2 points away from the national proficiency average. In 2024, LAUSD and HISD were several percentage points behind the national average (7 and 8 points, respectively). CPS was the only other major district to operate under mayoral control; however, since November 2024, it has begun a transition back to local governance with elected school boards. While Chicago has shown progress over the past two decades, its shift away from the model introduces uncertainty about the future trajectory of the district.
Leadership Stability and Governance
One major difference between NYC and LAUSD is in the stability of their leadership (Table 2). In board-governed districts, superintendent tenure can be short. Recently, the Council of the Great City Schools reported that the average tenure for big-city superintendents is 2.7 years, compared to 5 years a decade ago. Between 2018 and 2023, three-quarters of districts replaced their superintendents at least once.[34] These turnovers challenge the implementation of system-wide reforms. Research confirms that the problem is common. A study of 215 California districts found that almost half of superintendents left within 3 years, and in the largest urban systems more than 70% left.[35] On average, superintendents remain in their role for just about 3 years before turnover occurs.
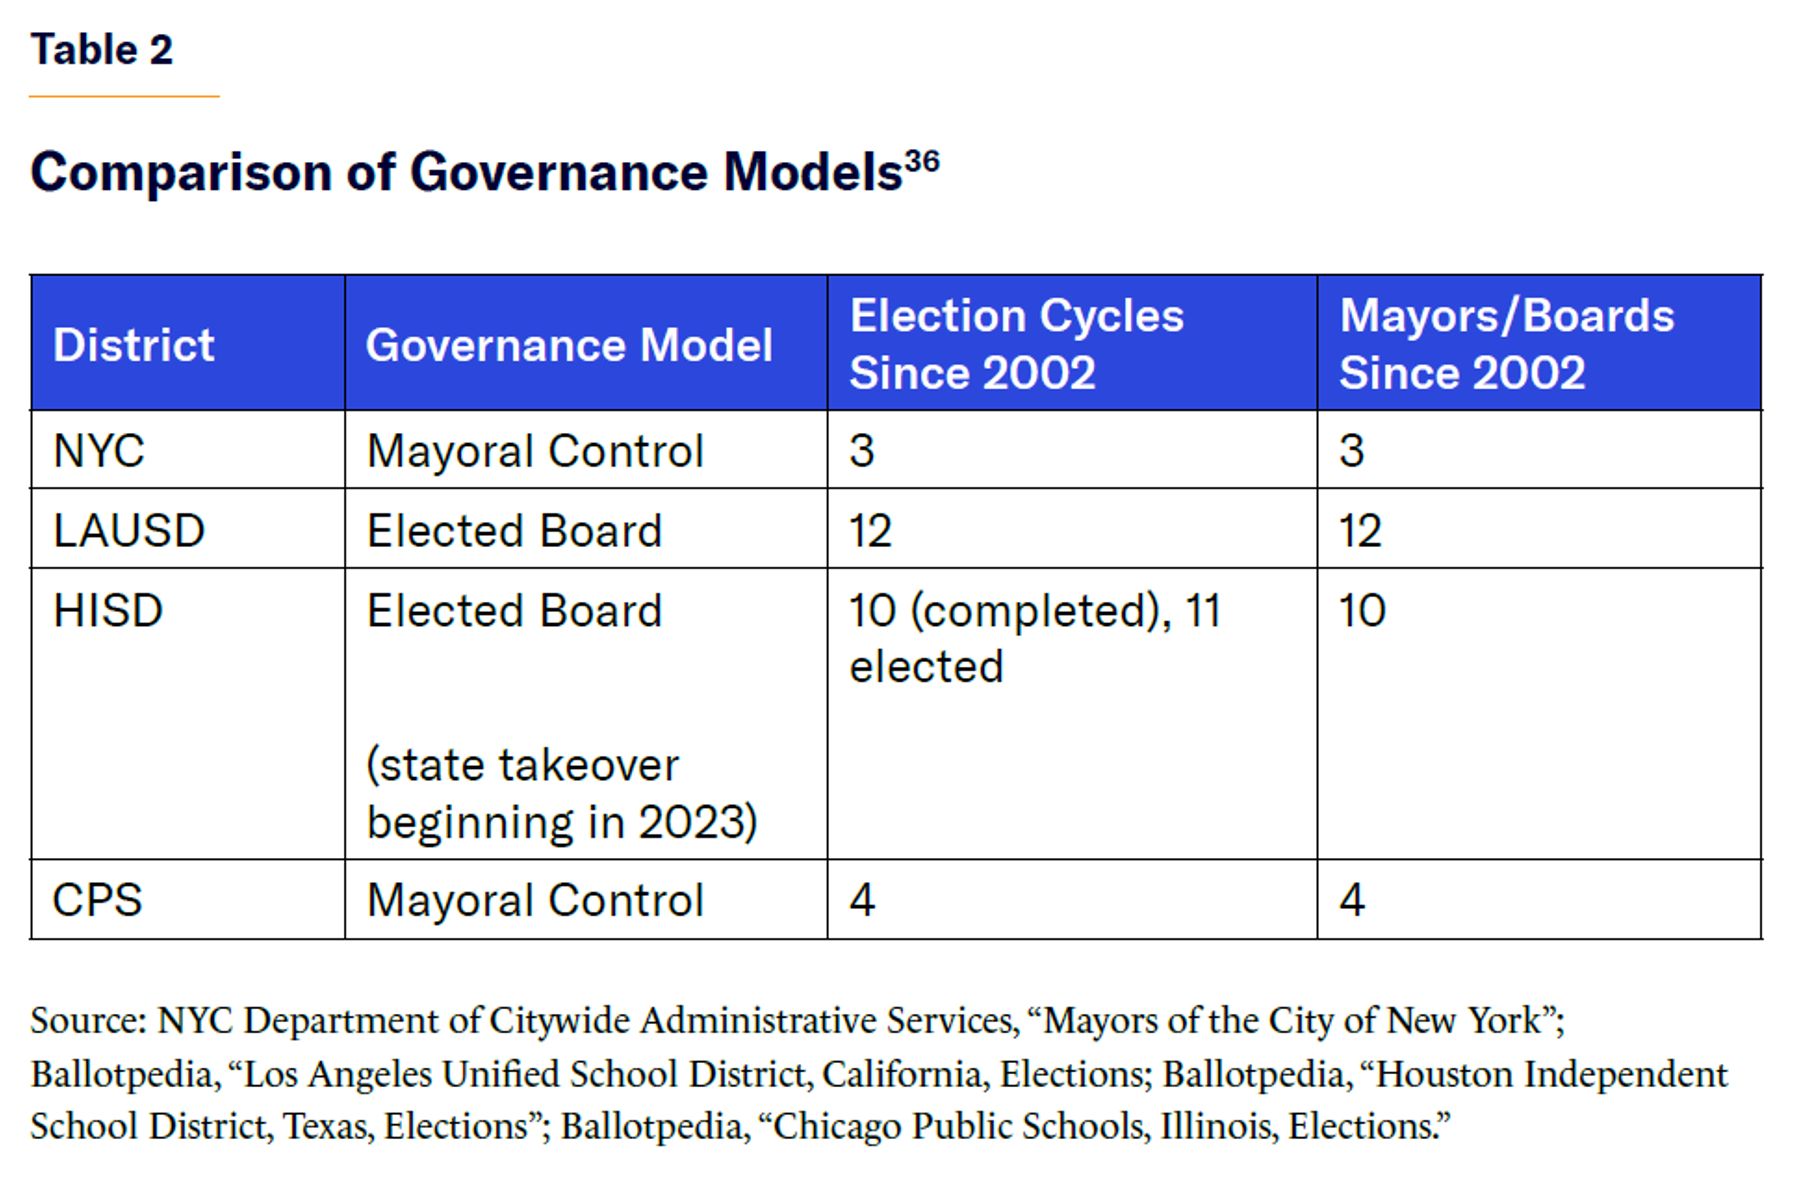
Unlike NYC’s three mayors since 2002, LAUSD’s seven board members serve staggered four-year terms, with seats up for election every two years. LAUSD board members are eligible to earn up to $125,000 per year for their service.[37] This has contributed to the high turnover rate among superintendents, with most serving fewer than three years. HISD has faced similar instability that culminated in a state takeover by the Texas Education Agency in 2023. In contrast, NYC’s three mayors maintain the school system’s priorities, even when chancellors change.
Leadership instability carries direct consequences for schools and students. Turnover contributes to lower staff morale, weaker community support, and financial impact, all of which affect student outcomes.[38] Similar effects are observed at the building level, where principal turnover leads to measurable decreases in student outcomes.[39] Large-scale studies of school leadership research further show that effective leadership is associated with improved student achievement, whereas instability at the top does not sustain reforms or enhance outcomes.[40]
The evidence suggests that superintendent turnover is a structural weakness in board governance. Frequent changes at the top can interrupt reforms, as they can take hold and undermine the opportunity for progress at the schools that need it the most. By contrast, mayoral control has provided NYC with the leadership stability necessary to implement system-wide reforms over time.
The Big 5 as a NYS Governance Test
The same governance effects can be seen within NYS, where the Big 5 districts work under different structures. The Big 5 districts—NYC, Buffalo, Rochester, Syracuse, and Yonkers—operate under the same funding formulas, but differ in how districts are governed. Additionally, these five districts do not participate in the Boards of Cooperative Educational Services (BOCES), the shared cooperative service structures used by most other districts in NYS.[41] Therefore, internal governance plays a central role in how they use resources and implement reforms. Among the Big 5, only NYC has full mayoral control. Yonkers grants its mayor limited authority through board appointments. Buffalo, Rochester, and Syracuse remain under traditional elected boards.
The per-student impact is significant among these schools in how governance translates into resources. Table 3 illustrates how resources are utilized in some of these districts. A student in Rochester carries nearly $1,700 more in administrative overhead than a student in NYC.[42] If Buffalo and Rochester operated at NYC’s level of administrative efficiency , they could redirect nearly $100 million annually back into classrooms. Mayoral control enables this efficiency at scale: NYC runs a system 30 times larger than Buffalo’s with lower administrative costs per student and markedly higher graduation rates.
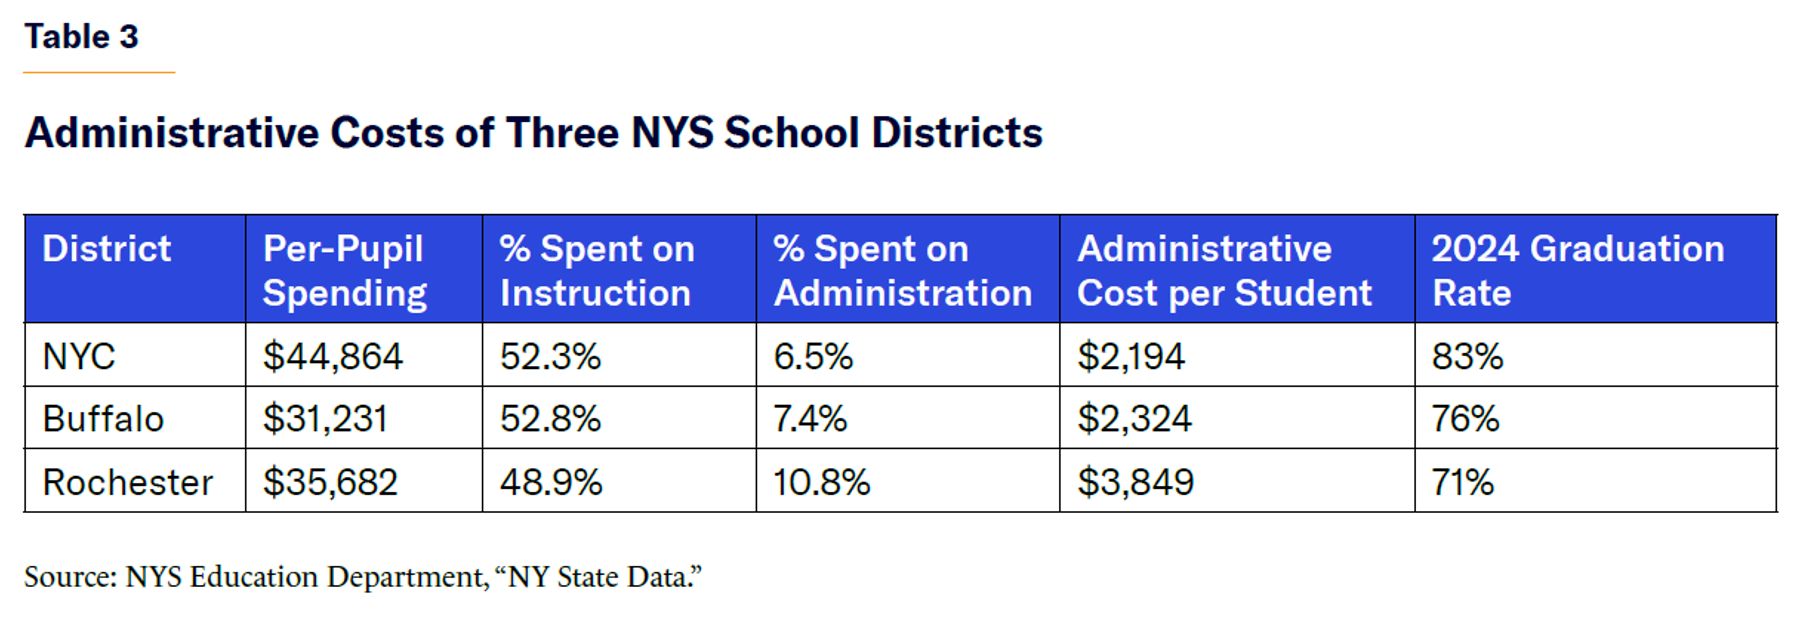
While NYC needs to closely examine its overall per-pupil funding and find ways to decrease it, the comparison with other Big 5 districts shows that, despite the high total costs, NYC directs a smaller share to administration. This means that more resources flow into the classrooms, where they are most likely to affect student outcomes. This has coincided with higher graduation rates and stronger academic results than board-governed peer cities, reinforcing that governance design shapes how dollars are translated to student achievement.
Implications
Comparisons across cities and within NYS show that how school districts are governed shapes their ability to sustain reform. There are many implications for the futures of both NYC and other large urban districts across the nation. The contrast among NYC, LAUSD, and HISD illustrates how governance influences outcomes. Over the past two decades, NYC’s mayoral model has reduced graduation gaps, increased academic proficiency, and carried out system-wide reforms. Los Angeles, governed by an elected board, has not sustained its reforms and continues to fall behind, even though both cities face similar challenges.
Although NYC’s trajectory has shown improvement, much work remains to be done. On the 2024 NAEP, fewer than one in three eighth graders reached reading proficiency. However, the evidence indicates that under mayoral control, NYC has moved closer to national averages, narrowed racial and economic gaps, and outperformed gains in other large urban districts. Moreover, its trajectory under centralized governance is stronger than that of comparable systems governed by boards.
Within NYS, the Big 5 districts also reinforce this conclusion. NYC directs a smaller share of resources to administration. Buffalo, Rochester, and Syracuse, which are still led by traditional boards, spend more on bureaucracy and are behind NYC in their graduation rates. These contrasts make clear that governance design is the foundation for progress and accountability in large districts.
Despite evidence from NAEP and data within the state, the NYS Board of Regents characterized results of mayoral control as “mixed” in their 2024 report and instead focused on processes such as equity representation and shared decision-making over student outcomes.[43] But outcomes are the most important metric. Over the course of two decades of mayoral control, NYC outcomes have increased across multiple measures. Graduation rates increased from 53% in 2003 to 83% in 2024. Gains were especially notable for black and Hispanic students, with increases in graduation rates of more than 30 percentage points. On the NAEP, NYC eighth-grade reading scores increased from 22% in 2003 to 29% in 2024, bringing the city’s score equal to the national average. On state assessments, NYC moved from 10 points behind the statewide average in 2011 to surpassing it by 2019 and maintaining its gain in 2024. Eighth-grade performance is one of the strongest predictors of readiness for high school, college, and career.[44] For this reason, NAEP’s eighth-grade scores evaluate the impact of governance reforms.
The state report also highlighted negative and mixed public testimonies regarding decision-making under mayoral control. However, NYC school survey data provide a different story of equity and representation. In 2024, the NYC School Survey[45] found that 99% of teachers said schools were building families’ capacity to advocate for their children and that 96% of families rated outreach to parents favorably. Moreover, 93% of teachers and staff agreed that their school leaders provided a clear instructional vision and used it to guide instructional priorities. This indicates that teachers, school staff, and families recognize and appreciate engagement and leadership. State leaders should acknowledge that governance design has allowed NYC to sustain reforms, raise achievement, and narrow student performance gaps. Those lessons are critical as the future of mayoral control comes under debate.
Recommendations
For New York City
As NYC prepares for the upcoming mayoral election, the future of mayoral control in schools could be on the line. To ensure that the city continues to build on two decades of progress in graduation rates, academic outcomes for all students, and gains for underserved students, the city must preserve and expand the model with transparency and accountability.
Recommendation #1: Preserve Mayoral Control
The most critical step is maintaining mayoral control. Ending mayoral control would risk undoing two decades of measurable progress in graduation rates, literacy outcomes, and equity gains. Accountability under one elected leader has provided the stability and accountability necessary to sustain reforms at scale in a district serving close to one million students.
Over the years, there have been repeated attempts by the state legislature to scale back mayoral control. In 2022, Governor Kathy Hochul proposed extending mayoral control in NYC schools for another four years, but lawmakers approved it for only two years.[46] In 2024, Mayor Adams and Governor Hochul again proposed a four-year extension of mayoral control, but the legislature approved only a two-year extension.[47] As a result, the question of whether to continue mayoral control will be up for debate again in 2026.
Despite these uncertainties, NYC has shown progress on student outcomes at a time when national achievement has stagnated and declined. Chicago’s decision to phase out mayoral control introduces uncertainty about the district’s ability to sustain reforms. NYC should avoid a similar risk and build on the stability that mayoral control has provided.
Recommendation #2: Strengthen Checks and Transparency
Per-pupil spending has recently exceeded $44,000 in NYC. The public needs a clearer picture of how dollars are being utilized and whether the cost is resulting in student outcomes. Transparency of how money is spent—and whether it is effective—is critical. Annual reports and outside audits can track progress, but they can also focus on areas that are not working. A stronger system of checks and transparency would ensure that ineffective programs do not go unnoticed. Instead, results would drive decisions, allowing the mayor to adjust course and keep reforms focused on improving outcomes for students.
Recommendation #3: Process to Evaluate Reforms
Mayoral control enables leaders to implement changes across an entire district quickly and efficiently. It is also essential to recognize that not all ideas will work. But safeguards are necessary to prevent ineffective programs from continuing. NYC’s decade-long investment in restorative justice[48] and the NYC Renewal Schools program[49] are two examples of initiatives that cost the city hundreds of millions of dollars but did not produce results for students. In the future, the mayor and Department of Education leaders should establish a system that tracks whether major initiatives are working, sets clear benchmarks, requires annual independent evaluations, and provides public reporting on whether reforms are meeting their goals. Results could be published in the biannual Mayor’s Management Report, for example. This would guarantee that outcomes are analyzed and reviewed regularly. Just as important, it would give the mayor the ability to make corrections, ensuring that ineffective initiatives are redirected to focus on student outcomes.
For the Nation
Recommendation #4: Pilot Mayoral Governance
As most U.S. districts operate under elected boards, cities with proficiency rates well below the national average should consider adopting mayoral control, allowing accountability to rest with one elected leader. With federal education shifting that authority back to the states, governance reform at the city level can drive improvement. International evidence reinforces this, with the highest-performing education systems relying on centralized authority and consistent leadership. Therefore, expanding mayoral governance in more American cities would align the responsibility with district leadership and create the conditions needed to implement and sustain reform within the schools.
Recommendation #5: Build Accountability Systems
Governance change needs to be paired with systems that track and report outcomes. Any city implementing mayoral control should also adopt clear standards from the start that include annual public reports on student achievement, independent audits of spending, and multiyear education plans that can extend beyond a single administration. This ensures that reforms are measured by their results and that ineffective initiatives are not allowed to remain in place. Building accountability into governance reform would enable other districts to replicate the stability of NYC.
Conclusion
NYC’s educational outcomes and success should serve as the benchmark. The city’s record under mayoral control is stronger than that of board-led peers, resulting in higher graduation rates, narrower achievement gaps, and greater efficiency with system-wide reform. Other districts should recognize that how schools are governed matters. The question is whether a system can sustain reforms long enough to raise student academic proficiency and close educational gaps. While NYC schools have a lot of work to do, returning to boards with high turnover and diffuse accountability would risk undoing the gains of two decades. The U.S. remains an outlier in relying so heavily on elected school boards, despite clear evidence that instability at the top undermines equity and reform.[50] That choice is now on the table in NYC: Democratic nominee Zohran Mamdani has pledged to end mayoral control if elected.[51]
NYC Department of Education schools educate about 900,000 students,[52] making governance the foundation for every reform. Mayoral control has provided the stability to carry initiatives across administrations. Even the best-designed policies cannot succeed without steady and consistent leadership. Preserving mayoral control offers the clearest path forward. The test of governance should be simple: Are more students learning? For NYC, the next phase of progress will depend on whether the city preserves the stability that has allowed its schools to move forward.
Endnotes
Photo: JGI/Jamie Grill / Tetra images via Getty Images
Are you interested in supporting the Manhattan Institute’s public-interest research and journalism? As a 501(c)(3) nonprofit, donations in support of MI and its scholars’ work are fully tax-deductible as provided by law (EIN #13-2912529).