Taxes Exceed Welfare Benefits for Most Poor Workers

Photo: Douglas Sacha / Moment via Getty Images
Introduction
The American welfare state provides substantial cash benefits in several forms, but for the vast majority of low-income working households, these benefits are typically outweighed by the taxes they owe.
This is due to the cost of funding comprehensive support for nonworkers and the desire to avoid increasing that expense by disincentivizing work. It is particularly true over periods of several years because low-income households’ eligibility for benefits declines—and their tax burdens increase—as their incomes fluctuate.
This new longitudinal analysis of family finances finds that, from 2008 to 2018, 99.9% of unemployment-insurance benefits, 99.9% of food stamps, and 94.4% of family benefits (refundable Earned Income and Additional Child Tax Credits) went to beneficiaries who paid more in federal income and payroll taxes than they received from those benefits.
Rather than trying to assist low-income workers by further expanding public expenditures, policymakers should instead focus on reducing their taxes.
Avoiding Redistributive Leakage
Entitlement programs are designed to improve social welfare by redistributing resources from people with an abundance of funds to those who cannot finance their basic needs. But this redistribution also has negative effects.
Simply providing money to all people with low earnings might deter them from providing for themselves through private earnings. This effect is amplified by the need to fund benefits by increasing taxes on incomes. Such redistributive arrangements do not just deter employment but might also encourage consumption at the expense of savings, displace the private responsibility to provide for economic risks, or lead households to break up or forgo marriage for the sake of claiming public assistance.[1]
Redistributive programs operate with imperfect accuracy. Taxes frequently burden families that are themselves experiencing genuine hardship, while benefits often go to those who can provide for themselves. These problems are exacerbated by the desire of households to reduce their tax exposure or increase their benefit eligibility—either through lawful economic choices or by not fully declaring private earnings.
The redistributive process has thus been compared to transferring water with a leaky bucket. The more redistribution that is undertaken, the more attempts to qualify for benefits and avoid taxes will distort economic activities and the more the intended effects of redistribution will be offset by unintended leakage.[2] Because citizens’ willingness to aid those in need is limited, it is preferable to develop assistance programs that do not increase public spending and taxation.
When the government taxes people—only to give them back cash benefits—there may be leakage from redistribution that benefits no one. Retiree benefits, such as Social Security, are deliberately designed to redistribute from earlier to later in the life cycle. But within a single year, entitlement recipients themselves often also bear substantial tax burdens.“Surprisingly,” a Manhattan Institute report by Judge Glock notes, the overlap of taxes and welfare “represent[s] an even larger share of welfare spending when one focuses on those households that rely more on means-tested programs, where the explicit goal is redistribution.”[3]
Over a multiyear time horizon, there is even greater overlap of taxes and benefits due to the fluctuation of incomes. For instance, those eligible for unemployment benefits will have previously paid substantial payroll taxes—the bulk of which are associated with retirement rather than unemployment benefits. This is also true for most beneficiaries of the Earned Income Tax Credit (EITC) or Additional Child Tax Credit (ACTC; the refundable portion of the CTC), which does not account for payroll or other federal taxes paid in previous years.
The net benefit achieved by aiding people in times of need can therefore potentially be achieved, without any redistributive leakage costs, by structuring entitlements as reductions to taxes owed over a multiyear horizon—specifically, by returning taxes paid in previous years as credits. Assistance distributed in this way would not disincentivize work, savings, cohabitation with a spouse, or on-the-books compensation because it would reduce the implicit tax on these activities.
Credits for activities undertaken in previous years are common in corporate income taxation (e.g., with tax incentives for research and development) but not in the personal income tax code.[4] For households, multiyear credits would be most effective as a method of assisting working-age families with temporary needs, such as those associated with unemployment or parenthood. Because of the magnitude of federal assistance for the elderly, workers are typically subject to substantial payroll taxation, while being entitled only to modest cash benefits for short periods.[5]
Tax reductions are unlikely to be preferable to benefits for those permanently unable to work, such as the elderly or disabled Social Security or Supplemental Security Income beneficiaries. Nor would they cover the much more substantial in-kind benefits that some individuals may receive from Medicaid or Section 8 housing vouchers. Nonetheless, to the extent that reductions to taxes can be used to directly replace cash benefits, they should be.
Overlapping Taxes and Benefits
Able-bodied working-age Americans seldom receive net cash benefits from the federal government.
In 2012, Republican presidential candidate Mitt Romney provoked much criticism when he was recorded telling a gathering of campaign donors that 47% of the electorate would vote for his opponent “no matter what” because they were “dependent upon government” and “pay no income tax.” The 47% statistic was elsewhere accompanied by the observation that 49% of Americans received federally funded benefits.[6]
But Romney’s claim neglected payroll taxes, which represent the largest source of the federal tax burden on most Americans and the main source of funding for the nation’s most substantial entitlements. It also ignored the fact that most non-taxpayers are retired, and their benefits are often contingent on the contribution of substantial taxes in previous years.[7] Two political scientists noted that 96% of Americans reported receiving federally funded benefits over the course of their lives.[8]
Several studies have attempted to calculate the overall net effect of federal taxes and benefits on Americans within specific years.[9] Other studies of the offsetting effects of taxes on intended redistribution have assessed the overlap of all benefits, including in-kind benefits and benefits for seniors, which account for the bulk of entitlement expenditures.[10]
Other research has examined the net redistributive effect, over the course of lifetimes, of particular social-insurance programs in the U.S., such as Medicare or Social Security.[11] But there has been no research on the multiyear net distributive effect of most cash benefits and transfer programs for working-age households. Assessments of the net redistributive impact of all welfare benefits and taxes over the life cycle have been undertaken in other countries, and they typically find that redistribution has less of a progressive effect when examined over longer time horizons.[12]
This issue brief breaks new ground by focusing on cash-benefit programs for able-bodied working-age adults, where the overlap between benefits and taxes is greatest. It investigates to what extent these benefits could be replaced by reductions to taxes paid over several years.
To assess the possibility of replacing entitlements with tax cuts, it is necessary to examine beneficiaries’ receipt of benefits and payment of taxes across several years with a recurring panel survey of the same respondents.
This analysis uses family data from the University of Michigan’s Panel Study of Income Dynamics.[13] It employs data from 2009, 2011, 2013, 2015, 2017, and 2019 survey waves (all of which ask respondents about the prior year) for households whose head is under 65 in 2018. Observations are weighted according to longitudinal sample weights for the specific year in question, or with 2018 weights if several years are pooled.
Direct federal taxes are defined as the sum of federal income and payroll taxes, excluding the refundable portion of tax credits. Federal taxes paid and refundable tax credits received by households are determined with NBER’s TAXSIM, version 35.[14] The Additional (refundable) Child Tax Credit includes the value of the tax credit net of income-tax liabilities but without subtracting payroll-tax liabilities.
Payroll taxes include employee and employer-side Federal Insurance Contributions Act (FICA) and unemployment taxes (estimated by inferring Federal Unemployment Tax Act [FUTA] liability from FICA payments).[15] The analysis does not include state and local taxes, or the incidence of indirect federal taxes such as corporate income taxes and tariffs, which are passed on to individuals. Nor does it attempt to attribute the burden of financing the national debt, to which expenditures contribute.
This report analyzes the following welfare programs:
- Unemployment compensation is a joint state-federal cash benefit paid to workers who previously contributed payroll taxes, in proportion to prior contributions, for a limited period of time, following the involuntary loss of employment.[16]
- The Earned Income Tax Credit and Additional Child Tax Credit are cash benefits paid to low-income working households according to their earnings and number of children.[17]
- The Supplemental Nutrition Assistance Program is a benefit paid to low-income households and can be used only to purchase food items.[18]
- Temporary Assistance to Needy Families is a federal grant for states to aid low-income families, which states can distribute as cash or use to fund work-assisting services.
Most in-kind benefits, such as health care, housing, or education, are excluded from the analysis, as they are unlikely to be replaceable by multiyear tax reductions. Social Security, disability insurance, and Supplemental Security Income benefits are similarly not studied, since their beneficiaries are supposed to be permanently unable to work.
Table 1
Share of Households Under-65 Receiving Benefits
| 2010 | 2018 | 2008–18 | |
| Unemployment Compensation (UC) | 12.6% | 3.4% | 26.1% |
| Additional (refundable) Child Tax Credit (ACTC) | 10.9% | 7.3% | 19.3% |
| Earned Income Tax Credit (EITC) | 19.4% | 14.7% | 33.4% |
| SNAP (food stamps) | 13.2% | 8.8% | 23.4% |
| Temporary Assistance for Needy Families (TANF) | 1.0% | 0.2% | 2.6% |
| UC and ACTC | 2.1% | 0.4% | 6.8% |
| UC, ACTC, and EITC | 2.0% | 0.2% | 6.3% |
| ACTC and EITC | 10.2% | 5.3% | 17.9% |
| ACTC, EITC, and TANF | 0.7% | 0.1% | 1.9% |
| ACTC, EITC, TANF, and SNAP | 0.6% | 0.1% | 1.9% |
Source: Panel Study of Income Dynamics (PSID) and TAXSIM, analyzed by author
The portion of Americans receiving every kind of cash benefit studied was higher in 2010 than in 2018 because of the recession (Table 1). As a mathematical necessity, a larger share of the population will receive benefits in at least one of the six waves analyzed, rather than in any particular year studied.
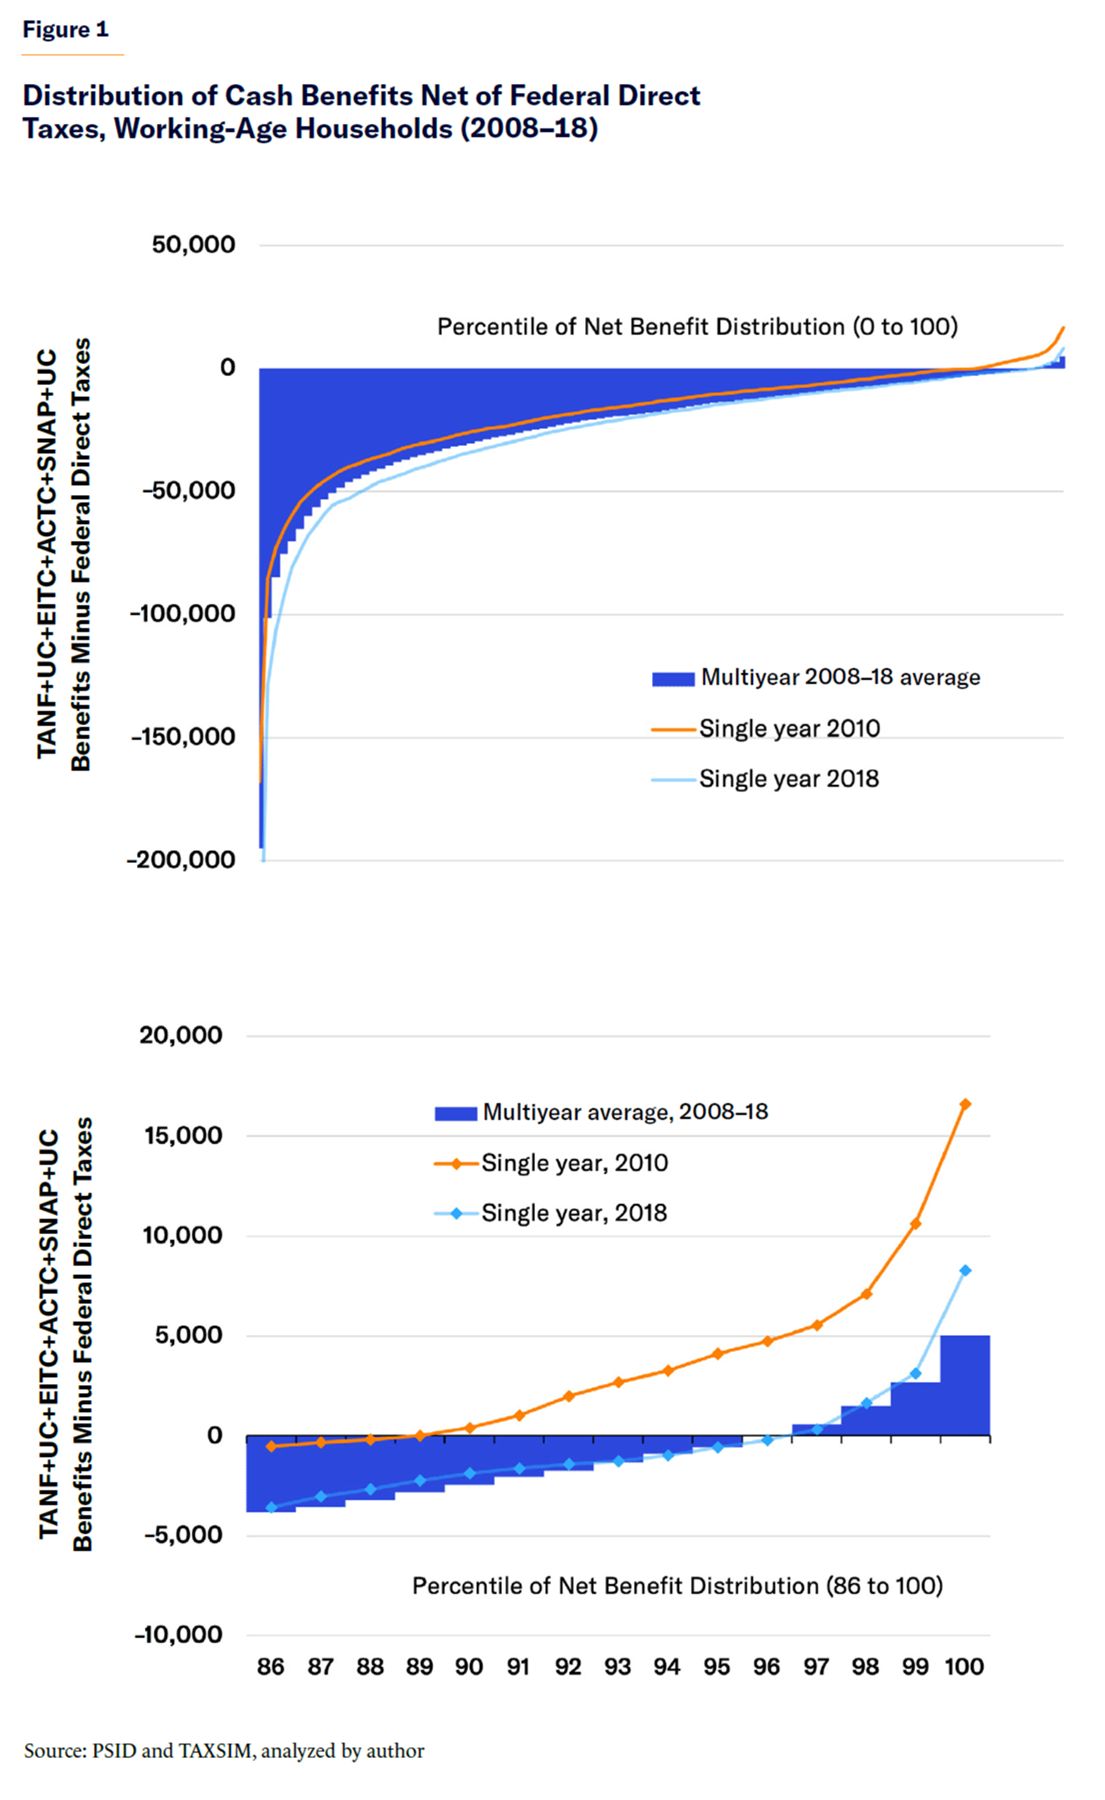
Due to fluctuations in income levels, many more Americans are net taxpayers when cash benefits and taxes are considered over a 10-year horizon. From 2008 to 2018, 96% of working-age households paid more in federal direct taxes than the cash benefits they received from these programs. The same share (96%) paid more in taxes in the strong economic year of 2018, substantially above the 89% share in 2010. Those with the highest percentile of net benefits received $16,595 in net benefits in 2010 and $8,276 in 2018, but in 2008–18, this group received an average benefit of only $5,027 per year (Figure 1).
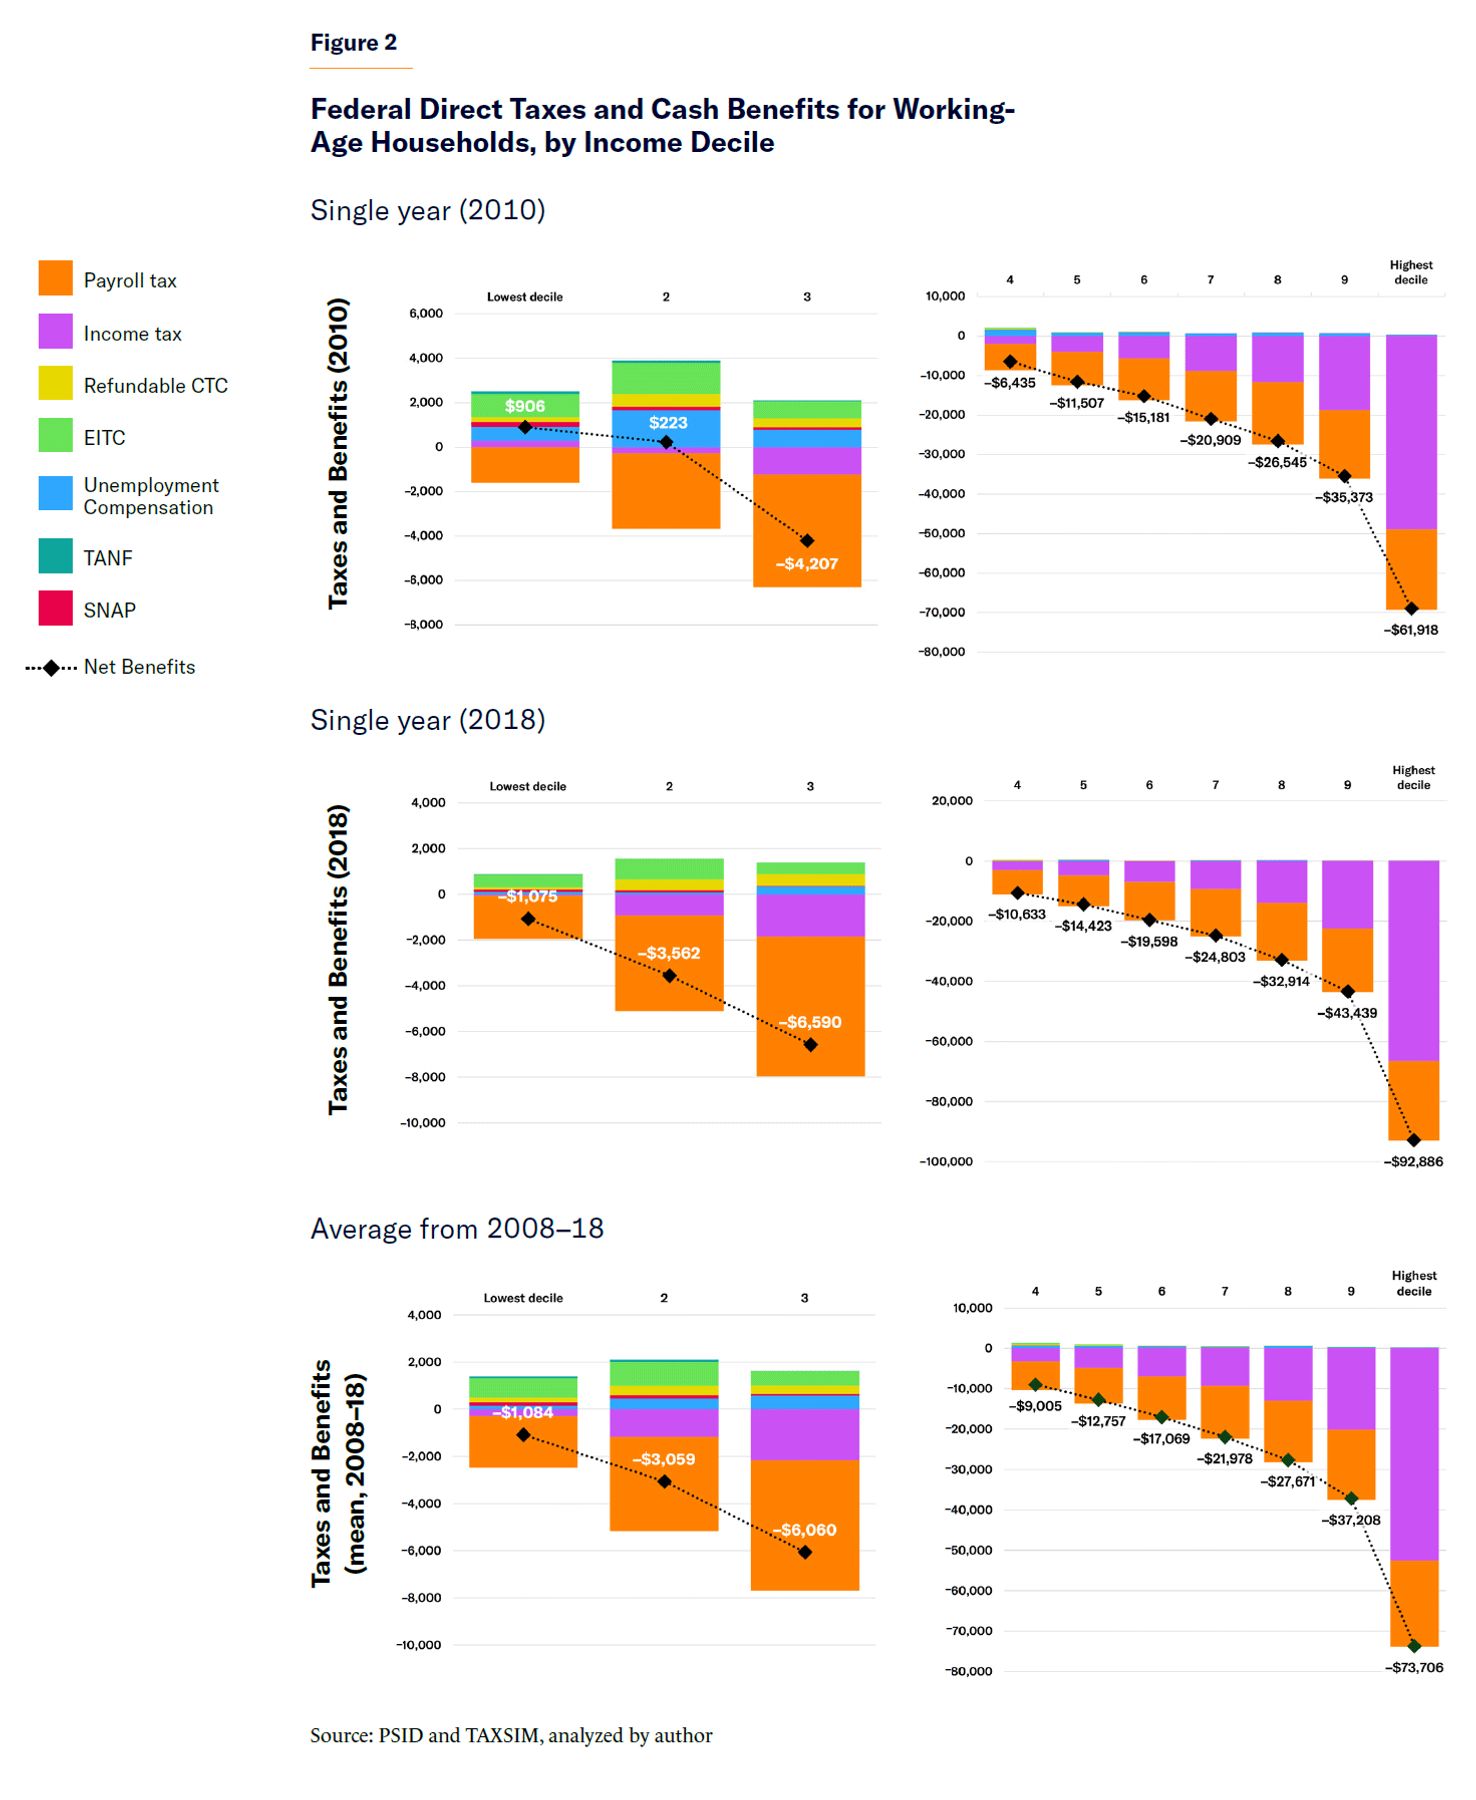
In 2010, in the aftermath of the subprime recession, the bottom two income deciles of working-age households were net beneficiaries due to these federal cash transfers. But in the stronger economic year of 2018, as well as across all of 2008–18, all 10 income deciles, on average, paid taxes that exceeded the cash benefits that they received (Figure 2). Across the decade as a whole, ACTC and EITC family benefits accounted for the largest share of benefits received by low-income households; but in 2010, income from unemployment benefits was also substantial.
Considering each type of benefit separately, most cash benefits received by working households are exceeded by the federal taxes that beneficiaries owe in that same year—even in a bad economic year. During 2008–18, there is almost no single federal cash benefit for working-age families that is not exceeded by the direct taxes owed by its beneficiaries (Table 2).
It is only when several cash benefits are considered together that most beneficiaries receive more in any particular year than they pay in taxes. But this is still not the case over the course of a decade. During 2008–18, over 75% of combined ACTC, EITC, TANF, and SNAP benefits are covered by taxes paid by beneficiaries who receive all four of them.
Table 2
Share of Benefit Spending on Under-65s, Covered by Households’ Own Federal Direct Taxes
| 2010 | 2018 | 2008–18 | |
| Unemployment Compensation (UC) | 82.3% | 94.6% | 99.9% |
| Additional (refundable) Child Tax Credit (ACTC) | 100.0% | 100.0% | 100.0% |
| Earned Income Tax Credit (EITC) | 87.1% | 96.1% | 98.6% |
| SNAP (food stamps) | 96.6% | 98.2% | 99.9% |
| Temporary Assistance for Needy Families (TANF) | 75.0% | 88.6% | 99.4% |
| UC and ACTC | 55.9% | 71.1% | 99.0% |
| UC, ACTC, and EITC | 38.6% | 57.5% | 93.7% |
| ACTC and EITC | 65.9% | 78.3% | 94.4% |
| ACTC, EITC, and TANF | 30.2% | 43.4% | 77.6% |
| ACTC, EITC, TANF, and SNAP | 26.3% | 41.9% | 75.2% |
Source: PSID and TAXSIM, analyzed by author
Reducing the Tax Burden
Given that benefits received by low-income working families are typically exceeded by the taxes they pay over several years, policymakers should focus on turning these programs into tax reductions.
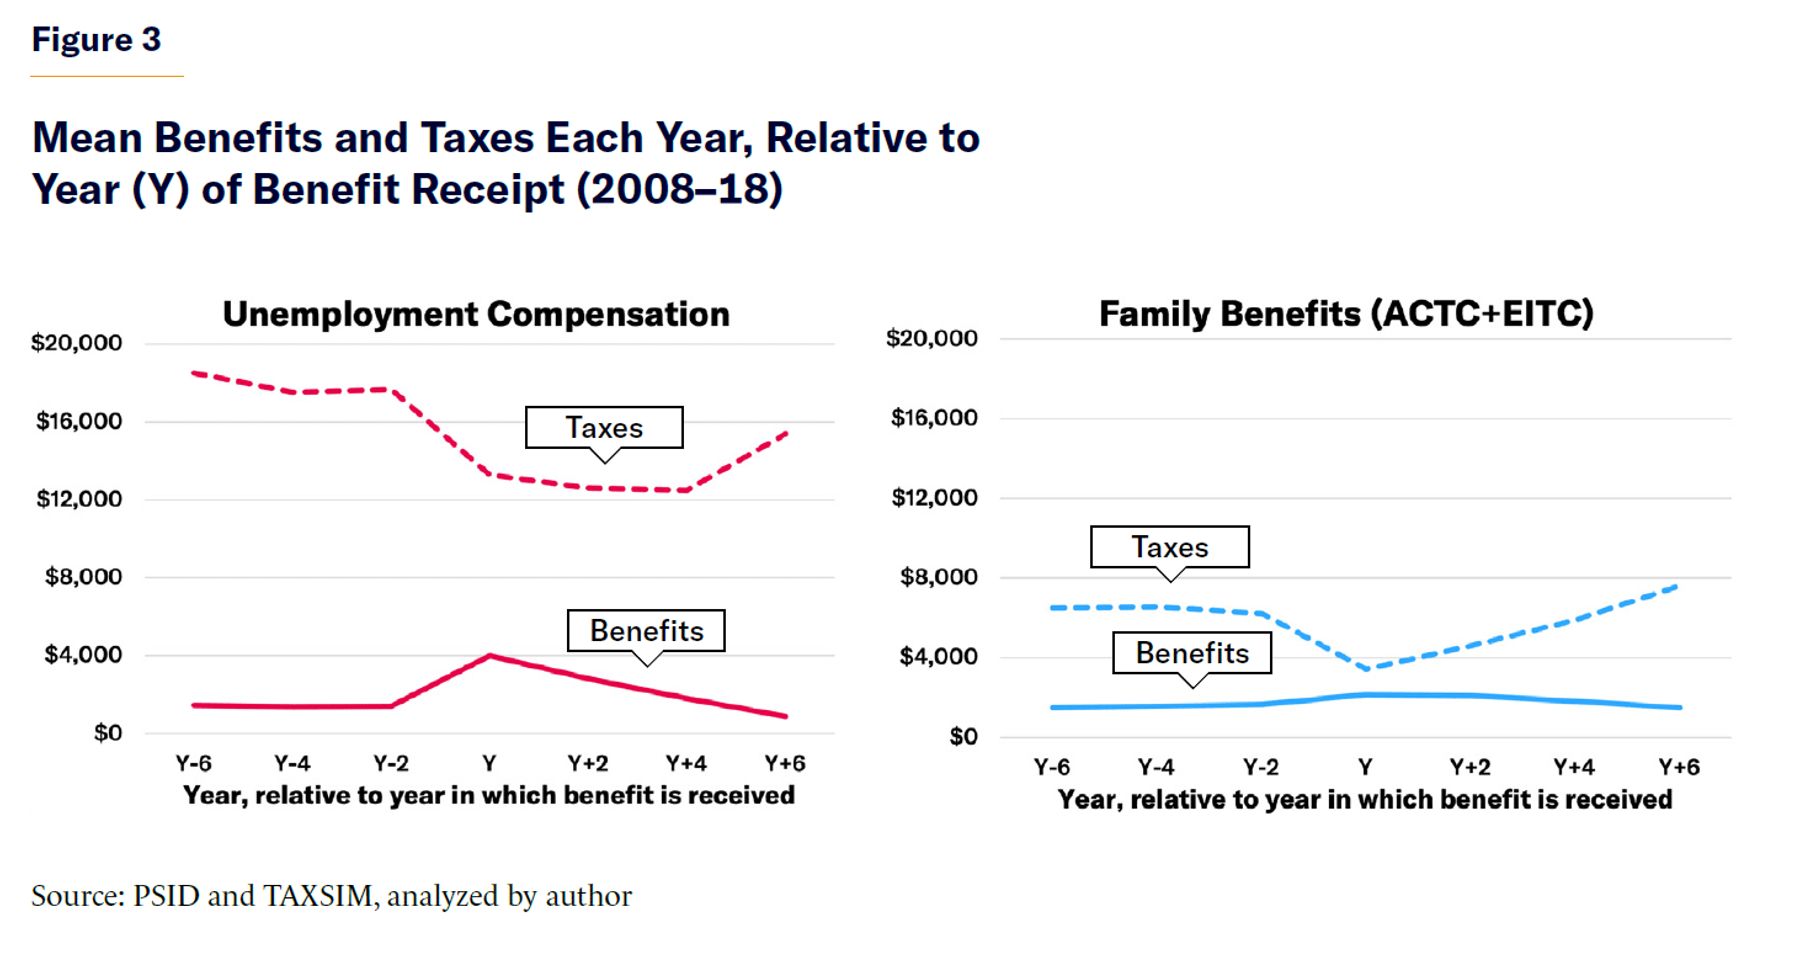
This would largely be possible with family benefits. Because ACTC and EITC phase in with income, they are already limited to those attached to the labor force and likely to have substantial payroll-tax liabilities in other years. For most beneficiaries, ACTC + EITC benefits fluctuate little over the course of a decade, as the number of children in their household changes only slowly. But on average, those beneficiaries pay twice as much in taxes in the years before and after they receive ACTC benefits (Figure 3). That remains true even after ACTC was expanded by the 2017 Tax Cuts and Jobs Act.[19]
Policymakers have already attempted to mitigate the work disincentives of means-tested family benefits by making them contingent on earnings from previous years. ACTC and EITC benefits phase in as incomes increase, and, in the case of natural disasters and Covid-19, beneficiaries were allowed a look-back to count income from previous years toward their tax reductions and credits.[20] This approach can be extended to reduce the leakage associated with intended assistance.
Unemployment compensation could also be restructured as a reduction in tax burden. Those benefits currently go only to recently fired workers who have made prior unemployment-insurance tax contributions, vary according to the magnitude of those contributions, and are limited in duration (typically up to six months). Unemployment benefits are therefore necessarily preceded by substantial payroll-tax contributions and are small relative to tax contributions over several years. The maximum unemployment-insurance benefits to which workers are entitled are generally equivalent to less than two years of their past FICA payroll-tax contributions.[21]
Unemployment insurance is primarily intended to help workers smooth shocks to their earnings. But the connection between prior tax contributions and benefits is clunky, which creates substantial moral hazard—increasing the rate of unemployment and engendering benefit fraud. By directly linking individuals’ unemployment benefits to their own federal direct tax contributions from previous years, it would be possible to increase the availability of assistance while reducing undesired side effects.
In a previous Manhattan Institute report,“Targeted Unemployment Insurance,” I detail how such an arrangement could be structured. That proposal allows workers to temporarily claim back some payroll taxes and to subsequently repay the rebated funds with an additional income tax. Unemployed workers would be entitled to weekly benefits worth 50% of their average weekly income for the two previous tax years, up to $500, for up to six months. Households claiming such benefits would subsequently be subject to an additional 2% income tax until whatever assistance they would have received was paid back.[22]
Unfortunately, some benefits might be harder to restructure as tax reductions, even where taxes exceed the cash payments that individuals receive. For instance, Temporary Assistance for Needy Families (TANF) funding is distributed as a block grant to states. The nature and scale of TANF programs vary greatly between states, and much of the spending goes to services (such as job training or promoting college volleyball stadiums) rather than cash benefits for individuals.[23]
Similarly, although Supplemental Nutrition Assistance Program (SNAP) recipients perceive the benefit as highly fungible and thus a close substitute for cash, the program was originally developed as a method of compensating farmers for agricultural surpluses and continues to fulfill a similar purpose as part of farm-bill legislation. Tax reductions are thus unlikely to be politically acceptable as a replacement for TANF or SNAP benefits, even if they offset the distributive effect on low-income recipients.
Conclusion
Over the course of a few years, almost all federal spending on cash benefits for able-bodied working-age adults goes to those whose direct federal tax liabilities exceed the benefits they receive. Therefore, much of these programs’ spending could be restructured as tax reductions, which would improve the welfare of those in need without deterring work, the reporting of income, or cohabitation with a spouse.
Acknowledgment
Thanks to Thomas Cronin for research assistance with this report.
Endnotes
Photo: Douglas Sacha / Moment via Getty Images
Are you interested in supporting the Manhattan Institute’s public-interest research and journalism? As a 501(c)(3) nonprofit, donations in support of MI and its scholars’ work are fully tax-deductible as provided by law (EIN #13-2912529).