Polling NYC Survey Analysis of 2025 Likely Mayoral Voters on Politics, Crime, Migrants, and Electoral Reform

Photo: LIVINUS/iStock/Getty Images Plus
Between April 8th and 11th of 2024, the Manhattan Institute polled a representative sample of 700 likely voters in New York City’s 2025 mayoral election on their feelings about elected leaders, upcoming political contests, the state of the city, public safety, immigration, and various electoral reform proposals.
The survey was drawn from the New York state voter file and then weighted to match the population in gender, age, college education, partisanship, race, and county. Responses were collected using mixed methods, including live landline calls (20%), live cell calls (30%), and SMS-to-web (50%). The poll’s margin of error is 3.7%.
The results suggest an extremely challenging climate for Mayor Eric Adams. There is broad consensus—across party and demographic lines—among Gotham’s likely electorate that crime persists as a major problem, inflows of migrants are cause for concern, the mayor’s job performance is unsatisfactory, and the city is headed in the wrong direction. New Yorkers say they want political change—not only in terms of individual leaders, but also in the structure of the city’s electoral system.
Full Results Available: Toplines, Crosstabs, Slide Deck
Political Picture
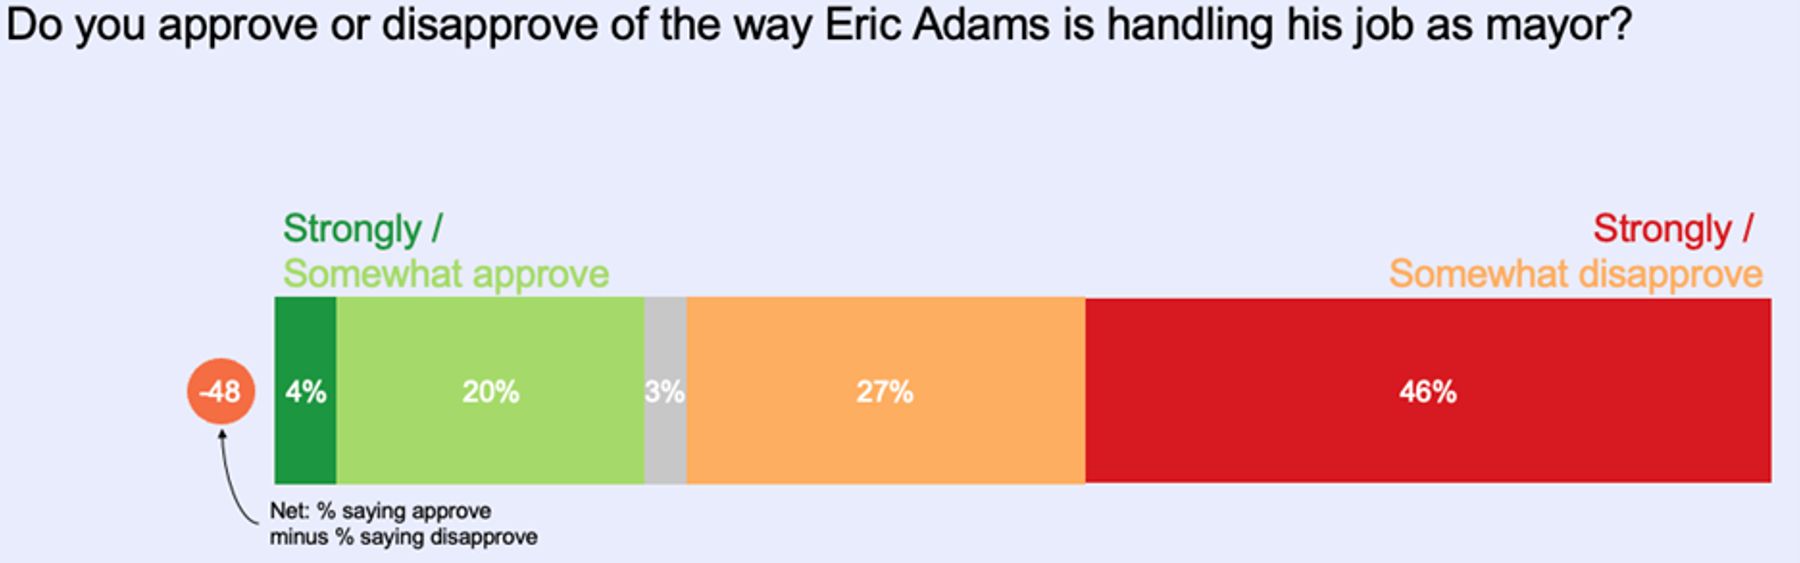
Mayor Eric Adams is in dire political straits. Asked whom they would vote for in the next mayoral election, only 16% of NYC likely voters choose Adams, with two-thirds saying they would vote for someone else (Figure 1). The mayor’s job approval rating is also extremely poor, coming in at 24%. Only 4% of likely voters in the city strongly approve of the mayor’s job performance, while 73% disapprove (Figure 2).
Figure 1
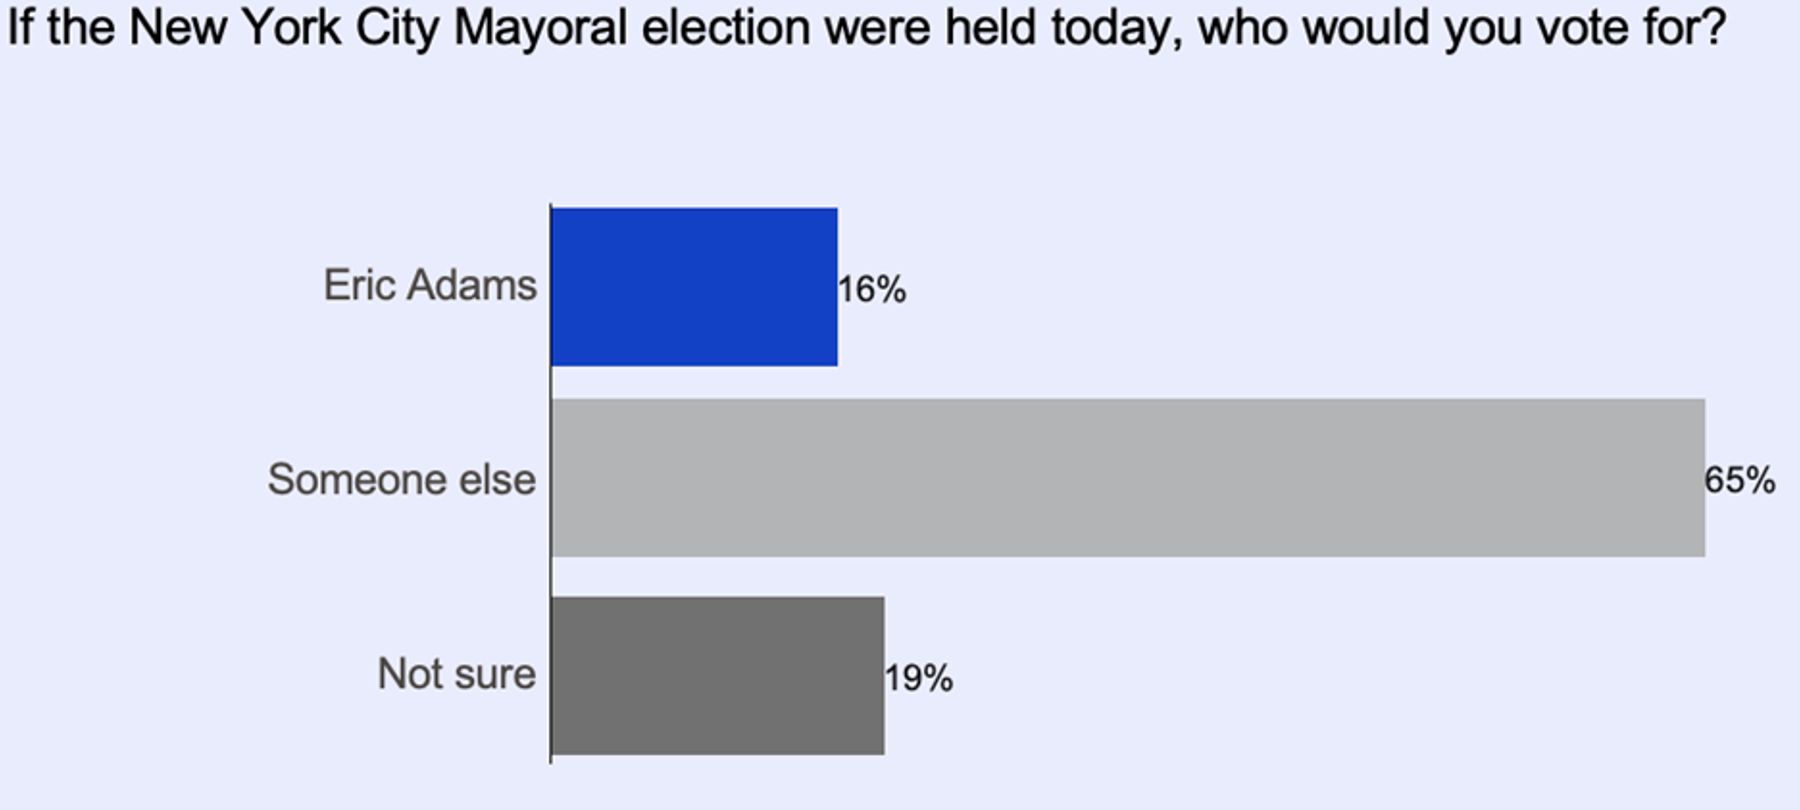
Figure 2
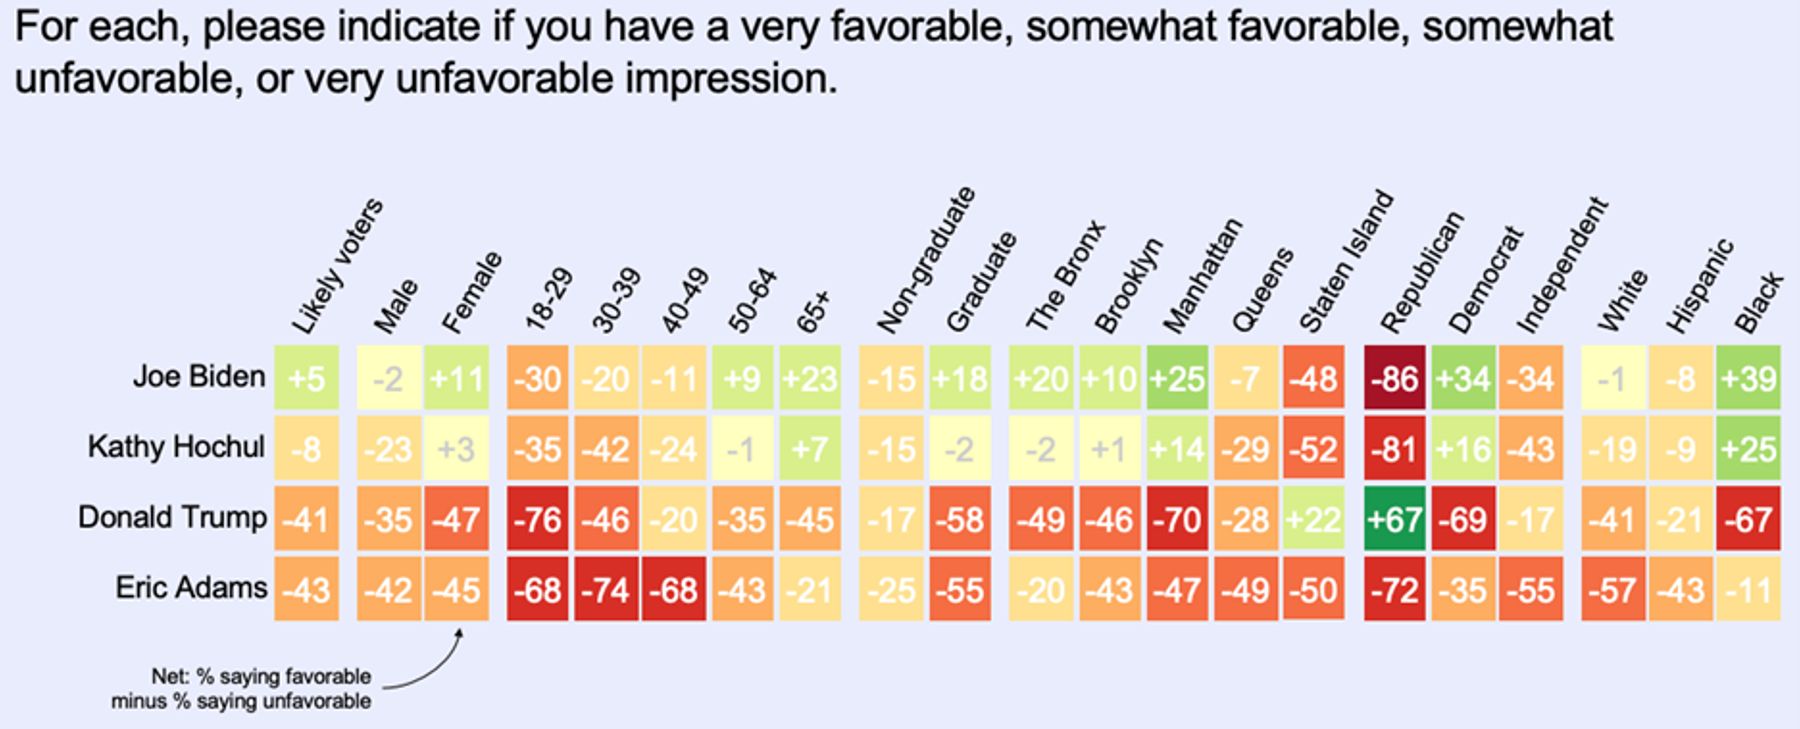
The mayor’s approval numbers are below 20% with independents, at only 30% among Democrats. His approval rating is just 9% with 18–29-year-olds. In all five of the city’s boroughs, likely voters overwhelmingly disapprove of Adams’s job performance. Even in his strongest demographic, black voters, Adams’s approval rating is net negative. Among the New Yorkers who will decide the 2025 NYC mayoral election, Adams is viewed even less favorably than former President Donald Trump (Figure 3).
Figure 3
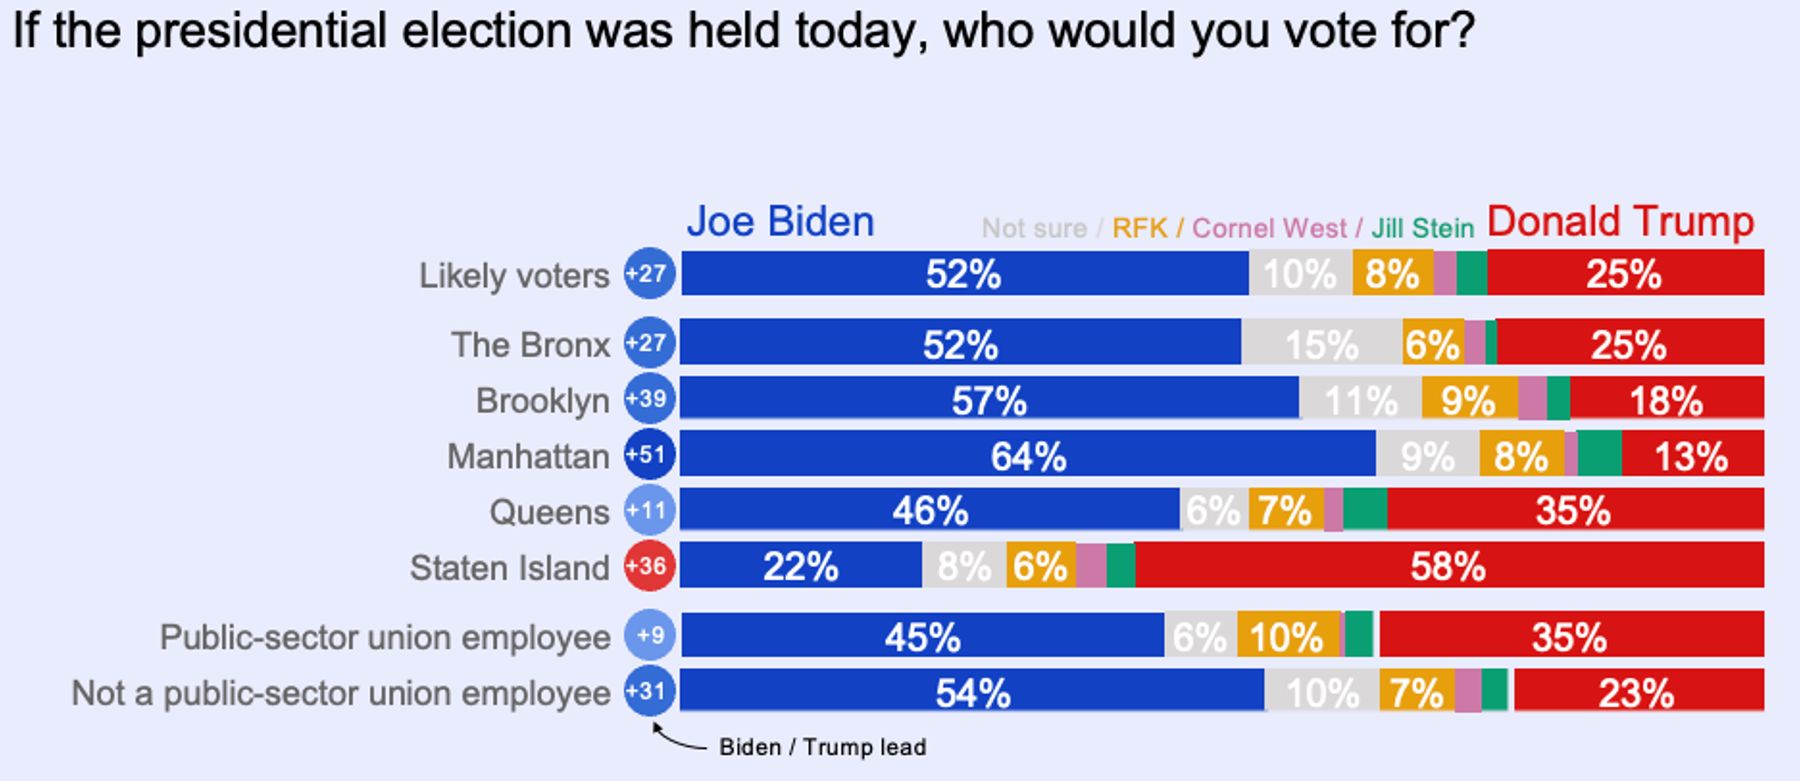
Mayor Adams’s weakness, however, is not the result of a wider abandonment of the Democratic Party in the Big Apple. When asked about the 2024 presidential election, President Biden holds a comfortable 27-point lead over Trump among respondents—winning majority support in Manhattan, Brooklyn, and the Bronx, plurality support in Queens, and losing to the former president by a wide margin in Staten Island. But in an interesting sign of today’s shifting political coalitions, Trump performs markedly better against Biden among voters who are public-sector union employees than those who are not (Figure 4).
Figure 4
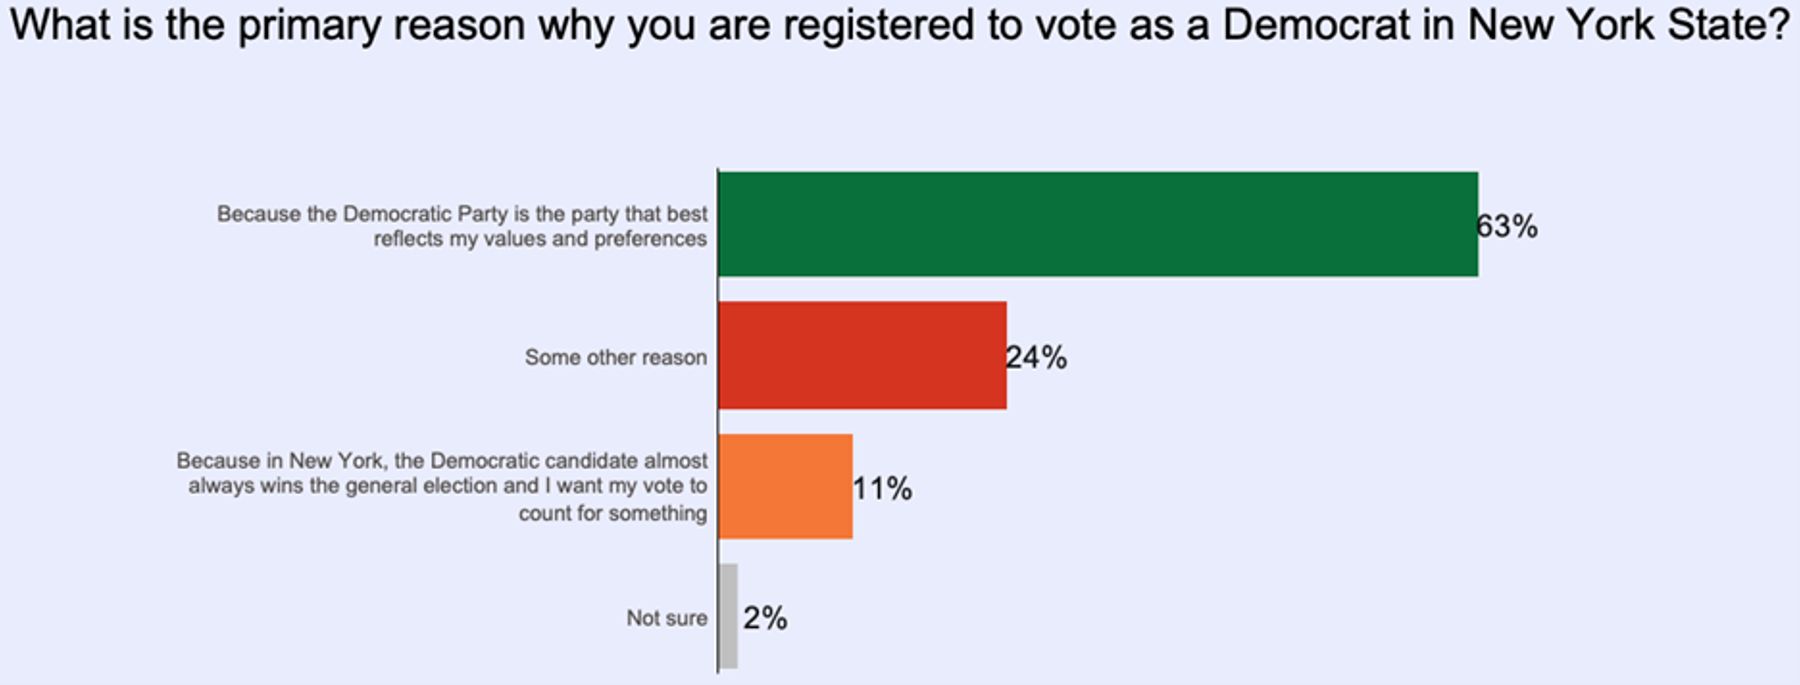
Nonetheless, the city’s Democratic voters seem less satisfied with their party on the whole than do the city’s GOP voters. Only 65% of registered Democrats say they feel that their party represents their values and preferences well, compared to 76% of Republicans. Less than two-thirds of Democrats say they are registered with the party because it is the one that best reflects their values or preferences, with more than a third saying it is because they want their vote to matter or some other reason (Figure 5).
Figure 5
State of the City
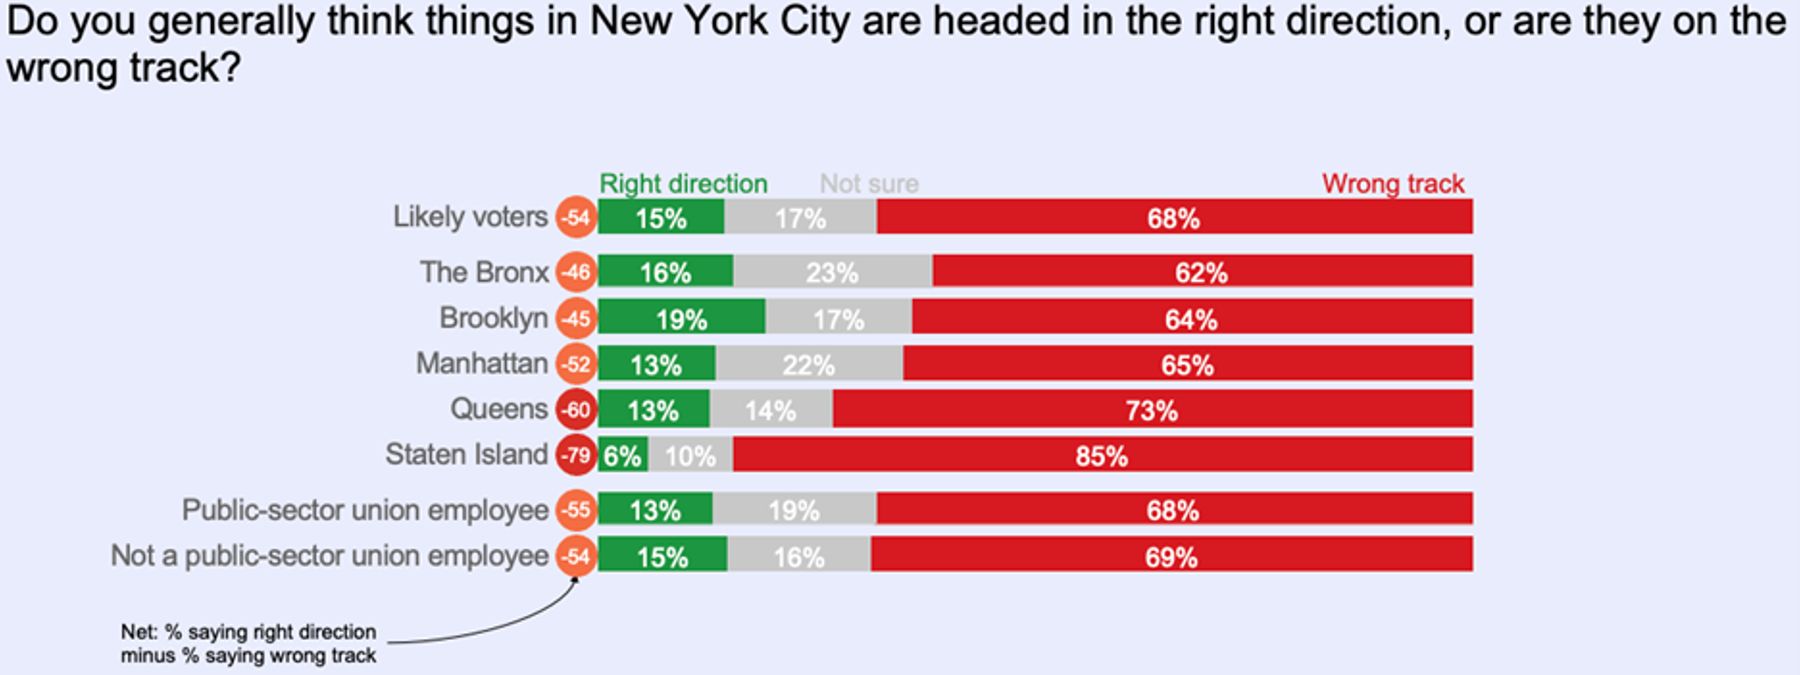
Much of the frustration with Mayor Adams likely stems from the widely held sense that things in New York City are on the wrong track. Almost seven-in-ten (68%) say so, versus just 15% who say things are going in the right direction. The pessimistic view is endorsed by large majorities of voters across all demographics, boroughs, and political parties (Figures 6 and 7).
Figure 6
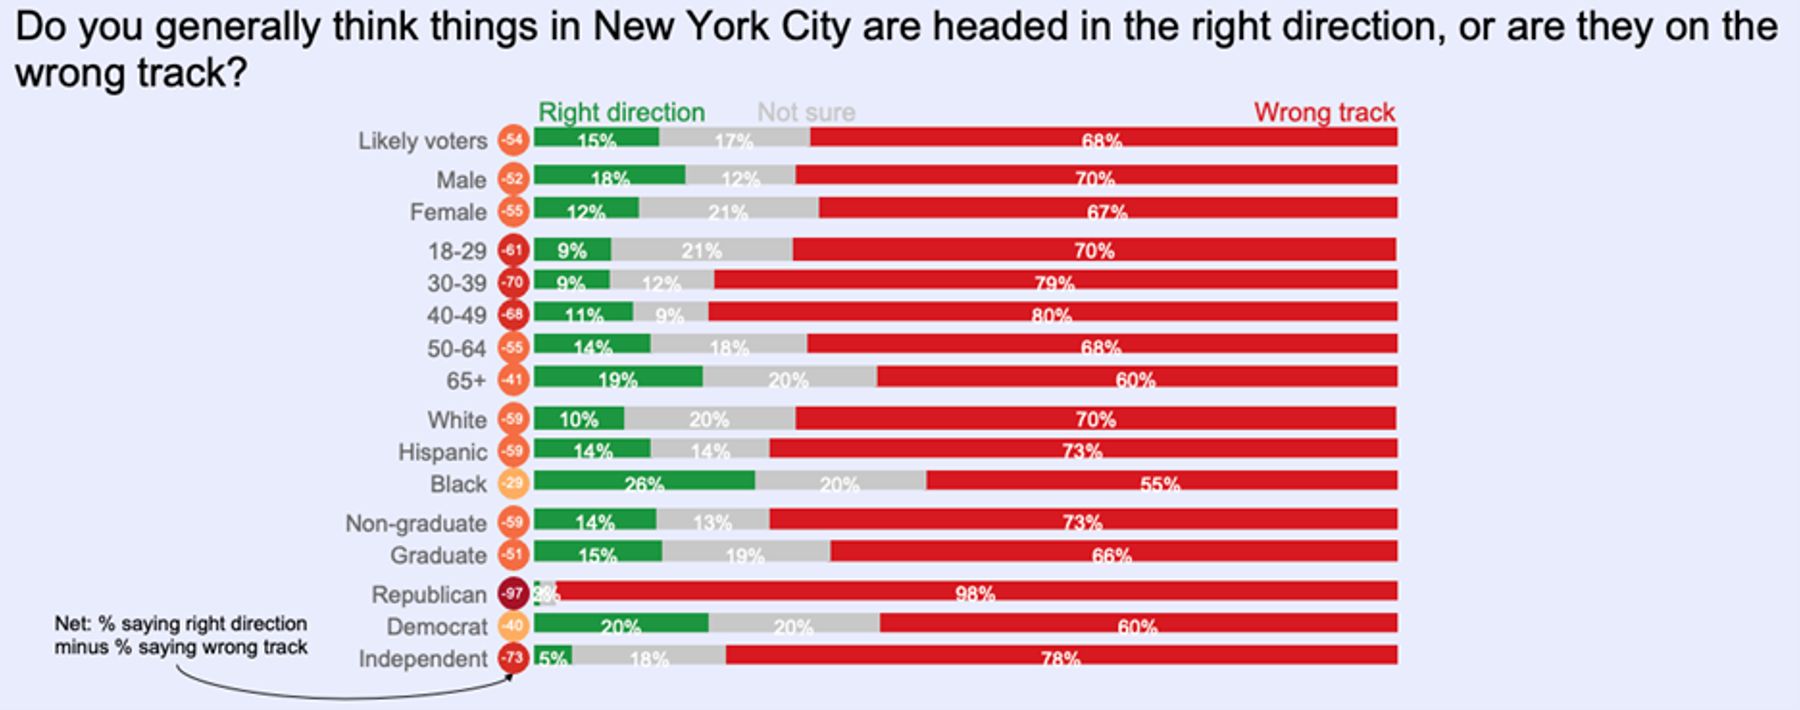
Figure 7
Crime
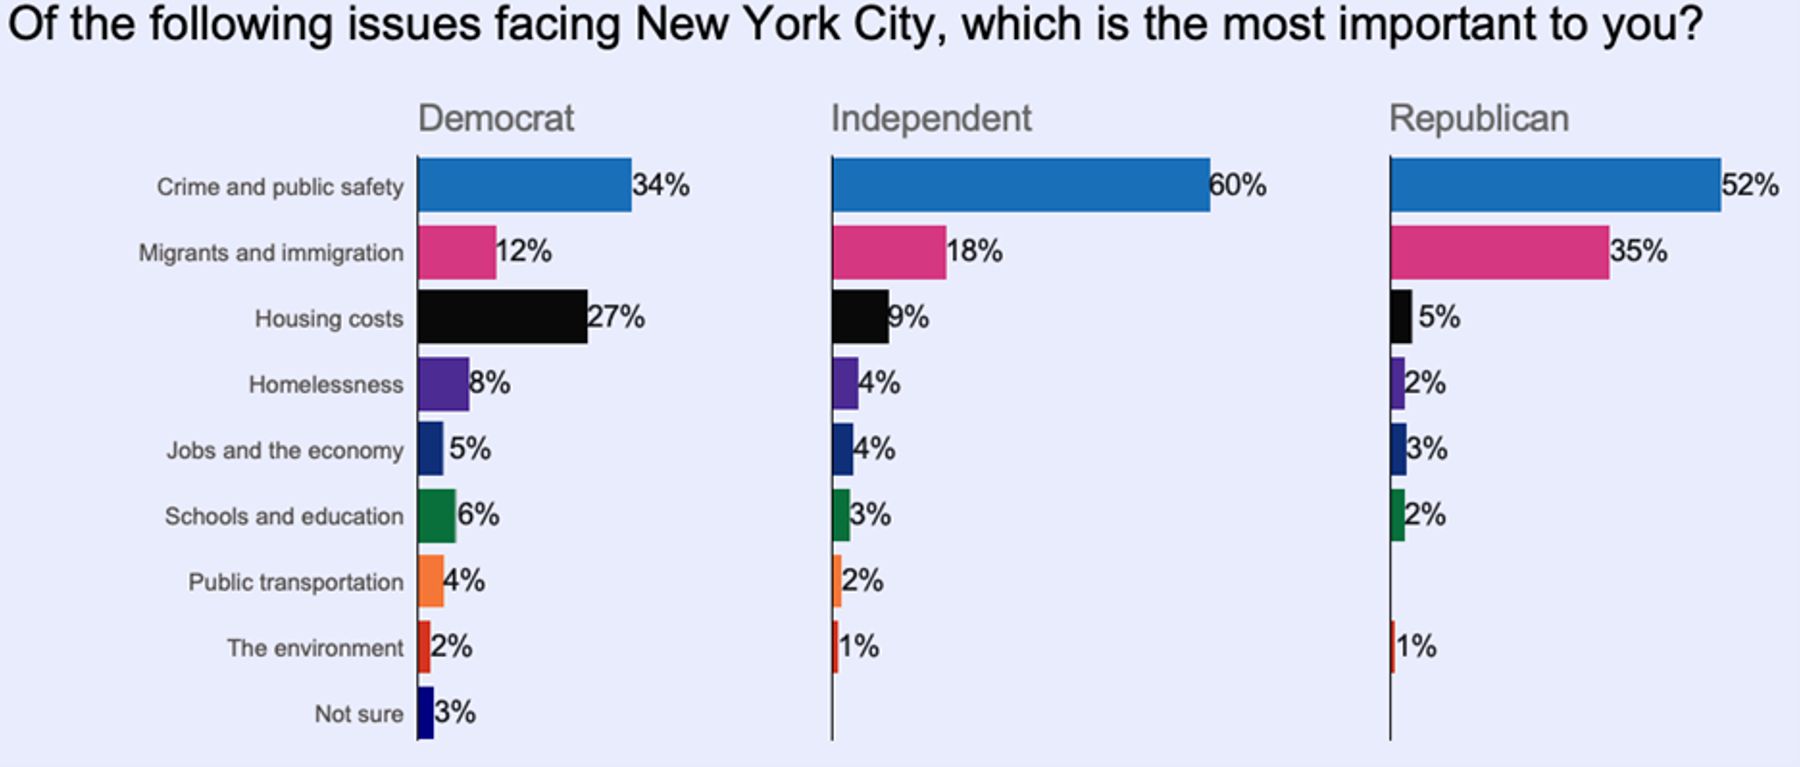
Crime is also a major piece of this puzzle. Public safety is far and away the most important issue to New Yorkers of all political stripes (Figure 8). It was named by 40% of likely voters as their top concern, with housing costs trailing far behind at 22%, and migrants/immigration at 16%.
Figure 8
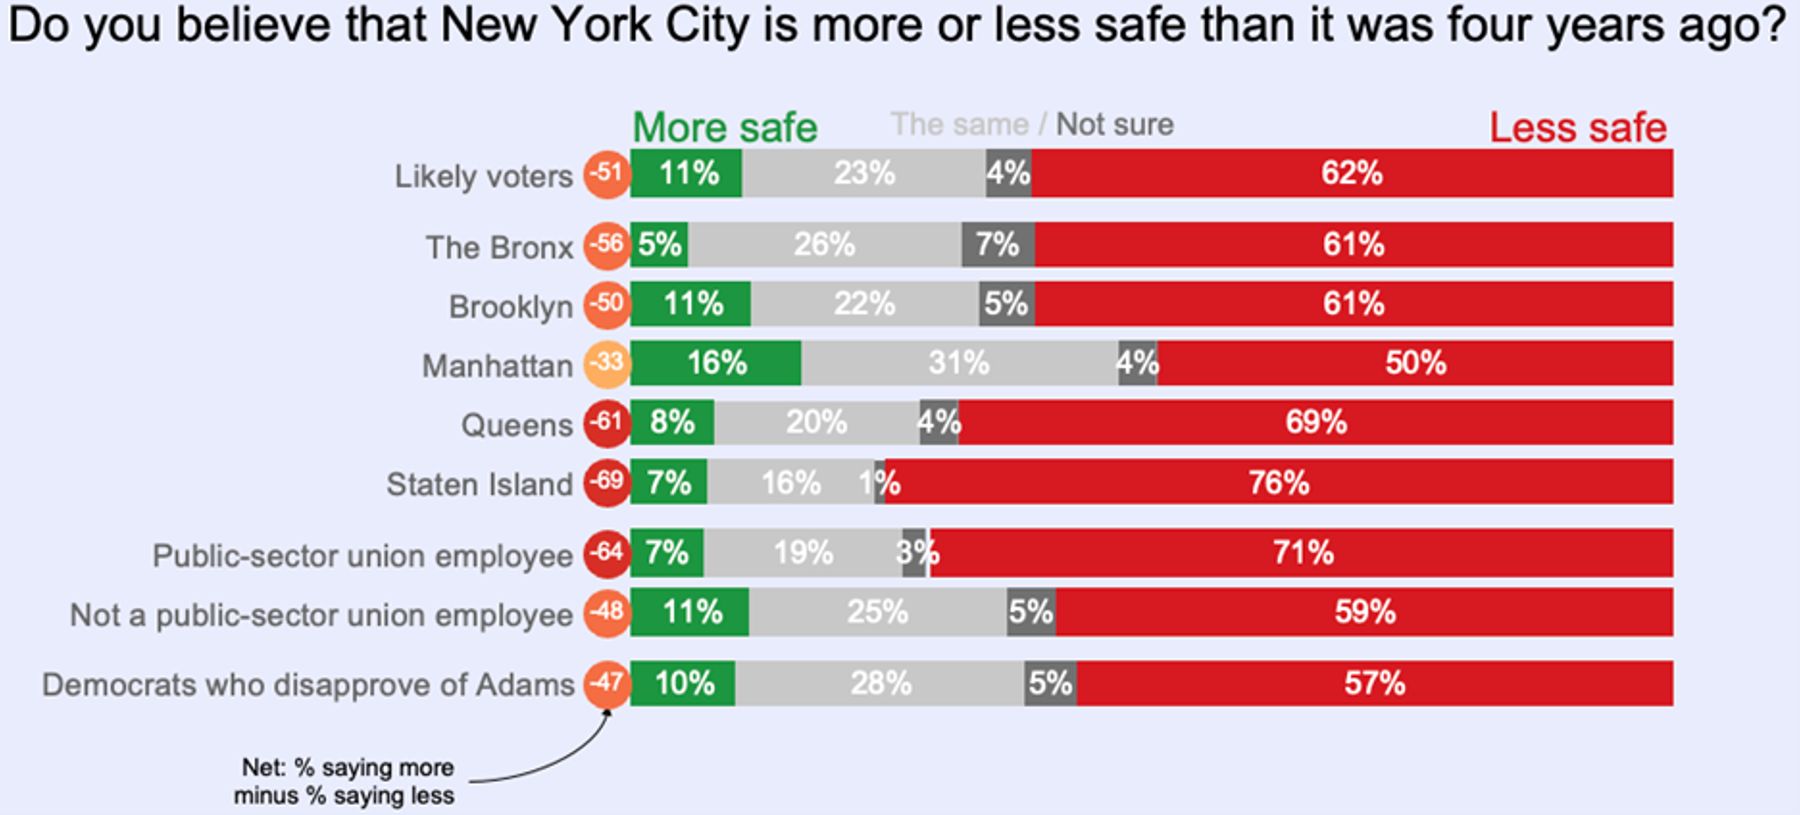
Crime is likely so salient because New Yorkers believe it is worsening: 62% of likely voters—including majorities in all racial groups and political parties—feel that the city is less safe today than it was four years ago. 53% of Democrats say New York has become less safe, as do a majority in every borough. Only 11% say it is safer today (Figures 9 and 10).
Figure 9
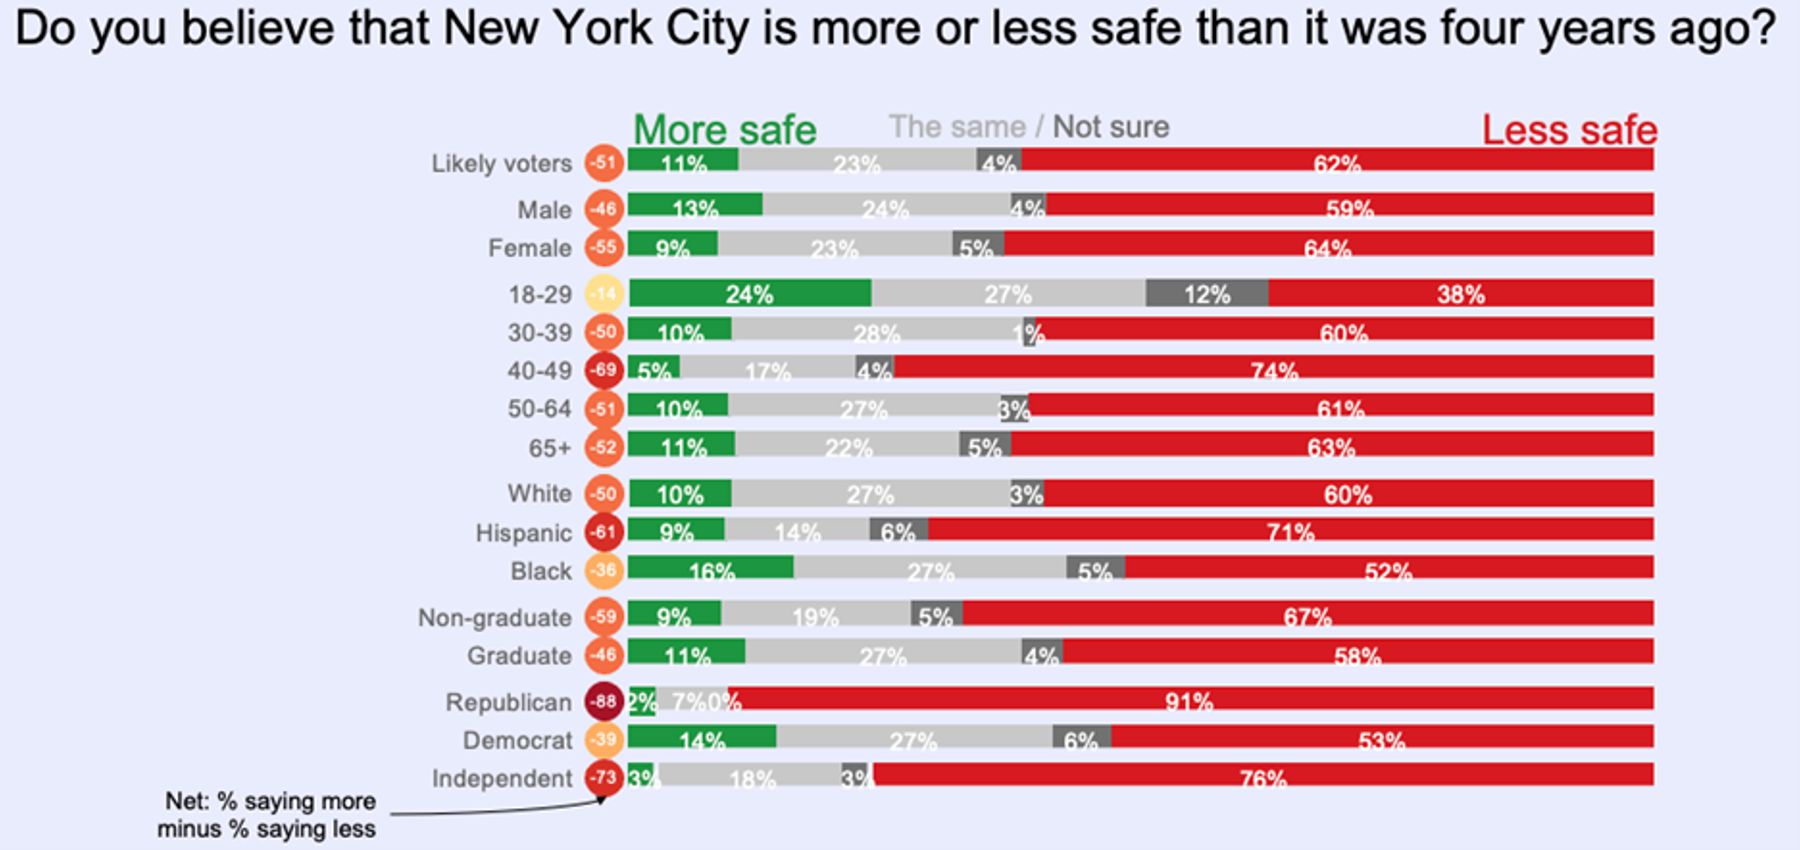
Figure 10
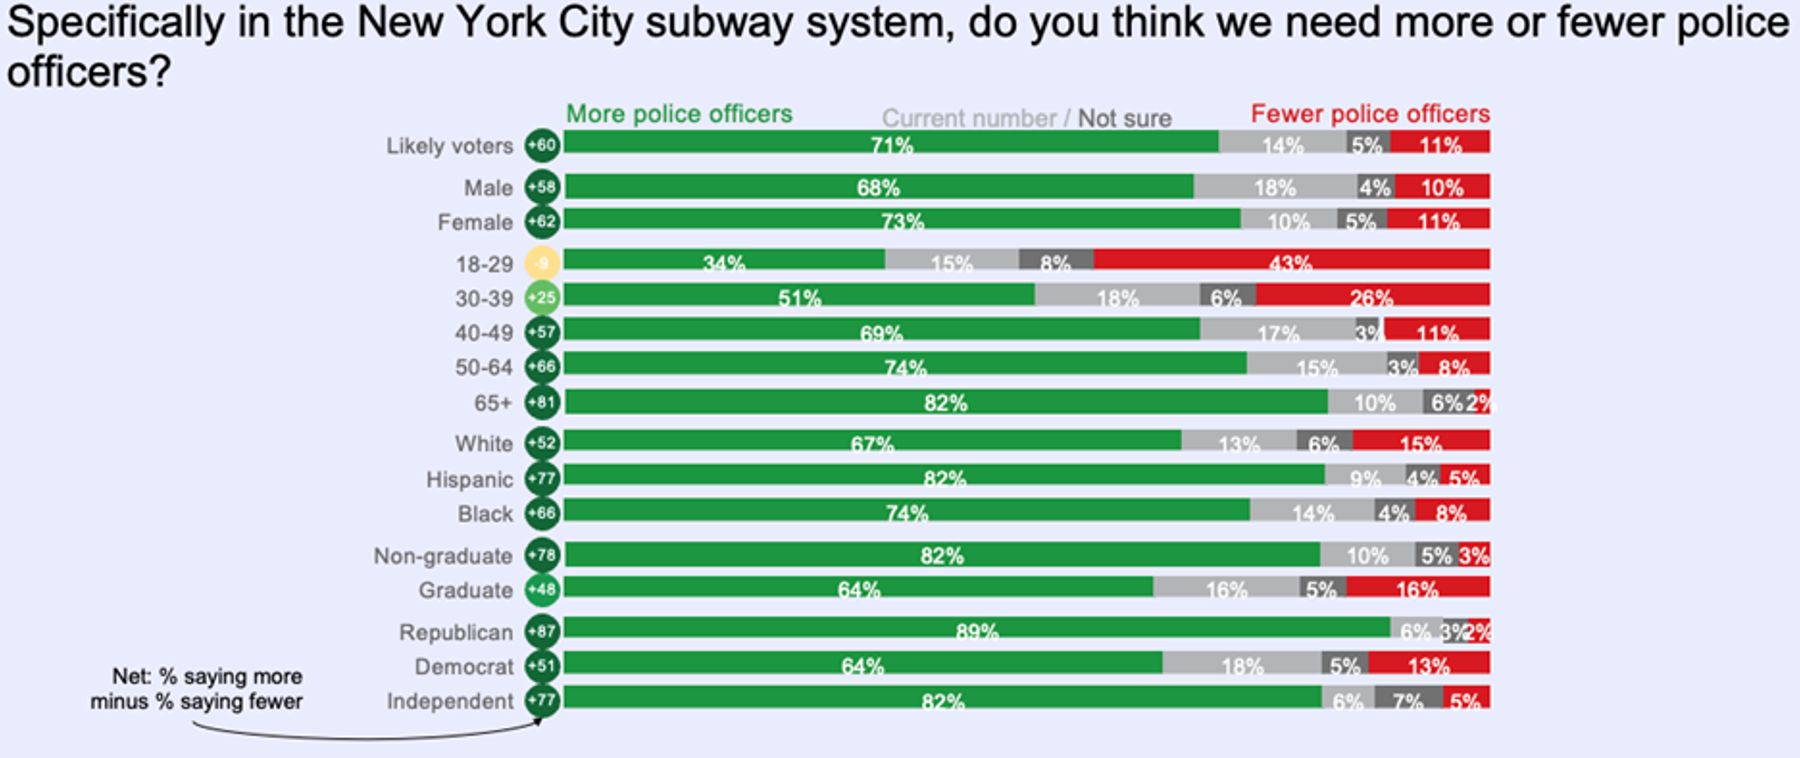
To address the crime problem, New Yorkers broadly support increasing the number of police officers—especially in New York’s subway system. The position is held across all demographics except 18–29-year-olds, a majority of whom think we need fewer police officers across NYC generally and a plurality of whom think we need fewer police officers specifically in the subways (Figures 11 and 12).
Figure 11
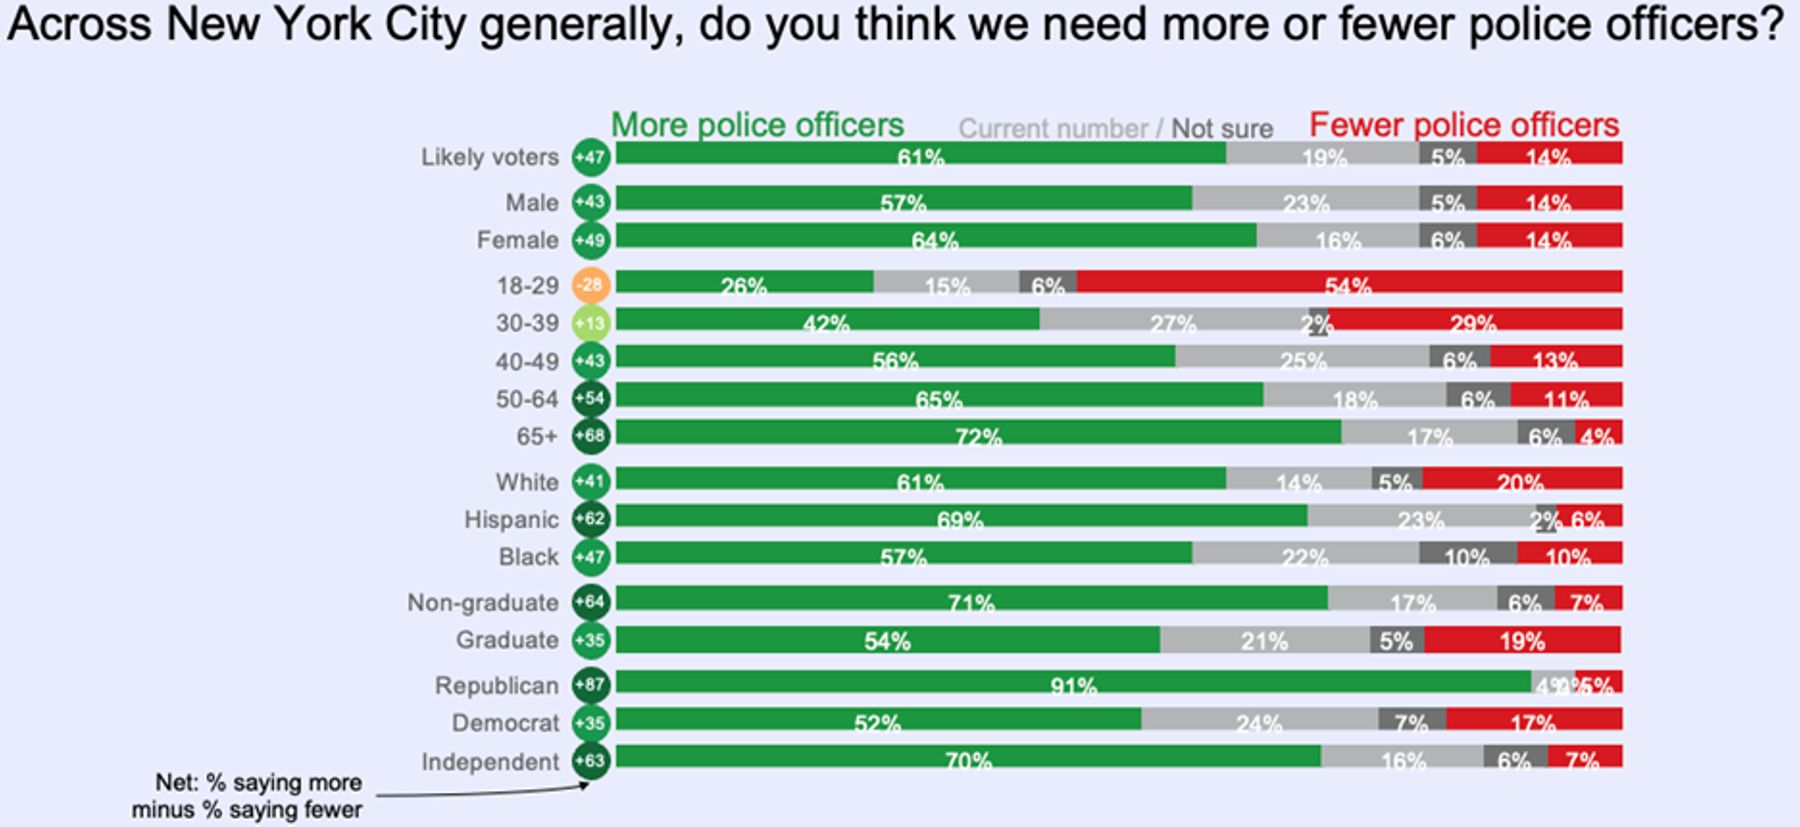
Figure 12
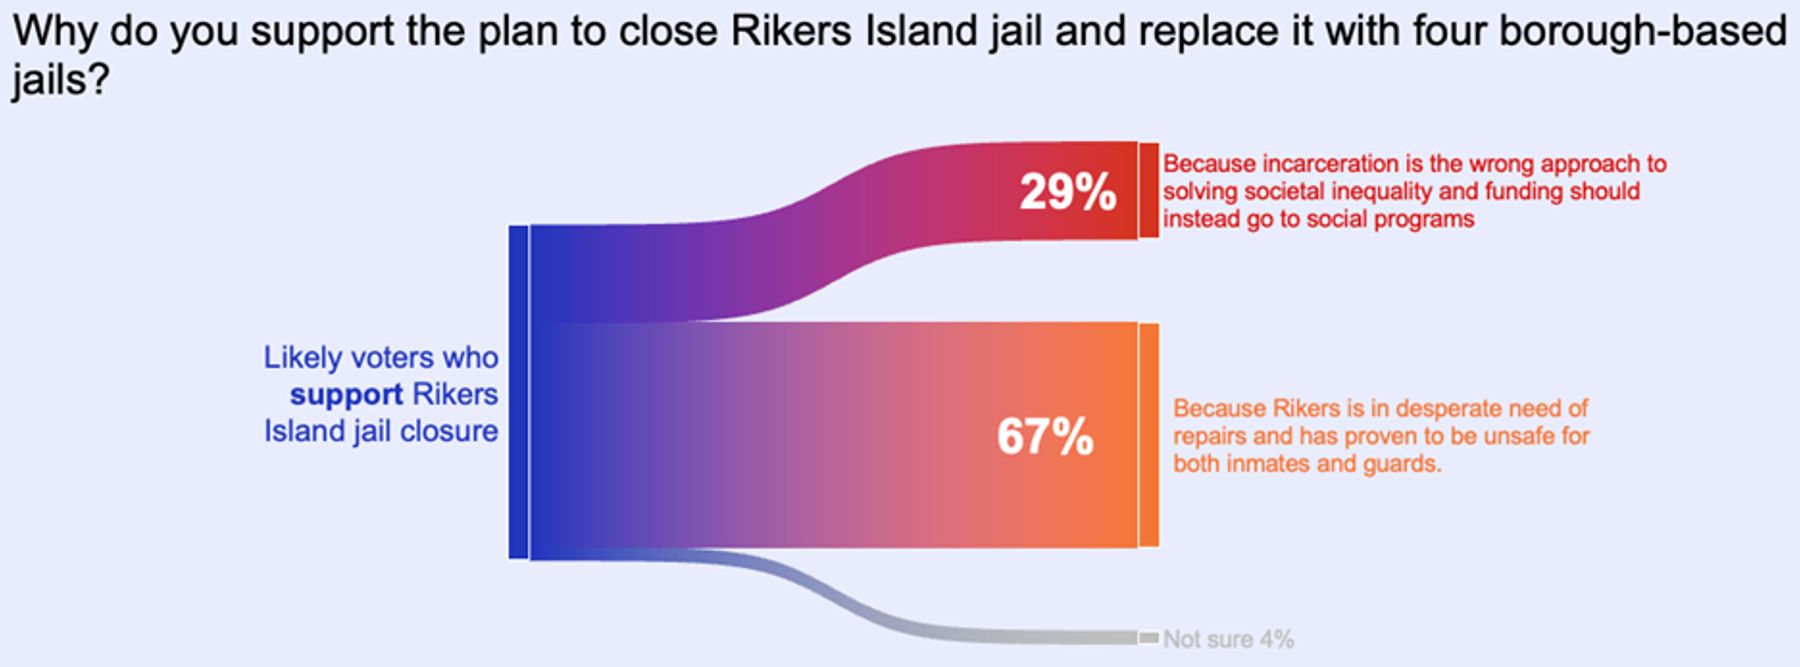
Plans to close Rikers Island are opposed by a majority (53%) of the city’s likely voters, with only one-third in support of closing the jail. Save again for 18–29-year-olds, a plurality across all parties, races, and ages opposes closing Rikers. Bronx and Brooklyn residents are more evenly split on the matter. Those who do support the closure overwhelmingly say it is due to a need for repairs at the jail, rather than because incarceration is wrong and that funding should instead be rerouted to social programs, by a margin of more than two to one (Figure 13).
Figure 13
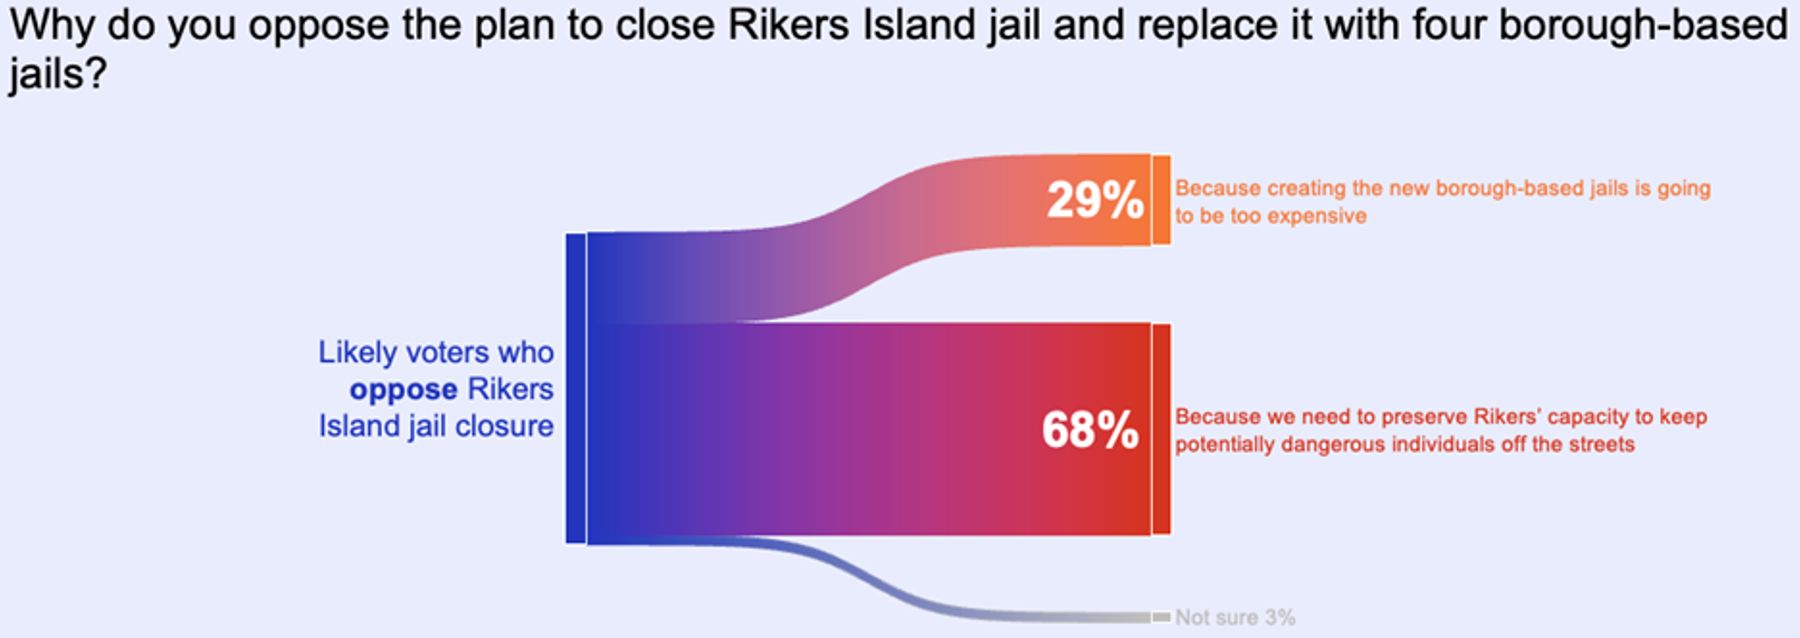
By a similarly wide margin, opponents of closing Rikers say that it is because of a need to preserve the jail’s capacity to keep potentially dangerous individuals off the streets, rather than because of cost concerns around building new borough-based jails (Figure 14).
Figure 14
Migrants
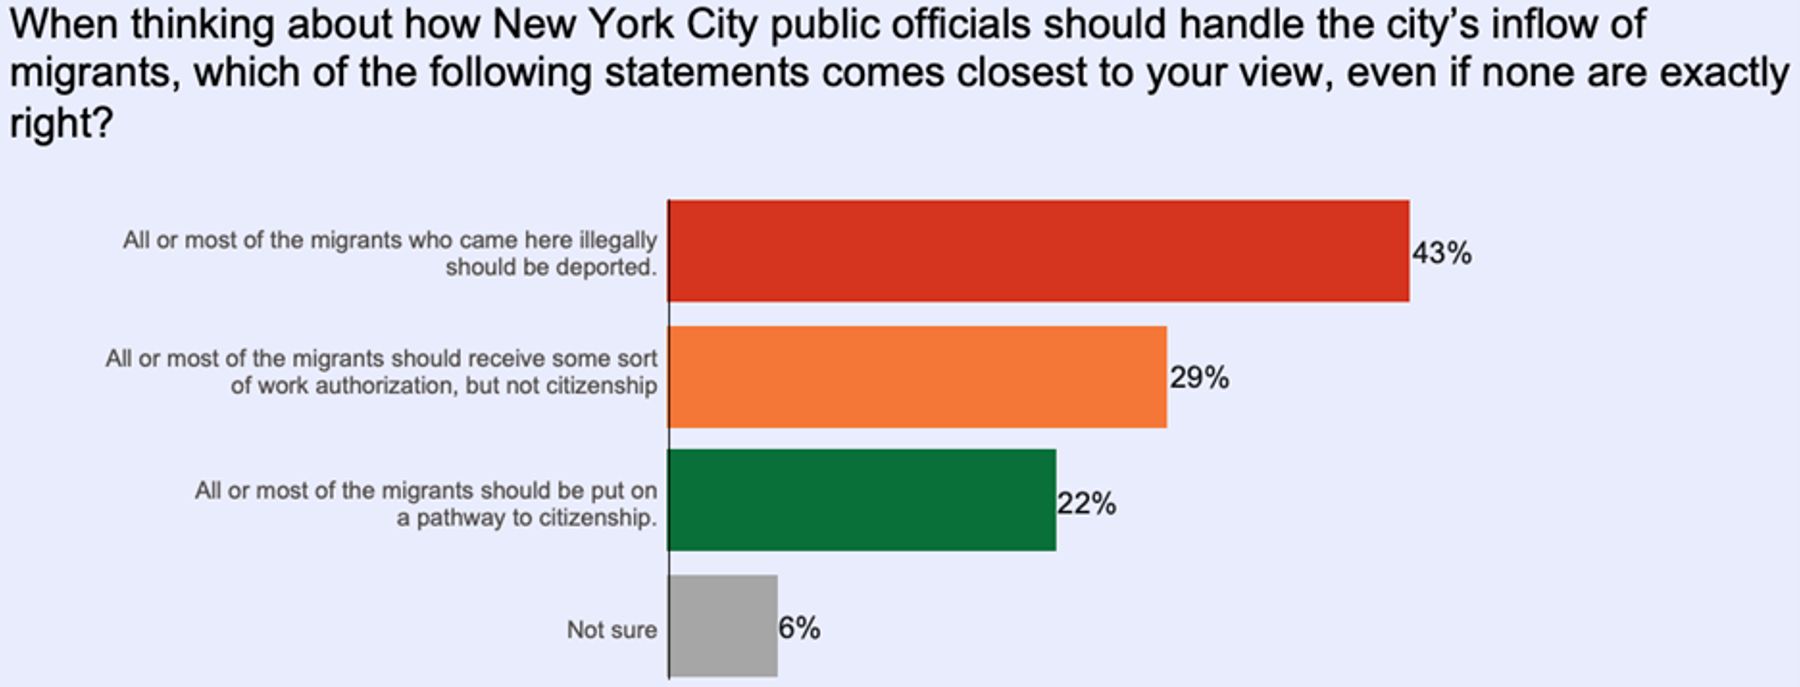
Three-quarters of NYC likely voters—including majorities across all demographic groups and in all boroughs—are concerned about the inflow of migrants to the city over the past two years. Perhaps most strikingly, 80% of first-generation immigrants are concerned about the inflow, as are 75% of second-generation immigrants. The most popular view among likely voters for handling illegal migrants is deportation (backed by 43%), with only one-in-five (22%) saying all or most migrants should be put on a pathway to citizenship (Figure 15).
Figure 15
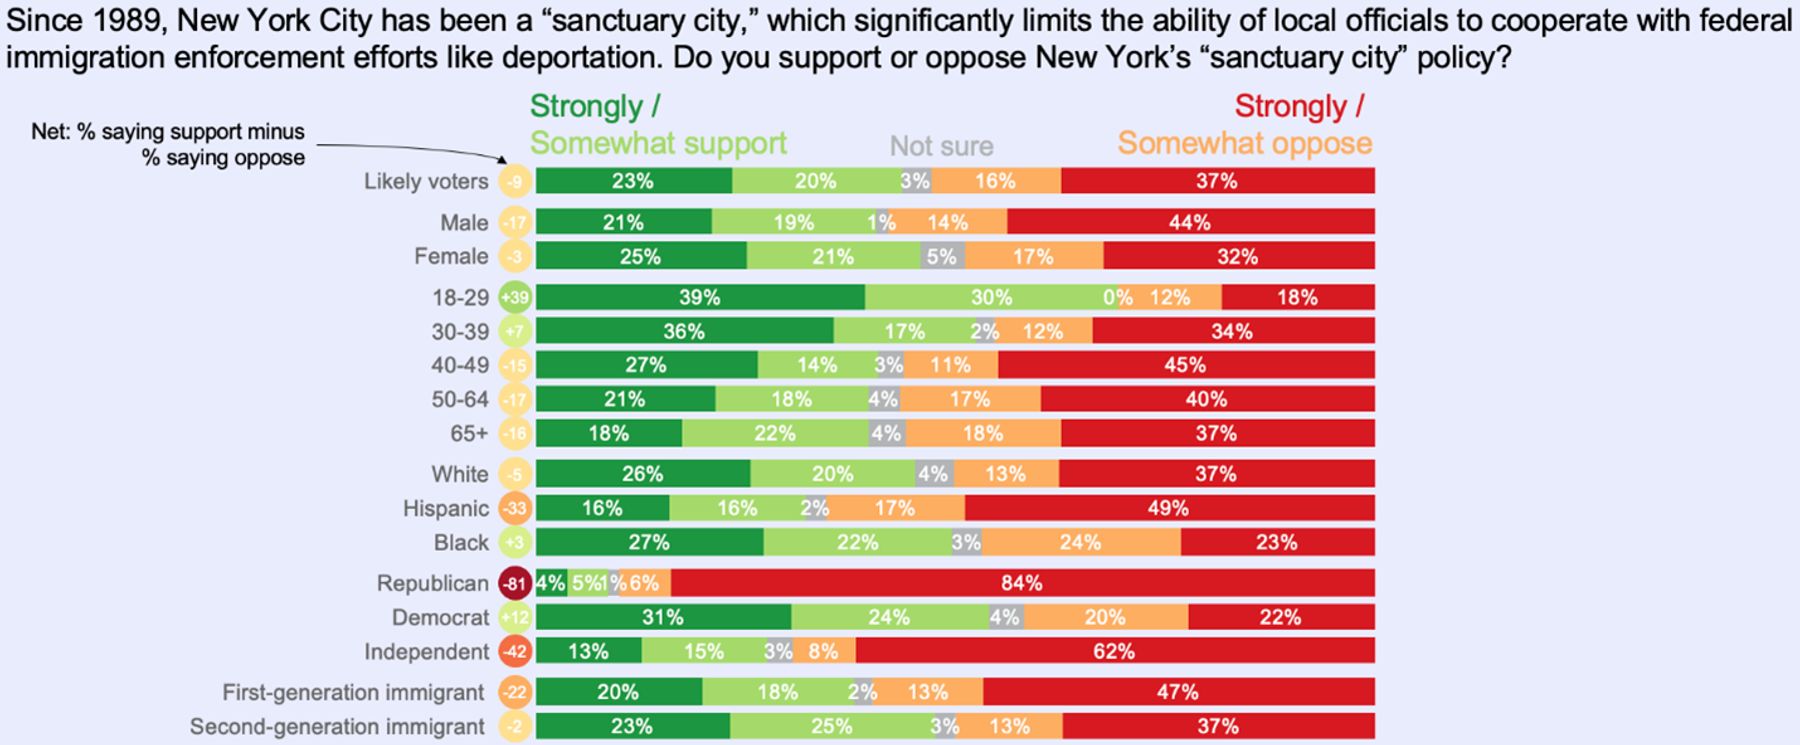
Views are a little more nuanced on NYC’s “right to shelter,” the mayor’s debit card pilot program, and the designation of New York as a sanctuary city. “Right to shelter” is supported by a narrow majority of 53%, while the debit card scheme and sanctuary-city status are opposed by narrow majorities of 52% and 53%, respectively. There are divisions along party lines on these proposals. Nevertheless, a large proportion of Democrats do oppose the mayor’s debit card pilot program (40%) and sanctuary-city status (42%). All three proposals are opposed by majorities of first-generation immigrants (Figures 16–18).
Figure 16
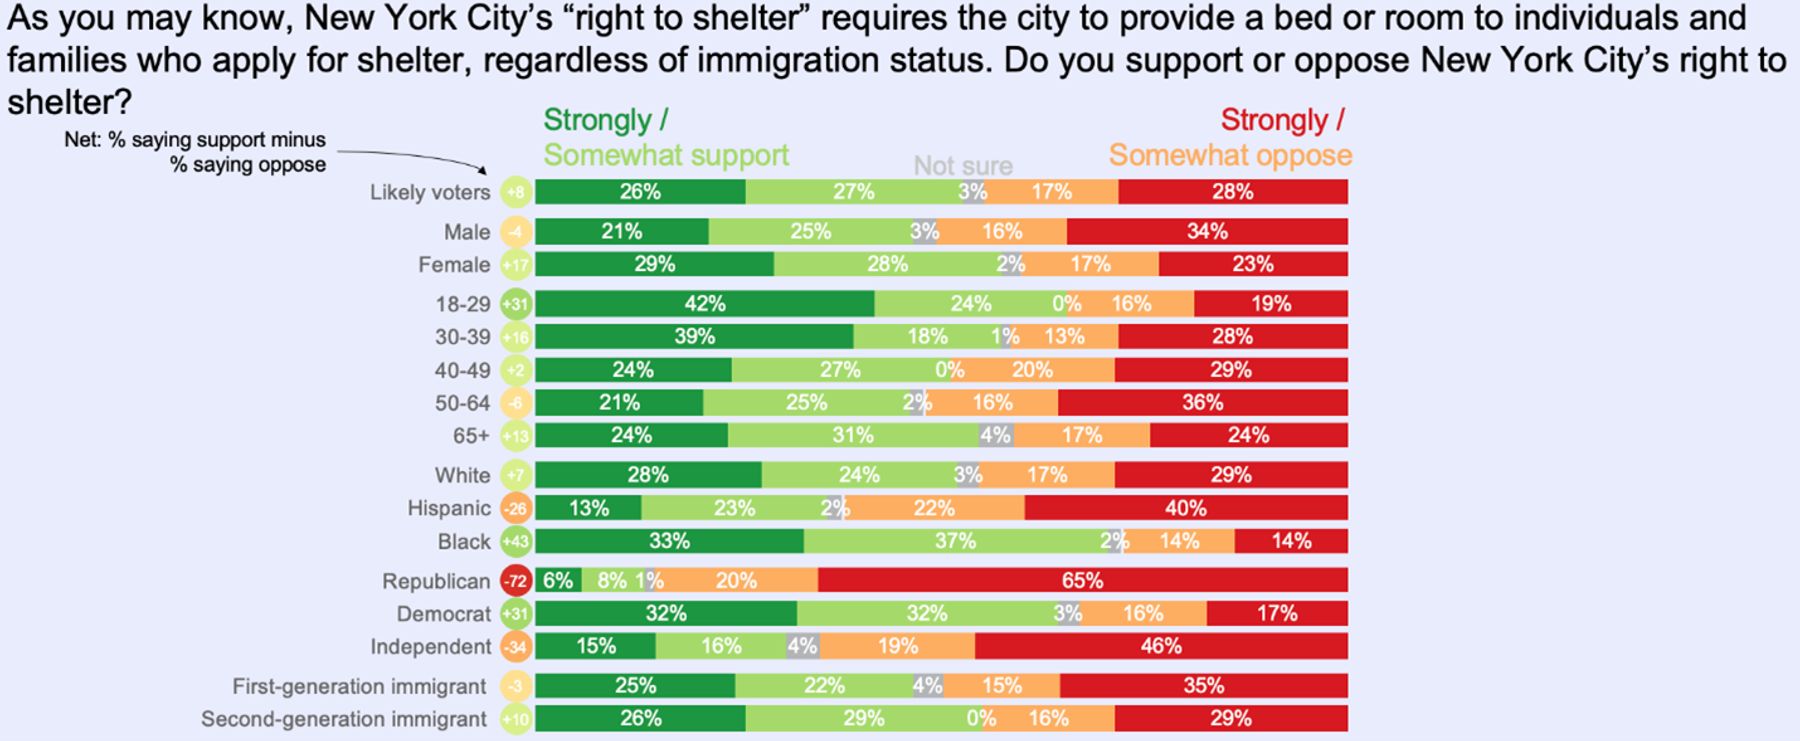
Figure 17
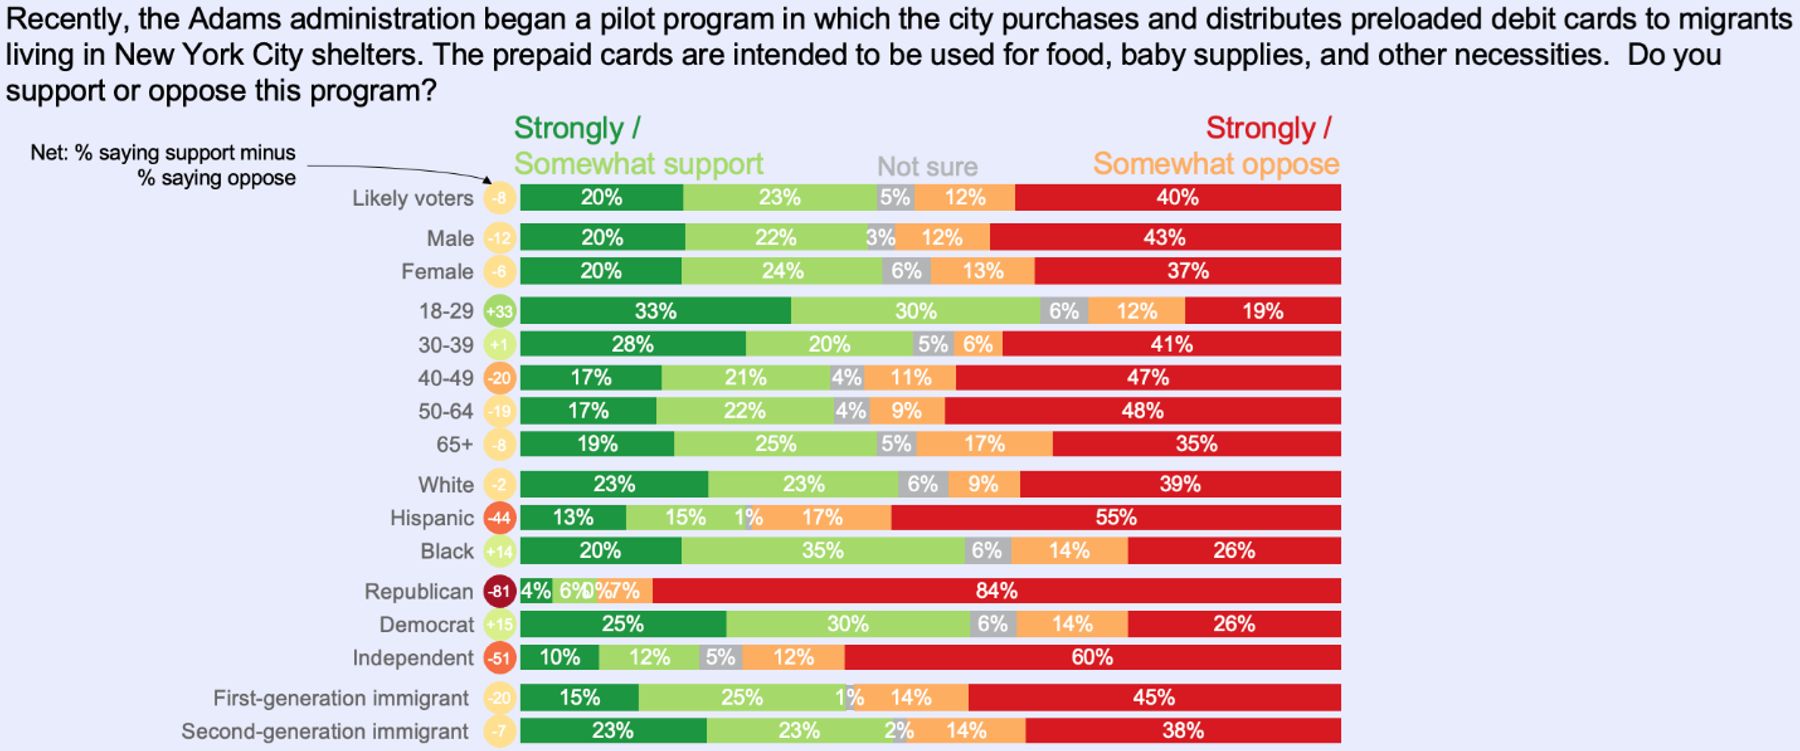
Figure 18
Electoral Reform
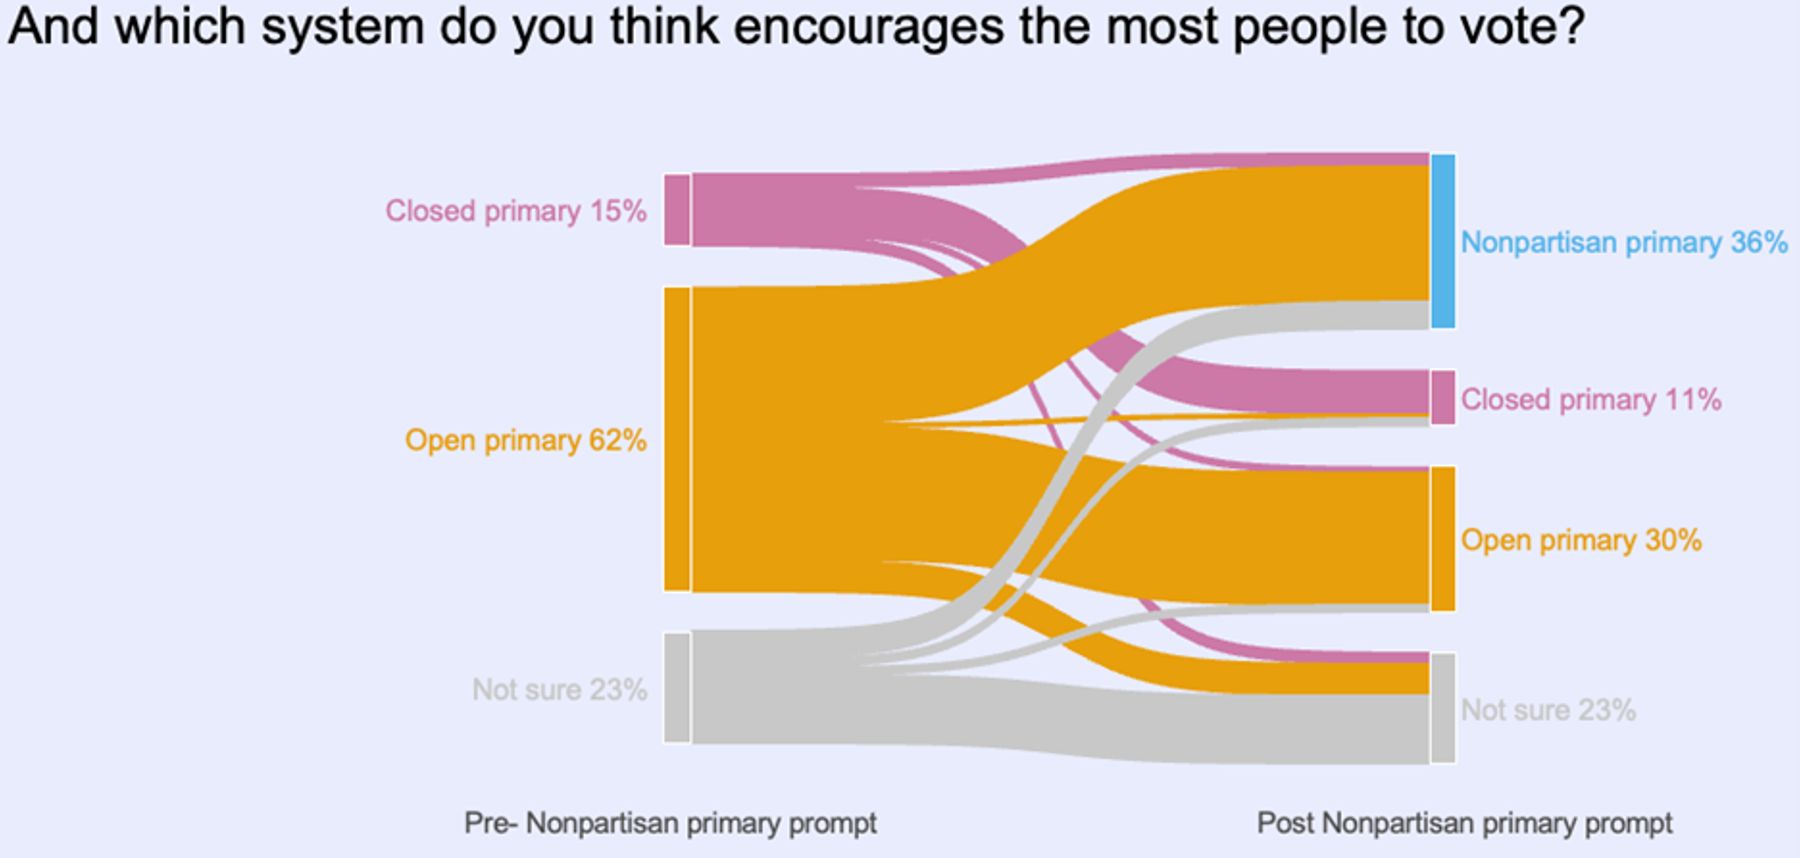
There is a significant appetite for change with respect to how New York City runs its elections. After hearing definitions of “open” and “closed” primaries, a majority of likely voters said that open primaries are better and encourage more people to vote than closed primaries. After a third option—nonpartisan primaries, sometimes referred to as “jungle primaries” or “top-two primaries”—was introduced and defined, 33% said a nonpartisan primary is best, 25% an open primary, and 21% a closed primary (Figure 19). Two-thirds of voters say that nonpartisan or open primaries encourage the most people to vote; only 11% say the same about closed primaries (Figure 20).
Figure 19
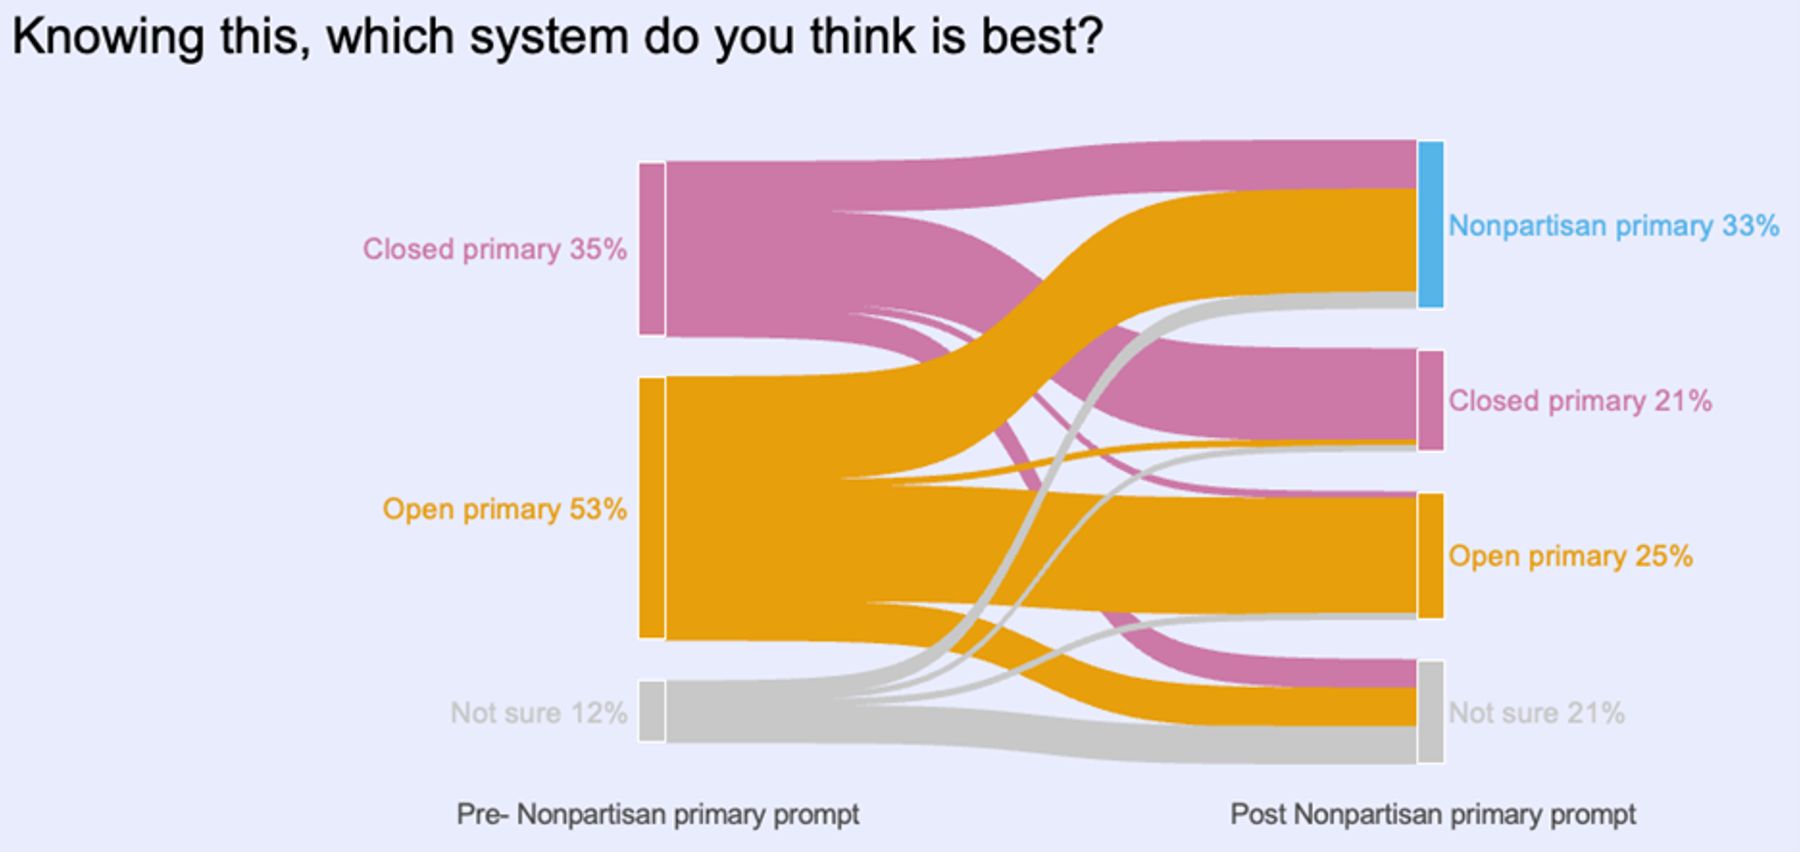
Figure 20
Other popular reforms that enjoy majority support include: shortening New York’s deadline to change party enrollment before election day, from 132 days to only 29 days (as is the rule currently in Florida) (Figure 21); holding NYC local elections in even-numbered years, on the same day as elections for Congress or President (Figure 22); and the continued use of ranked-choice voting (Figure 23). A plurality support providing voters with additional information printed on ballots, such as candidate endorsements from newspapers, civic groups, and political leaders (Figure 24).
Figure 21
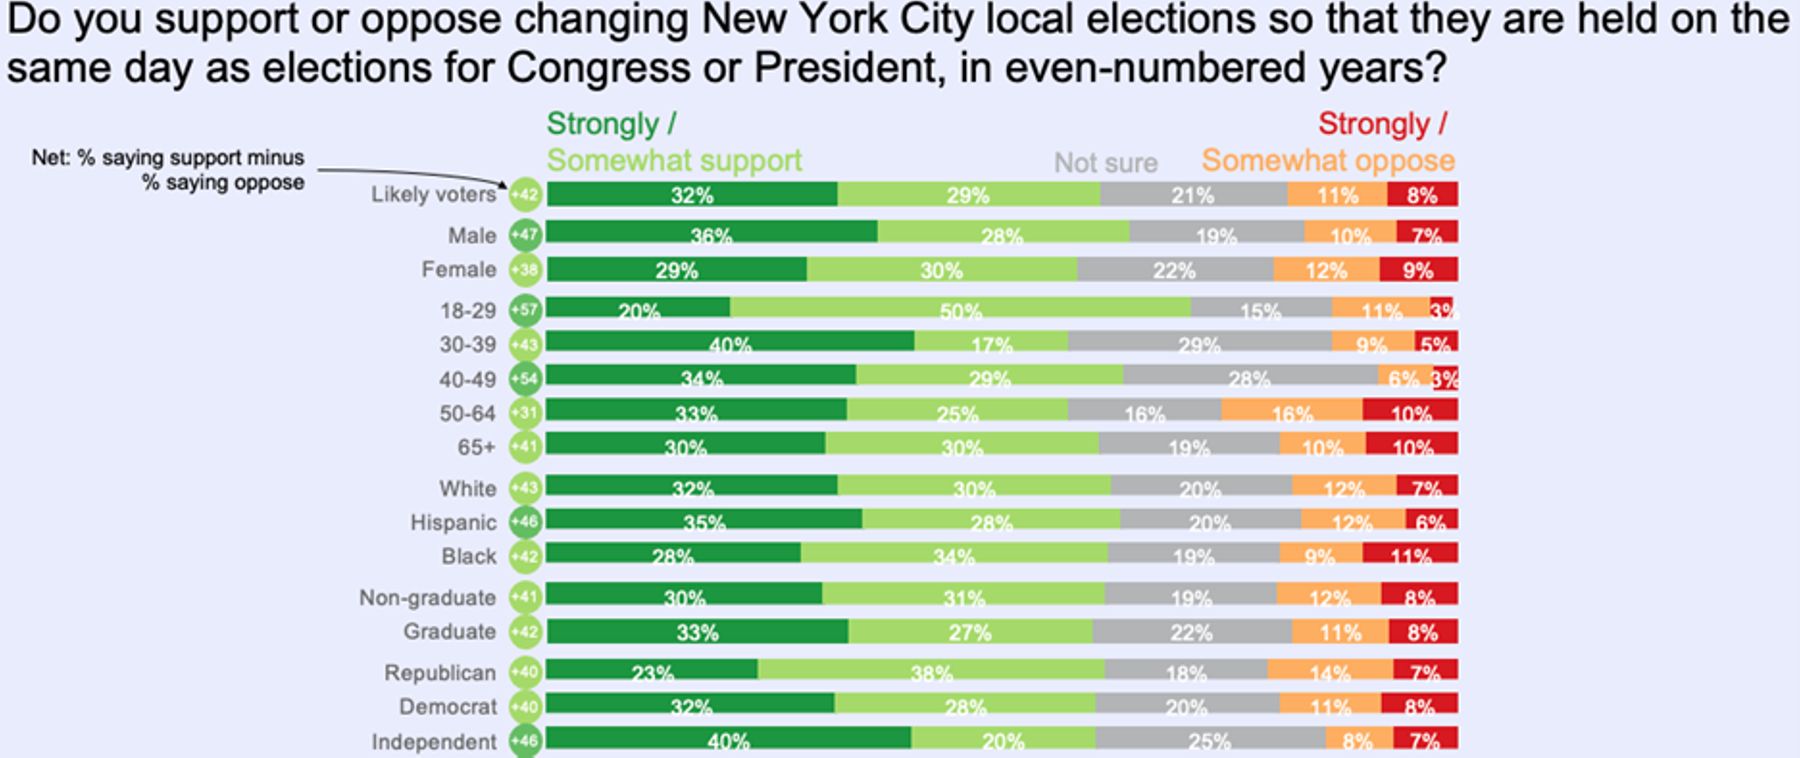
Figure 22
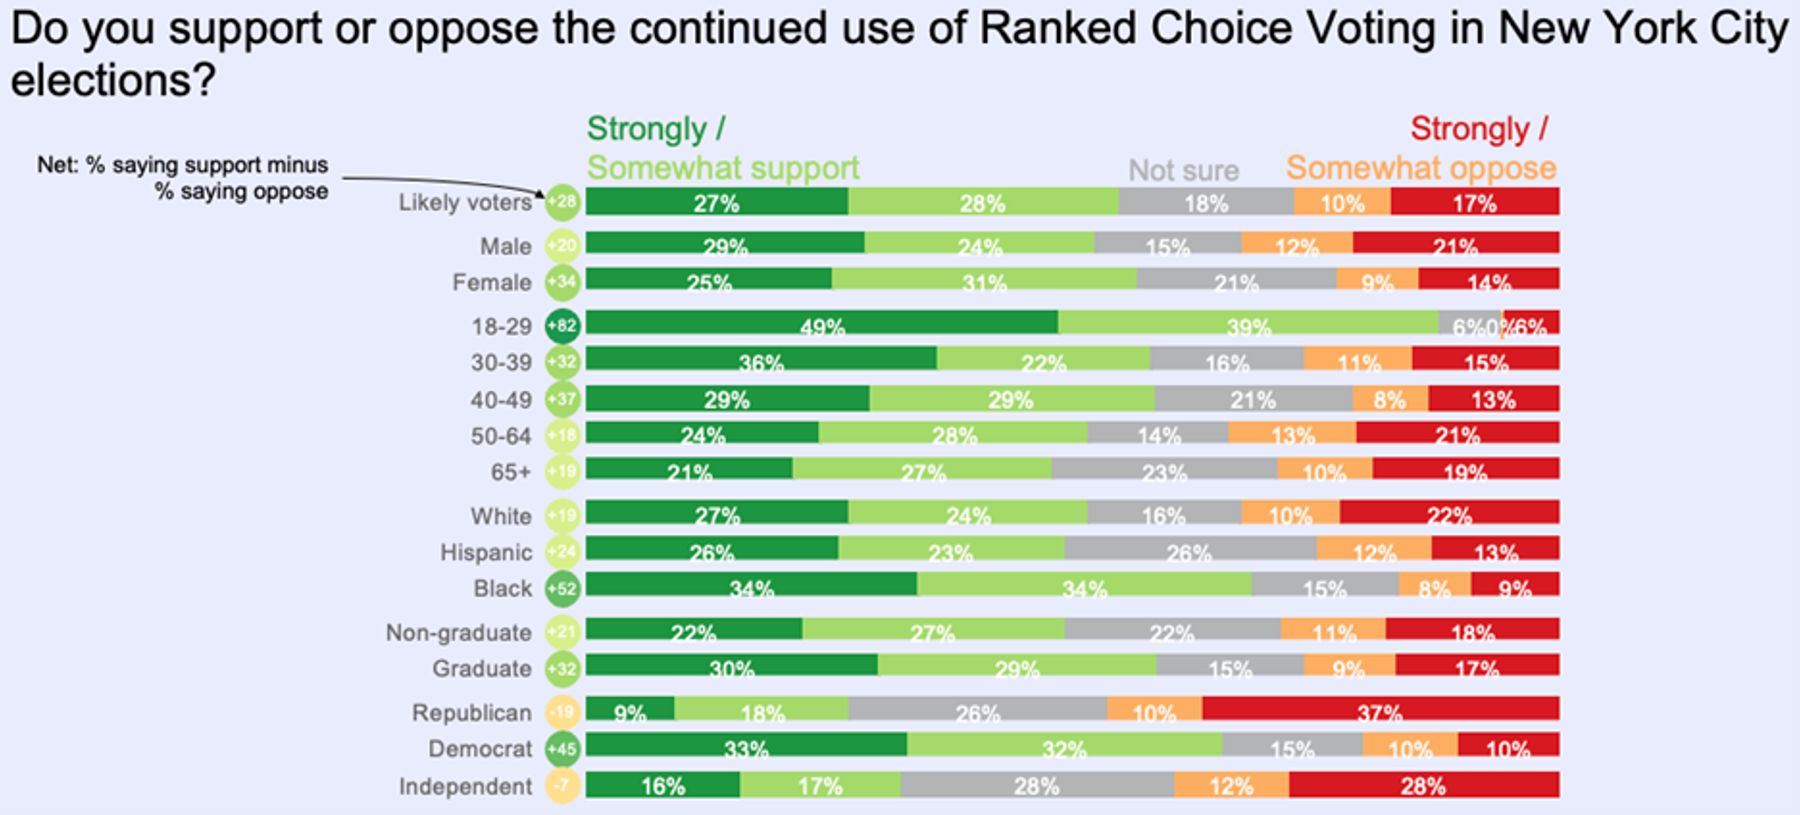
Figure 23
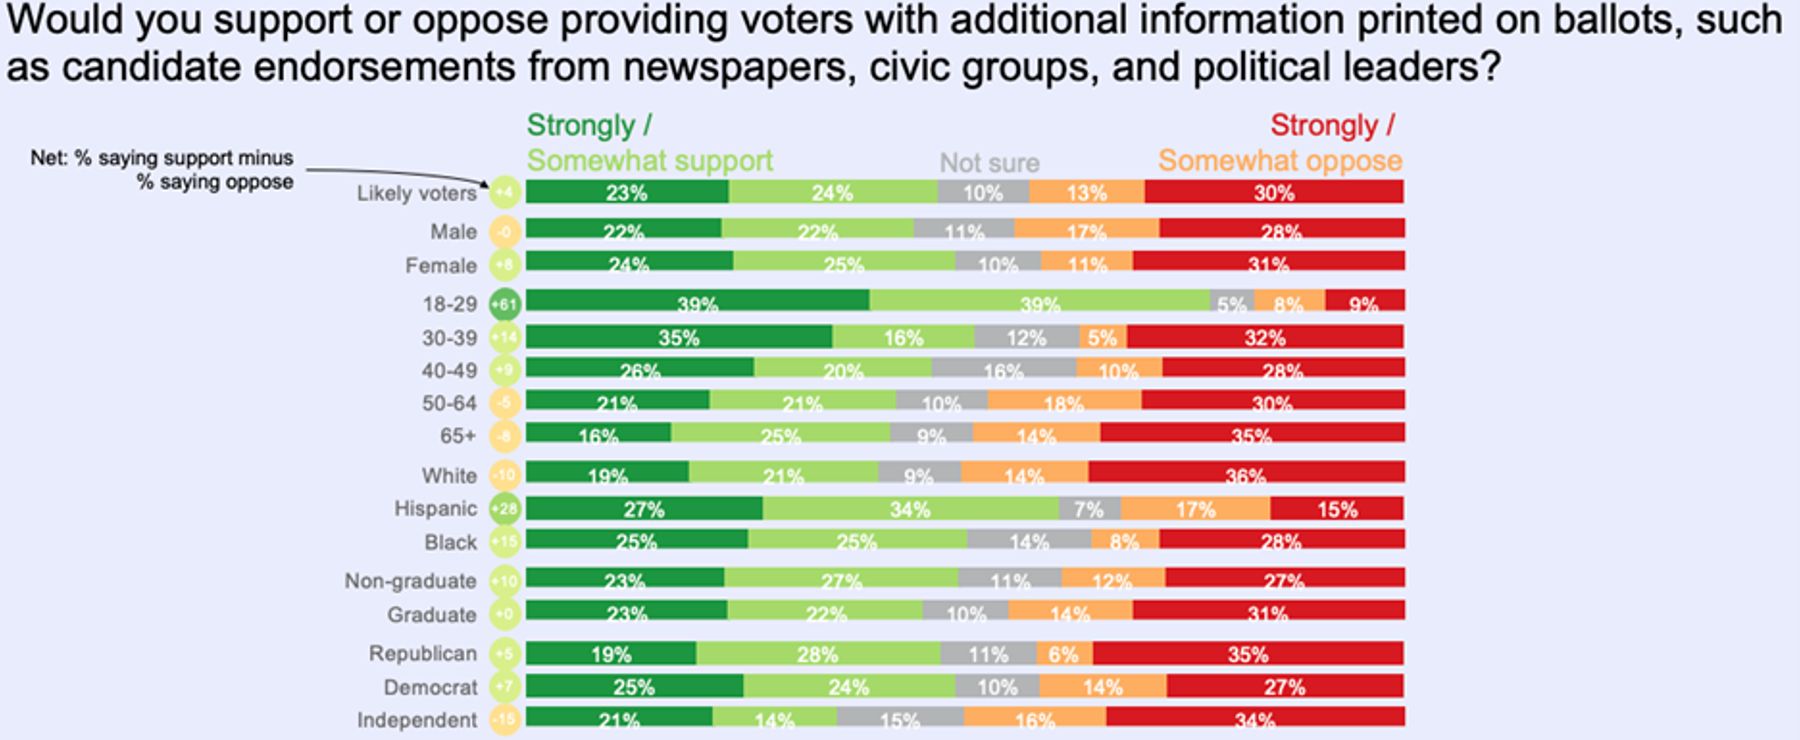
Figure 24
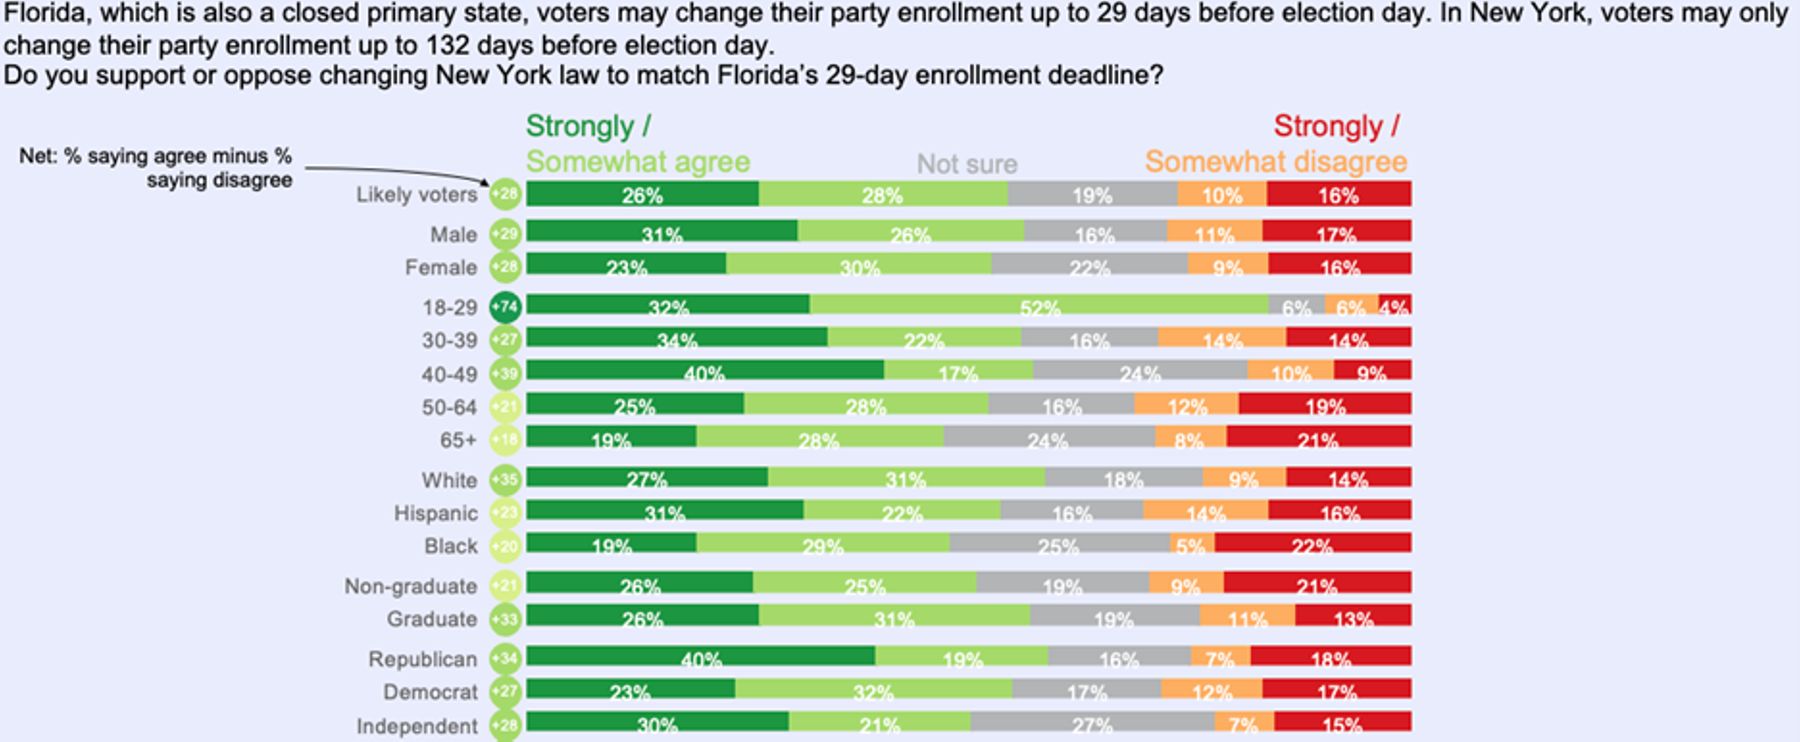
Photo: LIVINUS/iStock/Getty Images Plus
Are you interested in supporting the Manhattan Institute’s public-interest research and journalism? As a 501(c)(3) nonprofit, donations in support of MI and its scholars’ work are fully tax-deductible as provided by law (EIN #13-2912529).