New York State Math Standards Keep Changing While Students Stagnate

Photo: Maskot / DigitalVision via Getty Images
Introduction
In 1983, a report by the National Commission on Excellence in Education, “A Nation at Risk,” warned that students were leaving school without the academic foundations needed for long-term success.[1] At the time, the concern was largely prospective. More than four decades later, its predictions have been realized, with many students finishing their schooling without ever developing the competence in math that is critical for long-term achievement. The consequences of this failure fall most heavily on students who can least afford to fall behind.
Mathematics proficiency shapes students’ ability to access advanced coursework, complete key academic milestones, and pursue postsecondary pathways. Research has shown that early math achievement is one of the strongest predictors of later academic success, high school completion, and economic opportunity.[2] When students fall behind in foundational math, every new concept becomes harder to learn. Students who fall behind in foundational math are less likely to succeed in advanced coursework, and gaps that emerge in elementary school tend to widen rather than close as academic demands increase.[3]
Students in the U.S. have long performed worse than their international peers in mathematics, particularly in foundational domains.[4] Some states, including New York, have responded by revising academic standards. But despite three rounds of standards revisions in two decades, student achievement has largely remained stagnant. Disparities by race, income, and disability have continued. The problem is that the standards describe what students should learn; they do not determine whether students learn it.
Recent Math Outcomes in New York State
New York State’s math outcomes, as measured by the National Assessment of Educational Progress (NAEP), are below the national averages. In 2024, 37% of fourth-grade students in the state reached proficiency in math, putting the state 38th nationally (Table 1). Although it rose slightly from 2022 to 2024, fourth-grade NAEP proficiency is still comparable with pre-pandemic levels.
Table 1
Grade 4 NAEP Math Results
| Year | National NAEP Scale Score | New York State NAEP Scale Score | National Ranking | Percentage Proficient in Math |
| 2017 | 239 | 236 | 40 | 35% |
| 2019 | 240 | 237 | 34 | 37% |
| 2022 | 236 | 227 | 46 | 28% |
| 2024 | 237 | 234 | 38 | 37% |
Grade 8 math results, by contrast, have been declining since 2019, with average NAEP scale scores falling from 280 to 271. In 2024, 26% of students in New York reached proficiency in math, a decrease from 34% in 2017 and 2019 (Table 2).
Table 2
Grade 8 NAEP Math Results
| Year | National NAEP Scale Score | New York State NAEP Scale Score | National Ranking | Percentage Proficient in Math |
| 2017 | 283 | 282 | 21 | 34% |
| 2019 | 282 | 280 | 27 | 34% |
| 2022 | 274 | 274 | 22 | 28% |
| 2024 | 274 | 271 | 27 | 26% |
New York’s own state assessment test is also a useful source of data on student performance, but changes to the test over time have limited its utility. Over the past decade, the state has changed the design, scoring scales, and performance standards of its math assessments, and the minimum scale score required for proficiency has varied across assessment cycles. As a result, state-reported proficiency thresholds are not directly comparable across years.
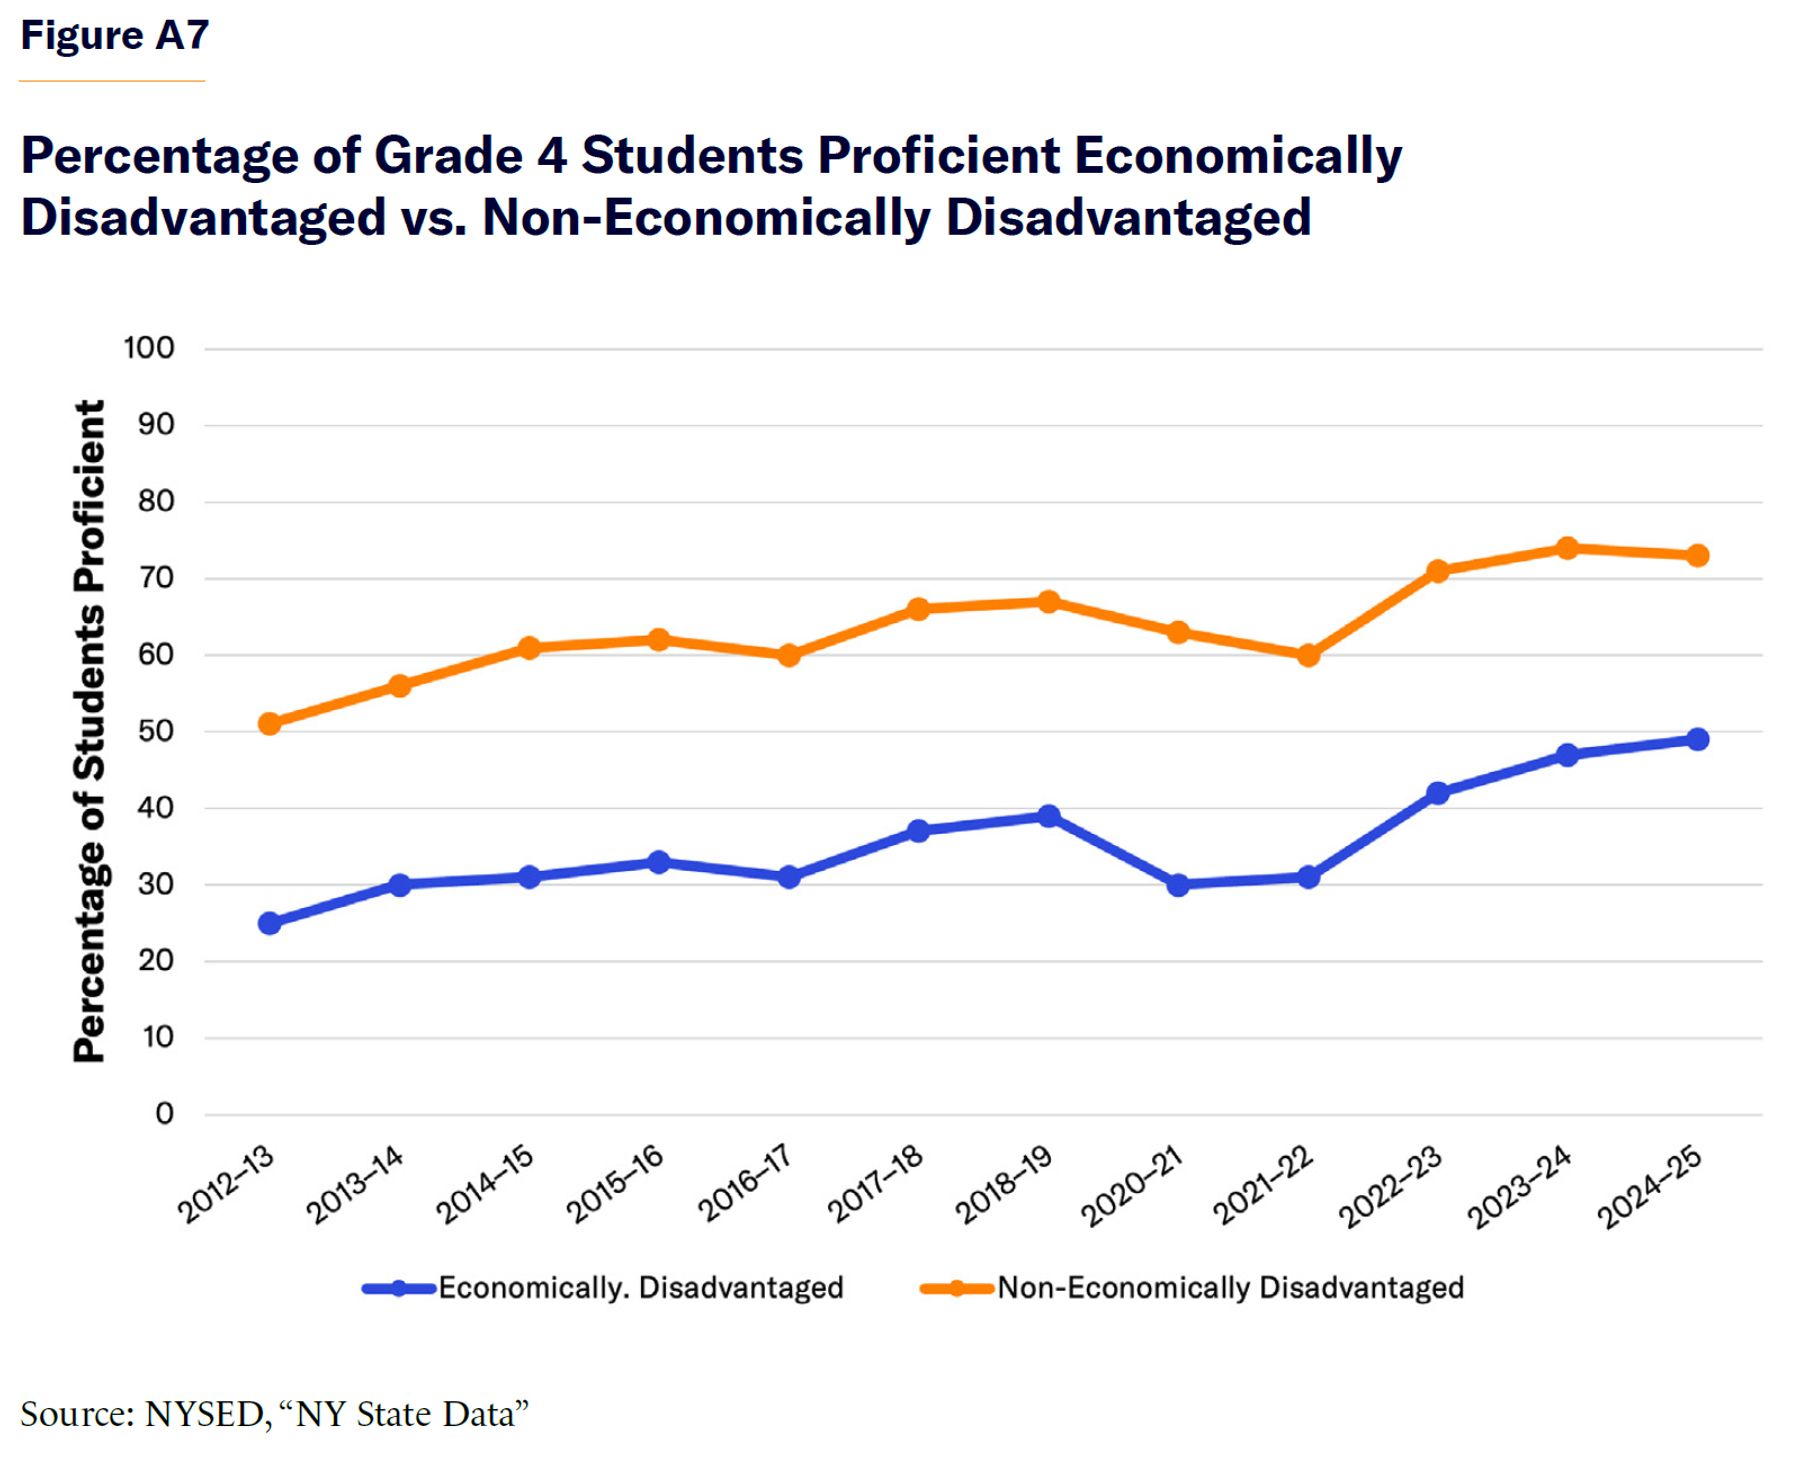
Recent state assessment data highlight the disparities in math achievement across student groups. In the 2024–25 school year, fewer than half of black (49%) and Hispanic (46%) fourth-grade students reached proficiency, compared with 64% of white students and 81% of Asian students. Similar gaps are evident by economic status: 49% of economically disadvantaged students met proficiency standards, compared with 73% of their non-economically disadvantaged peers. Despite modest increases in performance in recent years, students with disabilities continue to have the lowest outcomes, with fewer than 30% reaching proficiency in 2024–25.
Eighth-grade state assessment trends are comparable. By 2024–25, 47% of students statewide had met proficiency standards, but the rate was substantially lower among black (36%) and Hispanic (37%) students than among white (55%) and Asian (71%) students. Economically disadvantaged eighth-grade students continued to score well below their peers, with only 40% reaching proficiency, compared with nearly 59% of their peers. Students with disabilities improved modestly from the year before, rising to 21% proficient, but still fare markedly worse than general education students.
Proficiency rates are higher on the Regents examination, which is given only to a select population of students enrolled in specific courses rather than a full grade-level cohort, but disparities are similarly large. In 2024–25, proficiency rates in Algebra I and Geometry were substantially lower for black students, economically disadvantaged students, and students with disabilities. In Geometry, fewer than one-third of black students and fewer than 30% of students with disabilities reached proficiency, compared with more than 70% of white and non-economically disadvantaged students. The recent state assessment data indicate that while reported proficiency has increased in some areas, NYS continues to face significant gaps in math achievement (see Appendix for two decades of student math outcomes data).
Five Strands of Math Proficiency and the Science of Math
Math competence is not just the ability to follow defined rules.[5] Students must understand math concepts, apply procedures efficiently, reason through relationships, and solve problems.[6] Educational systems that produce stronger math outcomes align curriculum, instruction, and practice so that these elements develop together.[7] The National Research Council offers the most widely used framework to evaluate K–8 math proficiency, which includes five interrelated concepts: conceptual understanding, procedural fluency, strategic competence, adaptive reasoning, and productive disposition.[8] This report will draw on NRC’s framework to evaluate how well NYS standards and instructional materials support math progress.[9]
- Conceptual understanding involves knowing why mathematical ideas work and how concepts connect. Students who understand math conceptually are better able to explain their reasoning, recognize patterns, and apply what they know.
- Procedural fluency is demonstrated by a student’s ability to perform math calculations accurately and efficiently. Accuracy alone, while important, is not enough when students are asked to solve multistep problems.
- Strategic competence is the student’s ability to represent and make sense of math problems, select strategies, and work toward solutions. This includes modeling how to solve problems, identifying alternative approaches, and knowing how to adapt when the first strategy does not work.
- Adaptive reasoning involves explaining solutions and making sense of others’ explanations of their approach.
- Productive disposition is the motivation to engage in mathematics because the student believes that the math makes sense, that it is worthwhile, and that putting in effort will lead to improvement.[10] Without this motivation, students are less likely to engage or persevere through more challenging problems.[11]
When instruction focuses on only one aspect of math, students may appear successful at first but struggle with applying ideas, connecting concepts, or reasoning through unfamiliar problems. Education scholars associated with the “science of math” movement[12]—which draws on decades of empirical evidence from cognitive psychology, learning sciences, and mathematics education[13]—have shown that math proficiency at a given grade level depends on skills introduced several years earlier. If those skills are not fully learned, even well-designed instruction can break down quickly and teachers are forced to spend instructional time reteaching and simplifying tasks or to simply move on without students fully understanding. When procedures are explicitly demonstrated and errors promptly corrected, these gaps are less likely to compound over time.[14]
New York State Math Standards
In 2017, New York adopted the “Next Generation Mathematical Learning Standards,”[15] its third revision within two decades. In kindergarten through second grade, the standards focus heavily on number sense and basic operations (Table 3).
Table 3
Next Generation Standards, K–2
| Five Strands to Math Proficiency | Evidence in K–2 Standards (Selected Examples) |
| Conceptual Understanding | Understand the relationship between numbers and quantities up to 20. Understand that the two digits of a two-digit number represent amounts of tens and ones. Understand that the digits of a three-digit number represent amounts of hundreds, tens, and ones. |
| Procedural Fluency | Fluently add and subtract within 5. Fluently add and subtract within 10. Fluently add and subtract within 20, using mental strategies. Know from memory all sums within 20 of two one-digit numbers. |
| Strategic Competence | Explore addition and subtraction by using objects and fingers, responding to real-world situations. Relate counting to addition and subtraction. Use addition and subtraction within 20 to solve one-step word problems involving situations of adding to, taking from, putting together, taking apart, and/or comparing with unknowns in all positions. Apply properties of operations as strategies to add and subtract. |
| Adaptive Reasoning | Given a two-digit number, mentally find 10 more or 10 less than the number, without having to count; explain the reasoning used. Explain why addition and subtraction strategies work, using place value and the properties of operations. |
| Productive Disposition | Not addressed by grade-level standards (mentioned in K–12 mathematical practices only) |
In grades 3 through 5, the standards introduce fractions and problems that require more than one step (Table 4).
Table 4
Next Generation Standards, Grades 3–5
| Five Strands to Math Proficiency | Evidence in 3–5 Standards (Selected Examples) |
| Conceptual Understanding | Understand that a unit fraction (1/b) is the quantity formed by 1 part when a whole is partitioned into b equal parts. Understand a fraction as the quantity formed by a parts of size. Explain why a fraction (a/n) is equivalent to a fraction (a x n / b x n) by using visual fraction models, with attention to how the number and size of the parts differ, even though the two fractions themselves are the same size. Apply and extend previous understandings of multiplication to multiply a fraction by a whole number or a fraction. |
| Procedural Fluency | Fluently solve single-digit multiplication and related divisions, using strategies such as the relationship between multiplication and division of properties of operations. Fluently add and subtract multi-digit whole numbers using a standard algorithm. |
| Strategic Competence | Solve two-step word problems posed with whole numbers and have whole-number answers using the four operations. Solve multistep word problems posed with whole numbers and have whole-number answers using the four operations, including problems in which remainders must be interpreted. Solve word problems involving addition and subtraction of fractions referring to the same whole, including cases of unlike denominators. |
| Adaptive Reasoning | Explain equivalence of fractions and compare fractions by reasoning about their size. Explain why a fraction is equivalent to a fraction by using visual fraction models. Interpret multiplication as scaling. |
| Productive Disposition | Not addressed by grade-level standards (mentioned in K–12 mathematical practices only) |
In middle school, the standards shift toward proportional reasoning and algebraic thinking, with greater emphasis on modeling and abstraction (Table 5).
Table 5
Next Generation Standards, Grades 6–8
| Five Strands to Math Proficiency | Evidence in 6–8 Standards (Selected Examples) |
| Conceptual Understanding | Understand the concept of a ratio and use ratio language to describe a ratio relationship between two quantities. Apply and extend previous understandings of addition and subtraction to add and subtract rational numbers. Represent addition and subtraction on a horizontal or vertical number line. Graph proportional relationships, interpreting the unit rate as the slope of the graph. Compare two different proportional relationships represented in different ways. |
| Procedural Fluency | Fluently add, subtract, multiply, and divide multi-digit decimals using a standard algorithm for each operation. Compute unit rates associated with ratios of fractions. Solve linear equations in one variable. |
| Strategic Competence | Use ratio and rate reasoning to solve real-world and mathematical problems. Use proportional relationships to solve multistep ratio and percentage problems. Construct a function to model a linear relationship between two quantities. |
| Adaptive Reasoning | Write, interpret, and explain statement of order for rational numbers in real-world contexts. Explain what a point (x, y) on the graph of a proportional relationship means in terms of the situation, with special attention to the points (0, 0) and (1, r), where r is the unit rate. Describe qualitatively the functional relationship between two quantities by analyzing a graph. |
| Productive Disposition | Not addressed by grade-level standards (mentioned in K–12 mathematical practices only) |
By the time students take Algebra I in high school, they are expected to work with linear equations, functions, and symbolic expressions (Table 6).
Table 6
Next Generation Standards, 9–12
| Five Strands to Math Proficiency | Evidence in 9–12 Standards (Selected Examples) |
| Conceptual Understanding | Interpret expressions that represent a quantity in terms of its context. For a function that models a relationship between two quantities: interpret key features of graphs and tables in terms of the quantities, and sketch graphs showing key features given a verbal description of the relationship. |
| Procedural Fluency | Solve linear equations and inequalities in one variable, including equations with coefficients represented by letters. Solve systems of linear equations in two variables both algebraically and graphically. |
| Strategic Competence | Choose and produce an equivalent form of an expression to reveal and explain properties of the quantity represented by the expression. |
| Adaptive Reasoning | Explain each step when solving a linear or quadratic equation as following from the equality of numbers asserted at the previous step, starting from the assumption that the original equation has a solution. Construct a viable argument to justify a solution method. |
| Productive Disposition | Not addressed by grade-level standards (mentioned in K–12 mathematical practices only) |
On the whole, the Next Generation Standards perform well on four of the five strands of mathematical proficiency: conceptual understanding, procedural fluency, strategic competence, and adaptive reasoning.[16] However, the grade-level standards contain no expectations about productive disposition: a student’s confidence, persistence, and sense-making in math.[17] Productive disposition is captured only in the broad, overarching “standards for mathematical practices,” which apply to all levels of instruction.[18]
Decades of research show that early math achievement, particularly in algebra, is one of the strongest predictors of long-term success.[19] Students who do not master foundational skills are less likely to succeed as content becomes more complex. When math standards do not ensure a coherent progression, improvements in standards alone will not translate to better student outcomes.[20] When students have success and can make sense of the math they are learning, they are more likely to view math as meaningful and persist through challenging problems. When curricula do not structure expectations for math proficiency is to be developed over time, implementation varies.
Evidence-Based Instructional Recommendations
In 2025, the New York State Education Department (NYSED) released a series of numeracy briefs that highlight evidence-based practices for effective math instruction.[21] The briefs do not introduce new instructional concepts. Instead, they draw on decades of research in education and psychology, explaining how math learning develops over time and the importance of sequencing, representations, and student explanation. The briefs are advisory and leave implementation decisions to districts and thus will likely not lead, on their own, to consistent instructional practices across schools.
To improve math outcomes, a greater focus on quality instruction is warranted. When learning new concepts, students benefit from explicit, carefully guided instruction, in which teachers model solution methods, explain their reasoning, and walk students through initial practice, while monitoring understanding and correcting errors in real time.[22] This is especially important for new and cognitively demanding content. Students also benefit from visual representations[23]—such as number lines, diagrams, and area models—that help students see the structure of a problem.
When introducing new concepts, “scaffolding”—in which problems are broken into smaller pieces that are easier to tackle—can be a useful approach.[24] As students become more confident, supports can be reduced, allowing them to gradually take on more of the work independently.[25]
Consistent problem-solving routines help build mathematical competence.[26] When students are consistently taught how to approach problems, doing so becomes more manageable. Rather than treat each task as unique, students learn to identify what a problem is asking, decide how quantities are related, and check whether their solution makes sense. These routines help students focus on the structure of a problem rather than on surface details, which is especially important with more complex, multistep problems.
Intentionally revisiting skills learned earlier helps students retain what they have learned and recognize which strategies apply to a given problem.[27] Without cumulative structure, students may succeed when a skill is first taught but fail to recall it later. Feedback functions in a similar way: students make more gains when teachers respond to errors immediately and explain why a method does or does not work, rather than allow mistakes to continue until the end of a lesson or unit.[28] Addressing misunderstandings helps prevent incorrect strategies from becoming habits over time.
Table 7
Evidence-Based Instructional Practices Implementation by Level
| Evidence-Based Instructional Practice | Grades K–5 Application | Grades 6–8 Application | High School Application |
| Explicit Instruction and Modeling | Teachers show students how to complete new types of math problems and work through examples; teachers pause instruction to address errors or confusion as they occur, adjusting support based on student readiness. | When students encounter new content, teachers walk through solution steps in real time, explaining why each step works and checking that students are following the logic. | For complex tasks involving linear equations, functions, or multistep procedures, teachers model complete solution paths, make their reasoning explicit, and support students through initial attempts before moving the responsibility to independent work. |
| Use of Multiple Representations | Students work with objects, drawings, and simple visuals such as number lines to connect math ideas to something they can see and manipulate. | Lessons move between visuals and symbols. Tables, graphs, and diagrams are used so that students can see how numbers and relationships change. | Students move back and forth among equations, graphs, tables, and written descriptions to make sense of more abstract relationships. |
| Faded Scaffolding | Students first look at worked examples with teacher support. Over time, that support is reduced as students take on more of the work themselves. | Teachers provide partially completed examples for complex problems, gradually removing prompts as students show that they can manage the steps. | Examples are used to introduce complex tasks, but students are expected to take increasing responsibility for planning and completing solutions. |
| Strategic Problem Solving | Teachers teach students common types of word problems and show them how to use the same diagrams or approaches each time. | Students are taught a consistent way to approach problems, figuring out what is being asked, choosing a strategy, and checking their work. | Problem-solving routines help students decide how to model a situation, select an approach, and judge whether their answer makes sense. |
| Cumulative Practice | Problem-solving routines help students decide how to model a situation, select an approach, and judge whether their answer makes sense. | Practice problems mix older and newer content, helping students decide which strategy fits a given problem. | Assignments include a range of problem types, so students must choose methods rather than rely on patterns. |
| Frequent Feedback | Assignments include a range of problem types, so students must choose methods rather than rely on patterns from a single unit. | Feedback focuses on inefficient strategies and common misconceptions before they become habits. | Feedback emphasizes precision and reasoning, with opportunities for students to revise work and improve accuracy. |
Explicit Instruction and Inquiry-Based Approaches
Math curricula often differ less in the topics they include than in the assumptions they make about how students will learn. Some programs introduce new material by showing students how a method works and then giving them structured practice. Others begin with open-ended problems and expect understanding to emerge through discussion, exploration, or trial and error.
Inquiry-based learning—which involves problem-based and open-ended tasks—is most effective after students have developed essential foundational skills.[29] Once students understand a concept and can reliably carry out basic procedures, open-ended tasks are necessary for continued progress.[30] Effective teaching, therefore, includes both explicit instruction and inquiry-based instruction. Explicit instruction lays the foundation for success in inquiry, while inquiry provides opportunities to apply, extend, and internalize mathematical ideas.
Assessment and Progress Monitoring
In many schools, teachers are expected to move forward with instruction without knowing whether students are keeping up. By the time a test reveals a student’s misunderstanding of a concept, it has already been reinforced over weeks spent practicing incorrect strategies. A recent meta-analysis, summarizing over 40 years of research, found that progress monitoring produces measurable gains in student performance, especially in math.[31] Benefits were largest when evaluations occurred at least weekly and when teachers learned how to adjust instruction based on test results.
Regular monitoring provides clearer signals about what students know and what they are ready to learn next, while giving teachers information that they can use to adjust pacing, revisit prior content, add scaffolds, or increase instructional support.[32] Progress monitoring, along with universal screening and early intervention requirements, has even been included in several recently enacted state laws aimed at strengthening mathematics instruction.[33]
For students who do not respond well to typical instructional methods or interventions, research supports the use of data-based individualization (DBI),[34] which relies on frequent progress monitoring to guide instructional changes.
Without reliable, frequently collected data, even well-designed instructional materials and programs may not reliably yield improved outcomes for students.
Selecting and Evaluating Evidence-Based Math Curriculum
In recent years, several reform efforts have focused on the adoption of math curricula that include high-quality instructional materials, which are necessary to support evidence-based instructional practices. A recent state-by-state policy review, for example, found that math proficiency depends on students developing conceptual understanding, procedural fluency, strategic competence, and productive disposition as foundational, and also identified that many system-level supports have not been adopted statewide in NYS.[35]
To evaluate whether a curriculum is supported by evidence, districts should rely on independent analysis. What Works Clearinghouse (WWC), for example, evaluates experimental and quasi-experimental evidence to determine whether a program shows positive effects, mixed results, or no measurable impact on student achievement.[36] Evidence for ESSA, a project of the Johns Hopkins University School of Education, maintains a database that shows the level of evidentiary support for various programs.[37] EdReports, by contrast, focuses on curriculum quality, providing independent reviews of instructional materials based on standards alignment and instructional design, but it does not include data on student outcomes for various programs and thus should be used with caution.[38] NYSED has, at times, recommended EdReports as a resource for districts to consult when considering curriculum alignment with state standards.[39]
The National Center on Intensive Intervention (NCII) provides supplemental tools for evaluating curriculum quality, particularly for students who need supplemental or intensive support. Its databases include ratings of evidence for intervention programs, as well as screening and progress-monitoring tools.[40]
NYSED does not currently offer a framework for districts to use in selecting a math curriculum. Table 8 shows how such a framework might look. Rather than recommend a specific program, it outlines important factors to consider, such as whether students are ready for the content, whether teachers have the support to implement the curriculum effectively, and whether the curriculum’s design matches classroom conditions.
Table 8
Framework for Selecting and Implementing Math Curriculum
| Condition | Key Questions/ Considerations | Indicators to Examine | Implications |
| Student Readiness | What proportion of students are currently performing below grade level? | Percentage of students below grade level Available data to indicate foundational skills that are present or missing | When a large proportion of students lack prerequisite skills, curriculum with explicit instruction, systematic practice, and scaffolded instruction are more likely to support access to grade-level content. |
| Instructional Design | How are new mathematical ideas introduced in lessons? | Use of explicit modeling versus inquiry-based instruction | Curricula that introduce new content primarily through problem-based tasks and discussion assume that students are able to successfully access grade-level math. When a significant portion of students are below grade level, supplemental instruction with explicit instruction and scaffolding help ensure learning. |
| Instructional Scheduling | Do the school and classroom schedules provide enough time within the week for math instruction? Is instructional time aligned with the curriculum’s design? | Daily minutes allocated to math Alignment between lesson design and available instructional time | When instructional time within the classroom schedule is constrained, lessons might not be implemented as designed, limiting opportunities for practice and feedback. |
| Teacher Support, Training, and Instructional Capacity | What instructional supports are available to help teachers implement the curriculum consistently and to respond when students are not progressing with the lessons? | Access to curriculum-specific professional development Availability of math coaching or support | Curricula that rely on student discussion and problem solving assume that a teacher has the content knowledge. Without professional development and ongoing support, implementation is more likely to vary across classrooms. |
| Assessment and Intervention Structure | How will student progress and instructional gaps be identified and addressed? | Access to Tier 2 and Tier 3 interventions Availability of math data and progress-monitoring tools | When curricula do not include embedded progress monitoring or remediation protocols, schools must ensure that data-driven intervention systems are in place to identify learning gaps and provide targeted support. |
Note: This framework draws on established research in mathematics learning, instructional design, and implementation science to highlight conditions that affect whether curricula can be used effectively with a given student population.
Recommendations
The following recommendations are intended to help ensure that students across New York State receive high-quality math educational programming.
Recommendation 1: Establish Consistent Statewide Requirements for Math Instructional Time
Research on curriculum implementation has consistently shown that insufficient instructional time weakens even high-quality programs.[41] Inconsistent instructional time disproportionately affects students from low-income communities, who depend more on the quality and consistency of core classroom instruction. Socioeconomic status is strongly related to students’ opportunities to learn mathematics, including the amount of instructional exposure that they receive, and these differences are directly associated with disparities in math achievement.[42] When instructional time is insufficient, these students experience the greatest learning losses.
Although New York State requires districts to provide 180 instructional days and a minimum of 900 instructional hours annually, it does not specify subject-level instructional time requirements for mathematics. Recent policy analyses recommend a minimum of 60 minutes of core mathematics instruction per day to support the implementation of high-quality materials,[43] which is longer than the instructional time devoted to math in many programs in districts across the state.
Establishing statewide expectations for minimum daily mathematics instructional time, particularly in elementary and middle school, would support more consistent implementation of evidence-based instructional practices.
Recommendation 2: Increase Targeted Focus on K–8 Foundational Math
Math proficiency in elementary and middle school has repeatedly been shown to be a strong predictor of success in high school mathematics and beyond, even accounting for family income or background.[44] Increasing attention to foundational math in grades K–8 is essential to supporting long-term achievement and students’ capacity to engage meaningfully in math problem solving.[45] When foundational math skills are not mastered in the early grades, gaps widen over time and become increasingly difficult to remediate.[46]
Improving student outcomes requires instruction that develops conceptual understanding, procedural fluency, and strategic competence together, preparing students to reason, model, and solve increasingly complex problems. Without foundational skills, more complex mathematical problems might place excessive cognitive demands on students.[47]
The development of foundational math skills in K–8 helps students foster productive dispositions, as well as a belief that mathematics is understandable and worthwhile and that effort leads to improvement.[48] Research shows that productive disposition emerges when instruction is coherent, concepts are explicitly taught, and students receive consistent feedback that helps them understand errors and experience progress.[49]
New York State does not currently have a statewide K–8 mathematics framework that sets out instructional priorities, sequencing expectations, or recommended system-level supports. While the Next Generation Mathematics Learning Standards specify grade-level content expectations, they do not provide guidance on how foundational skills should be developed across grade bands or how instruction should be adjusted when students are not yet prepared to engage with grade-level material. Strengthening attention to K–8 foundational mathematics through instructional expectations, alignment between curriculum design and student readiness, and integration of assessment and instructional supports would help prepare students for long-term math growth.
New York City has taken steps to increase coherence in math instruction through districtwide curriculum adoption and initiatives such as NYC Solves. These efforts aim to reduce instructional variability, particularly in middle and high school. NYC Solves should instead prioritize elementary math instruction to ensure that students can succeed at the high school level.
Recommendation 3: Establish Statewide Expectations for Math Screenings and Progress Monitoring
Currently, New York State does not require universal mathematics screening or progress monitoring in grades K–8, resulting in wide variation in how districts identify instructional needs and respond when students are not making adequate progress. The state should offer clear guidance to districts on how to conduct screening and monitoring, as well as training for educators on how to use progress-monitoring data to effectively adjust instruction accordingly. Since socioeconomic disadvantage and race are closely linked to differences in access to supplemental academic support, a lack of screening and progress-monitoring practices reinforces existing achievement gaps, which widen over time and disproportionately affect the students who rely most heavily on core classroom instruction.[50]
New York City has taken a step in the right direction by implementing district-wide screening assessments in reading and mathematics and publicly reporting aggregate results,[51] which can help districts with early identification of students who are falling behind.
As the state phases the NYS Regents Examination and moves towards updated graduation requirements that focus on broader and varied measures of student readiness beyond standardized exams,[52] schools will have fewer consistent statewide measures of student learning. As a result, early and ongoing instructional data will become even more critical. NAEP results indicate that in 2024, only 37% of New York’s fourth-grade students demonstrated proficiency in mathematics, meaning that most entered the upper elementary grades without mastery of foundational skills. Without consistent screening and progress monitoring, these shortcomings often remain undetected until students encounter more complex mathematical demands, contributing to the widening readiness gaps observed in middle school. Statewide expectations should support earlier identification of instructional need, enable targeted intervention, and improve the likelihood that students are prepared for more advanced math.
Recommendation 4: Establish Statewide Expectations for Instructional Sequencing of Math Content
NYS should establish clear expectations for the sequencing of problem-solving instruction. The Next Generation Mathematics Learning Standards, as well as the NYSED numeracy briefs, provide a foundation for the types of problem solving and reasoning that students should be expected to know. But the state does not currently offer instructional sequencing expectations or readiness-based conditions, which specify when more complex skills should be introduced or how instruction should be adapted for students who lack prerequisite skills.
As a result, many students are expected to engage in multistep problem solving without mastery of foundational concepts, which increases cognitive load and disproportionately disadvantages students who are already behind.
NYC Solves aims to reduce instructional variability and improve student progress by providing consistent math instruction,[53] including adopting Illustrative Mathematics[54] as the high school curriculum and limiting approved options at the middle school level. While these efforts help create consistency locally, they give further evidence for the need for statewide sequencing expectations to ensure that curriculum choices across bands consistently prepare students.
Recommendation 5: Require Evidence-Based Curriculum for All Grade Levels
New York State should establish clear expectations around the adoption of evidence-based mathematics curricula that support instructional coherence at all grade levels. Given that a large proportion of students enter upper elementary, middle, and high school mathematics below grade level, curriculum adoption criteria must explicitly consider how the materials support students who are behind. Curricula should include clear guidance for addressing foundational gaps, through techniques such as structured review, scaffolded representations, and cumulative practice. Additionally, state and national assessment data consistently show gaps in foundational mathematics skills by income and race. When curricula assume uniform readiness despite these gaps, students who begin instruction having fallen behind are least likely to meaningfully access grade-level mathematics content.
The state should also require curricular transparency, including public reporting of adopted materials by grade band and alignment across elementary, middle, and high school mathematics. Recent reforms in New York City have focused on the middle and high school grades, but as we have seen, these efforts will be hampered without stronger curricula that supports the development of fundamental math skills at lower grade levels.
Large-scale curriculum adoptions, such as the use of Illustrative Mathematics, highlight both the potential and the limits of curriculum-based reform. While high-quality instructional materials can support conceptual understanding, problem solving, and coherence, their effectiveness depends on alignment with instructional sequencing expectations, sufficient instructional time, student prerequisites, and systems for monitoring student progress. Without this, even well-designed curricula are unlikely to produce meaningful gains in math outcomes.
Conclusion
Across New York State, instructional gaps in math outcomes begin in elementary school and widen through middle and high school, ultimately restricting students’ access to advanced mathematics and meaningful problem solving. These trends appear consistently across assessments, grade levels, and student groups. The system clearly has failed to ensure that students develop foundational mathematical knowledge before demands on them increase. The recommendations in this report focus on building that missing infrastructure. Together, they emphasize instructional coherence, evidence-based materials, sufficient time for learning, and early identification of students who are not yet on track. With these changes, New York can achieve broad math proficiency.
School quality plays an important role in translating standards and curricula into learning. Even when districts adopt strong materials, outcomes depend on the capacity of school leaders and teachers to implement them effectively. Leaders must use data consistently, protect instructional time, and create classroom routines that support engagement.[55] Variation in principal and teacher quality can weaken the impact of state standards and district initiatives. Strengthening statewide instructional infrastructure, however, makes outcomes less dependent on the capacity of individual schools, thus increasing the likelihood that evidence-based math instruction can be implemented consistently across diverse school contexts.
Proficiency in math is a gateway to advanced coursework, postsecondary opportunities, and economic mobility. Ensuring that students become proficient in math is not only an instructional priority but a prerequisite for long-term success for all students.
Appendix: New York State Math Outcomes
NAEP data provide a nationally comparable measure of student achievement across states. Figure A1 displays New York State’s fourth-grade NAEP mathematics rankings from 2003 to 2024. In 2024, New York State ranked 38th nationally.
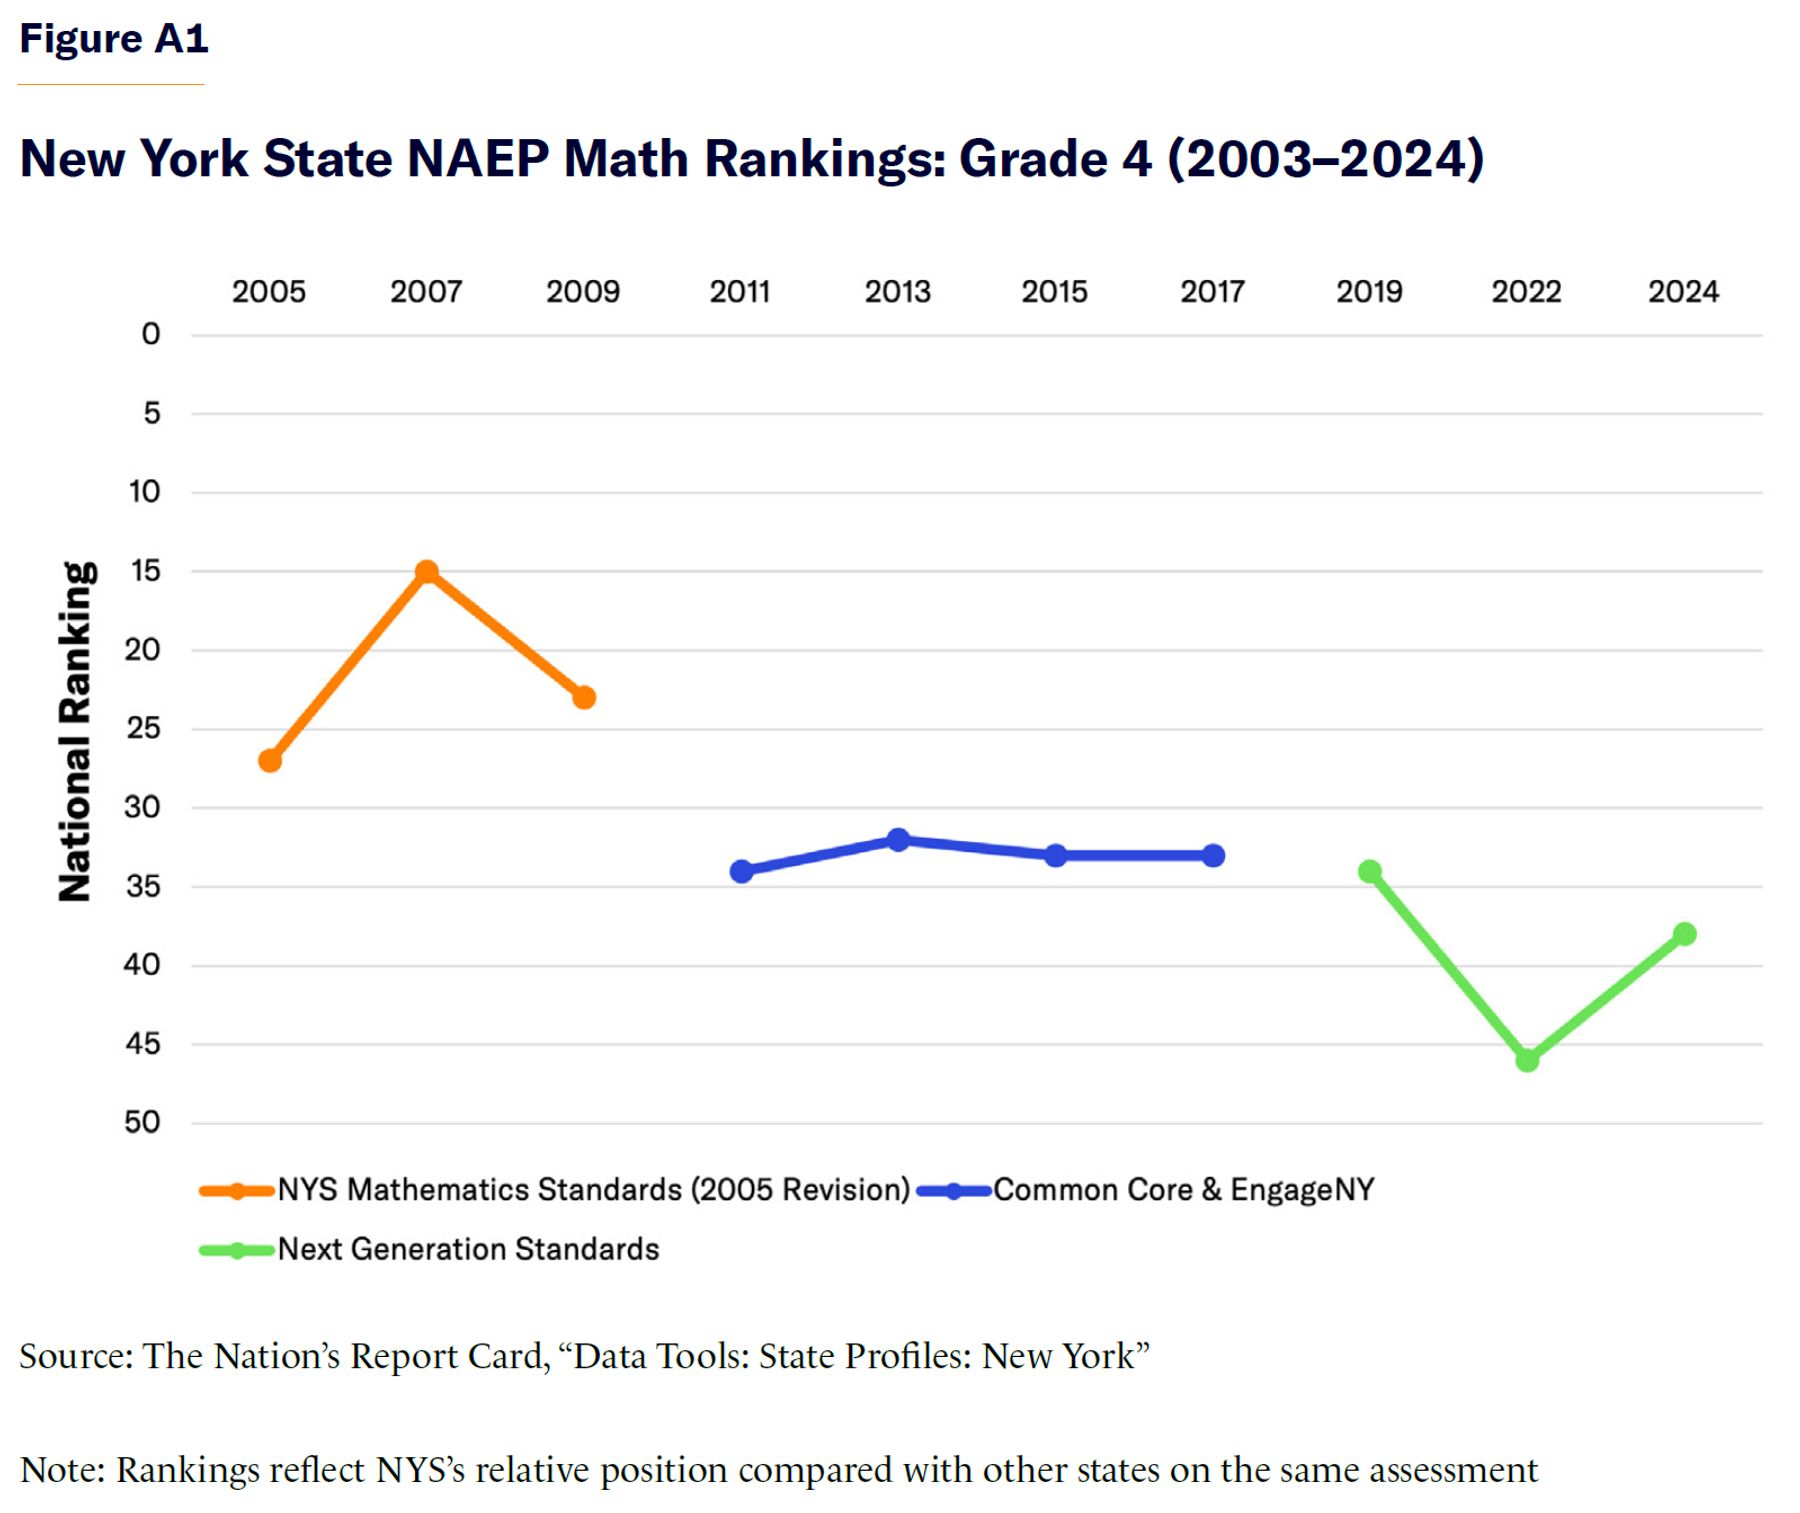
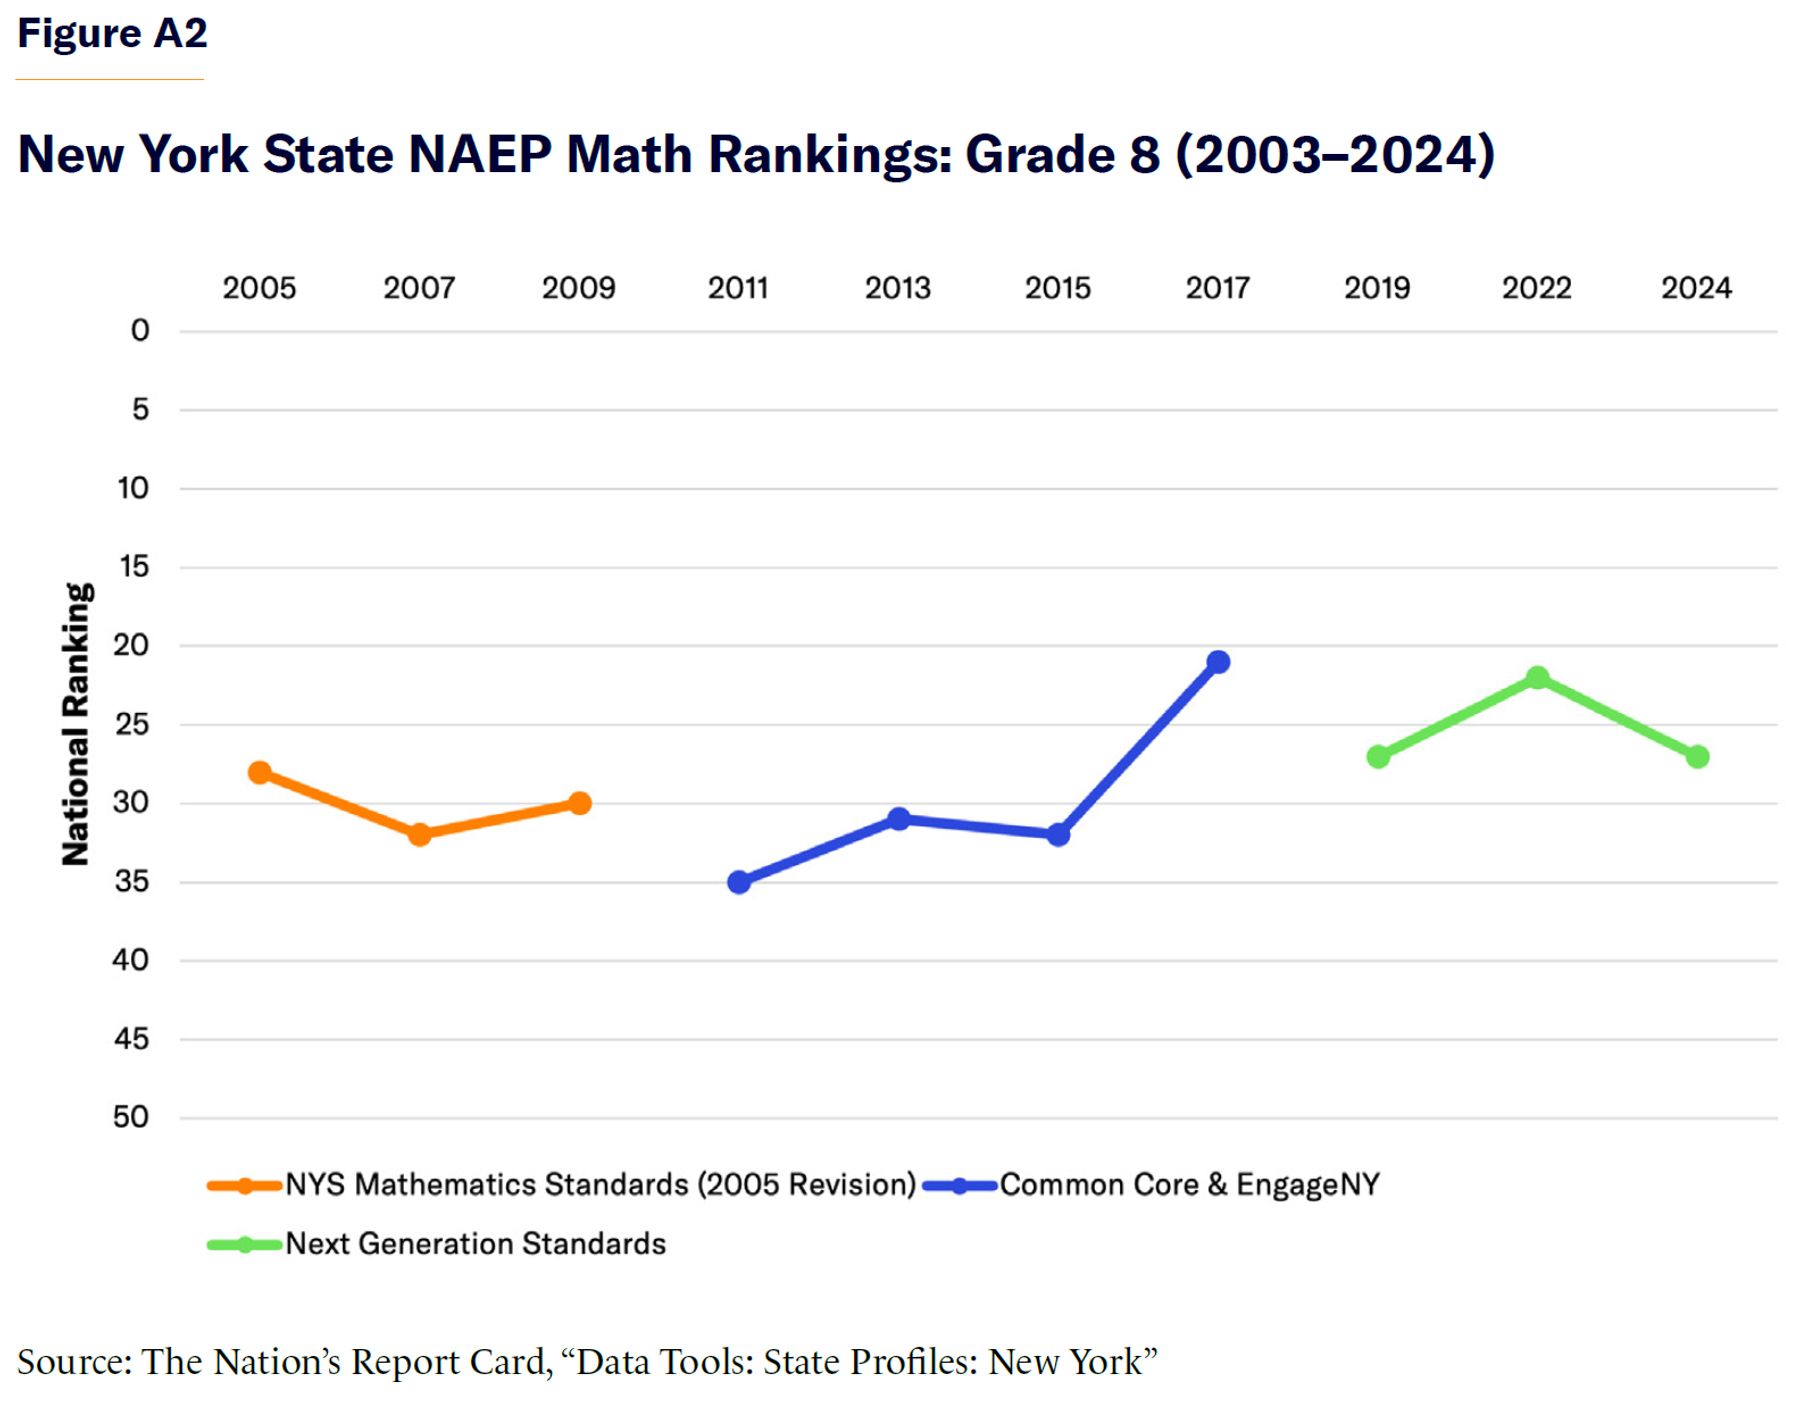
Figure A2 displays New York State’s Grade 8 NAEP mathematics rankings across assessment cycles. In 2024, New York State ranked 27th nationally in eighth-grade mathematics.
While rankings reflect states’ relative performance nationwide, NYS’s average NAEP scale scores provide a measure of student performance over time. Table A1 presents NYS Grade 4 and Grade 8 NAEP math scale scores from 2003–24.
Table A1
NAEP Math Average Scale Scores for NYS
| Year | Grade 4 Average Scale Score | Grade 8 Scale Score |
| 2003 | 236 | 280 |
| 2005 | 238 | 280 |
| 2007 | 243 | 280 |
| 2009 | 241 | 283 |
| 2011 | 238 | 280 |
| 2013 | 240 | 282 |
| 2015 | 237 | 280 |
| 2017 | 236 | 282 |
| 2019 | 237 | 280 |
| 2022 | 227 | 274 |
| 2024 | 234 | 271 |
NAEP’s “below basic” category captures students who have not demonstrated mastery of grade-level math and lack foundational math skills. Figure A3 displays the percentage of NYS fourth-grade students scoring below basic in math across standards-reform cycles.
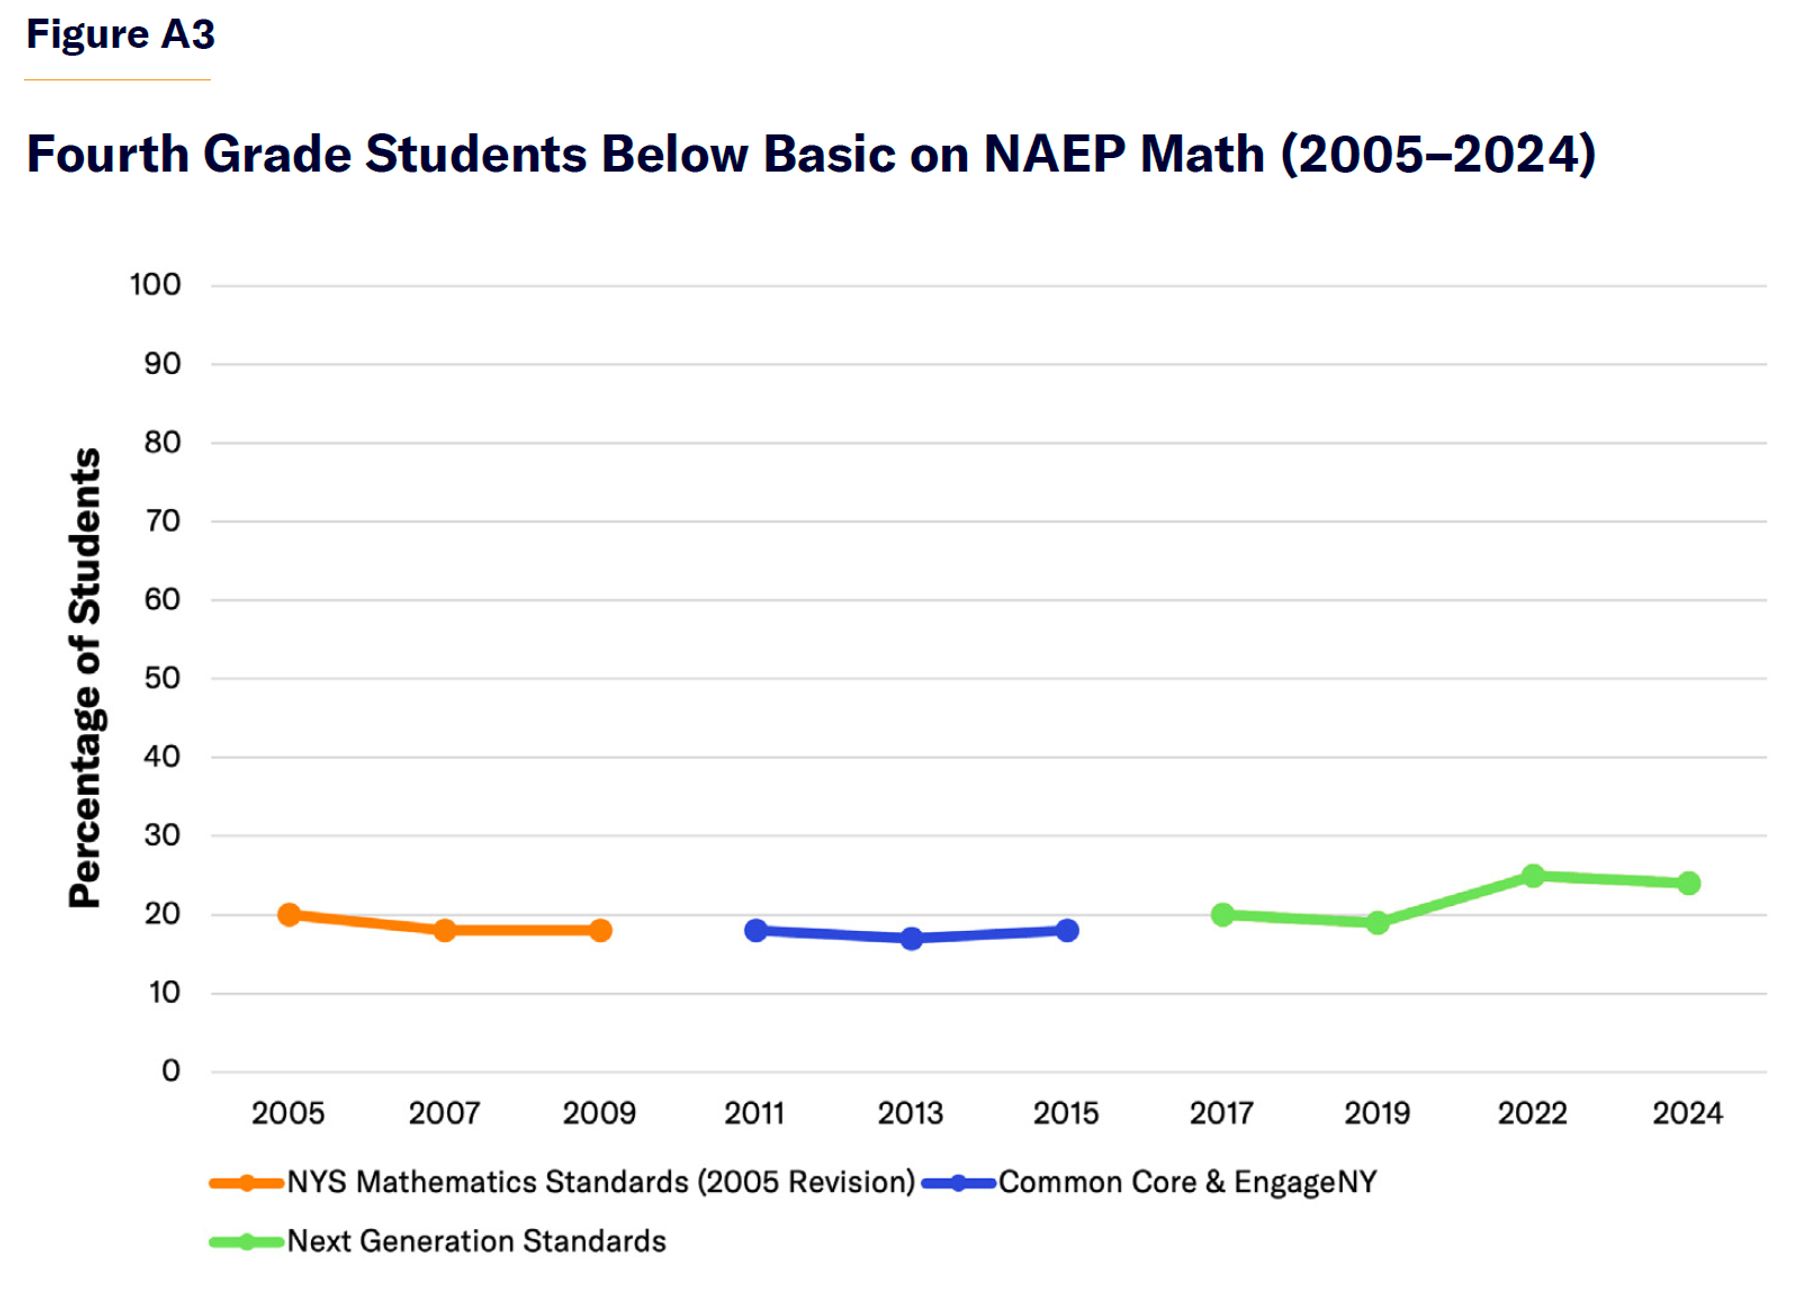
Figure A4 displays the percentage of NYS fourth-grade students scoring at or above the NAEP proficient level across standards-reform cycles.
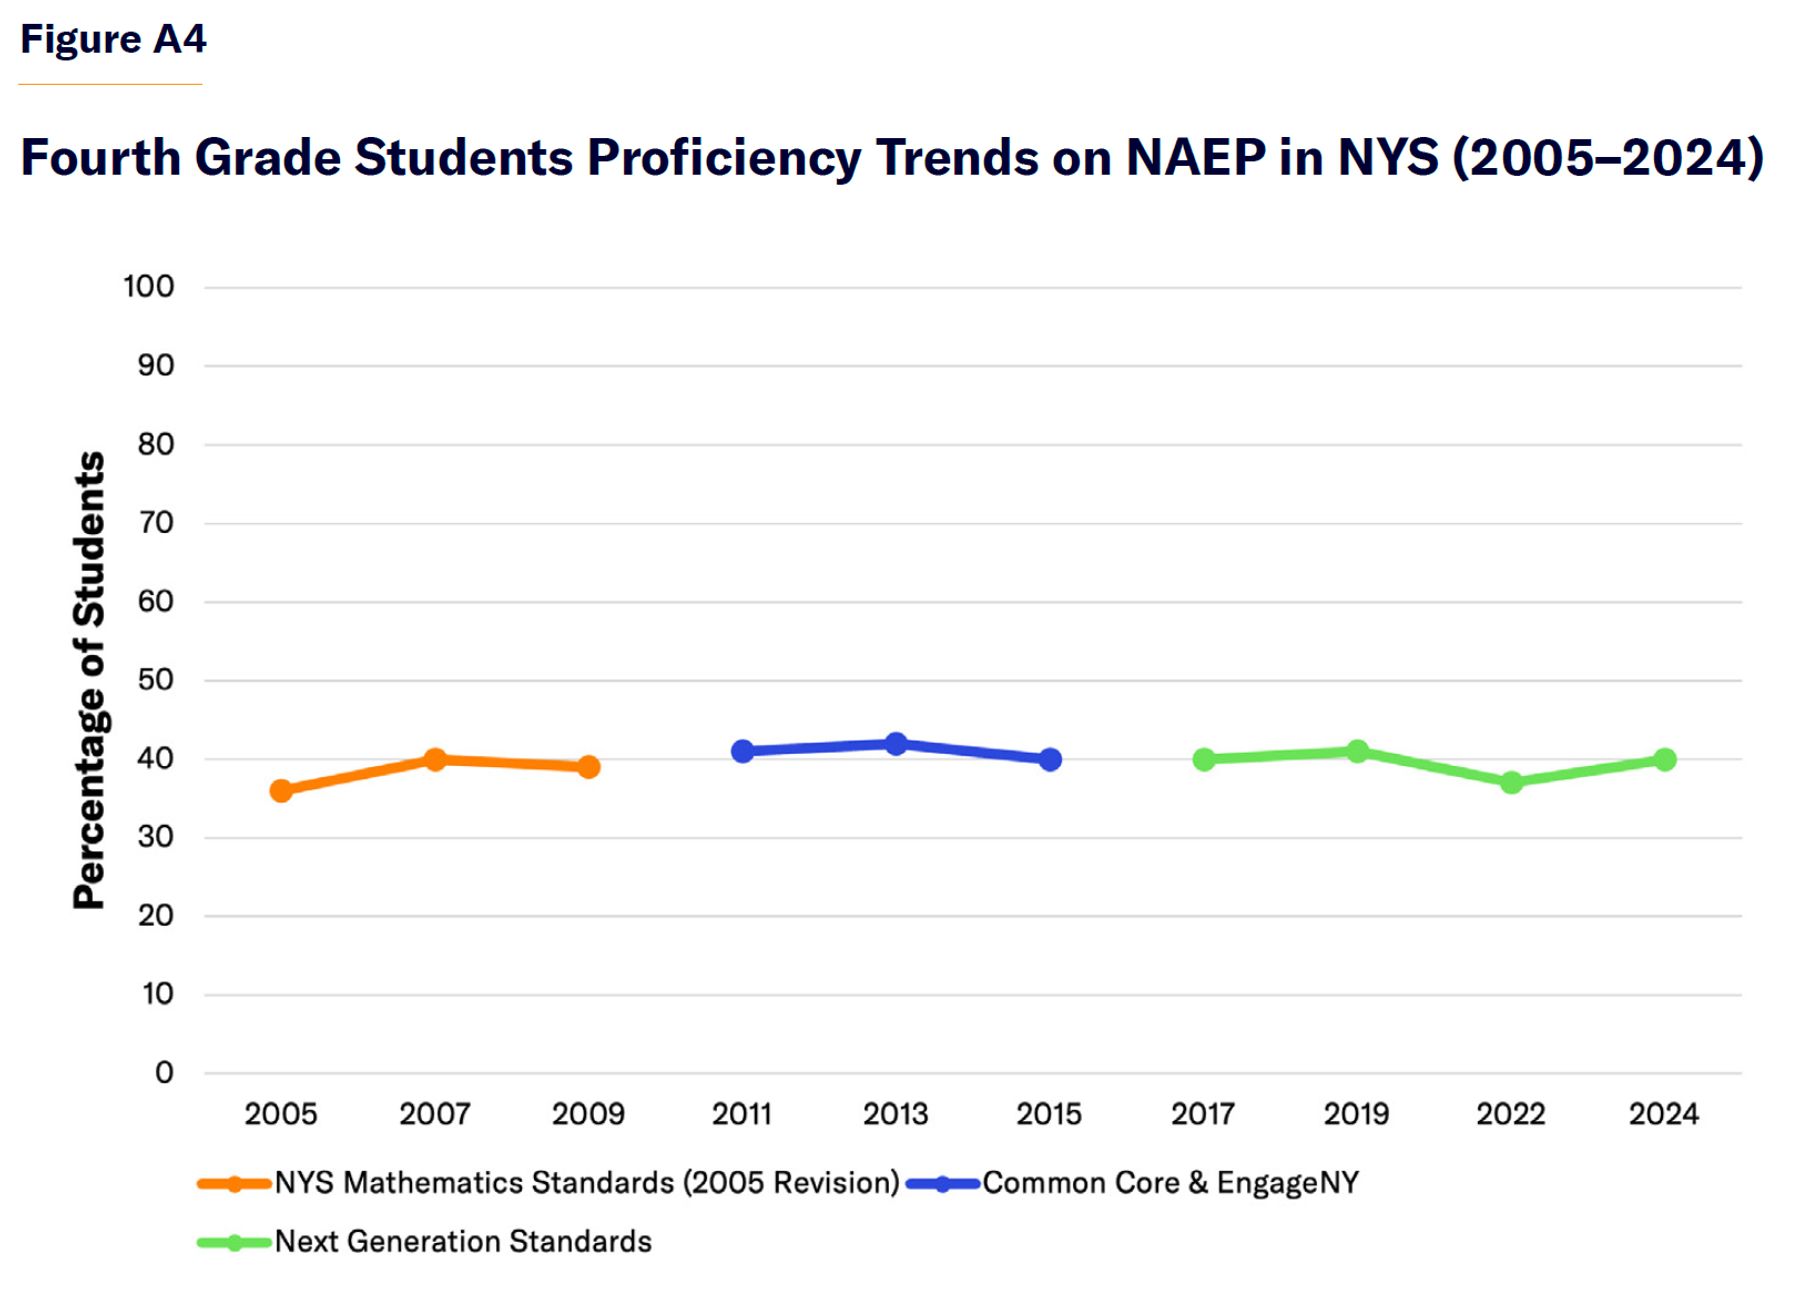
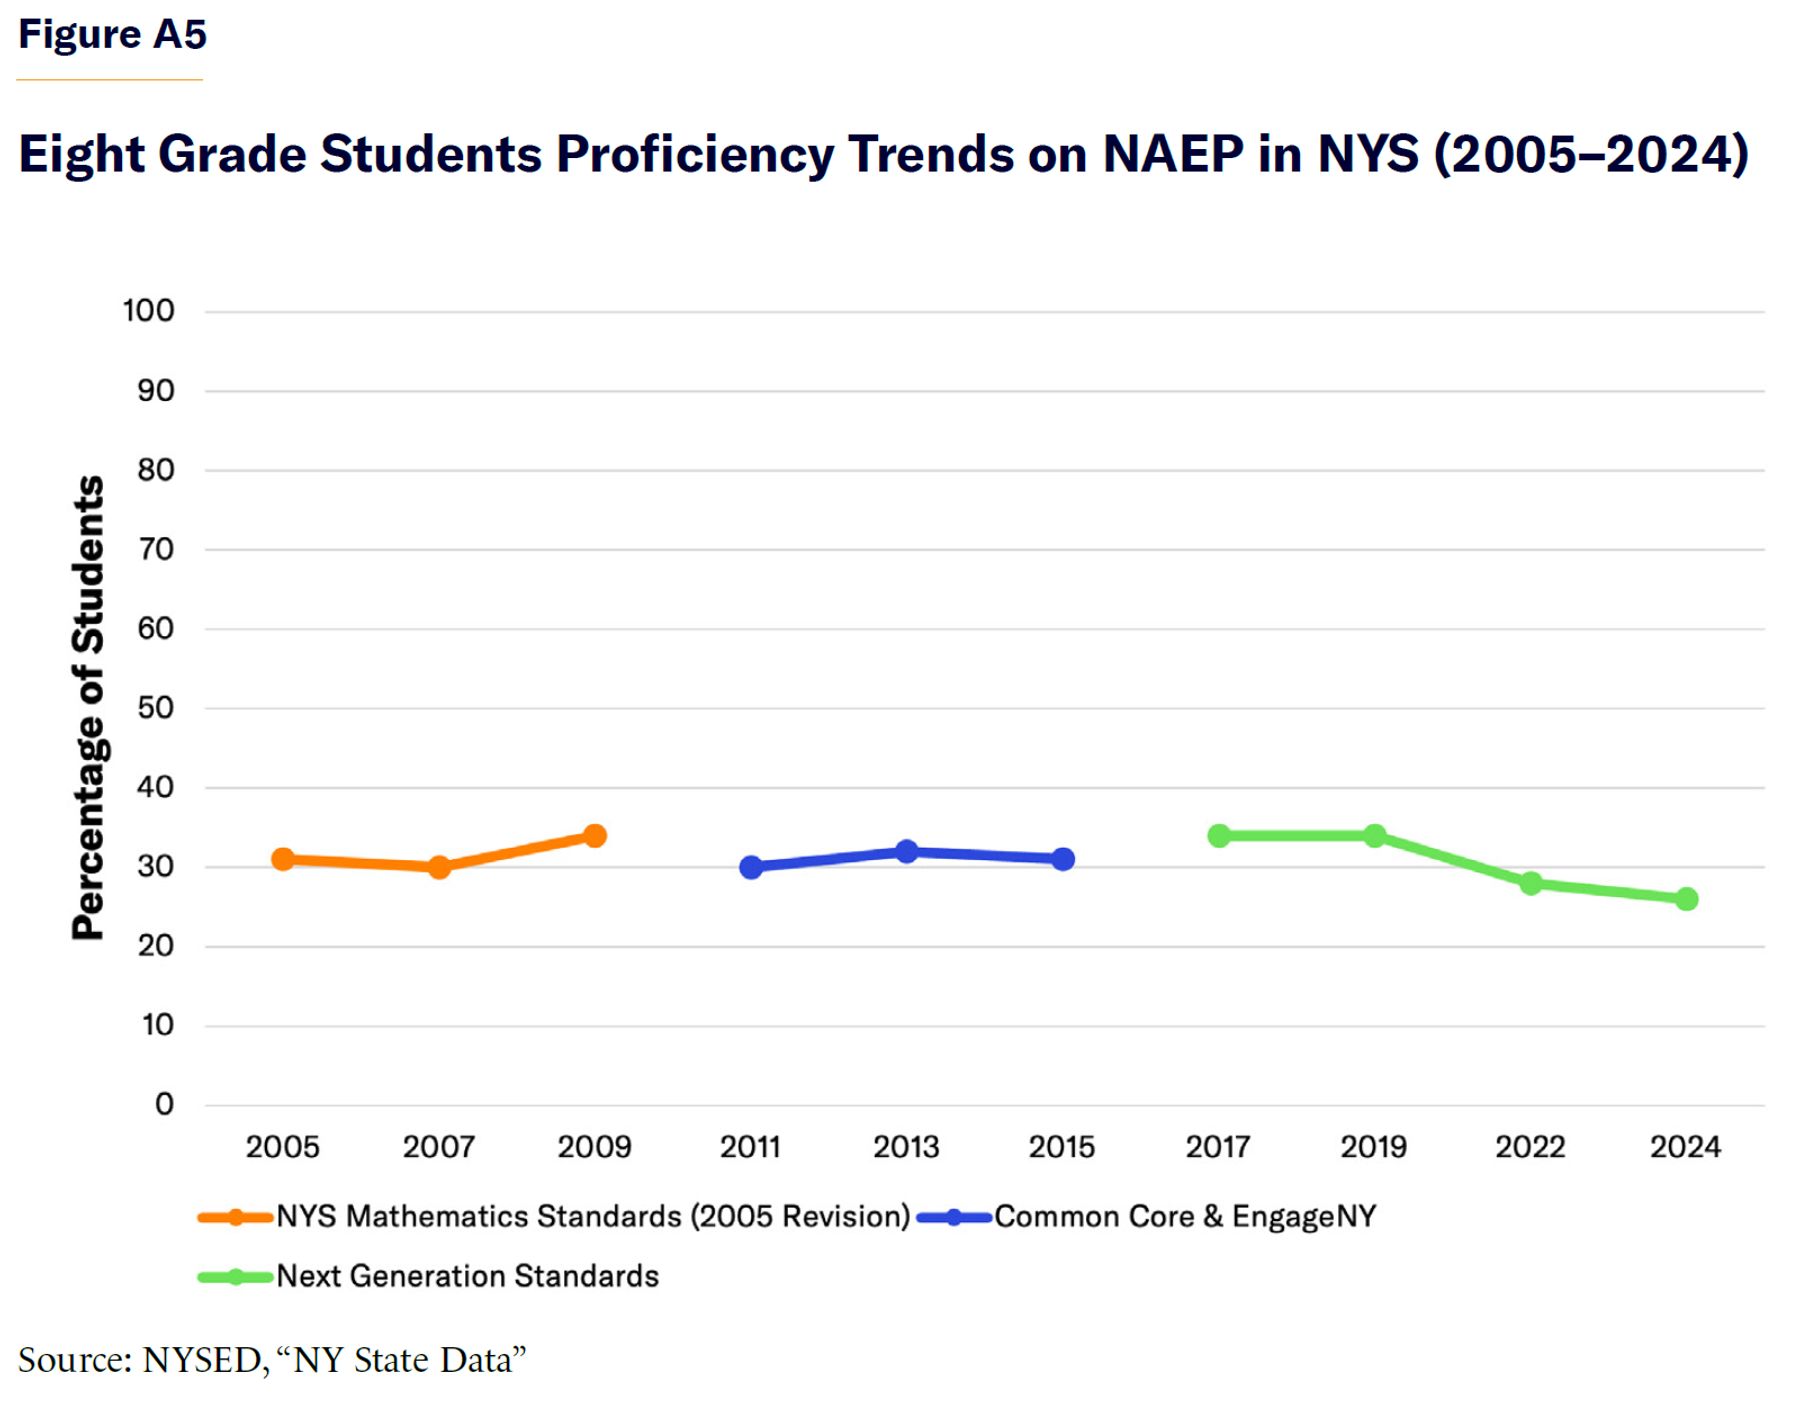
Figure A5 shows the percentage of NYS eighth-grade students scoring at or above the NAEP proficient level in math. In 2024, 26% of eighth-grade students in NYS scored at or above the proficient level.
State Assessment Results
NYS assessment results provide other information on student mathematics performance and disparities across student groups. Over the past decade, NYS has revised its math assessments, including changes to test design, scoring scales, and performance standards. As a result, proficiency thresholds are not directly comparable across years, and trends in state-reported proficiency should be interpreted cautiously (See Table A2).
Table A2
Minimum Score for Proficiency in Math (Level 3)[56]
| Years | Grade 4 | Grade 8 |
| 2011–2013 | 676 | 674 |
| 2014–2017 | 314 | 322 |
| 2018–2022 (Excluding 2020) | 602 | 610 |
| 2023–2025 | 450 | 450 |
Figure A6 displays Grade 4 NYS math assessment proficiency rates by race for available assessment years, from 2012–25.
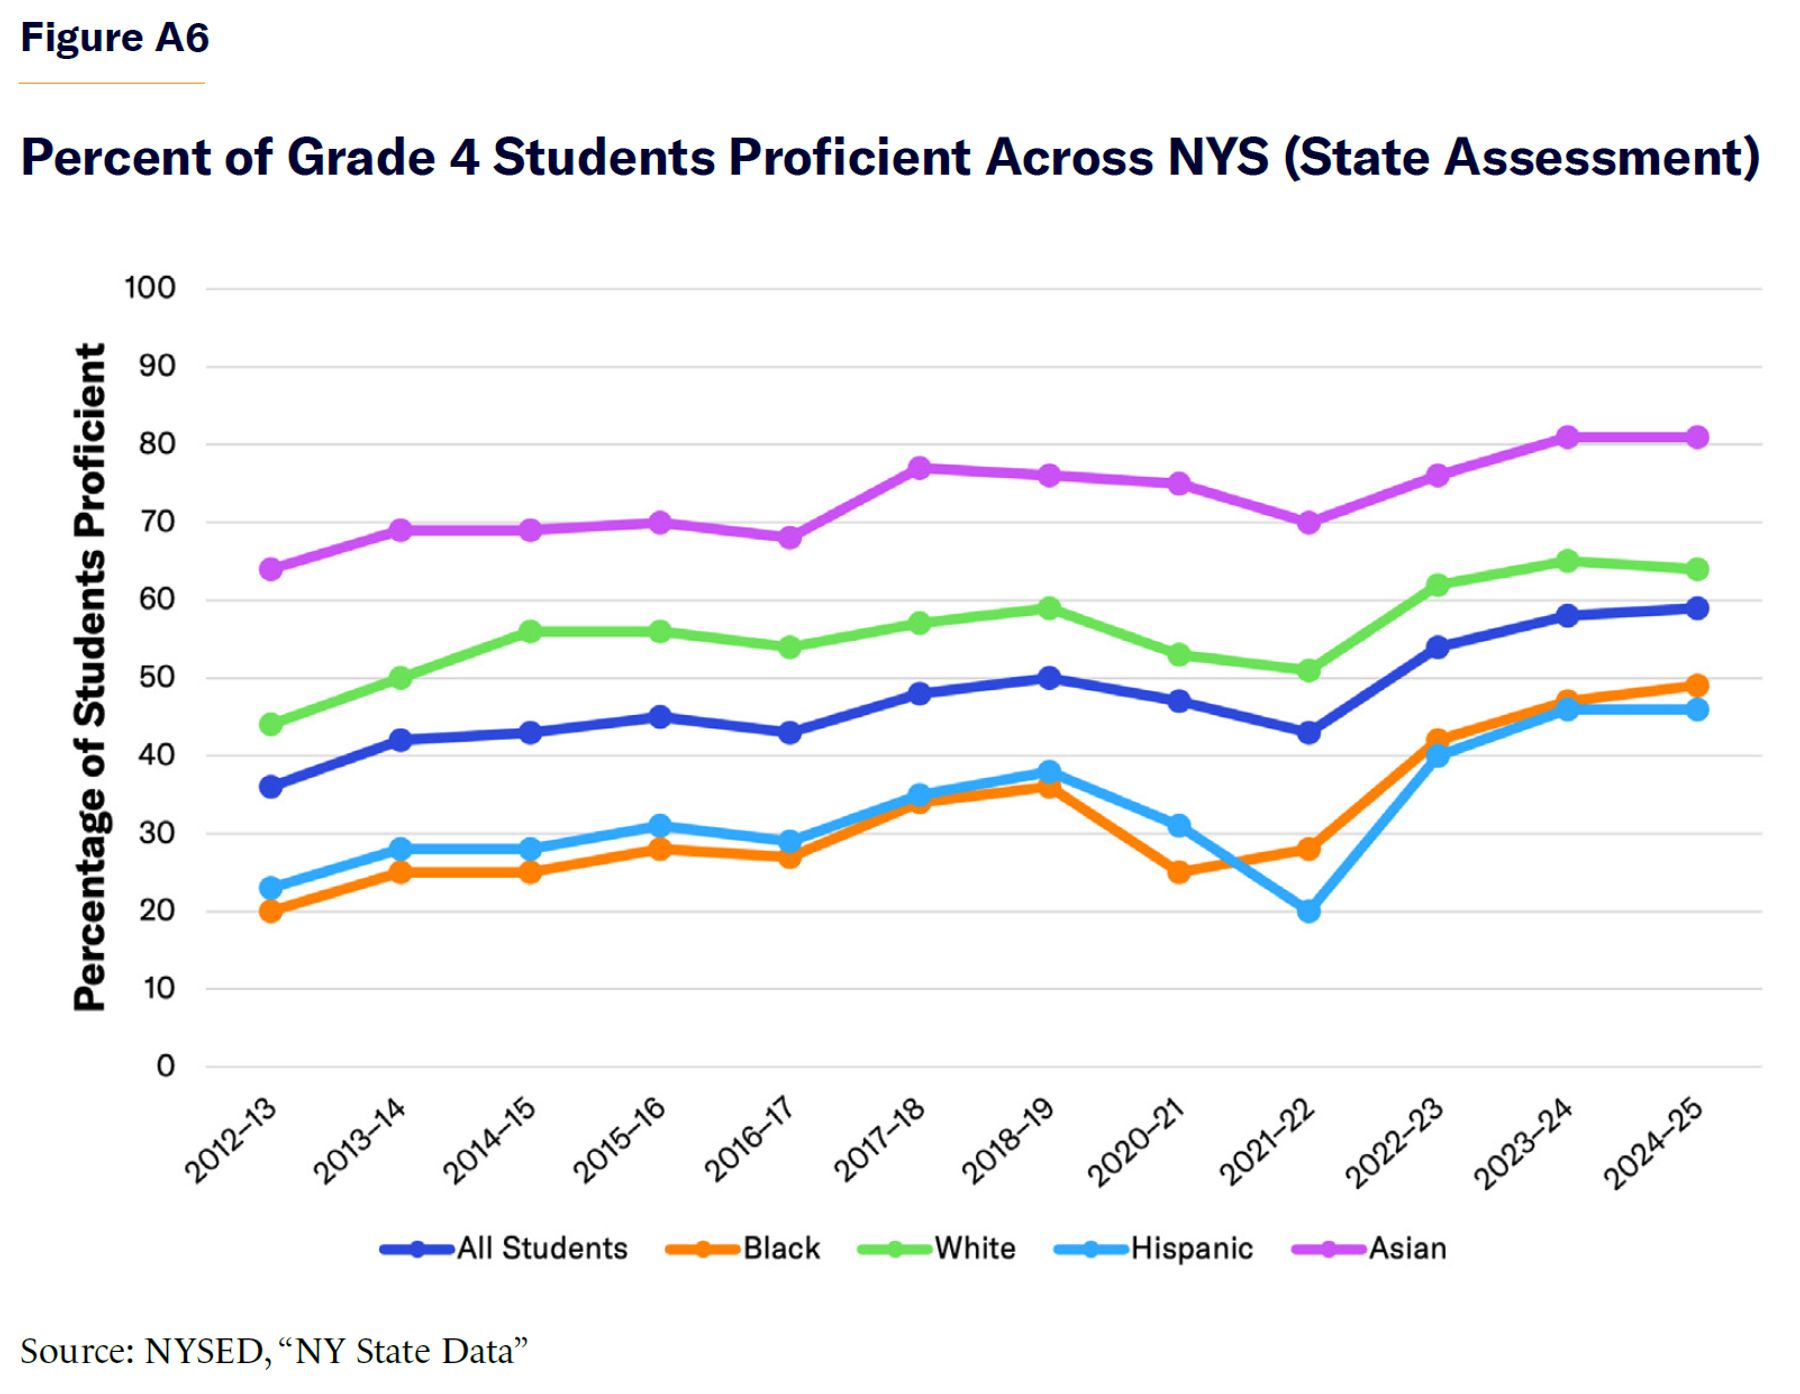
Figure A7 shows Grade 4 NYS math assessment proficiency rates by economic status.
During the 2024–25 school year, students with disabilities accounted for 22% of Grade 4 students, and 73% of those with disabilities participated in statewide testing (Table A3).
Table A3
Grade 4 NYS Math Assessment Proficiency for General Education vs. Students with Disabilities
| Year | Percentage of Enrolled Grade 4 Students Tested | Percent of tested students classified as Students with Disabilities | Percentage General Education Students Proficient | Percentage of Students with Disabilities Proficient |
| 2012–13 | 99% | 16% | 41% | 10% |
| 2013–14 | 97% | 17% | 48% | 13% |
| 2014–15 | 82% | 17% | 49% | 14% |
| 2015–16 | 82% | 17% | 51% | 15% |
| 2016–17 | 84% | 17% | 49% | 14% |
| 2017–18 | 81% | 17% | 54% | 17% |
| 2018–19 | 84% | 17% | 57% | 20% |
| 2020–21 | 49% | 14% | 52% | 18% |
| 2021–22 | 86% | 17% | 48% | 18% |
| 2022–23 | 87% | 17% | 60% | 25% |
| 2023–24 | 87% | 17% | 64% | 29% |
| 2024–25 | 88% | 18% | 65% | 29% |
Figure A8 shows Grade 8 NYS math assessment proficiency rates by race.
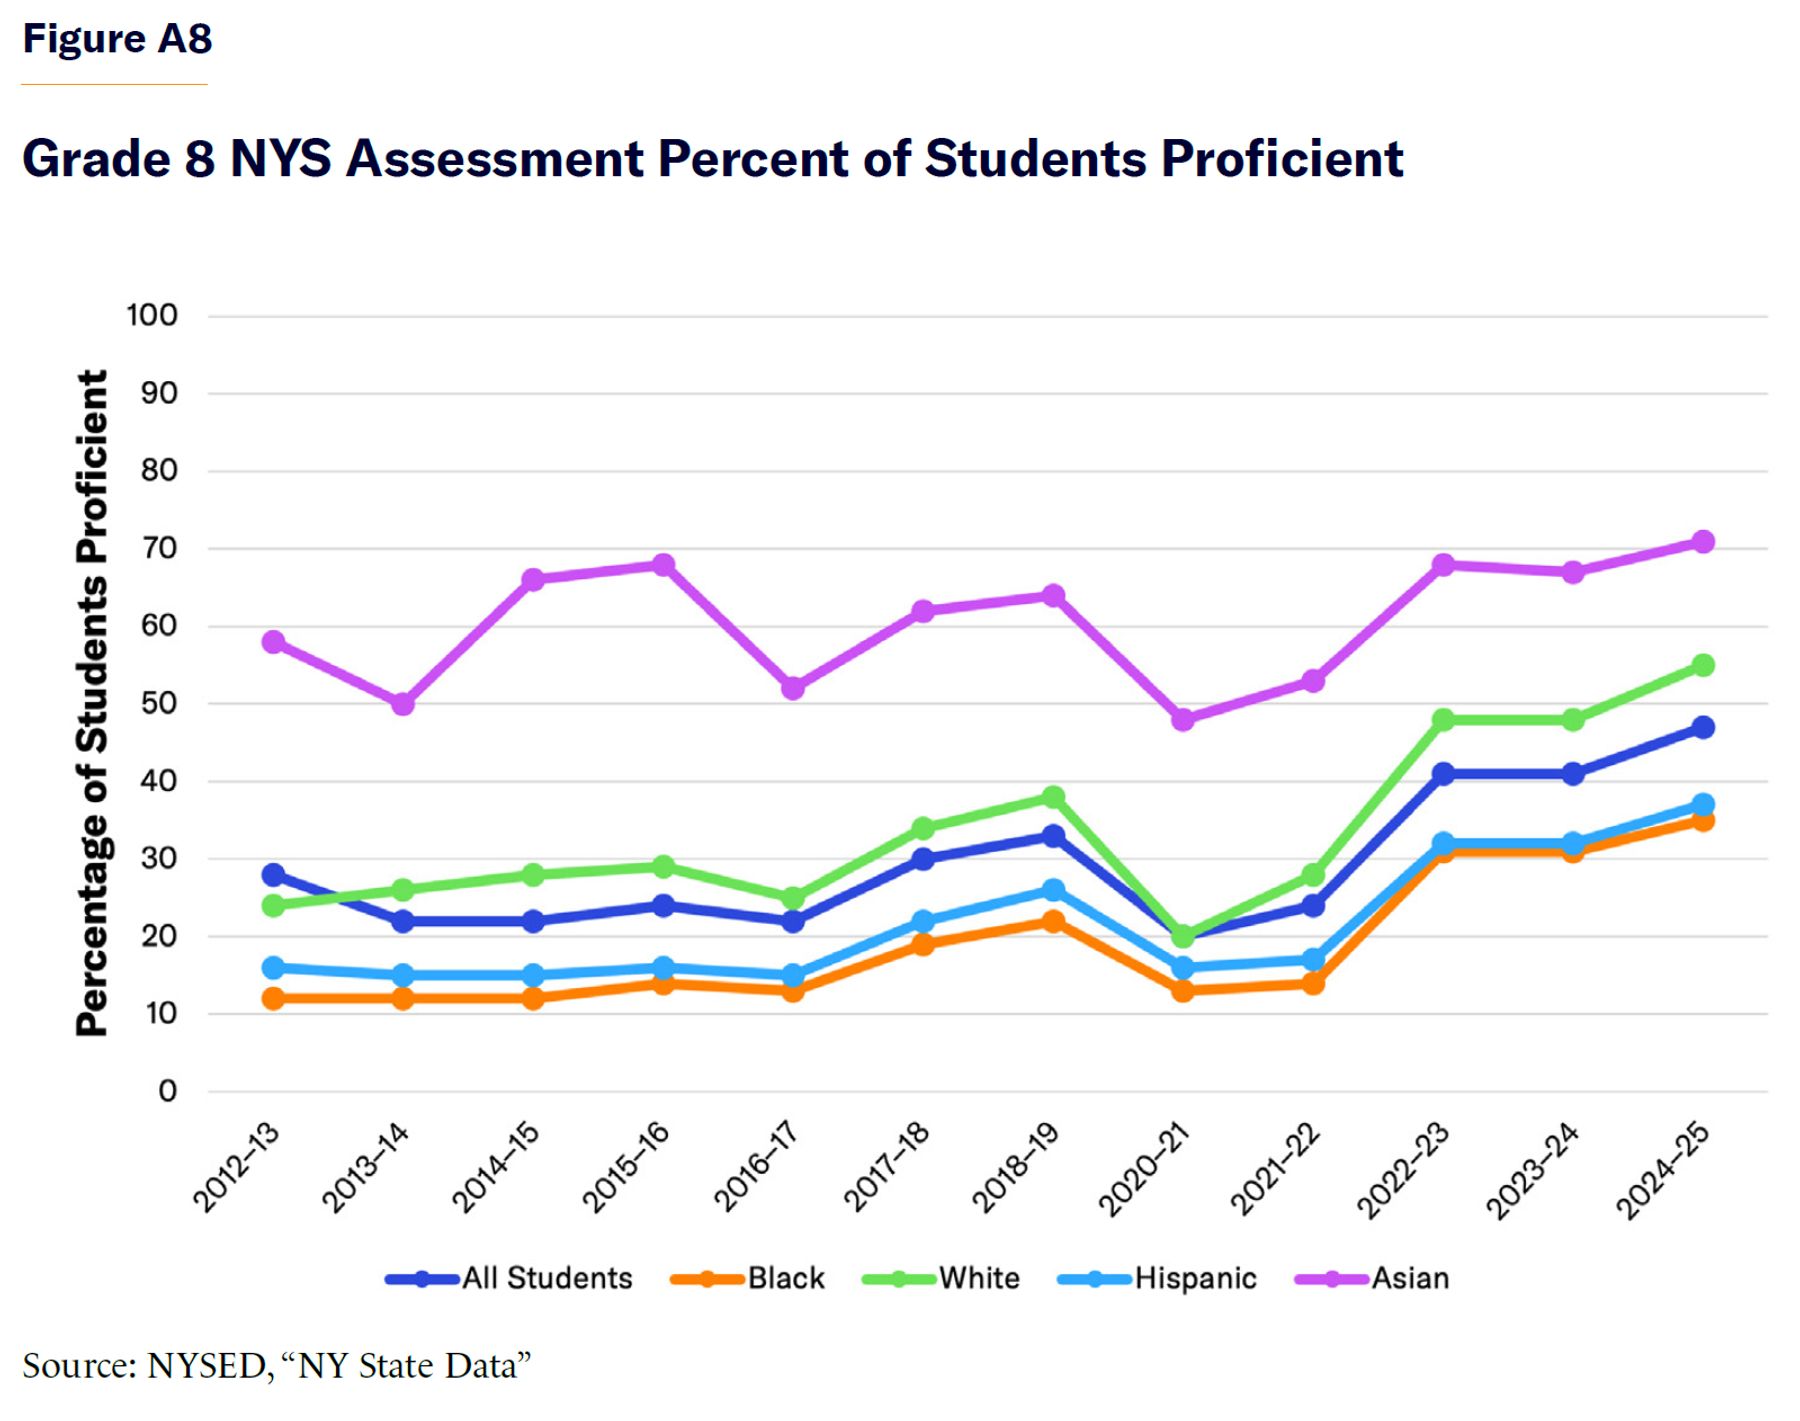
Figure A9 shows Grade 8 NYS math assessment proficiency rates by economic status.
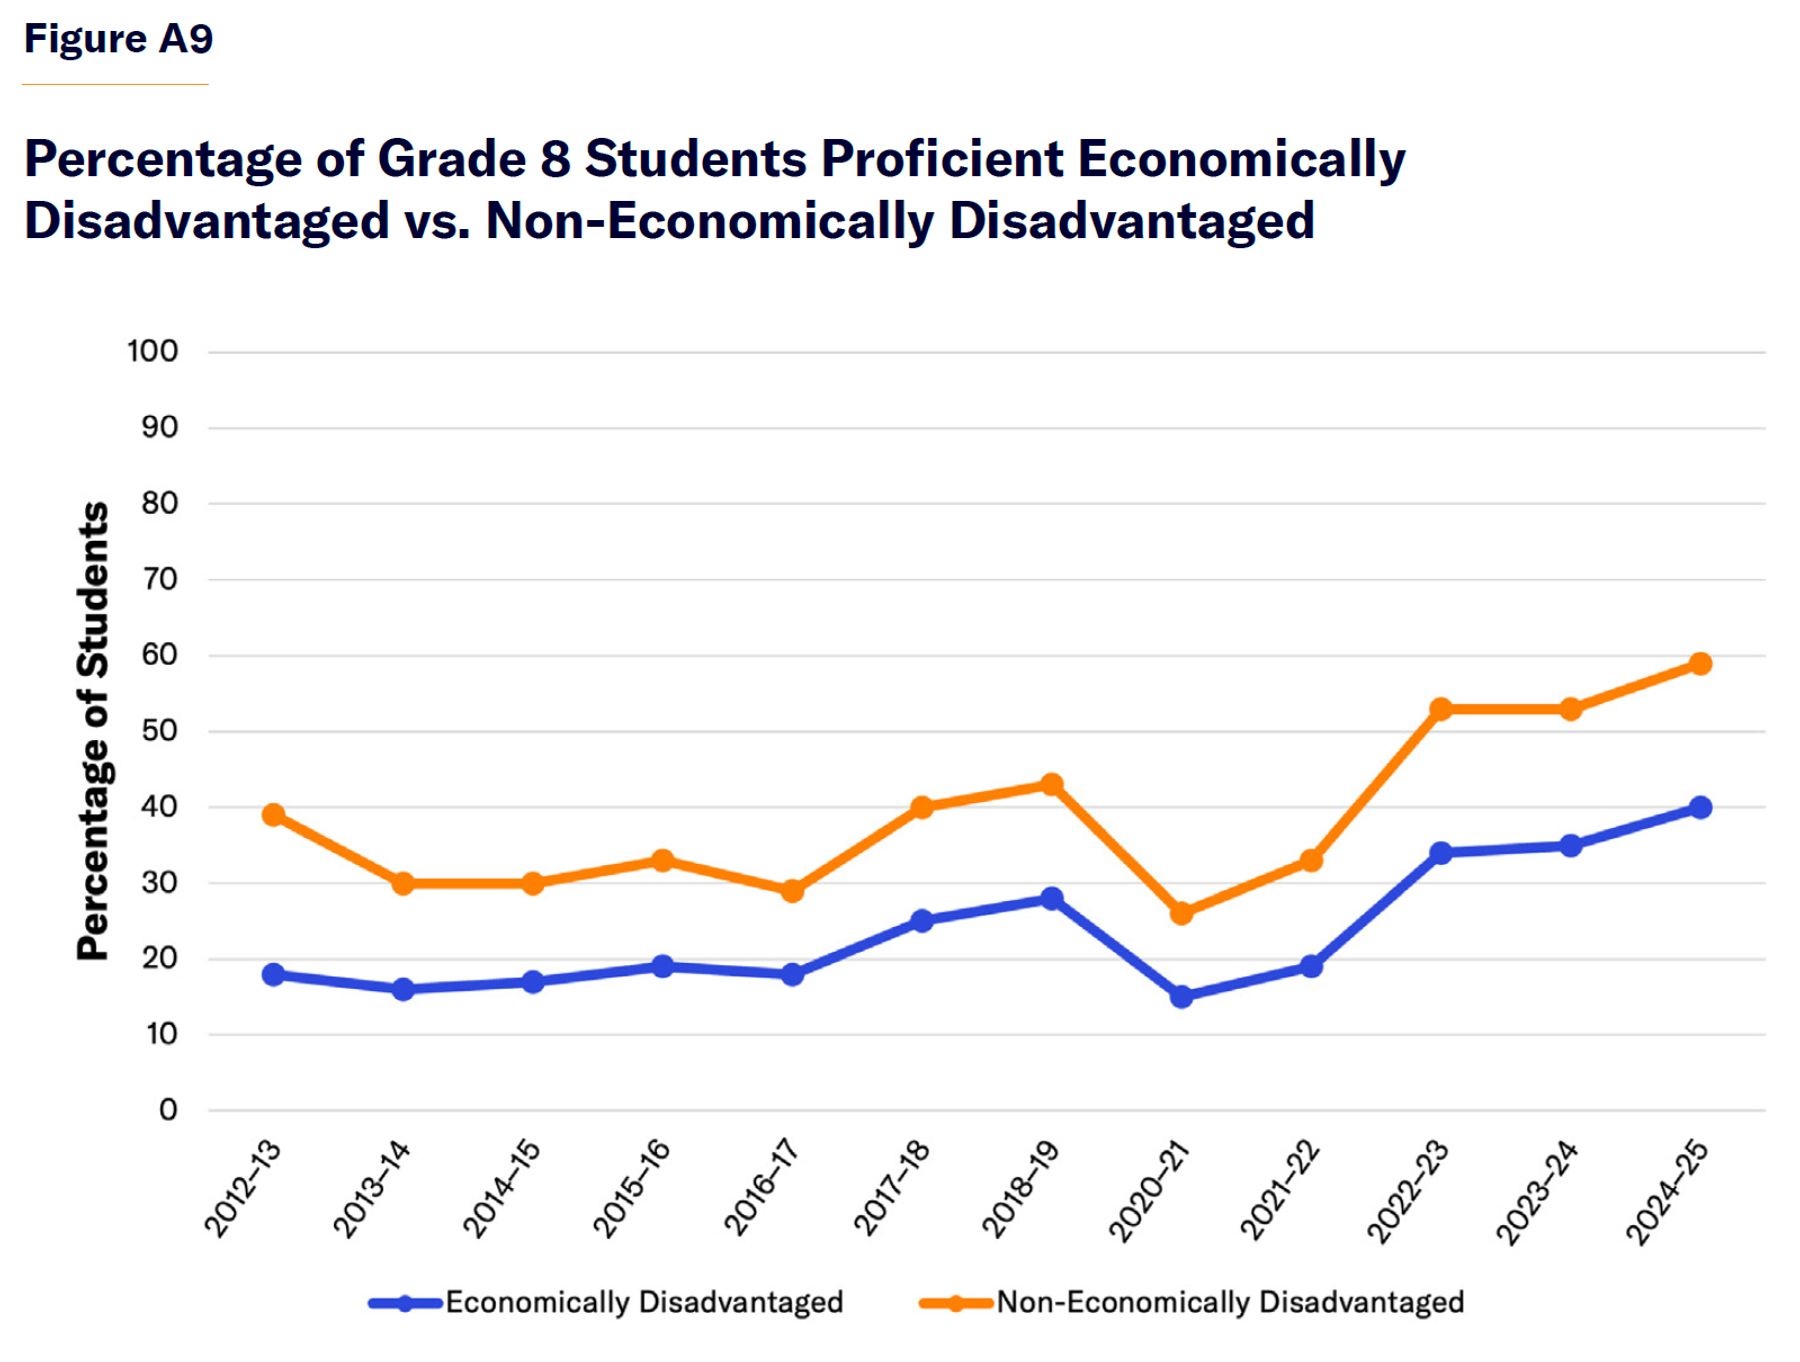
Table A4 represents Grade 8 math proficiency for general education students and students with disabilities.
Table A4
Grade 8 NYS Math Assessment Proficiency for General Education vs. Students with Disabilities
| Year | Percentage of Enrolled Grade 8 Students Tested | Percent of tested students classified as Students with Disabilities | General Education Students | Students with Disabilities |
| 2012–13 | 99% | 15% | 32% | 4% |
| 2013–14 | 73% | 19% | 26% | 5% |
| 2014–15 | 56% | 20% | 26% | 5% |
| 2015–16 | 53% | 20% | 28% | 5% |
| 2016–17 | 53% | 20% | 26% | 4% |
| 2017–18 | 51% | 21% | 36% | 8% |
| 2018–19 | 53% | 21% | 39% | 0% |
| 2020–21 | 21% | 19% | 23% | 6% |
| 2021–22 | 47% | 21% | 29% | 6% |
| 2022–23 | 49% | 21% | 47% | 7% |
| 2023–24 | 50% | 21% | 47% | 6% |
| 2024–25 | 50% | 21% | 53% | 21% |
Regents exam data reflect a selected testing population, rather than a full grade-level cohort. Unlike the grade 4 and grade 8 state math assessments, Regents exams are taken only by students who have progressed to specific courses and are eligible to take them. Algebra I results include students who take the course in middle school as well as those who take it later in high school, and Geometry results similarly reflect students who have progressed beyond Algebra I. Recent Regents exam results are shown in Tables A5–A8.
Table A5
NYS Regents Algebra I Percentage of Students Proficient by Race
| Year | All Students | Black | White | Hispanic | Asian |
| 2013–14 | 68% | 43% | 81% | 49% | 85% |
| 2014–15 | 63% | 39% | 76% | 46% | 81% |
| 2015–16 | 72% | 55% | 86% | 59% | 87% |
| 2016–17 | 74% | 59% | 88% | 63% | 89% |
| 2017–18 | 70% | 61% | 91% | 67% | 85% |
| 2018–19 | 71% | 53% | 85% | 57% | 87% |
| 2021–22 | 66% | 46% | 81% | 51% | 85% |
| 2022–23 | 65% | 47% | 80% | 52% | 84% |
| 2023–24 | 62% | 43% | 80% | 47% | 84% |
| 2024–25 | 56% | 40% | 72% | 44% | 79% |
Table A6
NYS Regents Algebra Percentage of Students by Group
| Year | General Education | Students with Disabilities | Economically Disadvantaged | Non-Economically Disadvantaged |
| 2013–14 | 74% | 30% | 54% | 83% |
| 2014–15 | 68% | 26% | 48% | 77% |
| 2015–16 | 78% | 41% | 62% | 83% |
| 2016–17 | 81% | 45% | 67% | 86% |
| 2017–18 | 83% | 58% | 72% | 90% |
| 2018–19 | 78% | 42% | 62% | 84% |
| 2021–22 | 57% | 18% | 37% | 67% |
| 2022–23 | 71% | 36% | 55% | 81% |
| 2023–24 | 69% | 35% | 51% | 80% |
| 2024–25 | 63% | 22% | 46% | 75% |
Table A7
NYS Regents Geometry Percentage of Students Proficient by Race
| Year | All Students | Black | White | Hispanic | Asian |
| 2014–15 | 63% | 32% | 65% | 41% | 78% |
| 2015–16 | 42% | 29% | 56% | 30% | 78% |
| 2016–17 | 64% | 36% | 77% | 46% | 79% |
| 2017–18 | 67% | 41% | 80% | 50% | 81% |
| 2018–19 | 70% | 45% | 83% | 52% | 83% |
| 2021–22 | 53% | 21% | 69% | 30% | 72% |
| 2022–23 | 53% | 25% | 70% | 33% | 72% |
| 2023–24 | 57% | 29% | 74% | 37% | 77% |
| 2024–25 | 60% | 33% | 75% | 40% | 78% |
Table A8
NYS Regents Geometry Percentage of Students by Group
| Year | General Education | Students with Disabilities | Econ. Disadvantaged | Non-Economically Disadvantaged |
| 2014–15 | 65% | 30% | 49% | 74% |
| 2015–16 | 44% | 21% | 35% | 51% |
| 2016–17 | 66% | 31% | 50% | 75% |
| 2017–18 | 70% | 35% | 54% | 79% |
| 2018–19 | 73% | 38% | 58% | 81% |
| 2021–22 | 57% | 18% | 37% | 67% |
| 2022–23 | 57% | 22% | 39% | 68% |
| 2023–24 | 61% | 25% | 43% | 73% |
| 2024–25 | 63% | 28% | 45% | 75% |
Endnotes
Photo: Maskot / DigitalVision via Getty Images
Are you interested in supporting the Manhattan Institute’s public-interest research and journalism? As a 501(c)(3) nonprofit, donations in support of MI and its scholars’ work are fully tax-deductible as provided by law (EIN #13-2912529).