Robbing Peter to Pay Peter: Netting Taxes and Transfers to U.S. Households

Photo: JJ Gouin/iStock
Executive Summary
The goal of any social welfare system is to provide resources to those who are in need, by taxing those who are judged to have enough. Such programs, sometimes known as transfers or, in another form, entitlements, are supposed to redistribute income from those who are better off to those who are worse off. Much of the modern American welfare state does this, and thus substantially equalizes the incomes of those who pay more in taxes and those who receive more in government benefits.
But modern American welfare programs are much broader and less targeted at the poor than in earlier eras and often go to middle-class or even high-income households. At the same time, taxes reach far down the income scale and affect most households, to some extent. This means that many of the individuals, families, and households that receive benefits from the government also pay substantial amounts of taxes.
This report studies how much of the American welfare state consists of returning funds to the same households that paid at least that amount in taxes in the same year. By most measures, such a system of taxing and returning the same amount of money is a pure waste, since both the taxes and transfers limit households’ options, and there is a bureaucratic cost to circulating income from households to the government and back to households.
This report estimates that approximately 20% of the American social welfare state is spent simply returning income to the same households that already paid that amount in taxes in the same year. I refer to this as a “netting tax,” a tax that cancels or nets out equivalent transfers. For example, if a household paid $2,000 in taxes and received $5,000 in benefits in one year, the $2,000 would be counted in this report as a netting tax.
One could think of it as a “robbing Peter to pay Peter” tax: the taxes and transfers lead to no redistribution whatsoever. Surprisingly, netting taxes represent an even larger share of welfare spending when one focuses on those households that rely more on means-tested programs, where the explicit goal is redistribution. In a complicated tax and transfer system, with numerous kinds of taxes and transfers, some amount of overlap between the two is inevitable; but an overlap of this size is not. This report analyzes why the overlap is so large and which types of households it affects, and it proposes reforms to limit the overlap.
There have been many attempts to reorganize the tax and transfer system in order to simplify them, by reducing deductions and credits to lower tax rates, or by reducing and streamlining welfare programs. But given the interrelated nature of taxes and transfers, policymakers should look at reforming both systems in tandem. By reducing netting taxes, we could substantially reduce both taxes and transfers without any cost to households or even any change in the redistributive function of the welfare state. Such a reduction would bring large benefits to families and the government by increasing options and reducing waste.
Effects of the Combined Tax and Transfer System
Most research that looks at the combined effects of taxes and transfers focuses on the redistributive effects or the marginal tax effects of both systems. Research on the redistributive effects shows that the progressive tendencies of taxes and transfers significantly reduce income inequality and poverty.[1] Research on marginal tax rates (the proportion of an extra dollar earned that will be taken by taxes) shows that when the benefit phase-outs of means-tested welfare programs—such as reductions in Medicaid, food stamps, or housing benefits due to increased household income—are added to income-tax rates, the implicit marginal tax rates on some welfare-receiving households can approach 100%.[2] In other words, earning an extra dollar can cause these households to lose up to a dollar in higher taxes and reduced transfers.
But this research has not looked at the size of overlap between taxes and transfers to the same households. There has been related research on the expansion of the middle-class welfare state, where middle-class households are understood to receive substantial amounts of government benefits and pay a substantial amount of taxes, but the size of that overlap is not estimated.[3] Previous research has focused on the net impact of taxes and transfers, on either marginal tax rates or redistribution; this report focuses on the gross size of the overlap and its implications.
One could argue that netting taxes are not worth studying because they have no “net” effect on income. Yet there are numerous potential costs, and a few potential benefits, to consider when looking at netting taxes.
Costs of Netting Taxes
One of the most important costs of netting taxes is marginal tax rates on income from the tax side and from the means-tested welfare side. Even a redistribution and tax scheme that involves zero net change in household income can change behavior in negative ways. Marginal tax rates obviously reduce work.[4] There is also a literature on how tax and welfare policies reduce incentives for marriage.[5] While previous literature has noted the combined marginal tax rate of taxes or transfers, it has tended to overlook how taxes and transfers could be reduced in tandem to lower that marginal rate with minimal effects on actual income taken by and received from (in taxes and transfers, respectively) the government.
Another substantial cost of netting taxes is that it limits the use of funds, restricting them through vouchers or in-kind benefits. This happens when a housing voucher, food stamps, medical insurance, or heat subsidy replaces cash already earned by the household. These types of in-kind transfers restrict spending options and reduce the value of transfers for families. For example, Amy Finkelstein, Nathaniel Hendren, and Erzo Luttmer estimate that recipients generally value Medicaid at less than the cost of providing it.[6] Other evidence, such as black-market trading and consequent trading discounts on food stamps, also shows that in-kind benefits are undervalued relative to cash.[7]
There are also costs of government and private bureaucracy, on the tax collection side as well as on the transfer distribution side. Similarly, households face costs to comply with tax rules and to secure benefits.[8] Fraud and improper payments usually account for an important percentage of total expenditures for benefit programs, and the bureaucratic costs to countering fraud and improper payments are substantial.[9] There are also potential costs of timing, such as when taxes and transfers upset the regularity of income, including when tax refund delays lead to demands for short-term loans.[10] In all these ways, even if netting taxes create no change in nominal incomes, they increase burdens and limit options for households.
Potential Benefits of Netting Taxes
The potential benefits of netting taxes are more speculative. There could be benefits from some in-kind transfers if the government could exercise its purchasing power or national scope to reduce prices or improve services.[11] But most estimates are that such in-kind transfers are significantly undervalued relative to cash, as noted above.
There are possible benefits if one thinks that individuals would spend their own funds poorly and that paternalism from the government could improve their well-being. But researchers typically assume that those who earn significant income and are taxed for it understand their own well-being better than the government.[12] And even many in-kind welfare programs are broad enough to allow households to secure goods that paternalists try to restrict, such as snacks from food stamps.
A more likely benefit of netting taxes could include some income smoothing, so that a household’s income does not face extreme fluctuations due to job loss or a significant unexpected expense. Some transfers (such as unemployment insurance or disability payments) could offset declines in income, but it is not clear that those income-smoothing policies are structured in a way that is best for recipients. Some policies, as mentioned above, are even anti-smoothing, such as when tax withholding combined with refundable tax credits leads to lump-sum payments after a year of paying taxes. And if the income smoothing merely transfers some amount of taxed income from earlier to later in the year, as would be necessary for, say, unemployment benefits, to count as netting taxes for this report, the income-smoothing effects would be minimal.[13]
There are potential positive externalities, or benefits for those beyond the recipients, for a limited number of transfers, especially education funding and some types of health insurance for the young.[14] But most government transfers (such as food stamps, general welfare, Social Security, and Medicare) do not have plausible uninternalized externalities, i.e., there are not general social benefits for most of them beyond the benefits to the individuals who receive them. Some programs, such as funding for college and housing vouchers, can even have negative externalities in supply-constrained situations—in terms of driving up costs and decreasing responsiveness—that can more than make up for any plausible positive externalities.[15]
Leaky Buckets and Deadweight Losses
Most likely, the large costs of netting taxes—especially in terms of marginal tax rates, undervalued in-kind benefits, and administrative costs—overwhelm any minimal and speculative benefits. As economist Arthur Okun noted in the 1970s, any welfare program involves a “leaky bucket,” where some of the funds are lost to disincentive effects on the receivers of the funds, some on the disincentive effects of those who are taxed, and some on administration itself.[16] It is not unreasonable to assume that 50% or more of netting taxes could be deadweight losses, depending on the type of taxes paid and the type of transfers received. The deadweight losses from income taxation alone are often assumed to be up to 30% of funds raised.[17] Comparable losses can be assumed for the marginal tax rates on means-tested programs. The administrative costs of many transfer programs tend to be about 10%, and there are substantial unmeasured administrative costs for the recipients of transfers in applying for and continuing to receive them.[18] There is also a loss in utility for individuals or families when they receive an in-kind benefit instead of cash.
Any proportion of a tax and transfer program that operates effectively as a netting tax in a short period can be categorized as wasteful. (The period evaluated in this report is one year.) At the very least, understanding the size of the netting tax is valuable for understanding how to better target and design a combined tax and transfer system.
Sources and Methodology
In contrast to many studies of the redistributive or other effects of the tax and transfer system, which can rely on quantile or percentile categories, any plausible estimate of netting taxes must use individualized or household data to calculate the amount of taxes and transfers paid by the same individuals or households in a set period. This report uses data from the Current Population Survey Annual Social and Economic Supplement (CPS ASEC), which surveys approximately 75,000 households a year, to get individual reports of taxes and transfers to households.[19] CPS ASEC is used across the social sciences to estimate the scope of tax and transfer programs, but it has not been applied to estimating the size of the overlap between taxes and transfers.
In the CPS survey, most transfer income is self-reported. The market costs of a handful of transfers, especially Medicare and Medicaid, are estimated from general data and the demographic information on households after they have reported receipt of the transfers. The dollar estimates for these programs are provided in the CPS only for 2009–11, so this report uses only these years for its baseline estimates.[20] Individual and household taxes are estimated by the Census Bureau based on income and demographic factors. The surveys are conducted around March and ask questions concerning the previous calendar year (thus, 2009’s survey contains information from calendar year 2008). For a robustness check, I will estimate the overlap of tax and transfer system from the reduced number of available transfer programs in the 2018–23 CPS surveys, and compare the overlap for the same transfer programs in the earlier period. (It is a reduced number because dollar amounts for Medicare, Medicaid, and family housing subsidies are not contained in CPS surveys after 2011.) I will also create an estimate of netting taxes from the American Community Surveys in 2011 and 2016. The American Community Survey (ACS) has an even more limited number of reported transfers, but it can demonstrate whether there are similar levels of tax and transfer overlap for those that it measures.[21]
One of the largest issues for CPS is that transfer income is substantially underreported. One study estimates that roughly half of traditional welfare, food stamps, and workers’ compensation are not reported in the survey.[22] But the larger programs, such as Social Security and Medicare, have reporting rates of about 90%; and wage income and taxes, if aggregated from CPS weighted samples, appear close to national estimates from other government agencies. This report will use similar calculations from the extrapolated reports of transfers compared with national spending figures in order to estimate the proportion of reported transfers in the surveys.
The transfers that this report measures from CPS ASEC are Social Security Old Age and Survivor’s Insurance, the market value of Medicare insurance, the market value of Medicaid insurance, Supplemental Security Income, unemployment insurance, school lunch programs, housing subsidies, energy subsidies, food stamps (Supplemental Nutrition Assistance Program, or SNAP), and general welfare (largely, Temporary Assistance for Needy Families, or TANF).[23]
The only two taxes measured in the baseline estimates are the federal income tax and Federal Insurance Contributions Act (FICA), or payroll, taxes. The income taxes are calculated after all credits and deductions. FICA is doubled to account for the employer side of tax payments, which most economists estimate is fully borne by workers.[24] The estimates are also performed separately with state income taxes, much of which support combined state-federal welfare programs such as Medicaid. As will be noted below, these calculations still omit substantial portions of the U.S. tax system and thus substantially underestimate the tax burden on households receiving transfers. Although the surveys identify individuals, and some transfer programs are reported for individuals, this report estimates transfers, taxes, and netting taxes by households, which generally share resources.[25]
Results by Household Type
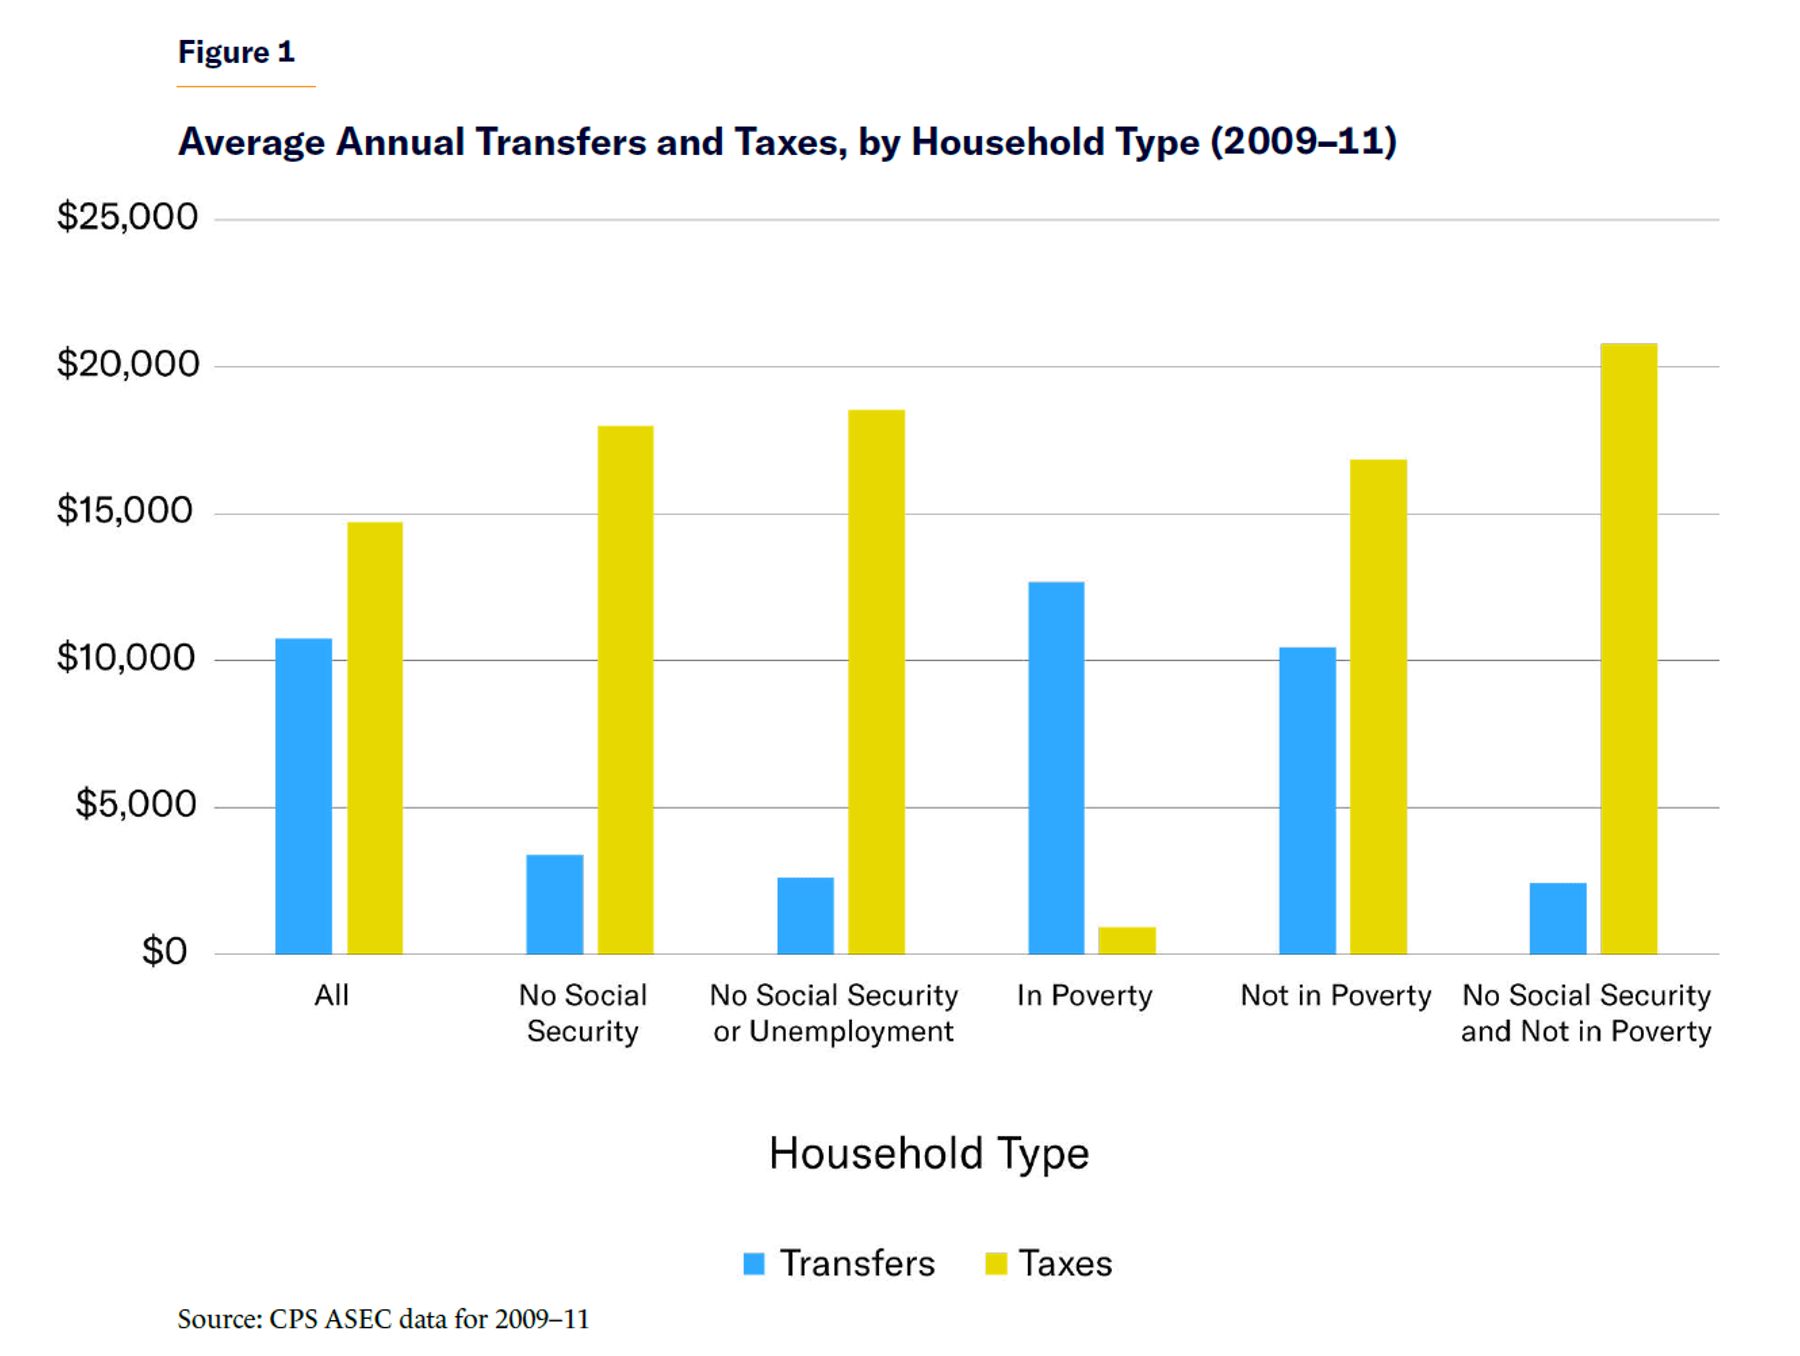
During 2009–11, households averaged $10,740 in transfers and $14,700 in federal taxes per year, but there was extreme variation in those totals, depending on the type of households. Not surprisingly, taxes were highest for households not in poverty and those not receiving Social Security; and transfers were highest for those households in poverty and those receiving Social Security. From these tendencies (Figure 1), a reader might assume that the U.S. tax and transfer system is well targeted. But this obscures the fact that those not in poverty and not receiving Social Security are a much larger proportion of the population and thus receive a large proportion of all transfer income.
For example, 84% of total reported transfers were going to households that were not in poverty and therefore often pay substantial taxes.[26] Even if such non-impoverished households receive fewer transfers than those in poverty, they are more likely to pay substantial taxes, compared with whatever transfers they do receive, thus increasing the total proportion of netting taxes.
Over the surveyed period, out of the average $10,740 of transfers per household per year, the average netting tax was $2,054 per household per year. Therefore, more than 19% of all transfers to households were returned by those same households as federal taxes in the same year (Figure 2).[27]
One could imagine that much of these netting taxes involve seniors on Social Security, especially since Social Security income is explicitly taxed and thus represents a rare type of intended netting tax. A large portion of all transfers do go to seniors as Social Security, but if we exclude all those households with Social Security income, the proportion of netting taxes in all transfers among the remaining household types rises.
The average transfers for non–Social Security households are $3,372, but federal netting taxes for those households are $973, or nearly 29% of all transfers.[28] In other words, for households that do not receive Social Security payments, nearly 29% of welfare transfers are canceled out by federal taxes within the same year. If we also exclude those households that received unemployment payments, which are explicitly taxed as well, we still have $2,583 in transfers, as against $564 in netting taxes, or 22% of all transfers returned in taxes.
Therefore, these households, where means-tested transfers make up a larger proportion of all transfer programs, surprisingly have higher rates of netting taxes than households that receive transfer programs like Social Security and unemployment—programs that are explicitly taxed and for which the goal is not redistribution.[29]
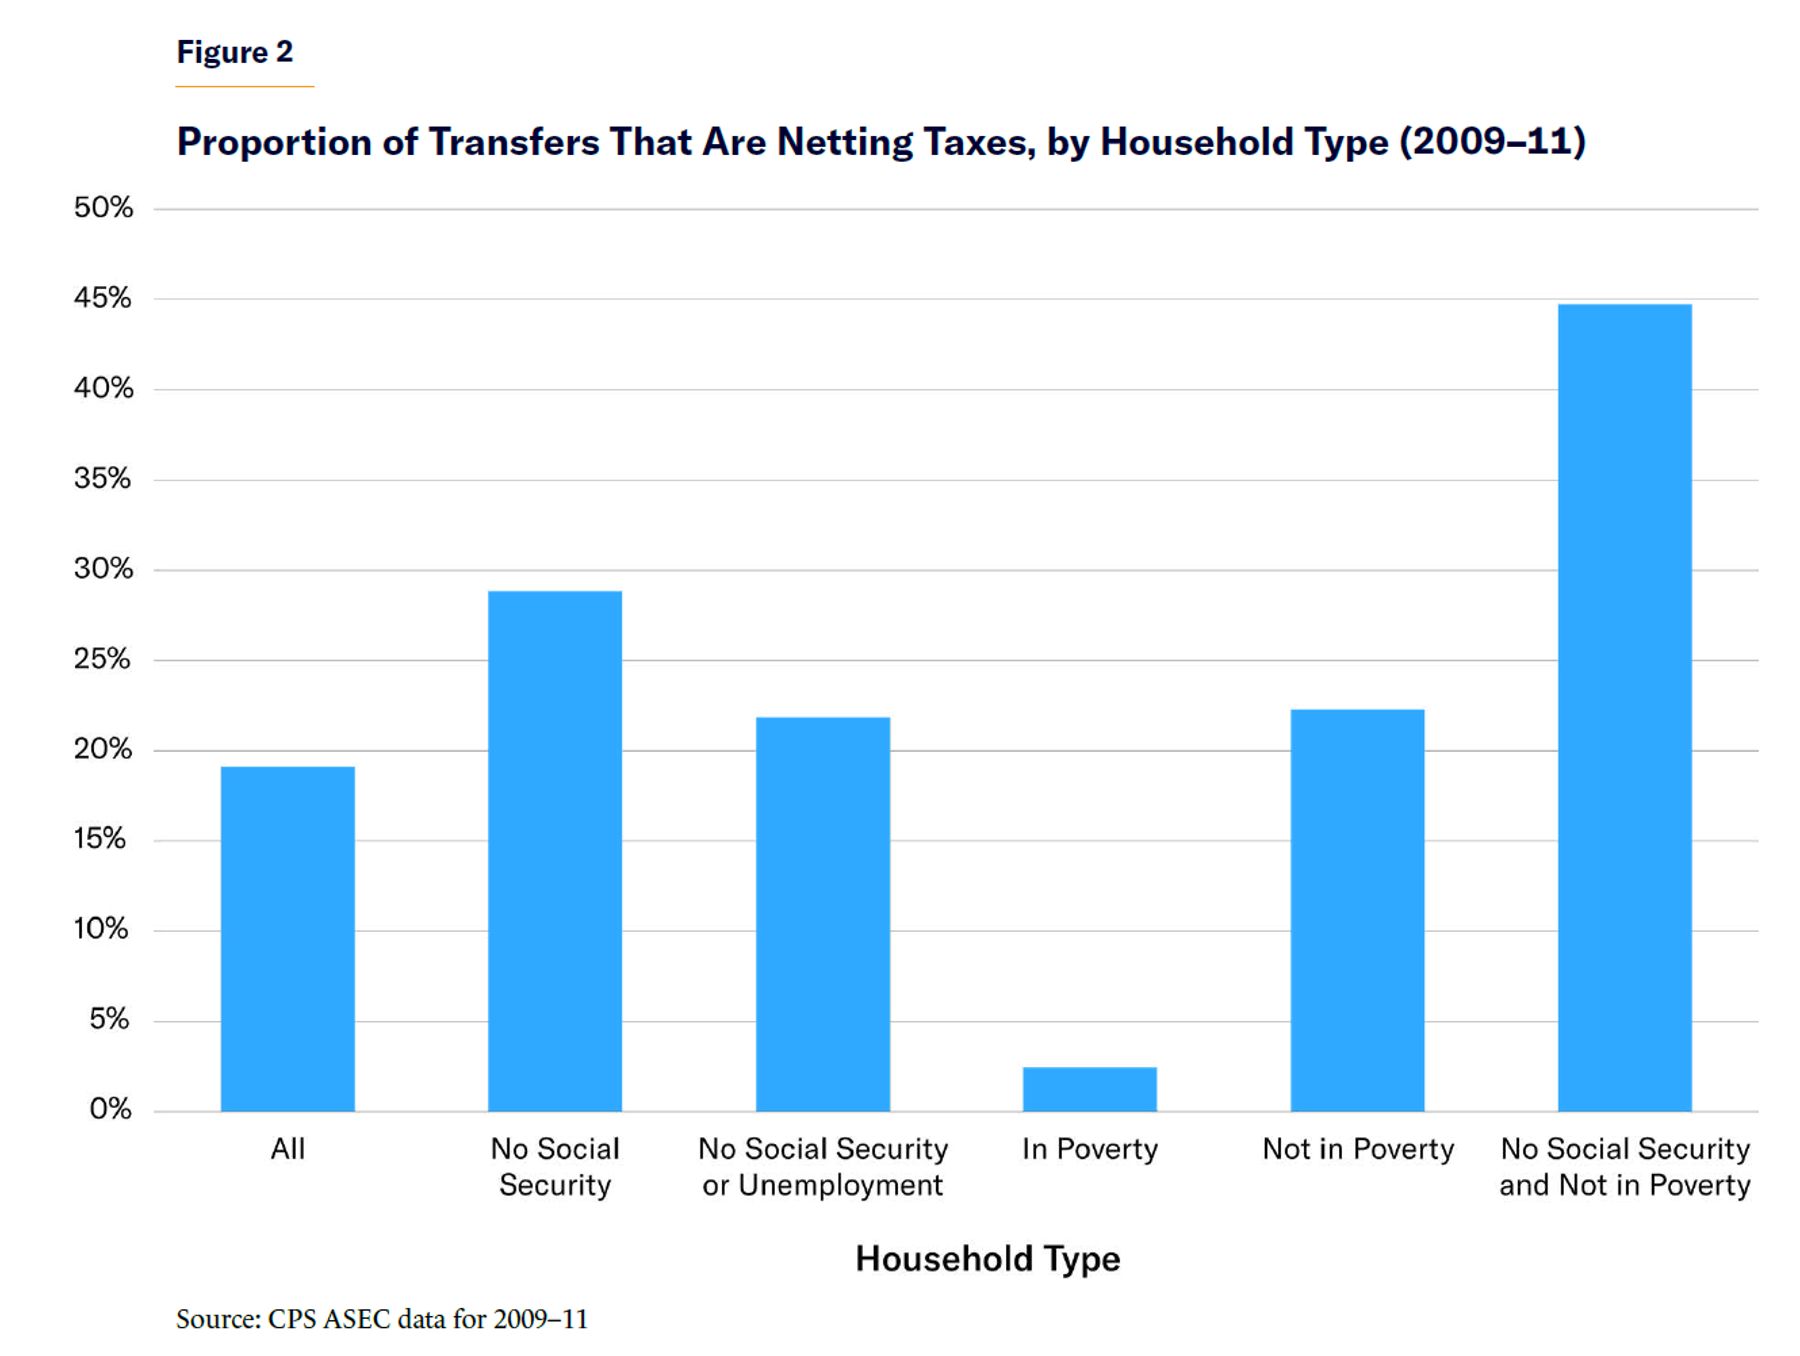
Most of these netting taxes are not among households in poverty, which tend to pay little tax. If we confine the analysis to those non-Social-Security-receiving households in poverty, they average only $316 in netting taxes, compared with $9,146 in transfers, meaning that just 3% of transfers are returned as netting taxes.[30] For the nonpoor, non–Social Security households, on the other hand, there are $1,082 in netting taxes to $2,419 in transfers, or almost half. Therefore, much of the national netting tax is from non-elderly, non-impoverished households. This emerges from the fact that even many means-tested programs are available to households that are nowhere near the poverty line and that pay substantial taxes.
One could argue that netting out taxes and transfers over just one year would tend to overemphasize the redistributive impact of the tax and transfer system, since taxing a household in one year only to provide it the equivalent funds in the next year brings few gains and no real redistribution of funds. If we follow households across two years, and total taxes and transfers across those years, we find that netting taxes go up slightly, to about 21% of all transfers ($3,309 in netting taxes for $15,530 in transfers).[31]
Robustness Check
CPS ASEC after 2011 does not contain dollar valuations for Medicare, Medicaid, or family housing subsidies, which makes the surveys in those years much less useful for estimating netting taxes. But if we use the more limited number of transfers in the 2018–23 surveys, we find fairly similar results in terms of the proportion of transfers that are netting taxes to earlier years. Considering the importance of Medicare and Medicaid in total transfer spending, it is not surprising that household transfers in these later surveys drop to an average of $5,632 per year. Yet in this period, netting taxes are still $1,472, or 26% of all transfers. When we use the same reduced group of transfers for the 2009–11 surveys, we find that, once again, 26% of all transfers are netting taxes. Therefore, we can be somewhat confident that the total proportion of netting taxes is relatively stable over time.
ACS has relevant data for a smaller subset of transfer programs than CPS ASEC. But when we use data from the 2011–16 surveys and use the available SNAP, Special Supplemental Nutrition Program for Women, Infants, and Children, housing, school lunch, and energy subsidy programs, we find similar proportionate results for netting taxes. In this survey, we find only $680 in average reported transfers per household—which is understandable, considering the much smaller number and size of these programs compared with CPS ASEC—but netting taxes constitute $182 of those transfers. As a proportion, this is still about 27% of reported transfers, or near the range of netting taxes for the reduced transfer total in the CPS ASEC surveys above.[32]
The high proportion of transfer payments that are netting taxes in ACS, despite the survey’s inclusion of only means-tested programs aimed at the low- or very low-income individuals, again shows that netting taxes are a substantial part of nominally redistributive means-tested programs. Although using only the 2016 non-recession year does slightly lower the average transfers for households, it keeps the proportion of netting taxes relatively consistent, at 25% of all transfers. If we include only those households not in ACS’s adjusted measure of poverty status, the proportion of transfers that are netting taxes in ACS goes up to 34%.
Implications of Underreported and Excluded Taxes and Transfers
Dealing with the problem of underreporting could change the estimated proportion of netting taxes in either direction. Underreporting of transfers is very common among people who report no transfers, which would seem to bias netting taxes downward and underestimate the scale of the netting tax, since most such households would pay at least minimal taxes. But the tendency to underreport means-tested programs might lead to an overestimation of the proportion of all netting taxes, since these programs are directed at poor and non-taxpaying households.
Other research shows that underreporting for some programs is highest among groups that have higher incomes and thus pay higher taxes. According to Bruce Meyer and Nikolas Mittag, who compare New York administrative data with CPS data, almost half the totals of certain means-tested programs received by those in poverty are reported, but only 38% of those benefits are reported for households between 100% and 200% of the poverty line, and only 20% of the dollars are reported for those higher up the scale.[33] Given that most of those higher-income households will be paying substantial taxes, the total proportion of netting taxes even among means-tested programs might be underestimated.
A simple regression of netting taxes on transfers in our sample shows that $1 in extra transfers leads to $0.14 extra netting taxes for the average household, which is about 25% lower than the total proportion of netting taxes in all transfers. That means that if excluded transfers were uniformly underreported, there would be a slight decrease in the total proportion of netting taxes.[34] But if most of the underreporting comes from complete non-reporting of transfers, one would expect the proportion of netting taxes to be higher than the baseline estimates. (If we control for household income, which is itself slightly correlated with netting taxes, we get more than $0.15 in netting taxes for each extra dollar in transfers.)
This report does not include several large transfer programs, such as Social Security Disability Insurance (SSDI) and assistance for higher education. Both are significantly underreported in the CPS sample and would add little to the analysis. While the former would presumably decrease the proportion of netting taxes, since it goes largely to nonworking individuals (even if substantial numbers of those receiving SSDI are in households with a primary earner), the latter would presumably increase it, since it goes to relatively well-off households. The effect of including these is inconclusive.
The most important reason to suspect that netting taxes are underestimated is that substantial portions of government taxes are unaccounted for in this report. Economists debate how much of federal corporate taxes, tariffs, and other indirect taxes are passed on to customers or employees, even if the taxes are not imputed to workers or consumers, as opposed to businesses or shareholders (whose income, of course, ultimately goes to households, albeit often higher-income ones); but large portions of them certainly should be. If we include the impact of federal corporate taxes, tariffs, and other taxes and government fees, the proportion of netting taxes would increase.
State and local taxes would even more substantially increase the netting tax total. CPS calculates only state income taxes. Adding state income taxes to the total taxes paid increases netting taxes only slightly, to $2,186 per household (up from $2,054 per household per year), or 20% of all transfers. But other taxes would increase this further. State and local sales taxes alone, which constitute about 25% of state and local own-source general revenue and are regressive, could largely be imputed to households that are receiving many of the transfers noted above and thus would substantially increase the amount of netting taxes.[35] Because sales taxes help fund many joint state and federal programs, such as Medicaid, much of these taxes or transfers function as netting taxes.
Comparing the household weighted aggregates of the CPS survey totals of transfers and taxes with other government data should help us understand the scale of underreporting and its implications.
The total reported transfers of those households studied in this report for the 2008 calendar year, for example, which are included in the CPS sample from 2009 and weighted to make them representative of all households, are $1.138 trillion.[36] The Bureau of Economic Analysis uses a different group of transfer payments (including some transfer payments not estimated in this report, such as SSDI), but its “government social benefits” estimate for 2008 is $1.935 trillion, so transfers are more than one-third underreported or not included in our sample.[37] The total estimated income tax and FICA tax burden in the sample for 2008 is $1.789 trillion, which is close to the $1.923 trillion for fiscal year 2008 for income and payroll taxes.[38] Yet total government receipts, including corporate taxes, tariffs, and all state and local taxes, total $4.160 trillion.[39] Thus, for 2008, total transfers should be about $800 billion larger and total taxes and government revenues should be $2.4 trillion larger than our sample. A proportion of deficit spending in those years should be included as netting taxes, since these pay for transfers with a debt obligation that must be paid by taxes on households at some point, but estimating the likely impact on different households of deficit spending is beyond the scope of this report.
The total size of directly reported netting taxes in the household weighted sample for the 2009 CPS ASEC is $223 billion. Although more reported transfers or taxes could hypothetically reduce the proportion of netting taxes, they could only increase the raw total amount of netting taxes. But even without such increases, the reported netting taxes for 2008 constitute about 1.5% of GDP.[40]
This report estimates that the proportion of netting taxes in all transfers is likely underreported. Given the large size of taxes unaccounted for, especially taxes on lower-income households, and the disproportionate non-reporting of certain transfers by better-off households, the 19%–20% of all transfers working as netting taxes is likely an underestimate. Yet even if we expected that 20% of all unreported transfers were netting taxes, there would be a total of about $375 billion, or almost 2.5% of GDP, in netting taxes in 2008. If the same proportion of netting taxes were carried forward to 2022, when transfers were up to approximately $4 trillion and about 15% of GDP, a 20% rate of netting taxes would be 3% of GDP, or approaching $800 billion—around what the government spent on defense in that fiscal year.[41]
Therefore, by almost any estimate, substantial portions of the U.S. economy involve government returning income to the same households that already paid that amount in taxes to the government.
Analysis
Transfer spending is the most significant duty of modern government. In 2019, about half of all federal expenditures were transfer spending, with 23% going to Social Security, 15% to Medicare, and the rest to a host of means-tested, in-kind, and other transfers (such as housing or heating subsidies).[42] Thinking about the American transfer and welfare state through the perspective of netting taxes should alter our understanding of this system in several ways.
In some respects, netting taxes should be considered something like the inverse of tax expenditures. The concept of “tax expenditures” was first coined in the late 1960s by Stanley Surrey, when he was assistant secretary of the Treasury, to convince policymakers that much of the tax code functioned as a type of welfare spending.[43] The concept of tax expenditures showed that the formal size of government was larger than it appeared, since tax expenditures redirected private spending without changing the direct expenditures of government. In some ways, the concept of netting taxes works in the opposite direction. The size of government, in terms of its redistributive function, is smaller than it first appears, since much of it is taxing and returning money to the same households. But by those same measures, much of what looks like “redistribution” is waste: it is not performing any plausible redistributive function; it is merely cycling funds to and from the same household. Many of America’s nominally redistributive policies are doing no redistribution at all.
Some netting taxes are explicitly established by federal law: receipts of benefits get taxed. Unemployment insurance benefits are subject to federal income tax but not payroll tax.[44] The Social Security Amendments of 1983 began the taxation of Social Security income. Yet here, too, while these taxed reductions in transfers can be treated as a mere reduction in benefits, the marginal tax rates applied to these benefits reduce their utility to families, even if their total nominal income does not change. A family that receives a monthly check but must return the equivalent amount through taxes has its marginal tax rates increased. Even for elderly, nonworking households, such taxes affect savings and other decisions. They certainly affect the savings decisions of the non-elderly preparing for retirement.
Focusing on the impact of netting taxes should also help us to evaluate “universalist” welfare programs, which aim to provide transfers or benefits to all households equally, regardless of income. Insofar as the taxes to pay for these programs are imposed mostly on the same households that receive the benefits, they would be adding to waste and destroying value in the same manner as current netting taxes, but to a much greater extent.[45] Calculating the netting tax impact of universalist programs would make them appear less valuable.
Considering universalist programs through the netting tax framework also makes the U.S. transfer policy look more reasonable when compared with that of Europe, where universalist programs are more common.[46] Although this report does not estimate netting taxes for other countries, evidence suggests that the U.S. tax and transfer system is more redistributive for low-income groups, despite a lower total spending level, precisely because welfare programs are more targeted.[47] Therefore, the U.S. likely has a much smaller netting tax burden than Europe. In Europe, high value-added taxes and payroll taxes, falling largely on the broad middle class, are the main source of increased benefits to that same middle class. These universalist programs of taxing and redistributing would make the netting tax substantially larger. By contrast, making the U.S. tax and transfer system even more targeted at direct redistribution, rather than universalist programs, could further reduce netting taxes.
Recommendations
The most important policy solution is that, to the largest extent possible, the federal government should try to net out taxes and transfers to the same households—i.e., it should reduce transfers and taxes commensurately to those households both receiving transfers and paying taxes. This would have zero distributional consequences, create substantial administrative savings for the government, and improve incentives for individuals and households.
Policymakers can take a number of actions to achieve this end.
Require Netting Taxes Estimates
First, Congress needs to understand the extent of the overlap. Since approximately a seventh of the U.S. economy is devoted to transfers, we need better data on netting taxes if we are going to ensure that our tax and transfer system is operating effectively to redistribute resources. A 1974 act required federal estimates of tax expenditures, such as deductions and credits, and has helped inform congressional efforts to limit these ever since.[48] Congress should require the Census Bureau or another bureaucracy to estimate total netting taxes, using proprietary government data.
Rethink FICA Payroll Taxes
The question remains: What is the best way to net out taxes and transfers? One solution is to change some transfer programs into FICA reduction programs. The idea that FICA is an untouchable contribution toward Social Security or other programs is anachronistic. Congress implemented FICA reductions after the 2008 crisis, and lawmakers issued refundable credits for the business proportion of FICA during the 2020 pandemic.[49] The connection between FICA taxes and actual benefits and services is often minimal (such as for Medicare), and therefore reducing those taxes for households that are considered in need would not upset any supposed connection to future benefits.
Some still argue that workers treat FICA taxes as a true “contribution” toward retirement or other programs and that any FICA tax cuts would sever the connection in workers’ minds between taxes and later benefits. If there is any concern that people will divorce FICA taxes from their benefits, the portion of any social welfare program that goes to reducing FICA taxes can be noted on tax forms as a “credit” toward FICA taxes that does not upset that individual’s accrual of retirement or other benefits.
Convert Transfer Programs into Tax Reductions
Several transfer programs could be beneficially changed into FICA or income-tax reductions. If we leave out all households that receive Social Security and unemployment, the two programs that are most correlated with netting taxes in sample regressions are Medicaid and Medicare. When controlling for all other programs, another dollar from each of these programs usually returns about one-fourth to the government in netting taxes. Programs like Medicaid have broad constituencies and are part of a supposed duty of the government to provide health insurance; but many working families that receive these programs have alternative medical options—and these families can be given the ability to transfer the value of the Medicaid to equivalent FICA or income-tax reductions.
A more plausible source of FICA reductions would involve broad-based in-kind welfare programs, such as SNAP, school lunches, and energy subsidies. While previous welfare reform efforts have tried to simplify the number of these or similar transfer programs, incorporating them instead into a direct tax reduction would further simplify their administration and reduce burdens on households. If there are concerns about misspending or a desire for continued paternalism for those who pay no or insufficient taxes, the in-kind benefit can be provided only to those who do not pay sufficient FICA or other income taxes.[50]
Smooth Benefits with Lower Marginal Rates
Several broader reforms would be necessary to maximize the advantages of any program that reduced transfers and taxes in tandem. For example, if a reform led to a family having a reduction in household tax liability, but transfer programs are determined by the same income and family size thresholds as currently exist, the family’s marginal tax rates would remain exactly the same. Ideally, by changing and combining several benefit programs into reductions in FICA and income taxes, policymakers could create smoother and often lower marginal tax rates than the current ones, which are upset by numerous benefits “cliffs” and extremely high rates on some low-earning households. Such a reform would involve some change in tax payment and benefits receipt between households and thus some change in the redistributive effect of these programs. But a reform could be designed in such a way that broad income brackets receive the same net amount of transfers over taxes, albeit with lower marginal rates on many households inside those brackets.[51]
Convert Tax Credits into Tax Withholding Reductions
Another reform to limit the downsides of netting taxes would be to look at how even current tax credits could be transformed into FICA reductions. The refundable Earned Income Tax Credit (EITC) is often celebrated as a way to make work pay, but when considering the refundable portion as part of a tax system that includes FICA, it contributes to the substantial lumpiness of income. It amounts to taxing households through FICA for 51 weeks a year, and then returning some portion of that tax in one week.
Although not explicitly included as a transfer in this report, the refundable EITC would be better structured as a program that reduced FICA taxes proportionally to the estimated refundable credit, similar to how certain credits can reduce withholding for the income tax.[52] In the early 2010s, House Ways and Means Chairman Dave Camp proposed to make EITC refundable against payroll taxes. Although his plan did not change the withholding rules as suggested here, it did show a willingness to engage in FICA tax reductions as part of a refundable credit reform.[53]
Conclusion
Beyond any specific proposal to reduce netting taxes, the concept of netting taxes should help lawmakers understand the consequences of transfer programs more broadly. When federal, state, or local governments are considering their tax and transfer programs, or when they are administering intragovernmental transfer programs, they should consider the impact of any tax financing on households that receive transfers. Such considerations should go beyond the mere net distributional impact of such taxes and transfers and also include the costs of overlap. Similarly, when the federal government delegates partial funding of transfer programs to the states, it should consider the likely tax financing of such programs and how that will affect households. By looking at netting taxes, policymakers can understand that the net impact of many programs for even their putative beneficiaries is less substantial than it might appear.
When the vast majority of transfer-receiving households pay taxes, every existing, or new, government program must confront the question: Is it better just to reduce these individuals’ taxes, especially their FICA taxes at the federal level and sales taxes at a state and local level? In most cases, the answer is that it would be superior, from both a social and individual standpoint, to simply reduce taxes. Such reductions can be done in a fiscally and distributionally neutral way and still bring real benefits to households.
About the Author
Judge Glock is the director of research and a senior fellow at the Manhattan Institute and a contributing editor at City Journal. He was formerly the senior director of policy and research at the Cicero Institute, a nonpartisan think tank based in Austin, and a visiting professor of economics at West Virginia University. He writes about the intersection of economics, finance, and housing, with a perspective informed by his work in economic history.
Glock’s work has been featured in National Affairs, Tax Notes, The Journal of American History, NPR, the New York Times, and the Wall Street Journal, among other outlets. He is the author of The Dead Pledge: The Origins of the Mortgage Market and Federal Bailouts, 1913–1939 (Columbia University Press, 2021). He earned a Ph.D. in history, with a focus on economic history, from Rutgers University.
Appendix
Table 1
Sample Estimates of Variables from CPS ASEC
| Mean | Std. Dev. | Min | Max | |
| Individual Wage Income | 20,438.17 | 41,402.61 | 0 | 1,699,999 |
| Individual Social Security | 1,885.46 | 5,222.27 | 0 | 50,000 |
| Individual Welfare | 20.35 | 360.37 | 0 | 25,000 |
| Individual SSI | 126.60 | 1,106.89 | 0 | 25,000 |
| Individual Unemployment | 257.46 | 1,946.15 | 0 | 99,999 |
| Individual Medicare | 1,196.66 | 2,950.69 | 0 | 16,585 |
| Individual Medicaid | 628.18 | 2,215.50 | 0 | 29,120 |
| Individual Federal Taxes | 2,678.55 | 10,248.95 | –9,316 | 603,213 |
| Individual FICA | 1,547.55 | 2,498.11 | 0 | 47,955 |
| Individual State Taxes | 724.74 | 2,702.33 | –2,829 | 124,575 |
| Household Wage Income | 51,540.07 | 68,410.63 | 0 | 1,959,999 |
| Household Transfers | 10,739.63 | 15,521.85 | 0 | 327,060 |
| Household Social Security | 4,754.66 | 9,171.71 | 0 | 190,102 |
| Household Medicare | 3,017.69 | 5483.40 | 0 | 100,424 |
| Household Food Stamp Value | 265.02 | 1,142.32 | 0 | 24,999 |
| Household All Federal Tax (FICA doubled) | 14,699.99 | 22,154.18 | 0 | 728,292 |
Endnotes
Photo: JJ Gouin/iStock
Are you interested in supporting the Manhattan Institute’s public-interest research and journalism? As a 501(c)(3) nonprofit, donations in support of MI and its scholars’ work are fully tax-deductible as provided by law (EIN #13-2912529).