Fiscal Health Lessons for New York City

Photo: StockByM/iStock
Executive Summary
Often, analyses of a city’s fiscal health focus primarily on its budget—which, in New York City’s case, is statutorily required to be balanced. Budget numbers, however, provide only a small snapshot of the full picture. Budgets are forward-looking planning documents that reflect city officials’ spending priorities. By contrast, a city’s financial statements—its Annual Comprehensive Financial Reports (ACFRs)—more holistically account for how much money has actually been spent throughout an entire fiscal year. This report analyzes seven years of NYC’s financial-statement data in order to show that the city’s financial predicament is the result of years of poor financial management and to highlight the need for systematic structural changes.
Introduction
Despite the fact that New York City is the financial capital of the world, its public finances have been struggling. In FY 2020, New York City ranked last out of the 75 most populous cities in the nation for fiscal health.[1] If the city were called on to pay its staggering $275.6 billion worth of obligations today, it would be able to cover only 26% of the bill. Truth in Accounting, a nonprofit watchdog group, estimates that paying these obligations would cost each New York City taxpayer $71,400—with no corresponding increase in public services or benefits.[2] Of course, governments are rarely called to pay all their obligations at once, but it is a useful thought experiment in order to understand the scope of the issue.
Often, analyses of a city’s fiscal health focus primarily on its budget numbers. These can shed light on the situation. In FY 2020, the same year that the previous calculations are from, the original budget totaled $92.5 billion.[3] More recently, Mayor Adams released the city’s $102.7 billion preliminary budget for FY 2024.[4] Although the budget is balanced, as is statutorily required, planners nevertheless face pressures from slowing revenue growth and rising costs.
Budget numbers, however, provide only a small snapshot of the full picture. There are better ways to look at the city’s fiscal situation. Budgets are forward-looking planning documents that reflect city officials’ spending priorities. By contrast, a city’s Annual Comprehensive Financial Report (ACFR) more holistically accounts for how much money has actually been spent throughout an entire fiscal year. This brief emphasizes the value in looking at New York City’s ACFR to get a more sobering look at the city’s finances. It doesn’t argue for replacing budget analysis with financial statement analysis; rather, it argues that both are essential to fully understand a city’s fiscal health. Utilizing ACFRs in combination with financial-ratio analysis has been widely endorsed by public finance researchers; but this approach has often been neglected in practice.
This brief encourages analysts and practitioners to consider augmenting their analysis with financial ratios calculated using line items from ACFRs. This approach provides a more long-term focus on financial planning that complements the short-term focus of traditional budget planning.
Taking the long-term approach, we see that NYC’s fiscal predicament is not just a result of the Covid-19 pandemic.[5] Under mayors of both parties, the city has consistently had large unfunded retirement benefits and significant structural operational budget gaps. This is why the city was not financially prepared to weather the pandemic.6 The economic landscape and the mayor’s recent budget proposal—which further increases spending—won’t do anything to ease concerns.[7] Additionally, there has been a worsening financial squeeze as Covid-related federal aid diminishes and as employment, tourism, and tax revenue remain sluggish.[8]
Policymakers at the state level have demonstrated a knack for underfunding pensions as well as taking stopgap measures, such as using debt to finance obligations.[9] The Mercatus Center issued a report on state fiscal rankings and found that New York State has consistently been among the bottom five states when it comes to fiscal health.[10] The apple of NYC doesn’t fall too far from the tree. Although some metrics provide a rosy picture, that is often due only to injections of federal aid that the state cannot depend on in the future.
This report analyzes seven years of NYC’s financial-statement data in order to show that the current situation is a culmination of years of poor financial management and to highlight the need for systematic structural changes. Without reform, city residents will have to worry about a rising tax burden or deteriorating public services.
Budgets Versus Comprehensive Financial Statements
A city’s budget codifies plans for a future fiscal period. It is helpful for understanding the mayor’s and city council members’ priorities for the city and how revenues are to be spent in the upcoming fiscal year. It balances competing demands for public resources and is subject to modification throughout the year, often due to changing economic conditions, unexpectedly higher or lower realized revenues, or administrative and programmatic changes. Budget documents tend to follow a cash basis of accounting, which is relatively simple to understand. Budgets are also more dynamic and responsive to changing fiscal and economic conditions throughout the year. Ultimately, however, a budget essentially represents a plan for how money will be spent—not a record of how it actually was spent.
That record comes, instead, from the city’s (ACFR), which contains a set of financial statements that provide a retrospective look at the previous fiscal year. ACFRs are governed by accounting requirements established by the Government Accounting Standards Board (GASB), a public-sector equivalent of the Financial Accounting Standards Board. These financial statements tend to utilize accrual basis of accounting, as per the guidance of Generally Accepted Accounting Principles (GAAP). This approach is also commonly used by private companies.
Due to their more dynamic nature, city budgets are often seen as the more essential planning document. However, for more sustainable, long-term planning, a city’s ACFR is crucial because it provides a more complete accounting of the city’s short- and long-term obligations.
Governments, like private companies, use both these tools for long-term financial planning: their budgets make plans on how to allocate money, but at the end of the year, they report what is actually spent on financial statements. Ideally, these processes—budgeting and financial reporting—would interconnect. Planners would produce a planned budget at the beginning of each year; at the end of the year, they would compare the planned budget with actual spending, using comprehensive accounting methods, before drafting up the next budget. The short-term priorities of each fiscal year would be anchored and recalibrated by a sobering look at financial-reporting documents that provide a more long-term view.
In practice, however, the budgeting and financial-reporting worlds often remain separate. The municipal budgeting process is dominated by city finance managers focused on the short-term impact of resource allocation. As former city financial director and consultant Mark Moses has documented, municipalities often do have serious conversations about growing pension and other long-term liabilities, but these conversations do not always gain as much attention as they should in the actual budgeting process.[11] The short-term orientation of municipal budgeting tends to make officials defer important expenditures and discount the long-term implications of their decisions.
This practical disconnect between the budgeting and financial-reporting worlds is important to keep in mind. This reality further emphasizes the importance of revisiting a city’s financial reports, especially its ACFR. At hundreds of pages long, an ACFR can be onerous to analyze. This brief, using New York City as an informative example, directs analysts to the most pertinent of information in these documents, in order to get a more complete picture of a city’s financial situation.
New York City’s Fiscal Health
New York City is no stranger to financial distress; it has been at the epicenter of stock-market crashes and related fiscal crises and has faced looming budget deficits and lackluster job recovery.[12] But how bad is the problem, really? Don’t most governments face budget pressure every year? Is it part of the new normal that we should adapt to in the post-Covid era? To help answer these questions, this report analyzes NYC’s financial data from FYs 2015 to 2021, the latest year for which ACFRs are available.
One way to make sense of a dense, lengthy ACFR is to apply a series of financial indicators to key line items—similar to the way in which financial ratios are used in the private sector to analyze company debt and financial performance.[13] Although municipalities are not businesses, similar techniques can help reveal their full financial picture.
This approach relies on a more complete accounting of NYC’s finances. Pairing these metrics with a review of the fiscal institutional environment provides a comprehensive view of NYC’s financial predicament. Taking this comprehensive look, it quickly becomes apparent that although the pandemic harmed the city’s financial position, it has had consistent structural issues that require structural reforms.
First, it’s helpful to break down the concept of fiscal health into several dimensions. These include: (1) cash solvency, (2) budget solvency, (3) service-level solvency, (4) long-term solvency, and (5) trust-fund solvency. The first two areas—cash and budget solvency—are short-term measures of fiscal health, whereas the other three are long-term measures. In the sections that follow, each of these dimensions will be explored by reviewing corresponding financial ratios. Most data used to calculate the city’s financial ratios come from the city’s ACFRs.[14] For pension and other post-employment benefit (OPEB) metrics, Truth in Accounting’s pension and OPEB databases are used to calculate the market valuation of these liabilities.[15] For the years in which they are not available from the ACFRs, population and personal income metrics are drawn from the census’s American Community Survey.[16]
Cash Solvency
Cash solvency is a metric that helps us assess whether a city has enough cash on hand to cover its short-term bills (those that are due over a 30- to 60-day horizon). It measures a government’s cash position relative to its short-term liabilities, such as payroll, interest on debt, and accounts payable items.
Cash solvency can be measured in many ways. One of the most commonly used ways is the quick ratio, calculated by dividing the city’s cash, cash equivalents, investments, and receivables by current liabilities. Public finance researchers recommend that state and city governments maintain quick ratios greater than one.[17] As Figure 1 shows, NYC’s quick ratio has consistently met this goal. Stated differently, NYC has had more than enough cash to theoretically cover short-term liabilities. However, the city’s cash position has been worsening in recent years.
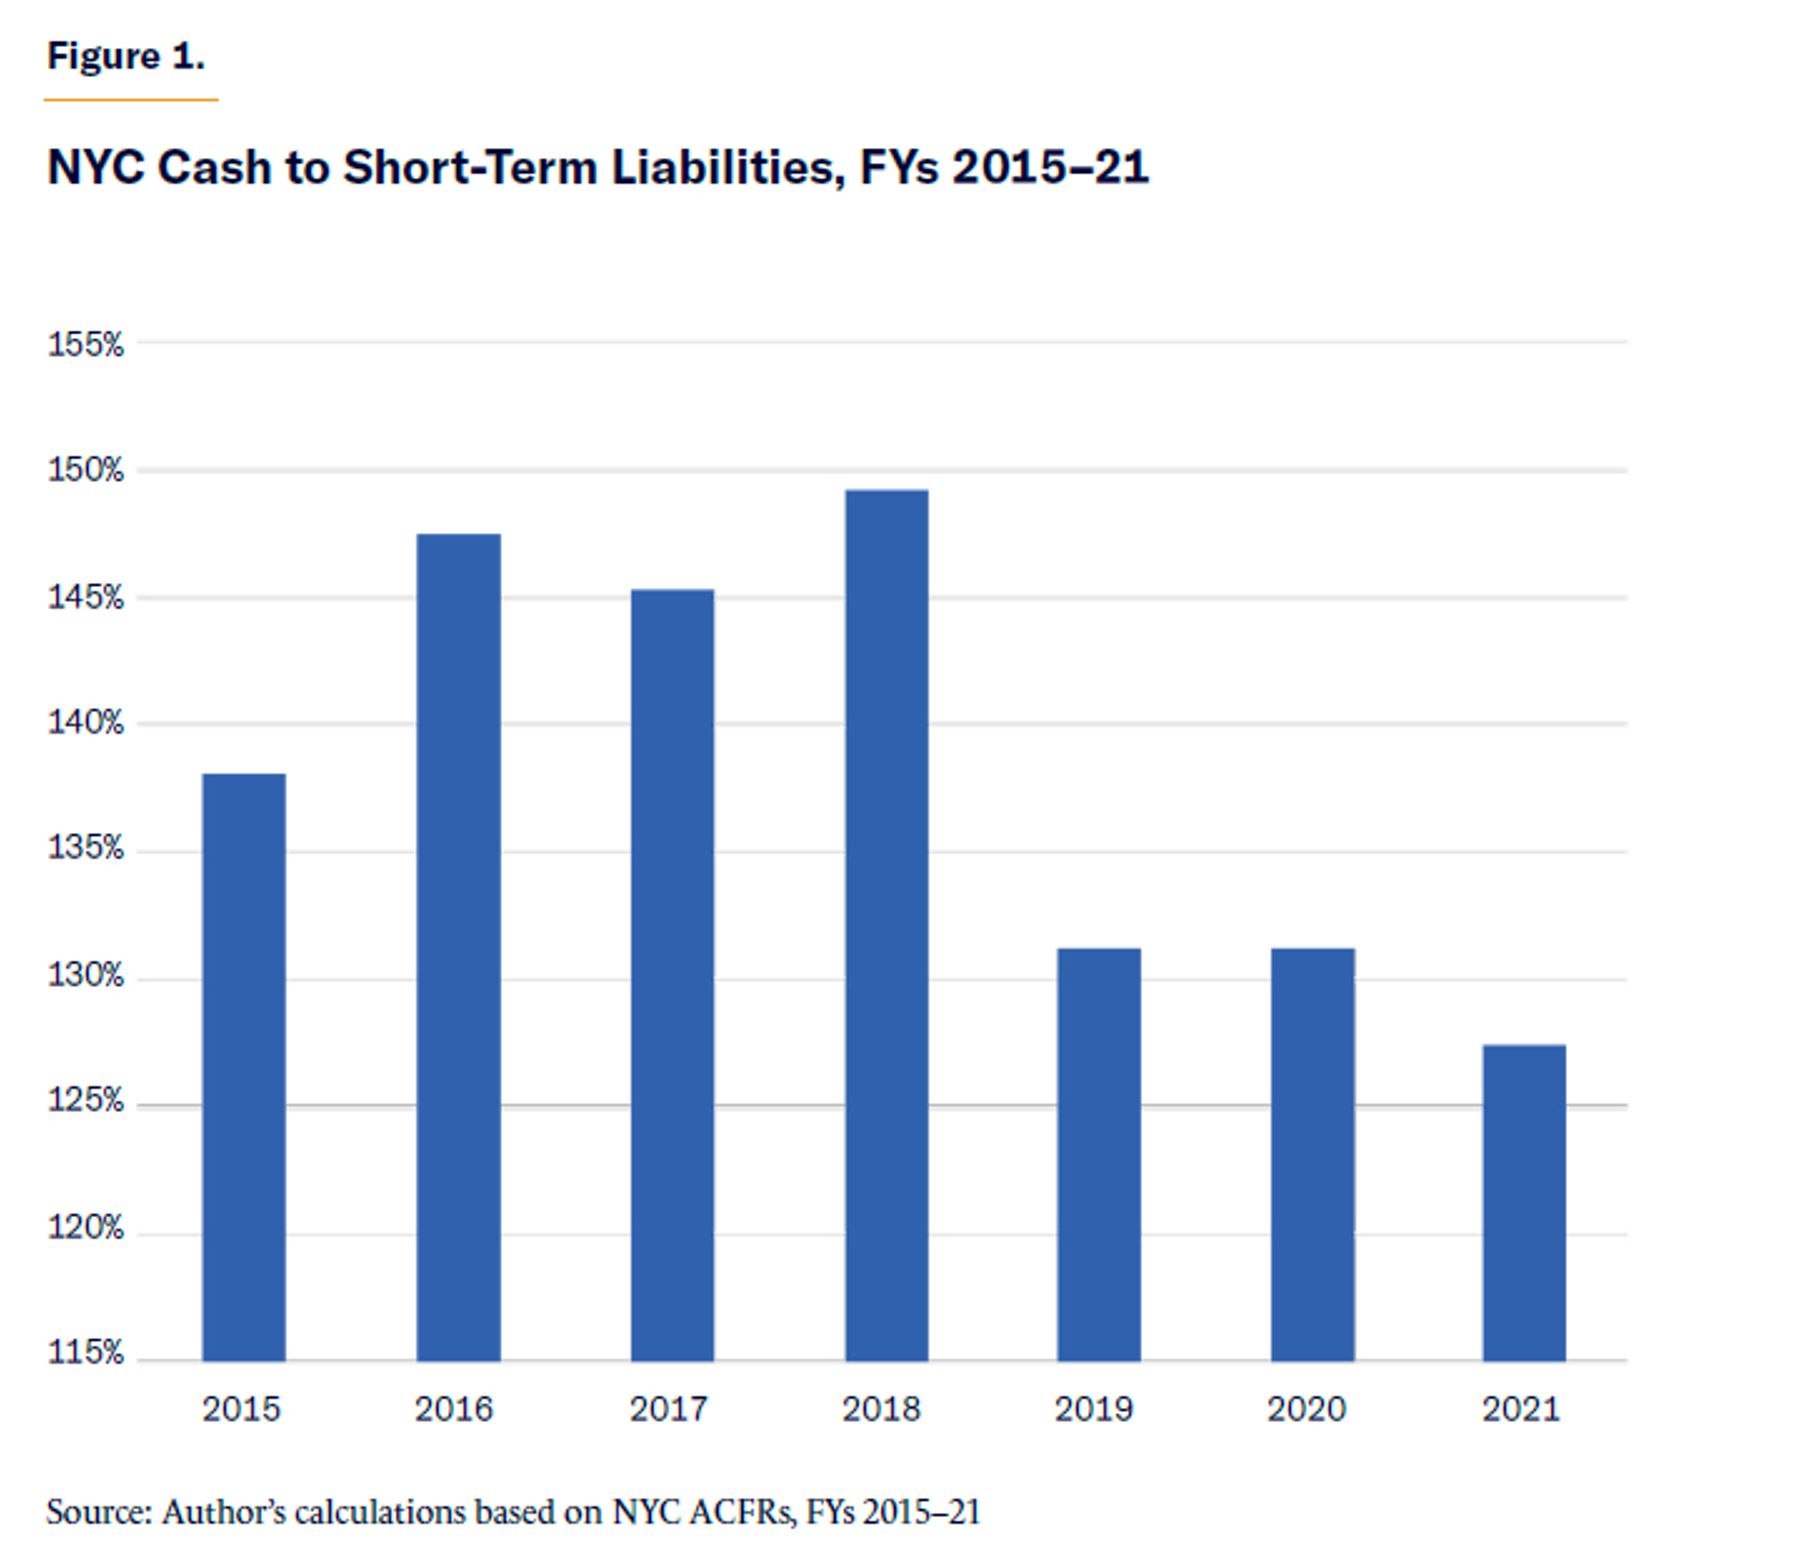
The city’s cash solvency was at an all-time high in FY 2018, when cash covered 148% of short-term liabilities. NYC’s quick ratio dropped significantly—by 12%—in FY 2019, a result of the Covid-19 pandemic. A drop of this size is uncommon: the last comparable drop took place in 2009, when the city’s quick ratio dropped by 10%. Otherwise, since 2006, NYC’s quick ratio has tended to grow by 1% per year, on average.
Taken together, despite the significant drop in cash on hand in recent years, NYC is still able to meet short-term commitments. However, the short-term nature of these obligations means that they are the most urgent line items, and it is very rare for a local government not to pay for them—so it is not surprising that the city has ensured that it is able to pay for them.
Budget Solvency
Budget solvency assesses whether a city can cover its fiscal year spending with revenues. NYC’s revenues come not only from taxes, such its real-estate, business, and personal income taxes, but also from other charges for services, operating grants and contributions, and investment income, among others. When the city doesn’t have enough revenues to cover spending, this creates a budget shortfall. But in this context, “budget shortfall” means something different from what those familiar with New York City’s budget practices may think of. The city is required by law to balance its budget. When the mayor and city council work together to set financial priorities at the beginning of each fiscal year, they project how much they plan to spend across each budget category, and these plans must not surpass expected revenues. When it comes to what is actually spent at the end of each fiscal year, however, the same doesn’t always hold true.
City officials have a track record of purposely underestimating projected revenues during the budget process, thus producing a “surprise” surplus later in the fiscal year.[18] This surplus can be carried into the next year to balance the budget. Budget gimmicks like this are not uncommon in the state and local government world. Luckily, looking at a city’s ACFR—which reports how much has actually been spent throughout the whole fiscal year—is a helpful way to see past such gimmicks.
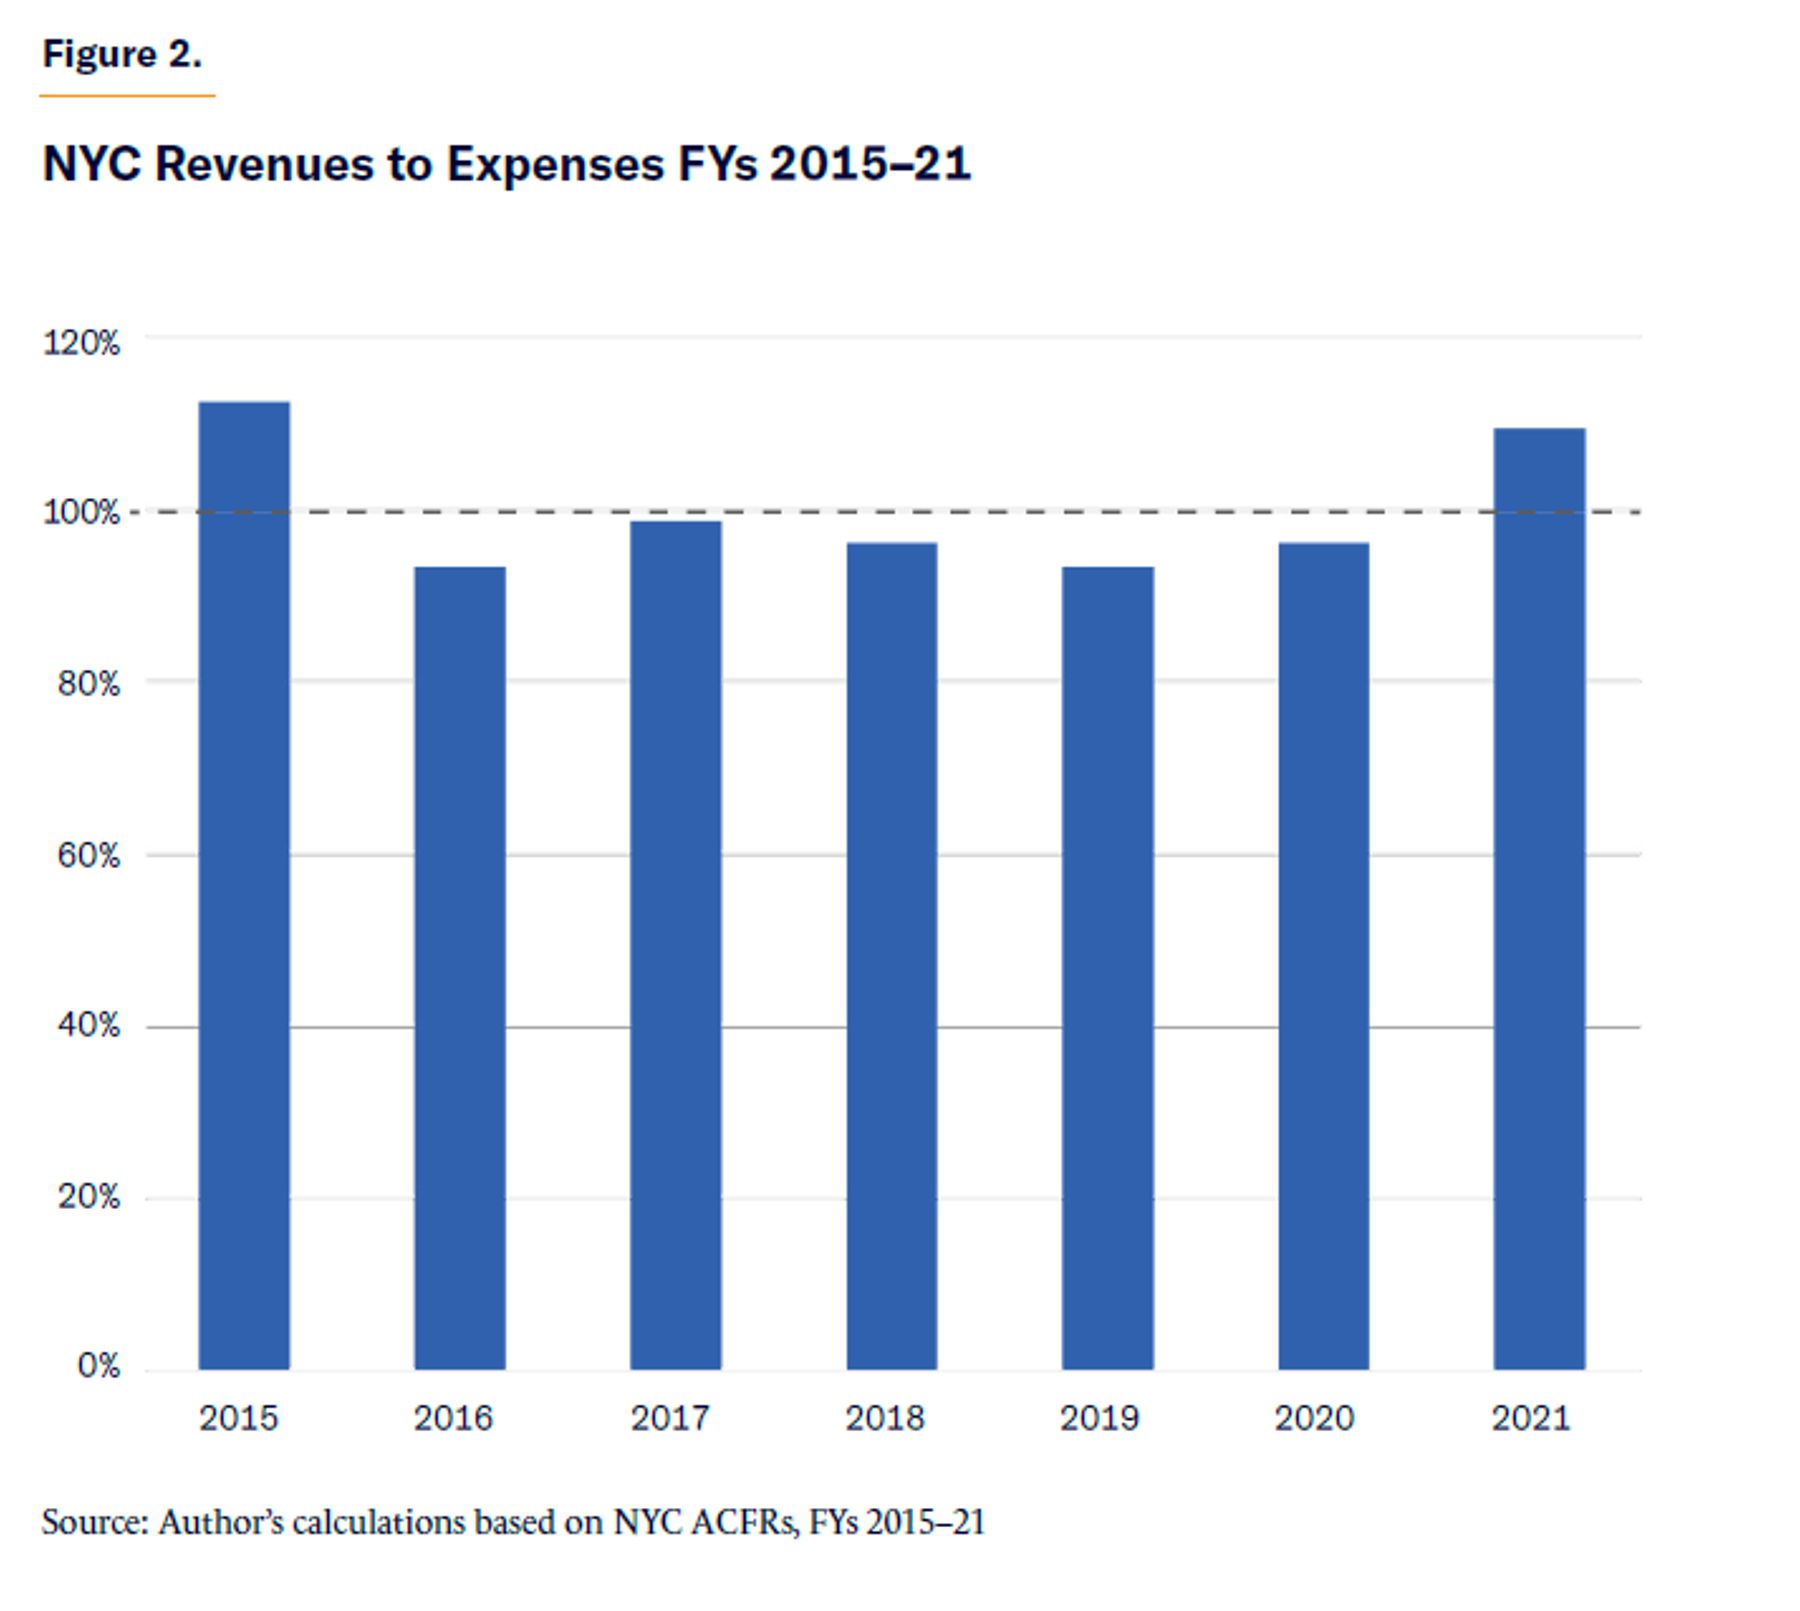
From its ACFRs, we quickly see that New York City actually has experienced operational deficits over many years. Figure 2 displays NYC’s operating ratio—its revenues relative to expenses on an accrual basis—in FYs 2015–21. In only two of these seven years has the city been able to cover 100% of expenses with revenues. This trend goes back even further: between 2006 and 2014, the city was able to completely cover expenses with revenues only in 2014. In all other years, revenues fell short of expenses.
This may come as a surprise to those familiar with NYC’s budget, which must be balanced. But there is a huge disconnect between budget plans and what actually gets spent throughout the year. The law requires that the budget be balanced—but there is no guarantee that, at the end of the year, revenues will match expenses.
This is not an argument against balanced budget requirements, which can and do lead to financial constraint in some instances, depending on how these requirements are structured.[19] However, it is important to analyze both a city’s budget and its ACFR to help provide a fuller picture of fiscal affairs.
Although not completely pictured, New York City’s operating ratio had been improving after 2010 until fiscal year 2015, when it reached its all-time high of 113%. This was primarily due to an increase in tax revenues and grants. The latter was driven by reimbursements for costs associated with Hurricane Sandy, which occurred in 2012. Tax-revenue growth was driven by increased mortgage financing activity in the city, leading to more revenue from income and real-estate taxes, as well as sales and use taxes.
The city’s operating ratio worsened significantly in 2016, when expenses grew by 21%, according to the city’s ACFRs—from $71.78 billion to $87.11 billion—while revenues grew by less than 1%.20 Expenses grew the most—51% (from $2.19 billion to $3.30 billion)—for health-related items. This was followed by public-safety- and judicial-related items, which grew by 41% (from $13.65 to $19.23 billion). Education grew to $29.07 billion (by 27%), housing to $1.97 billion (by 25%), and environmental protection to $3.96 billion (by 24%).
Expenses across these areas—especially in public safety and education—increased largely because of changes in actuarial assumptions that led to the recognition of larger pension liabilities. Collective bargaining increases also played a role. Other non-actuarial causes of expense growth included investments in officers and security cameras for the Department of Corrections, the expansion of universal prekindergarten, as well as facility and construction improvements within the Department of Environmental Protection. Other investments were made in transportation, infrastructure, health, and housing services.
The city began to improve its financial position steadily over the following years; surprisingly, even the pandemic did not significantly harm the city’s operating ratio, at least as measured in its financial reports in FYs 2020 and 2021, due to lagged financial effects as well as other factors. Another metric that assesses budget solvency is the city’s surplus, or deficit, per capita, measured by dividing the city’s change in net assets by population. In this context, a city’s net position (or net assets) assesses the change in direction of a city’s overall financial position since the latest year. The city’s statement of net position in its ACFR can be used to measure the size of the budget, as opposed to traditional budget analysis that focuses on cash expenses. Using this approach, an increase in net assets represents a surplus, and a decrease in net assets represents a deficit. Figure 3 shows New York City’s track record in this area since FY 2015.
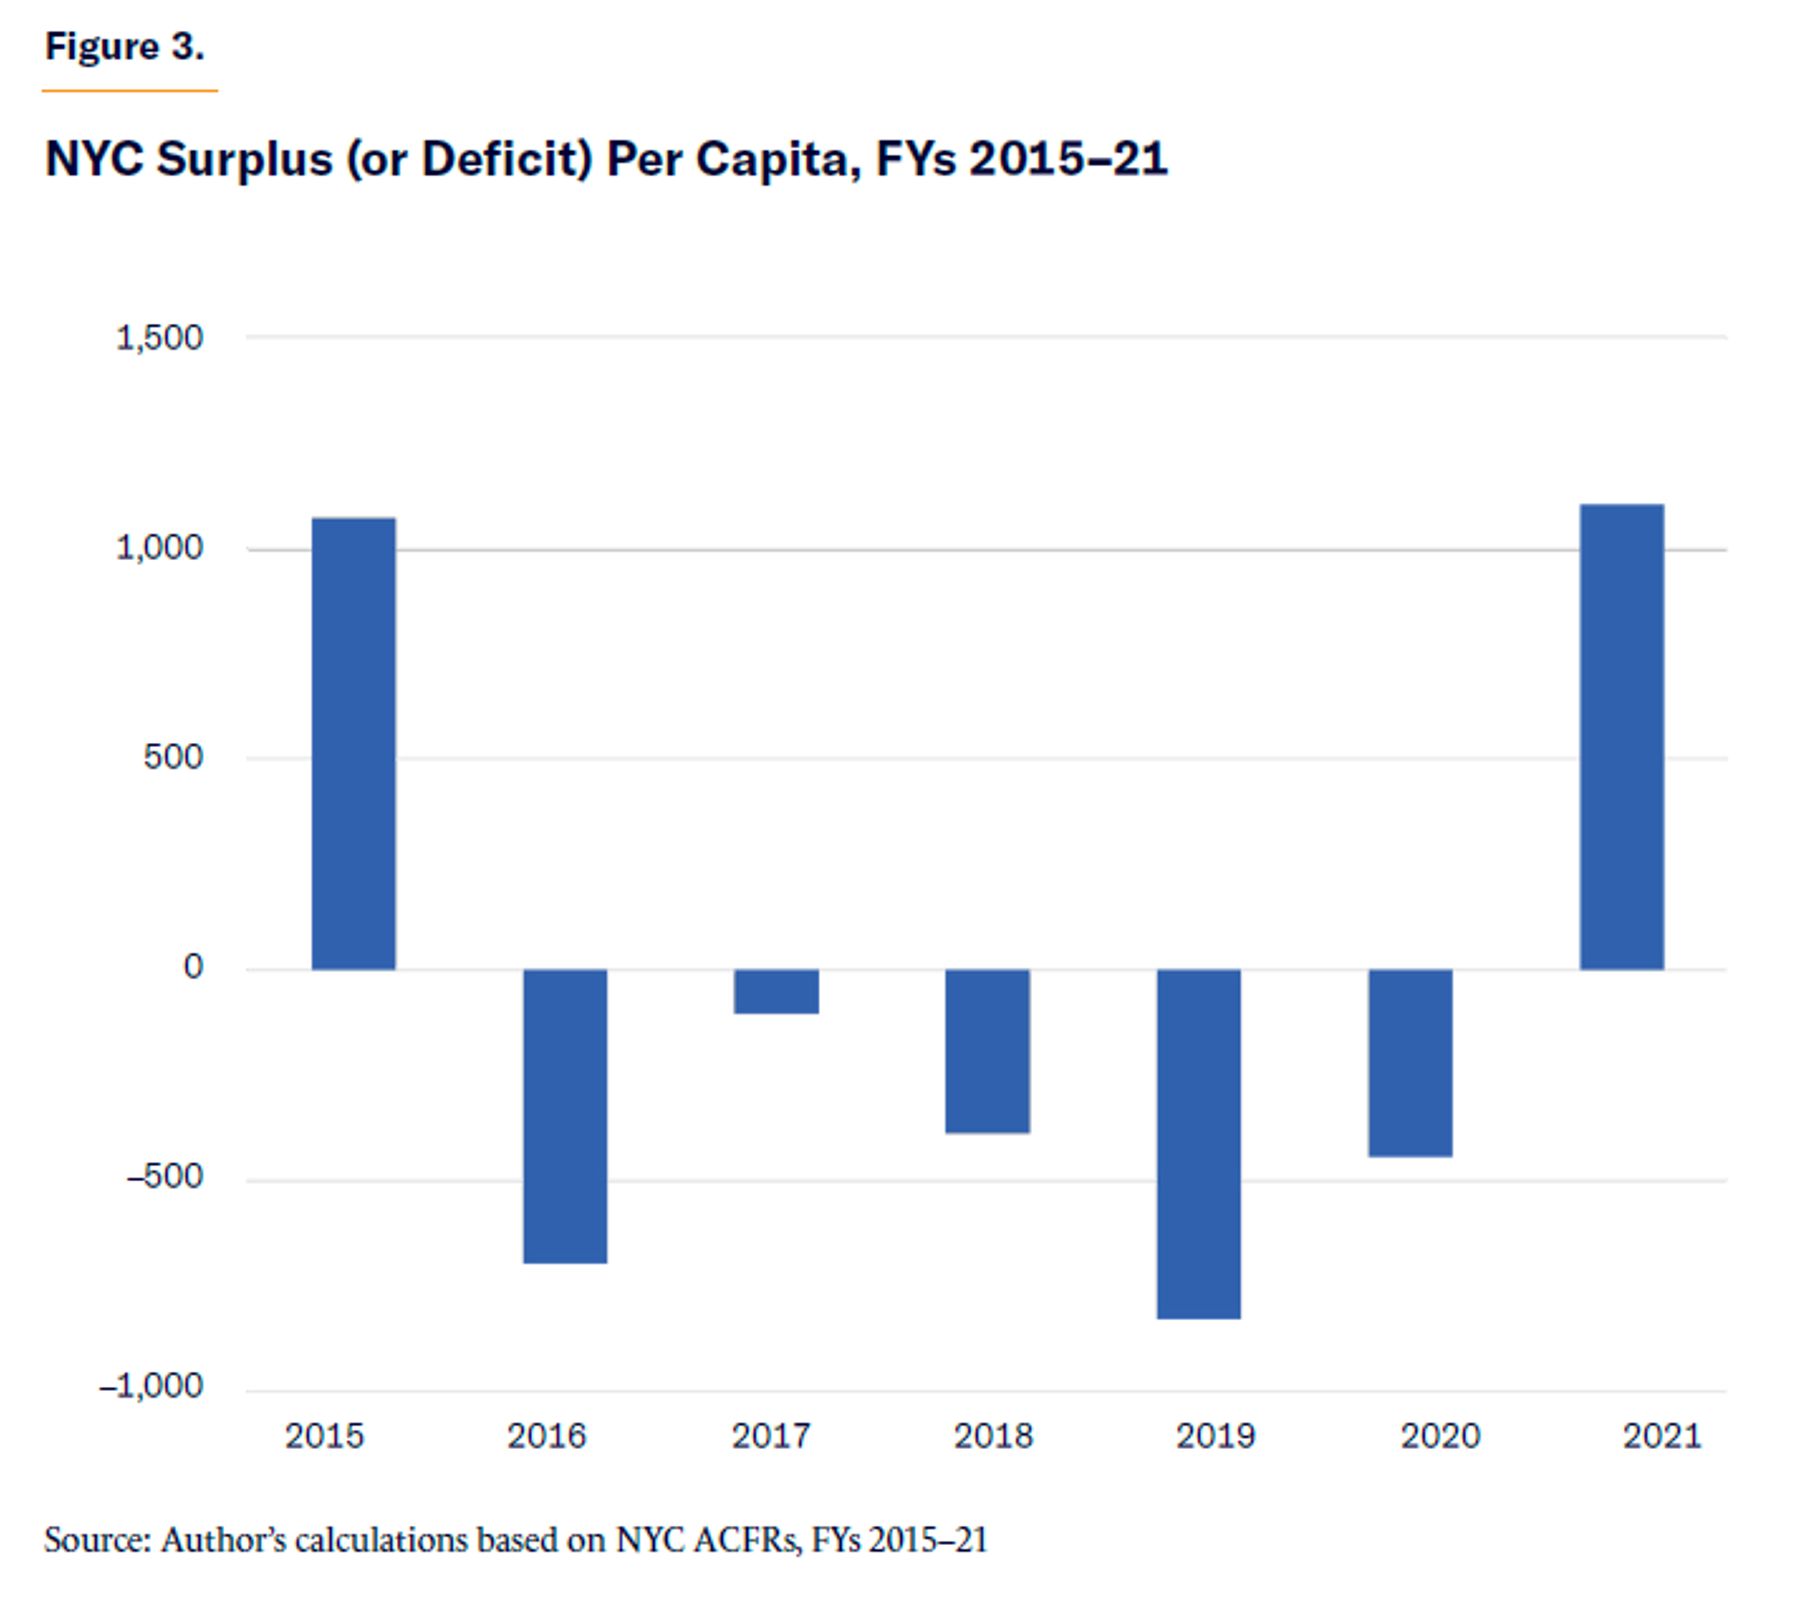
To be clear, these deficits are calculated using financial-ratio analysis that relies on the city’s ACFR, as opposed to traditional cash-based budget analysis. NYC had, on average, a deficit of $43.27 per capita per year over this period. This was driven by the operational deficits that the city held in FYs 2016–20, the worst of which took place in 2019. The city’s surplus of $1,101 per capita in FY 2021 appears encouraging, albeit with caveats. It corresponds to the improvement in the city’s operating ratio, which was primarily driven by a 9% increase in total revenues in 2021, as well as a 5% decrease in expenses. During this time, revenues increased due to real-estate tax and personal income-tax growth, the latter of which grew largely because of fiscal initiatives taken in response to Covid-19, such as unemployment-insurance enhancements.[21] There were also record high profits in the financial industry in 2021, despite the pandemic.
New York City also benefited from federal funding to aid in its Covid-19 response, including $1.45 billion in CARES Act funding and $2.94 billion in ARPA State and Local Fiscal Recovery Funds.[22] The federal support that NYC received led to 8% and 9% increases in operating grants and contributions in FYs 2020 and 2021, respectively. Some of these gains were offset by Covid-19’s impact on retail and service-sector sales taxes.
Taken together, NYC’s budget solvency metrics point to structural operational deficits in FYs 2016–20, with apparent improvements in 2021. The recent fiscal improvements should be taken with a grain of salt, given the federal grants and contributions that increased significantly in 2020 and 2021. This makes interpreting the precise fiscal impact of the pandemic difficult. What is becoming clear, however, is that the cash and budget metrics for FYs 2020–21 should be interpreted cautiously. Temporary injections of external aid are not a sustainable solution for the city’s financial problems, especially considering the deep-seated roots of these problems.[23]
Service-Level Solvency
Another way to look at the city’s financial situation is service-level solvency, which compares the city’s revenues, taxes, and expenses with the personal income of its residents. The goal is to roughly assess how much “fiscal slack” the city has in order to cover new costs by raising taxes without harming the economy. For example, the current migrant crisis—which has brought nearly 44,000 individuals seeking asylum to the city[24]—is straining city services past their capacity. If the city had more fiscal slack, it could afford to be more agile in responding to these types of public crises.
The higher taxes, revenues, and expenses are relative to income, the less fiscal slack the city has. Looking at taxes, revenues, and expenses relative to personal income provides three ways of exploring the city’s fiscal slack. This area is the most subjective of the various fiscal health solvencies and should be paired with deeper analysis of the structure of the city’s tax and expenditure system.
Figure 4 shows NYC’s performance in service-level solvency between FYs 2015 and 2021. Over this period, on average, taxes made up 9% of the city’s personal income, revenues 14%, and expenses 15% of personal income. There is no agreed-upon benchmark for how high or low any of these metrics should be, relative to personal income; but when, as in NYC’s case, a city’s expenses already typically exceed its revenues, the city has little, if any, fiscal slack to cover new expenses. In other words, if the city already cannot match expenses with revenues, it is not in a good position to respond to demands for new or improved public services. That being said, Figure 4 does show some improvement in recent years.
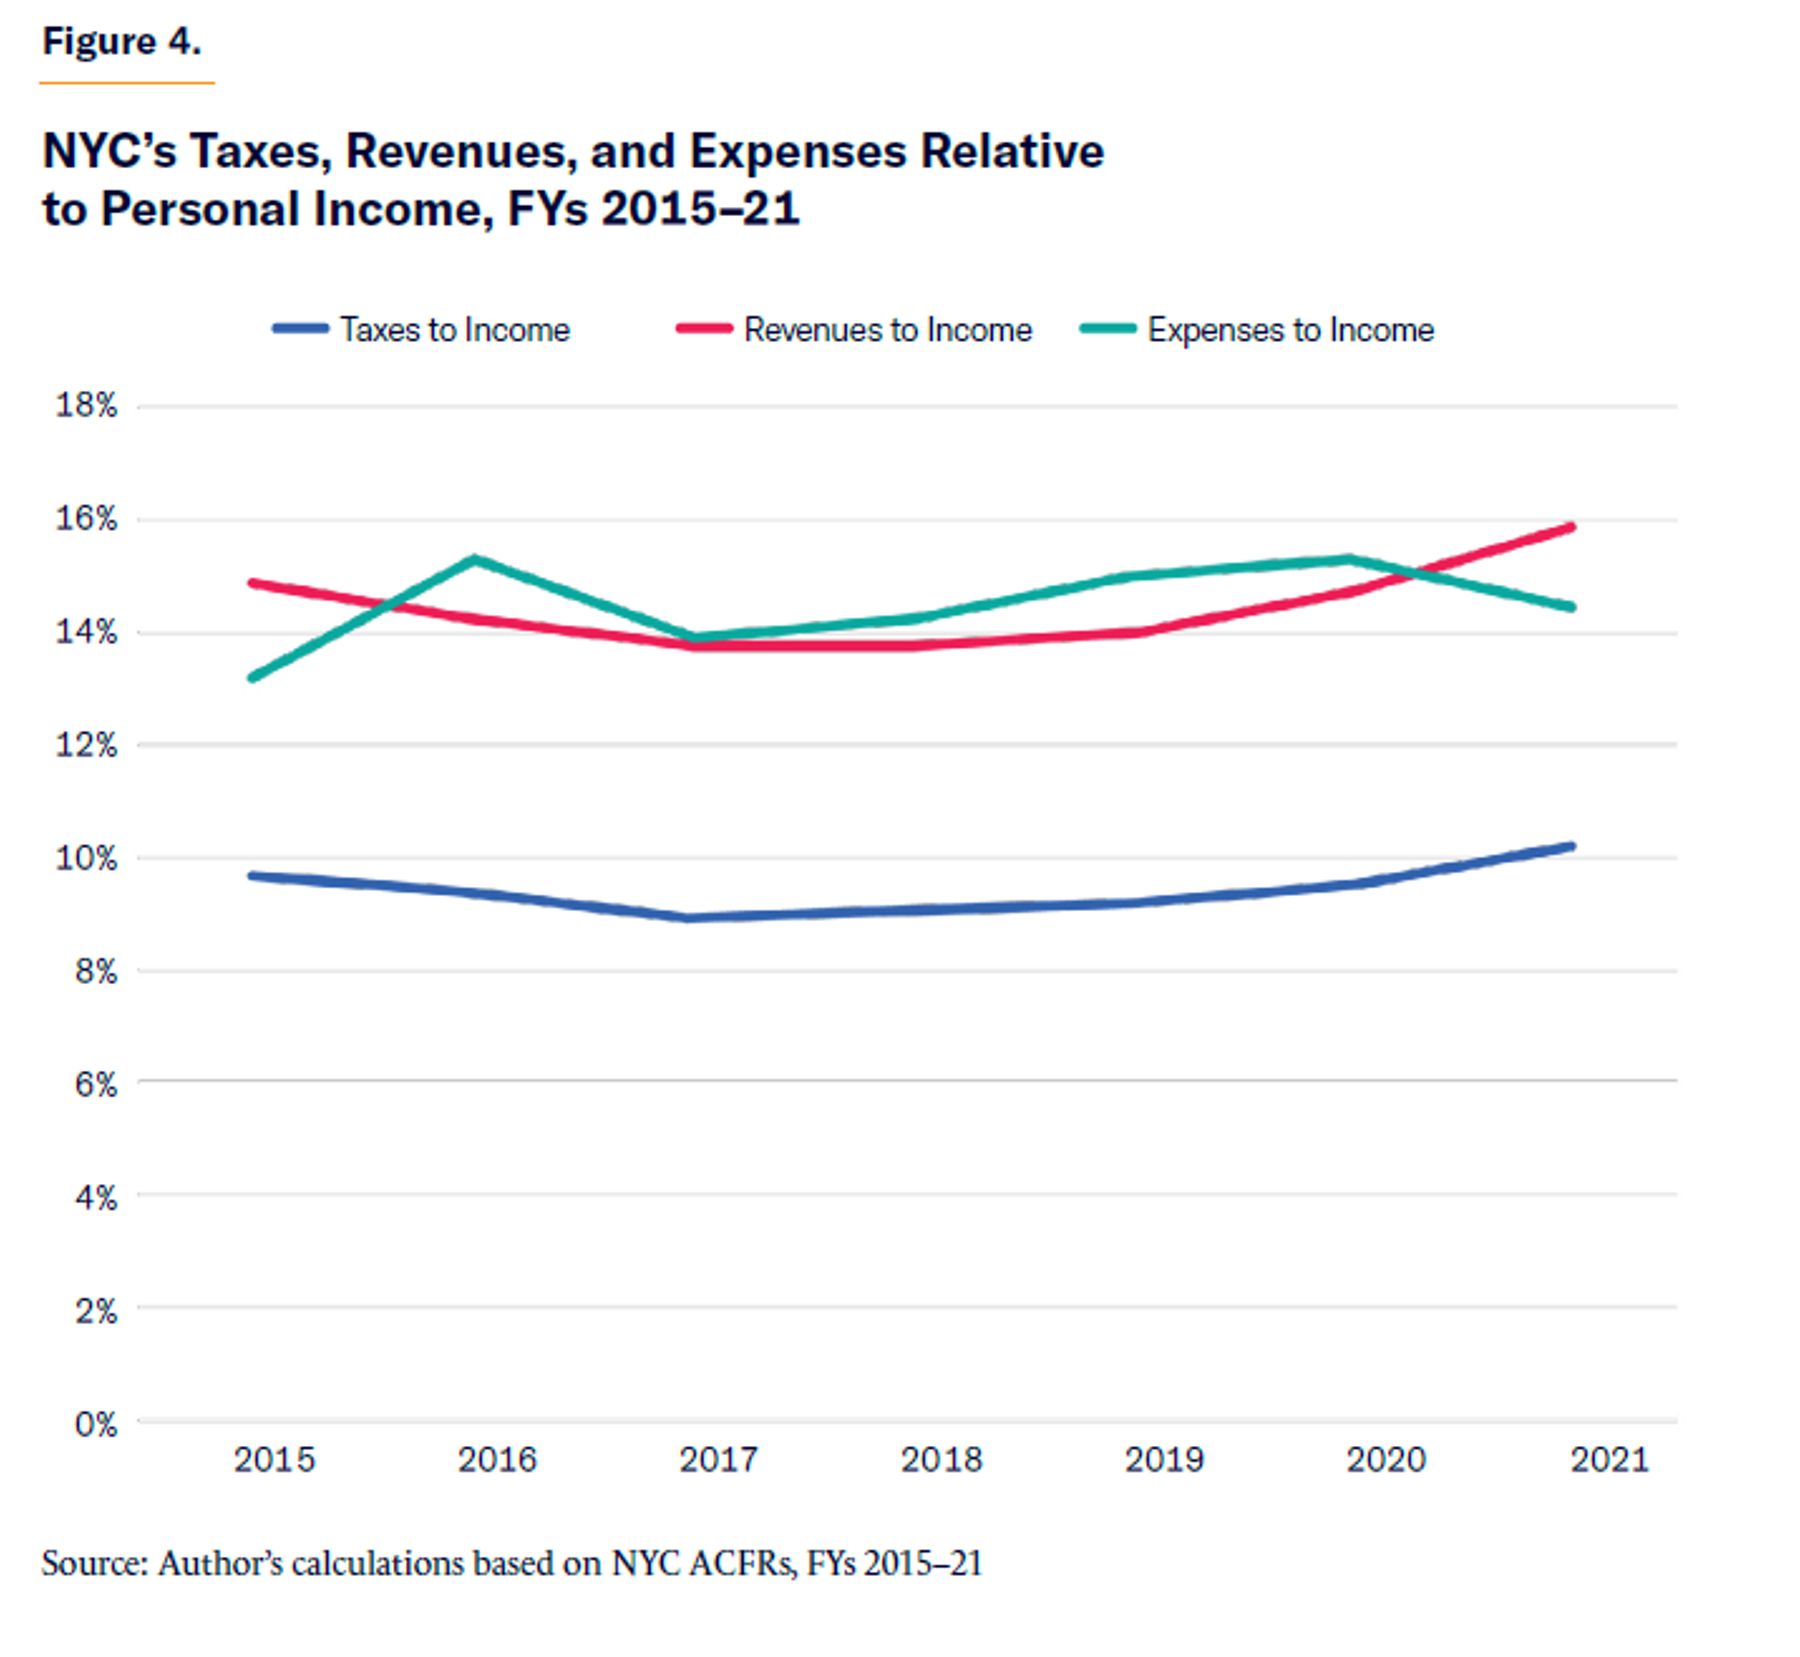
NYC’s revenues and expenses relative to income hit an inflection point between FYs 2020 and 2021, when the former started to exceed the latter. We only have two years’ data since the pandemic, so it is too soon to know how sustainable this improvement is, especially given the role played by external federal funds. Figure 4 shows that taxes relative to income have been rising, at about 3% annually since FY 2019, which also leaves less fiscal slack to invest in public services.
Although tax revenue in general has been rising relative to income, business and personal
income-tax revenues have been declining due to the pandemic, and they are expected to decline only further.[25] That, paired with Wall Street’s struggles this year, may dampen any hopes of relying on windfalls from the economy to stay afloat. As the underlying issues of a struggling labor market and rising pension costs persist, city officials are beginning to feel more of the financial squeeze.
To provide perspective, U.S. states on average had taxes, revenues, and expenditures relative to income of 6%, 13%, and 13%, respectively, in FY 2016.[26] New York City had even less fiscal slack in the same and following years. The service-level solvency metrics further conceal that the city’s residents face combined state and local tax rates that far exceed the national average.[27]
The city has also become more dependent on corporate and personal income taxes and less so on property and general sales taxes. As economists at the New York Federal Reserve have found, this makes the city’s revenues less stable and more sensitive to economic fluctuations.[28] This also makes the city more likely to encounter revenue shortfalls during economic downturns. Despite these trends, property taxes are extremely high for many properties in the city—especially for multifamily homes, relative to single-family homes.[29]
Growing inflation and rising interest rates make economists worried that a recession looms on the horizon, which would further exacerbate NYC’s financial situation.[30] A recession may not happen—or, if one does, it may be mild. However, the main takeaway for public financial management is clear: you shouldn’t base the success of your budget primarily on economic success. When the economy and, especially, Wall Street are doing well, it’s easy for city officials to rely on corporate and personal income growth. But eventually, a downturn will come, as it did with the pandemic.
Fiscal slack is essentially another way of assessing how responsive a government can be to the needs of its residents. Theoretically, a more dynamic government has reserves that are responsive to revenue volatility, debt, and voter characteristics.[31] Overall, New York’s service-level solvency is nuanced. The city’s position improved in FY 2021, when it brought in more revenue and had fewer expenses; but due to observed fiscal-management practices and lagged financial reporting, it is too soon to know whether this will persist. However, these increased taxes and revenues also translate into a worsening in fiscal slack. Although bringing in more taxes to help cover expenses certainly improves the city’s operating position, it leaves less room to further raise taxes without harming the economy. This leaves less flexibility for the city to invest in public services, which is especially worrisome, considering the city’s struggling transit system, increased crime, and residents’ increased demand for social services since the start of the pandemic.[32] This nuance shows that different measures of fiscal solvency can be at odds with one another, which is why public fiscal management requires finding the right balance between them.
It is very important to look at the manner in which revenues are raised. A sound tax system should be simple, transparent, neutral, and stable.33 NYC does have a relatively diversified tax system—but diversification alone can provide only an illusion of fiscal stability.[34] Increased reliance on corporate and personal income taxes has reduced revenue stability over the years. And during the pandemic, the city’s wealthiest residents—who contribute a disproportionate share of revenue through income taxes—have been leaving the city at record-high rates.[35] The property-tax system has been known for its opaqueness, complexity, and fostering of inequities between renters and homeowners.[36] Taken together, we see a declining population and rising taxes for the remaining residents, who are getting poorer public services in return.
Long-Term Solvency
Long-term solvency assesses whether the city has a hedge, in the form of assets, against long-term liabilities. Comparing long-term liabilities with the city’s total assets on hand is helpful because it provides context for the size of liabilities at hand. Assets on hand can also be a cushion against potential fiscal shocks. Overall, NYC has not traditionally done well in this area, especially when we dive deeper and discover that there is more going on than what is officially reported in city financial statements.
Long-term liabilities have grown at an average annual rate of 1% since FY 2015. Relative to total assets, however, they have declined at about 4% per year over the same period, as displayed in Figure 5.
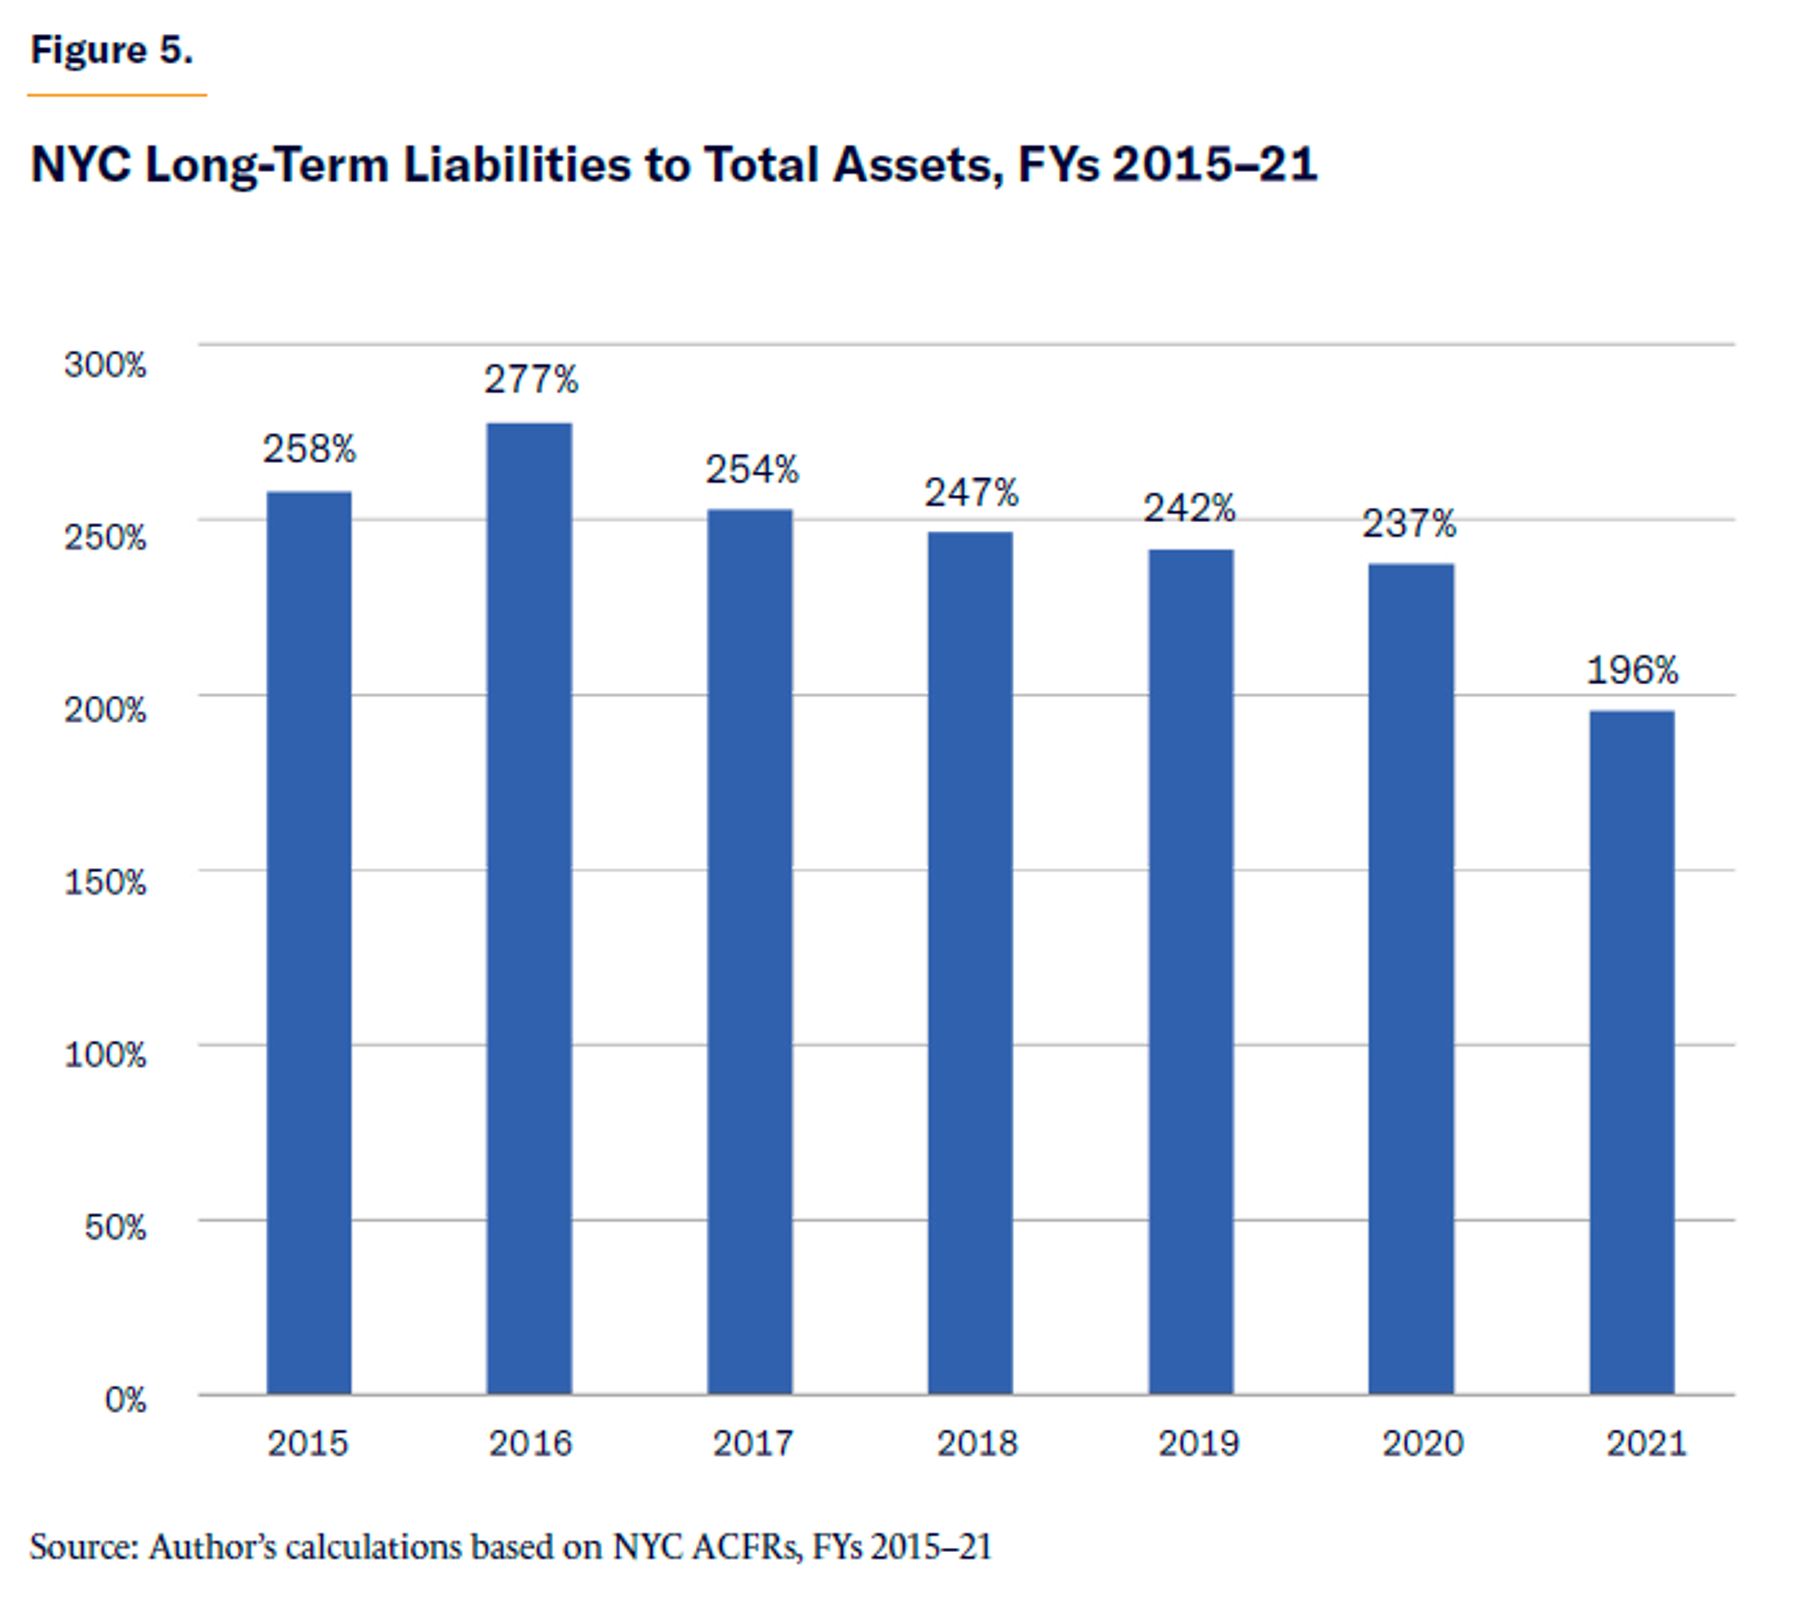
Although NYC’s long-term liability ratio has declined in recent years, it is still quite high: long-term liabilities made up 196% of total assets in FY 2021. For comparison, the average long-term liability ratio for the 50 states in FY 2016 was 63%.[37] This meant that, on average, states would theoretically be able to cover all their long-term liabilities with the assets that they had on hand, with plenty left over. New York State wasn’t too far off from the national average in 2016, with a long-term liability ratio of 58%. New York City, by contrast, had a long-term liability ratio of 277% in 2016. This means that the city is not well prepared for an economic shock or recession. It already has large long-term liabilities that it has difficulty paying down.
The largest line items contributing to NYC’s long-term liabilities are its pension benefits and other post-employment benefits (OPEB). In NYC’s ACFRs, officials attribute much of the decline in long-term liabilities to the reduction of net pension liability that resulted from increases in net investment income.[38] Another factor contributing to improvement in the long-term liability ratio is the increase in total assets that resulted from federal aid for the Covid-19 pandemic.
But the improvement in NYC’s net pension liabilities as reported in the ACFR is misleading because of the way those liabilities are measured. Although, in general, ACFRs provide a more complete accounting of the city’s financial position than its budget does, some areas—particularly, pensions and OPEB—are not fully accounted for.
NYC’s pension plans—like those of many other U.S. cities—are defined-benefit plans, meaning that the city is required to pay a certain amount of income to workers when they retire. These plans are valued based on the expected return of plan funds, which, in turn, requires the selection of an appropriate discount rate. According to the market value of liability (MVL) approach, the rate selected to value a liability should match its risk and timing of its payment.[39] The Congressional Budget Office (CBO) and many economists have applied the MVL approach to public pensions, arguing that because these pensions are guaranteed by the government, they should therefore be discounted using a risk-free rate, such as the yield on 15-year Treasury bonds.[40] However, many cities, including NYC, do not take such a conservative approach, opting instead to value their plans based on overly optimistic assumptions about expected return of investments. These assumptions do not match the appropriate level of risk of the underlying liabilities.
When calculated using the more appropriate risk-free rate, NYC’s unfunded pension liabilities have been increasing. More information on this is provided in the next section, on trust-fund solvency.
NYC’s net asset ratio is also important. As discussed previously, the change in net assets helps assess the general direction of the city’s financial position. Dividing this metric by total assets gives the net asset ratio, which represents the proportion of net assets, or assets that are left over after the city pays its debts relative to its total assets. The larger the net asset ratio, the more the city government has left over to cover long-term liabilities.
Figure 6 shows that although the city has been generally improving in this area since FY 2015, it still has a long way to go. On average, NYC had a negative net asset ratio of 1.73 between FYs 2015 and 2021. Various factors explain why this might be the case.
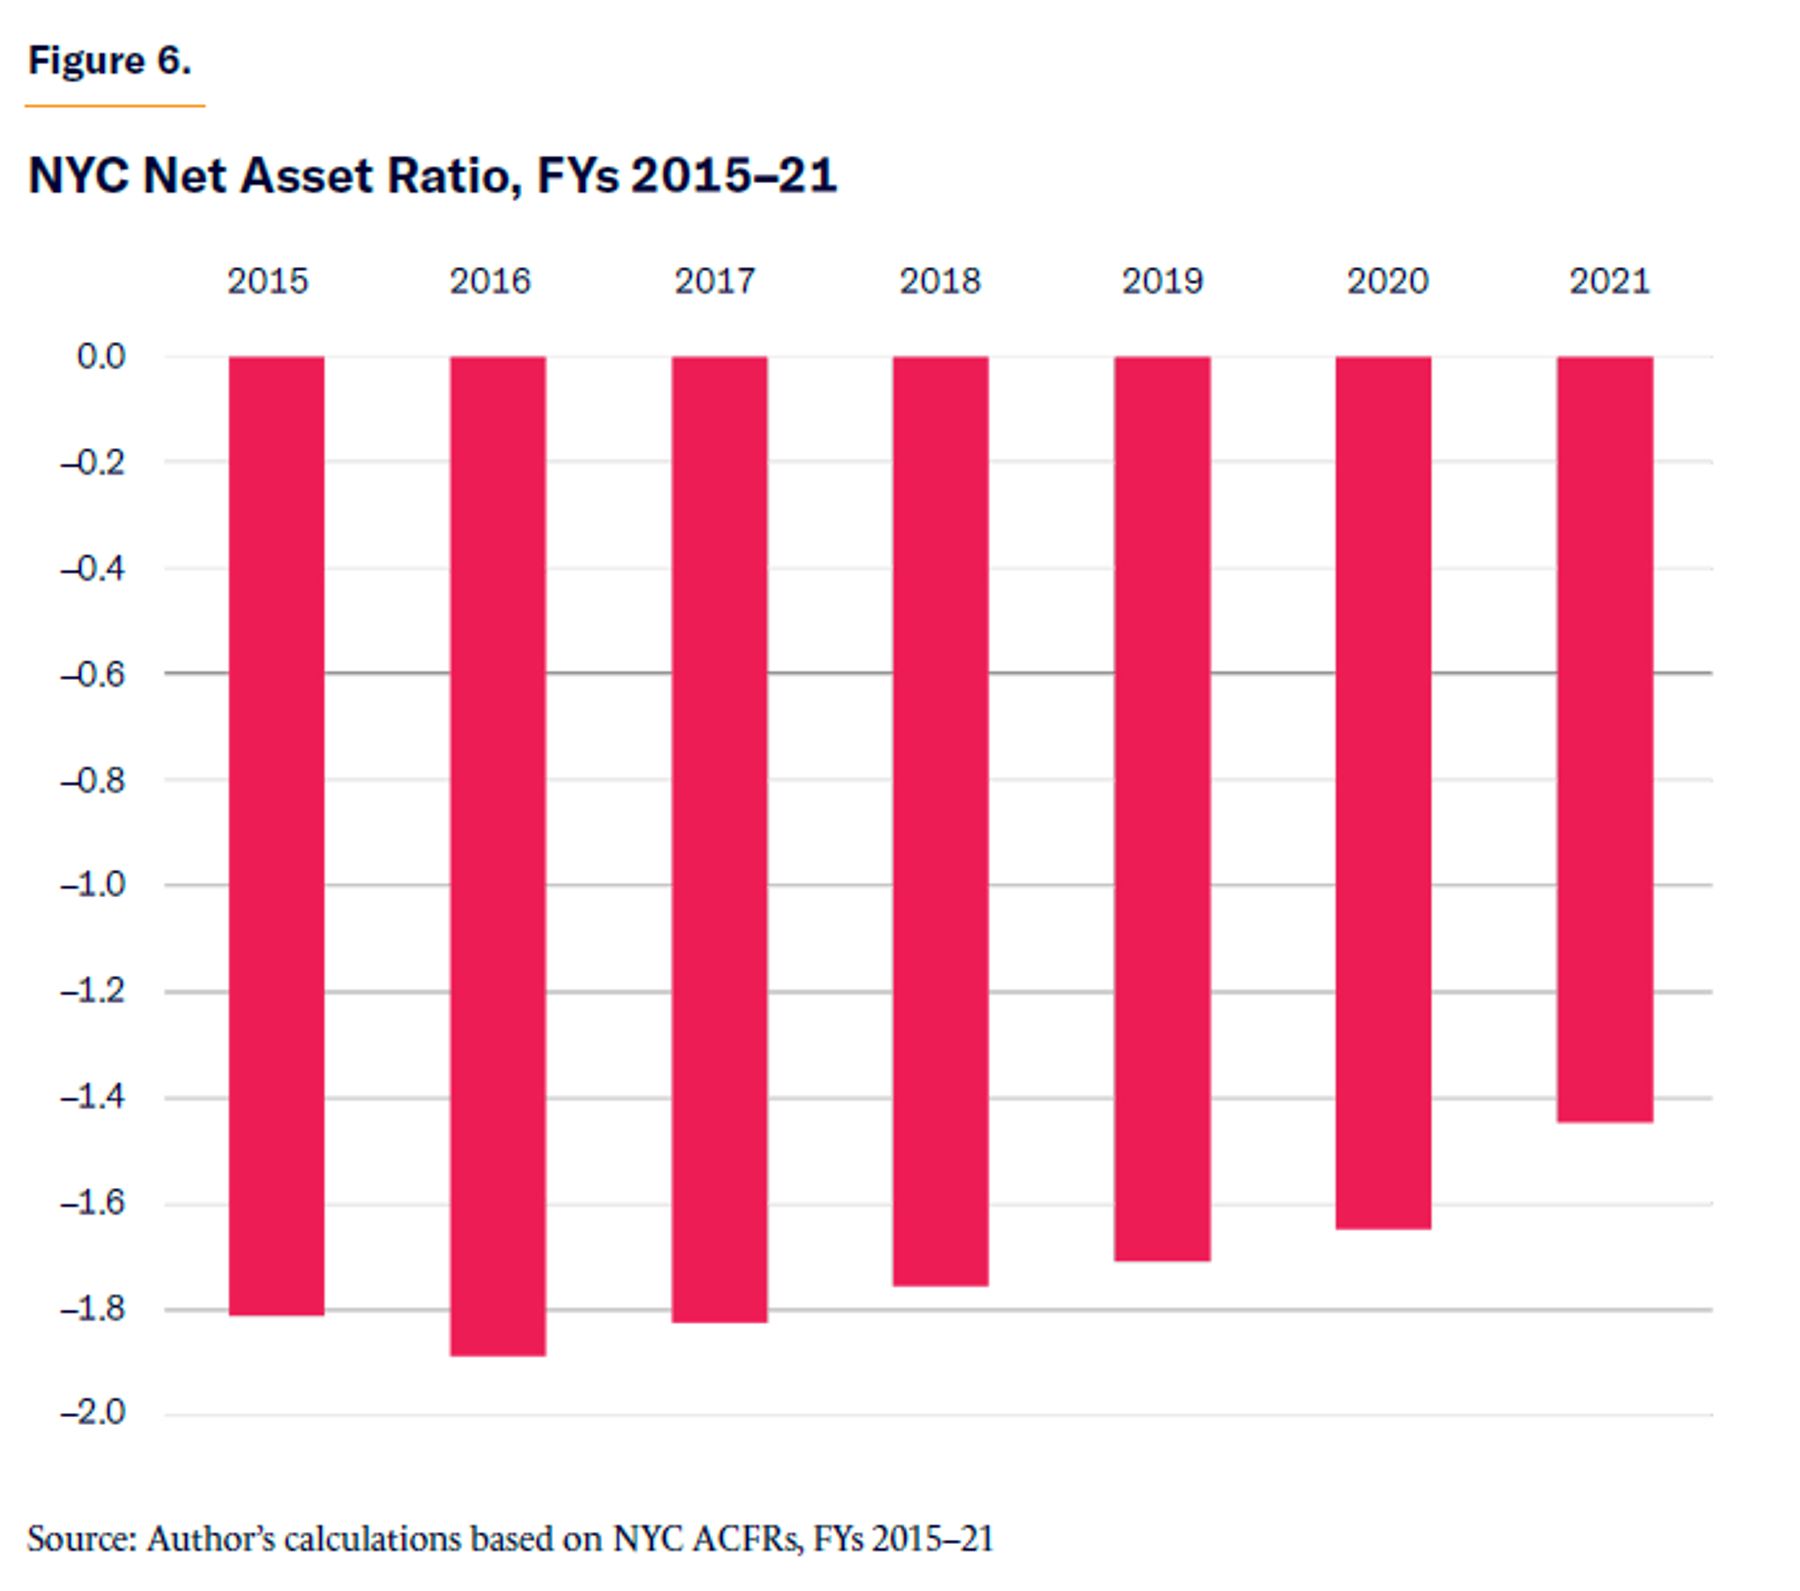
A negative net asset ratio means that the city’s liabilities exceed its assets. A certain amount of liabilities to finance the operations of the government is expected. However, when liabilities start exceeding the total assets on hand, this becomes troublesome. The precise reason for negative net assets is important. Common “ordinary” purposes for issuing debt include capital construction such as building schools or roads. Issuing debt to cover budget gaps, to make contributions to the pension system, or to cover other operational type expenses is more of a red flag for fiscal imprudence and distress. It should be noted that New York State law explicitly precludes the issuance of debt for covering deficits at the local level.[41] This acts as a legal guardrail against deficit financing in New York City.
NYC’s financial statements show debt issuance for both ordinary and extraordinary purposes. A large portion, $41.3 billion, of the city’s liabilities are financed with debt that the city issued for the acquisition and construction of public capital projects related to transit infrastructure, hospitals, and public libraries.[42] Although these are relatively “ordinary” purposes for issuing debt, the mere size of these liabilities, along with the continued reliance on the issuance of debt, is a major point of concern. The Empire Center’s E. J. McMahon argues that their magnitude is large enough to justify the reauthorization of the Financial Control Board’s (FCB’s) former fiscal oversight powers over the city.[43]
Some portion of the change in net position is due to the depreciation of capital assets, translating to about $12.8 billion in FY 2021. In the same year, $2.2 billion of NYC’s net position was restricted to debt service. A total of $118 billion of the decline in net position was due to the city’s net OPEB liability, as measured by its ACFR, followed by $9.6 billion devoted to the net pension liability.[44] As I’ll discuss next, despite the appalling size of the liabilities, they may be only a snapshot of the true size of the problem.
Trust-Fund Solvency
It is important to look at NYC’s trust-fund solvency, which measures the size of its unfunded pension and health-care liabilities. The concept of trust-fund solvency was pioneered by Eileen Norcross in a Mercatus report on state fiscal health, in order to deal with the measurement issues in pension fund reporting discussed in the previous section.[45] Overly optimistic assumptions about market returns persist in many cities’ financial reports, including NYC’s. Improvements in financial reporting have occurred over the years, due to new rules issued by GASB, but the true size of these liabilities is still not being fully revealed.[46]
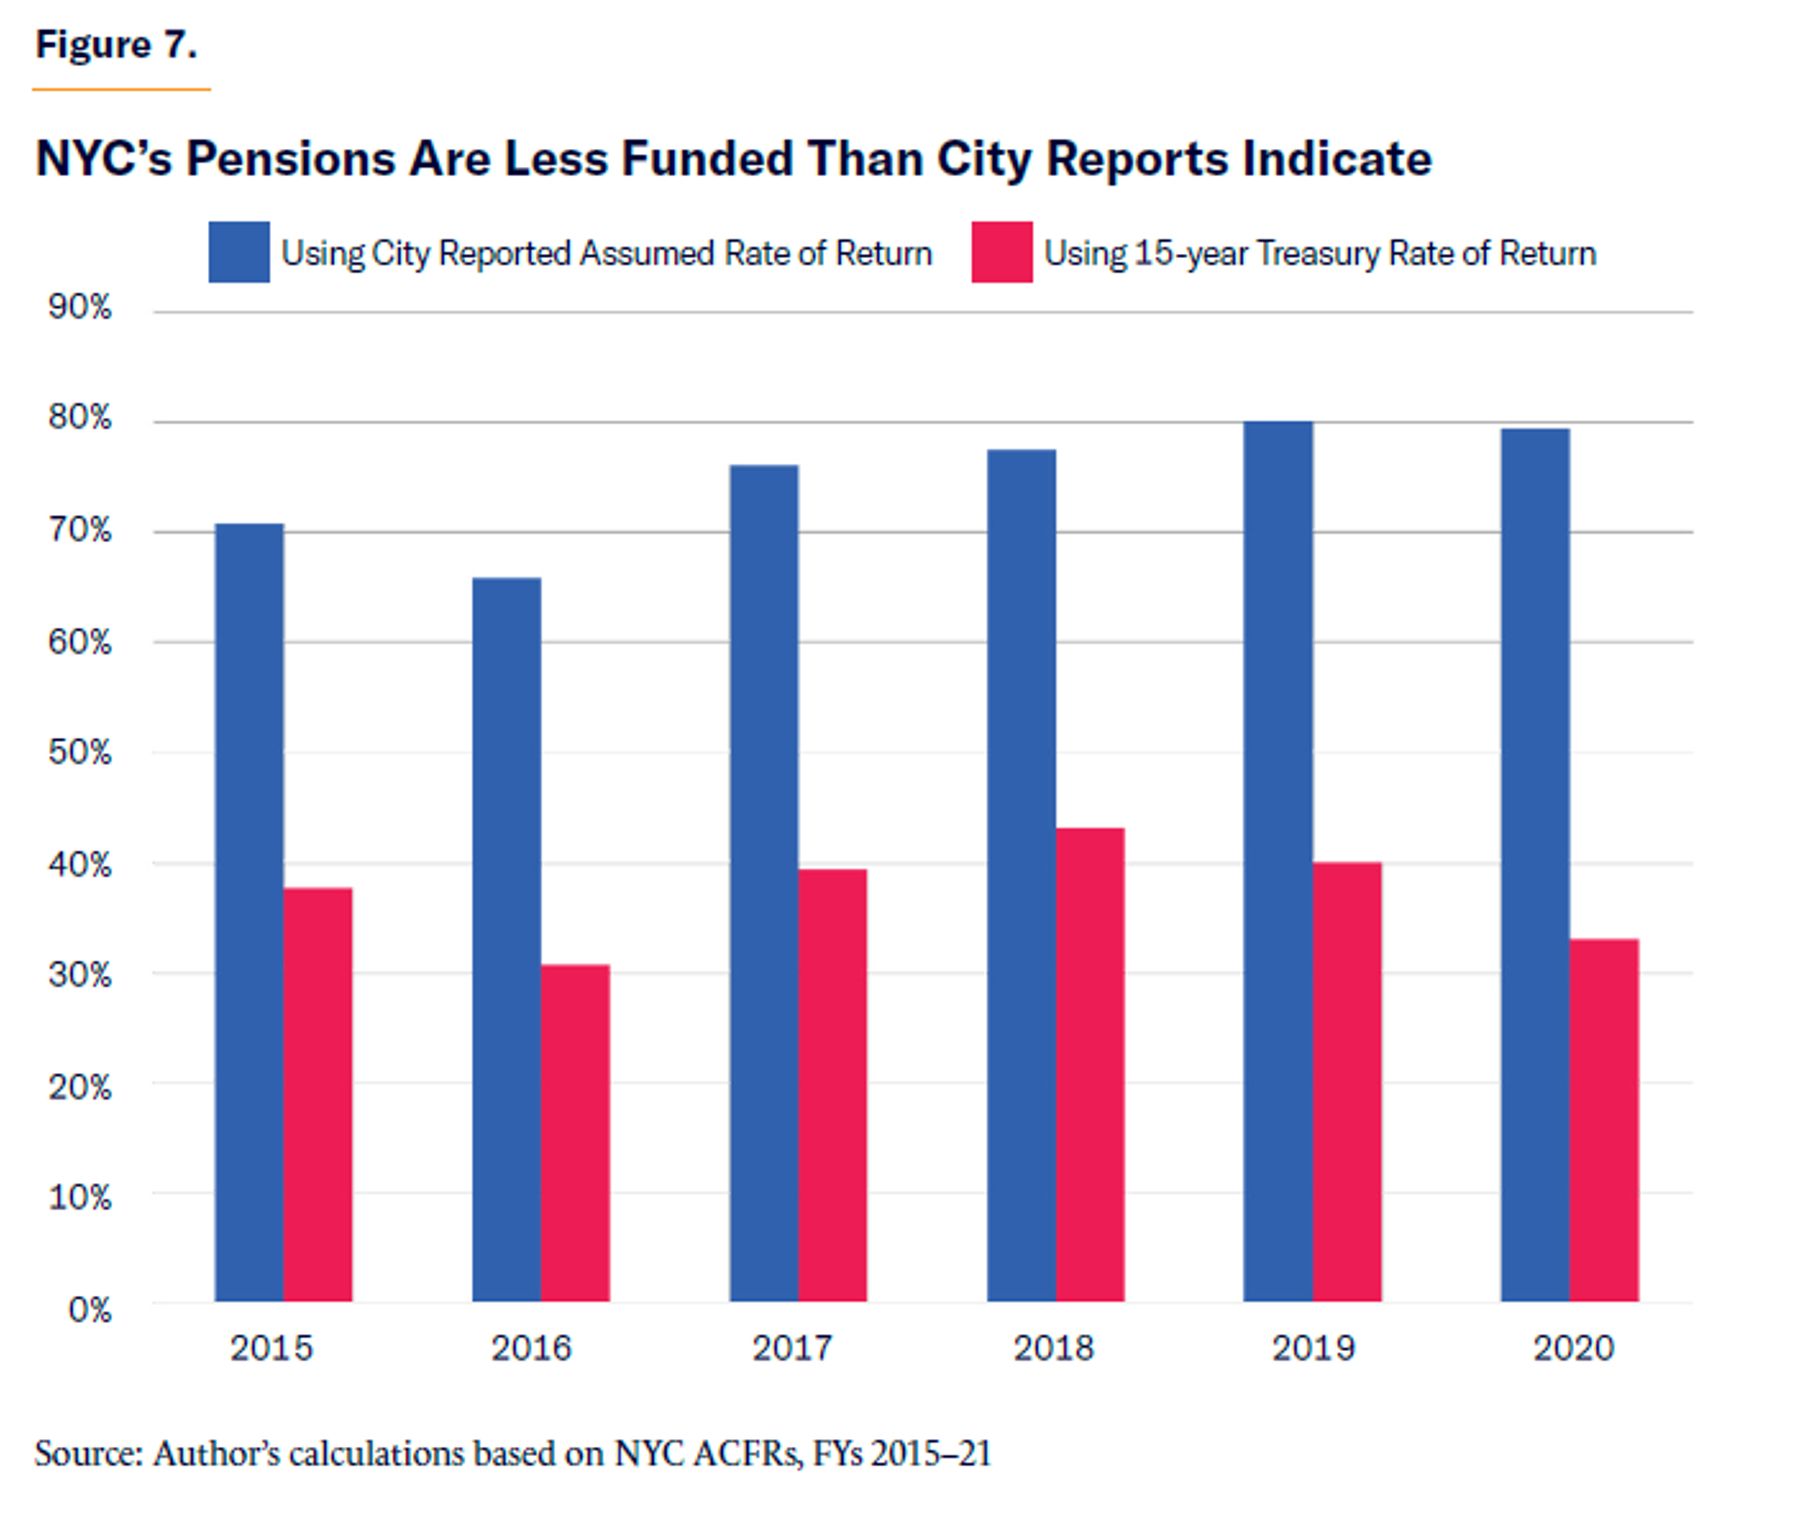
According to NYC’s reports, the funded status of the city’s pension funds has fluctuated between 66% and 80% between FYs 2015 and 2020, as shown in Figure 7.[47] These funding ratios, however, rely on the assumption that pension fund investments would obtain an optimistic 7% consistently throughout this period, without any accounting for market fluctuations. Recent research has found that between 2001 and 2022, state and local public pension plans averaged only about 5.9% in realized returns, meaning that most public plans have fallen short of actuarial expectations.[48]
The larger the assumed rate of return, the lower the calculated pension liability will be. Therefore, by using overly optimistic rates, city reports are artificially reducing the size of reported liabilities, which translates to a higher funded status. This creates perverse incentives for plan administrators and city officials to underreport the value of pension liabilities. The pressure to engage in these types of budget gimmicks only increases when fiscal health worsens.[49]
One way to circumvent these gimmicks is to require the valuation of pension liabilities using risk-free rates, as is often recommended by economists.[50] Specifically, one can use Treasury’s 15-year yield-curve rate, which ranged from 0.92% to 2.9% between 2015 and 2020. Using this rate allows pension liabilities to be valued in a way that is more aligned with their risk profile. Unsurprisingly, this has a drastic effect on the calculated funding status of NYC pension funds. Figure 7 shows this effect. When using these more appropriate risk-free rates of return, the city’s pension funding status has fluctuated between 31% and 43%.
In summary, moving from the city’s assumed rate of return for pension fund investments to more appropriate market valuations (i.e., using risk-free discount rates) produces a drop in average funding status between 2015 and 2020 from 75% to 37%. Even the city’s own reported numbers depict a dire situation when it comes to pension costs; in reality, the situation is even worse than the city lets on.
Other OPEB plans also have a poor track record of accurate reporting.[51] New York City’s OPEB plans, however, are relatively accurately depicted on the city’s reports, but they are still drastically underfunded. The city assumed a 3% rate of return between FYs 2015 and 2020 for its OPEB plans, which is much more realistic than the 7% assumed rate for pensions.
The city makes more realistic assumptions for OPEB plans because most are “pay-as-you-go,” which means that they do not record any actuarial assets, often due to the plan administrators not making adequate annual contributions to cover expenses. As a result, health-care cost trend rates are larger determinants of OPEB plan costs.[52]
For NYC, the 3% assumed rate translates to an average OPEB-funded status of 4%. Recalculating this with Treasury rates, as we did for pensions, brings the city’s average OPEB-funded status for 2015–20 to 3%. The adjustment is less drastic, but it is clear that OPEB funding status is a big problem.
OPEB liabilities receive less attention than pension liabilities because they tend to be smaller. However, NYC’s OPEB liabilities are larger than most—it reported the largest net OPEB liability in the country in FY 2019. It even surpasses OPEB liabilities held by California, New Jersey, Texas, and Illinois.[53]
Even more important, these liabilities are benefits promised to public employees and should not be treated any less seriously than pensions. With both pension and OPEB liabilities, it’s important to recognize that there is a great degree of uncertainty that needs to be accounted for and that no actuarial evaluation is going to be perfect, given this uncertainty. Thankfully, there has been a trend toward providing stress-testing in actuarial reports to account for the ranges in possible outcomes in market returns, inflation, health-care costs, and other variables that can influence pension and OPEB plans. As others have argued, because these benefits are promises to public employees with strong legal protections, it would be prudent for public managers and actuaries to give special treatment to the upper range of liability estimates.[54] Unfortunately, over the past half-century, many OPEB and pension plans have divested from more predictable bond investments and toward more risky alternatives.[55]
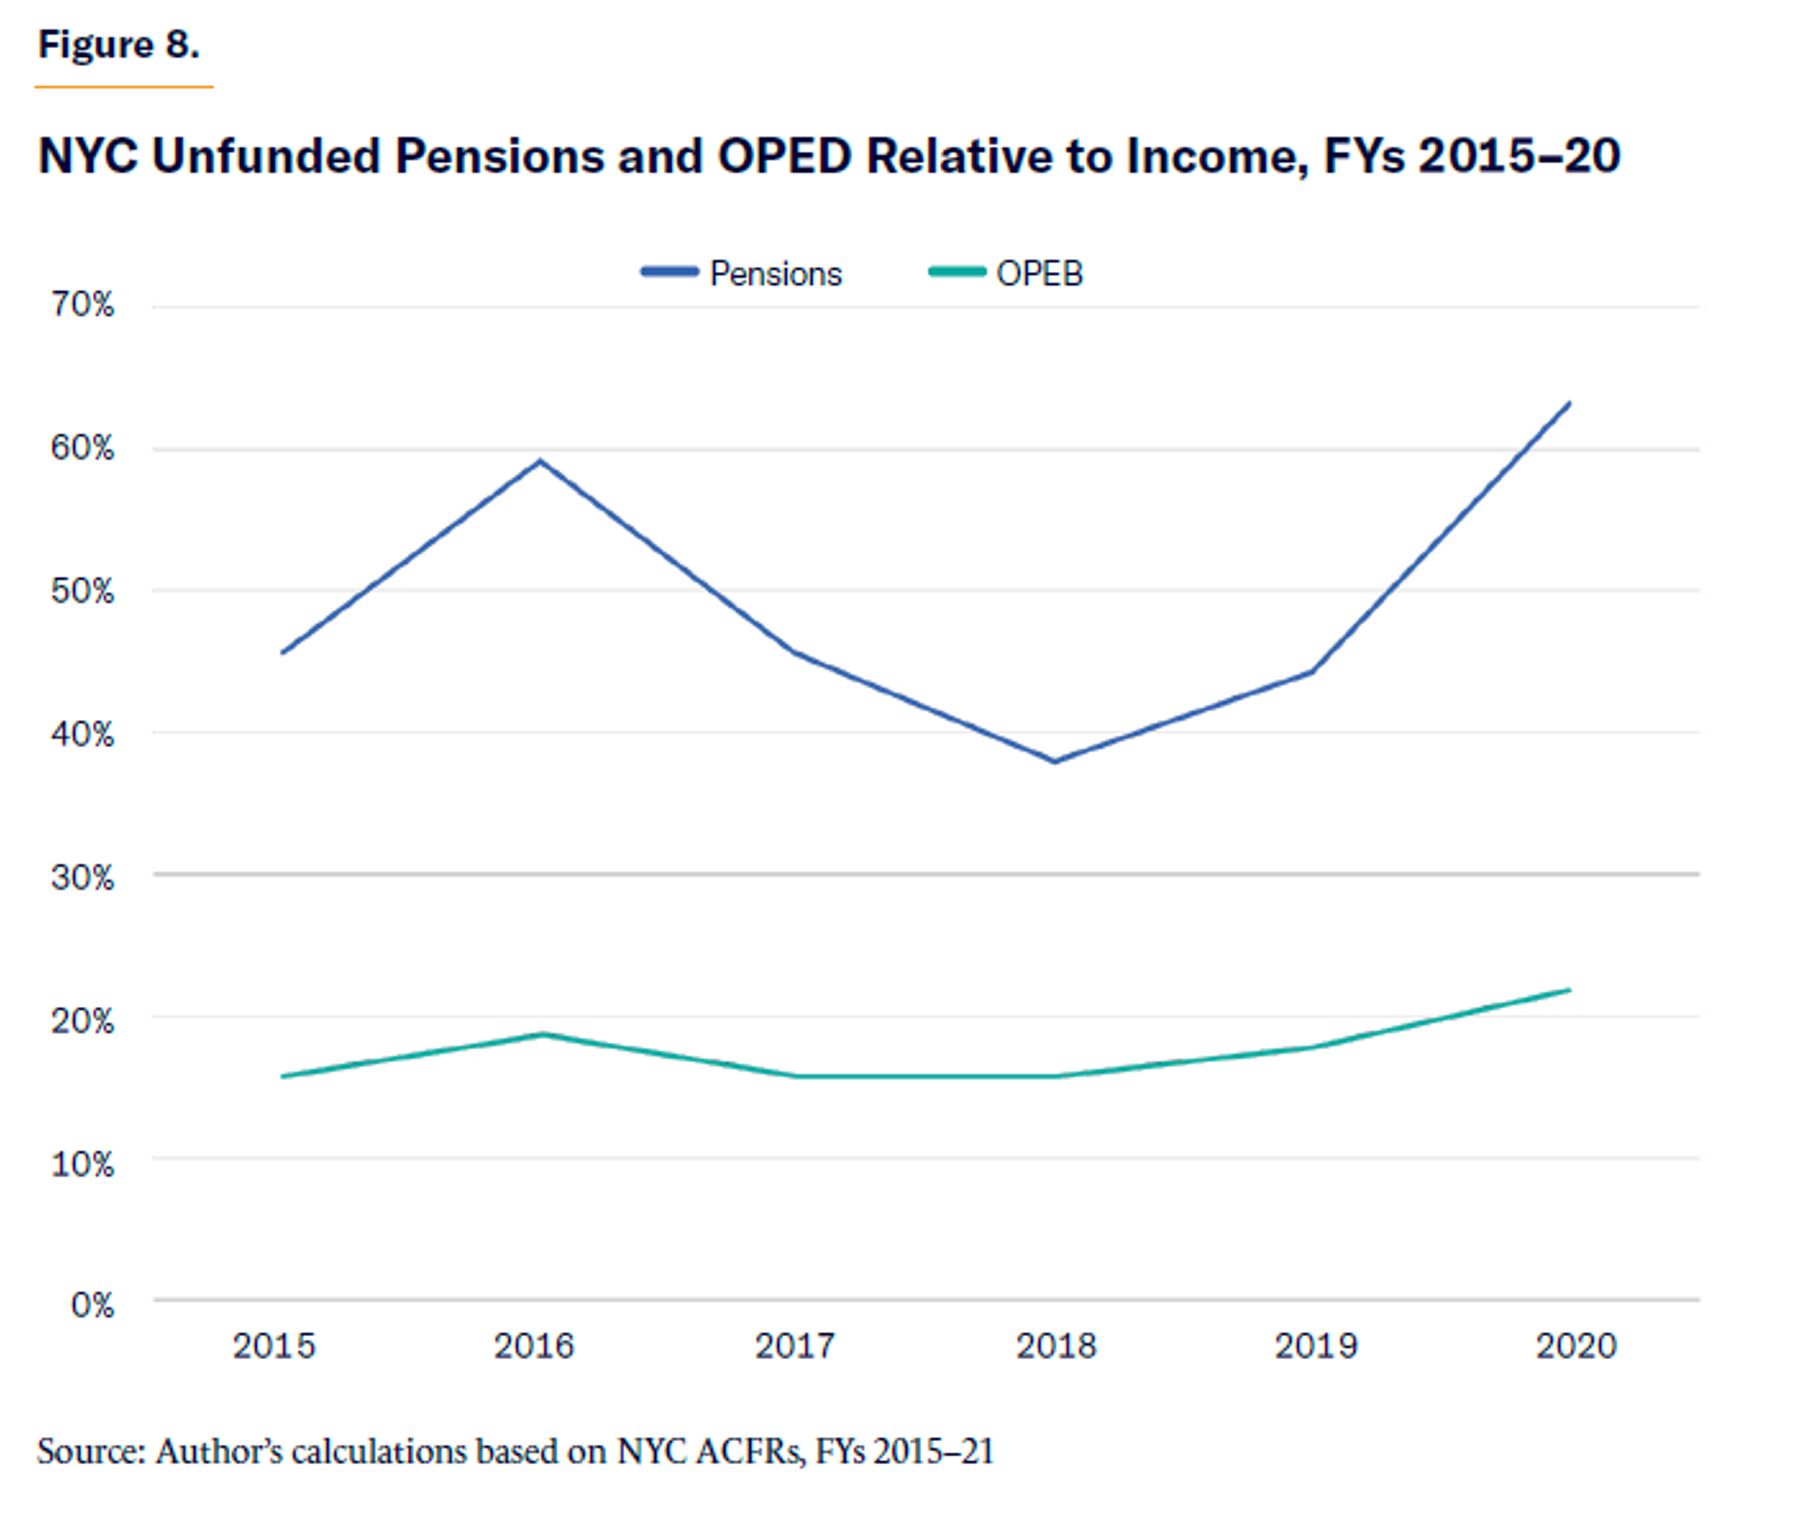
After recalculating unfunded pension and OPEB liabilities using the more appropriate risk-free rate, Figure 8 plots them relative to city personal income between FYs 2015 and 2020. On average, unfunded pensions have made up 49% of income, whereas OPEB has made up 18%, with both increasing in recent years. Most recently, in FY 2020, the city’s unfunded pension liabilities were 63% of personal income and OPEB was 22%.
Lessons for New York City
New York City’s fiscal health has been deteriorating for years. Recent federal injections related to Covid-19 recovery have created a false sense of improvement in some of the city’s financial metrics; but in fact, many of the city’s structural financial issues remain unaddressed. In this section, the main takeaways for NYC’s fiscal health are reviewed. Policy suggestions for areas where policymakers can focus efforts to improve the city’s fiscal health are highlighted.
The city has the cash solvency needed to cover short-term bills, but cash positions have been declining, and NYC’s long-term obligations loom on the horizon as bigger threats to its fiscal health. When it comes to budget solvency, NYC has a track record of difficulty covering expenses with revenues, due to structural operational deficits, as measured by the city’s ACFRs. Again, federal aid obscures these issues in recent years. But the city cannot consistently rely on federal aid to help with financial issues that stem from many years of fiscal imprudence; city officials need to find more sustainable solutions.
The city’s service-level solvency metrics show little fiscal slack, which leaves less room for the city to invest in public services. This comes at a time when the demand for more and improved public services in response to the pandemic has only increased. In addition, NYC’s revenues rely on a tax system that has grown increasingly more complex and volatile. This necessitates the consideration of real structural tax reform, not just the tinkering of rates.
Despite a reported improvement in long-term liabilities relative to total assets, the city still faces long-term liabilities that exceed assets by 96%. This means that New York is not well prepared for an economic shock, considering that it already struggles with paying down long-term obligations. It continuously relies on the issuance of debt to fund capital projects. Issuing some debt is expected; but at this magnitude and frequency, it is extremely fiscally imprudent. The city’s long-term and trust-fund solvency also points to the growing importance of addressing unfunded pension and OPEB liabilities. Underlying these metrics are the promises made to public employees through their pension and OPEB plans. Using the risk-free discount rates recommended by economists, we see that unfunded pensions and OPEB make up 63% and 22% of city personal income, respectively, in FY 2021.
Recommendations
New York City faces a very difficult fiscal environment—one that has been caused not only by the pandemic but by years of short-term thinking and fiscal mismanagement. But the good news is that there is a wealth of research to rely on; the principles of sound fiscal management are fairly straightforward. As policymakers governing the financial capital of the world, city officials have an opportunity to be entrepreneurial and pursue reforms that will turn NYC’s financial situation around and provide an example to other cities recovering from the pandemic. Each recommendation is informed by public finance research and applies principles of prudent fiscal public management.
Policymakers interested in taking sustainable steps toward lasting improvements in New York City’s fiscal health should:
Prioritize smart spending that addresses the promises that the city has already made. This is not the time to increase spending. City officials should be cautious not to overextend city coffers, especially before pension and OPEB liabilities are fully funded. There is room for continued streamlining of the administration of many of the city’s programs while not sacrificing public-service quality.[56] This includes reducing public-employee head counts through normal attrition, buyouts that incentivize early retirement, and transfers of services typically provided in the private sector. This would merely match the national trend of local government employment staying level over the past business cycle, despite the U.S. as a whole adding population.
It is important not to rely on windfall revenues to get out of fiscal trouble or to fund recurring operating expenses. This includes windfalls in the form of increased income taxes from a growing economy or money from the federal government. Neither is guaranteed, and a system that relies on either is unsustainable. To help prevent the misinterpretation of NYC’s revenue increases when windfalls are involved, the city could officially incorporate more explicit analysis of such temporary infusions into the city’s budget. Such an analysis would compare the time-limited revenues and expenditures, building on figures already calculated by the Independent Budget Office (IBO).[57] Separating out windfall revenues in official budget documents would help raise public awareness and improve accountability.
While working to improve pension and OPEB plan funding, move future public employees to more efficient plans.58 The current structure of defined-benefit pension and OPEB plans incentivizes their underfunding. By moving future employees into defined-contribution plans, like those held by many private-sector employees, the city could minimize risk and prevent the continued structurally inefficient administration of public-sector retirement and health-care costs. This could entail creating a voluntary defined-contribution pension plan that offers employees an annuity, or a plan in which potential members are offered a yearly fixed income for the remainder of their life. Participants make contributions into their account each year; and if they change jobs, the account is highly portable. Such a defined-contribution plan provides a definitive amount of income that employees will be entitled to when they retire.
The main concern that such a route usually raises is how financial risk is transferred from the city to the government employee. To combat this concern, policymakers should look to the plans currently being offered to SUNY and CUNY employees. These defined-contribution plans are administered by the nonprofit TIAA (Teachers Insurance and Annuity Association of America). Such an arrangement allows the risk to be held by a financial institution that specializes in handling it. Additionally, the entire program is optional, and there is a union that works to ensure that the annuities are fair. Creating more defined-contribution plans that mirror this approach would better manage fiscal risk and prevent the systematic underfunding of program liabilities that we currently see with defined-benefit plans. Efforts at financial-reporting reform can augment these improvements. By improving the reporting of these liabilities, NYC can more accurately depict the true size of the problem, which, in turn, will lead to more stakeholder support to expedite reforms.
Reform the tax system to generate more sustainable and equitable revenues. Simplify the tax system by broadening the base, lowering rates where possible, and reforming inequitable taxes.[59] Property taxes stand out as the ripest area for reform. The city implemented an 18.5% hike to property taxes in 2002; more recently, property valuations have led to a lagged impact of increased property values.[60] Even more important, the tax system could be made drastically more equitable by correcting the current unequal treatment of renters relative to homeowners. A study by the Lincoln Institute of Land Policy and the Minnesota Taxpayers Association, using 2020 tax rates, found that in NYC, the effective tax rate for apartment buildings was 2.55 times higher than the rate on a median-valued home.[61] Phasing out this preferential treatment would be a big step forward.
Lowering its marginal tax rates on both businesses and personal income would reduce the tax burden on residents and make the city a more competitive place to live, which is especially important, as the city has been seeing outmigration since before the pandemic. Broadening the base while lowering rates can encourage economic revitalization without compromising on revenue generation. In fact, decreasing reliance on subsets of the population for generating disproportionate amounts of revenues will help lower the budget risk associated with outmigration.
Reform the city’s rainy-day fund to generate reliable emergency reserves.[62] This includes strengthening deposit and withdrawal rules. Only recently created, in 2021, NYC’s rainy-day fund represents a step in the right direction. A comptroller report from last year recommends aiming for 16% of the city’s taxes to be deposited into the rainy-day fund.[63] The literature on the “optimal” size of a rainy-day fund is quite mixed, as it can vary greatly from government to government.[64] What appears to matter more is the structure of the rules governing deposits and withdrawals. In this direction, the comptroller report recommends a formula inspired by Virginia’s rainy-day fund, in which deposits are based on 50% of “the difference between current-year growth of non-property-tax revenues and their average growth over the previous six years.” NYC should consider this or a similar deposit rule in addition to a withdrawal rule that would allow withdrawals only after at least two continuous quarterly declines in either payroll jobs data or composite local indexes of economic activity. Implementing binding rules will help ensure that deposits are made consistently so that reserve funds are built up during growth cycles and that withdrawals are allowed only during economic downturns.
Re-empower the Financial Control Board (FCB) to provide more external pressure to hold New York City officials accountable. Each of the suggestions above may seem daunting when considering the political hurdles that often stand in the way of sensible reform. Restoring FCB’s budget oversight powers that helped the city recover from fiscal despair during the 1970s would remove pressure from policymakers to enact reforms on their own, when political incentives often tie their hands.[65] FCB has been operating in a diminished capacity since 1986, meeting only once a year to review the city’s finances, but it is still required to notify the city if a financial modification fails to conform to standards outlined by the Financial Emergency Act (FEA). The governor should take steps to permanently establish FCB; and its pre-2008 discretion to unilaterally reinstate a control period in the future, based on existing triggers, should be restored. This would allow FCB to help enforce the financial restraint that the city so direly needs. It could also help keep short-term-minded budget tinkering in check and encourage the kind of structural reforms that stick and that economists recommend.[66]
Conclusion
Pursuing structural reforms in each of these areas will generate positive reinforcing results. Not only will such reforms help the sustainable maintenance of positive operating positions and paying down short- and long-term bills, but such efforts will also signal to credit agencies that the city has improved fiscal-management practices that can only, in turn, lead to lower interest expenses and reduce long-term debt service costs.[67] Forward-thinking and prudent fiscal management will alleviate the financial squeeze that city officials currently find themselves in and ultimately create more fiscal slack so that residents can get the public services that they pay for with their hard-earned money.
About the Author
Olivia Gonzalez is an economist at the Small Business Administration (SBA) in the Office of Program Performance, Analysis, and Evaluation, where she conducts regulatory economic analysis, supports the evaluation of SBA programs, and helps leverage data and evidence as strategic assets to drive decisions. She has published research on economic development, fiscal, and zoning policies and is a Ph.D. candidate in economics at George Mason University.
Endnotes
Photo: StockByM/iStock
Are you interested in supporting the Manhattan Institute’s public-interest research and journalism? As a 501(c)(3) nonprofit, donations in support of MI and its scholars’ work are fully tax-deductible as provided by law (EIN #13-2912529).