Deciphering Retail Theft Data Implications and Actions for Policymakers

Executive Summary
Retail theft is a complex issue with conflicting narratives. Some people believe that the problem is exaggerated by authorities and retailers who are struggling to keep up with a changing marketplace. Others point to personal experiences of theft and stores being repeatedly targeted by chronic offenders and organized crews. Unfortunately, traditional crime data sources don’t give us a clear picture of the situation.
This report explores the limitations of existing data and suggests ways for policymakers to get a better understanding of the problem. It uses New York City as a case study and shows how its challenges are similar to those in other cities. This paper also draws upon examples from other major cities that provide retail-theft data to highlight the commonalities and variations in how retail theft operates throughout the country and discusses some general strategies that could be used to address retail theft in cities across the country.
Introduction
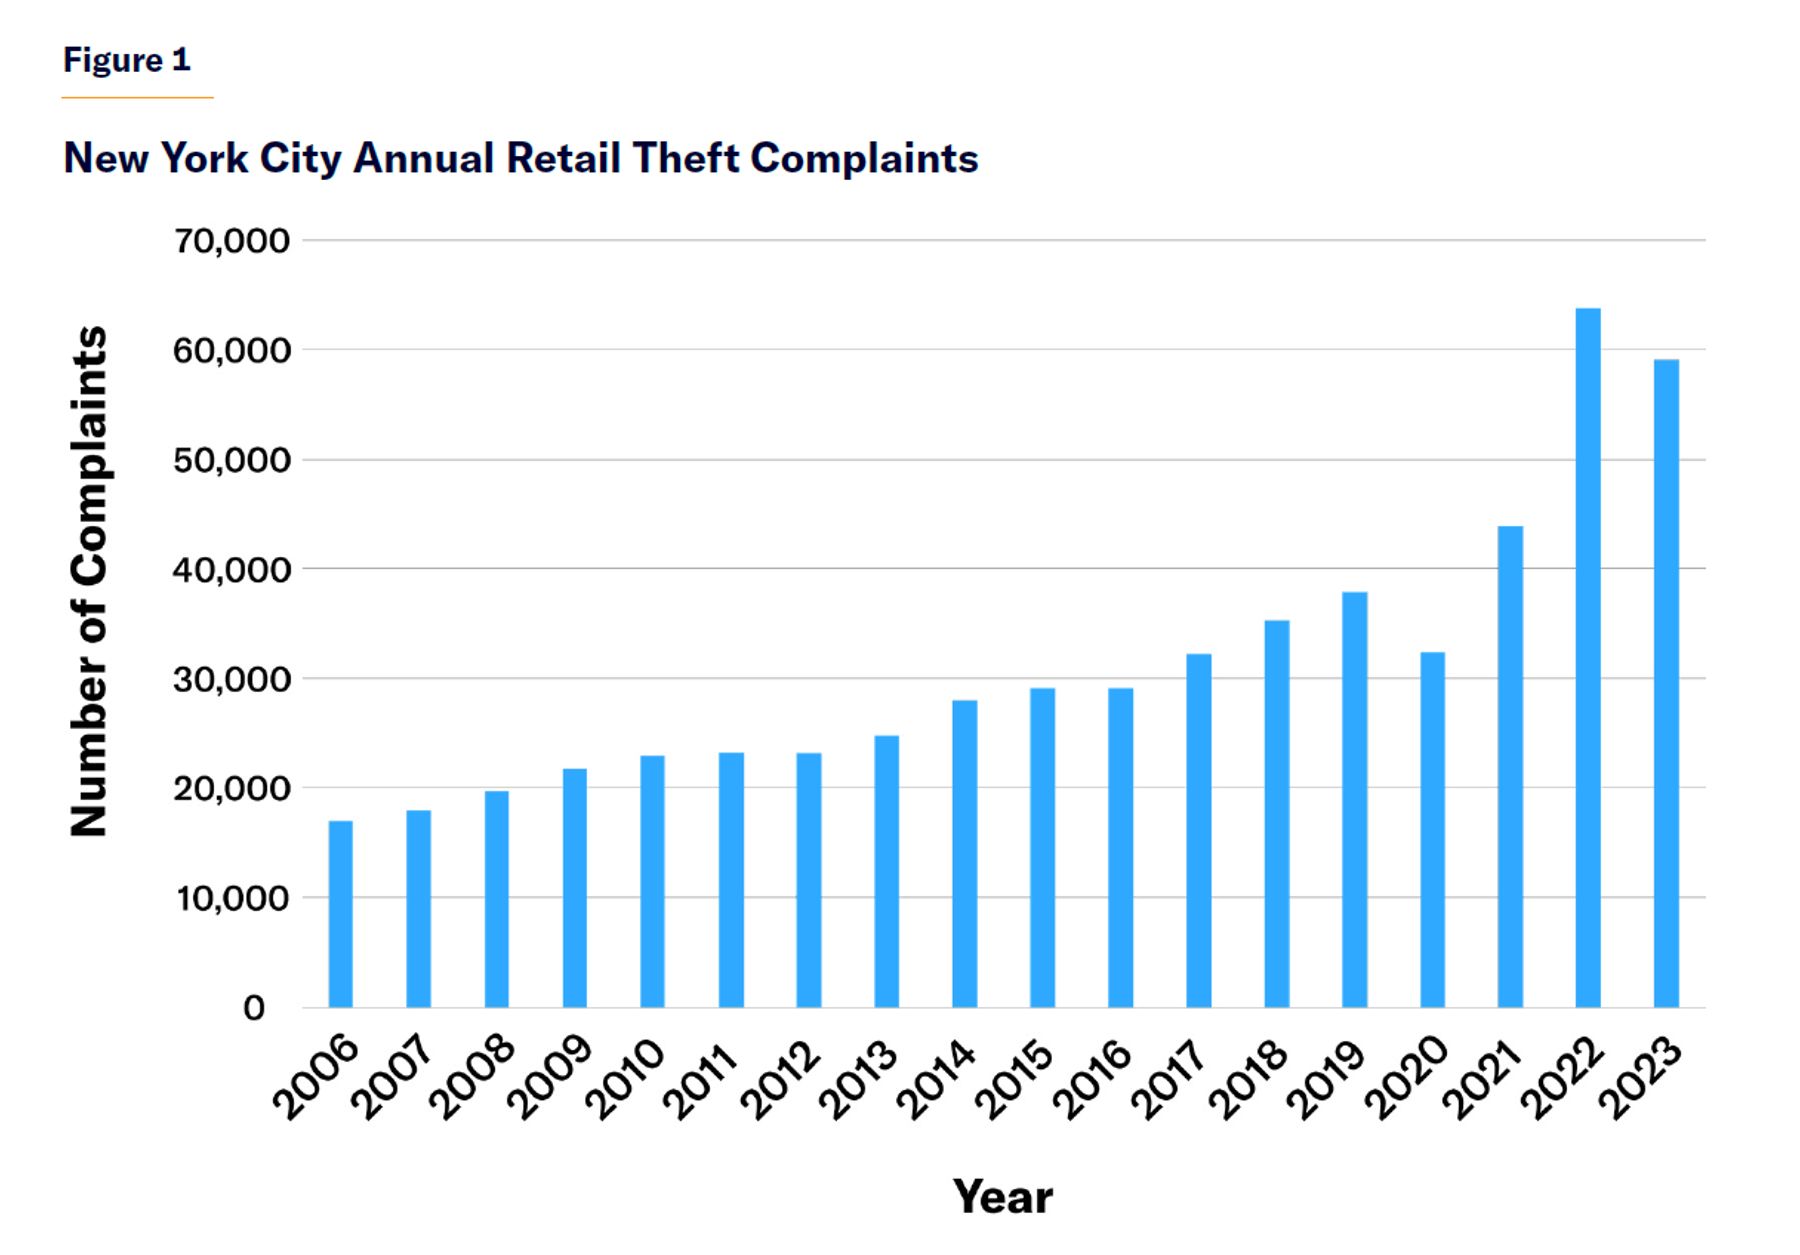
New York City’s public data show a significant rise in retail theft since the pandemic (Figure 1).[1] By 2022, the number of shoplifting incidents had increased 68.1% compared to 2019, representing over 25,000 additional thefts. Although shoplifting incidents declined by 7.3% in 2023, it was still the second-highest year on record for shoplifting, with a 56% increase in thefts since 2019. This increase in the number of shoplifting incidents occurred even as the city’s retail sector was shrinking.[2]
Retail theft has hit business districts hard. Despite a surge of police officers into business districts in early 2023, shoplifting numbers increased.[3] Within Business Improvement Districts (BIDs), reports of crime increased 5.3% year-over-year, reflecting a total 74.1% increase since 2019.[4] A few BIDs, like Church Avenue (+32.1%) and Flatbush-Nostrand Junction (+39.7%), saw particularly sharp spikes. Many BIDs have hired private security to combat shoplifting.[5]
In light of this spike in crime over the last few years, the city and state have launched several initiatives to stem retail theft. In December 2022, Mayor Eric Adams convened a summit of law enforcement, retailers, and stakeholders that resulted in a “Plan to Combat Retail Theft,” which was unveiled in May 2023,[6] and in November, the city announced the creation of a task force to execute the plan. In May 2022, Manhattan’s district attorney, Alvin Bragg, and the Manhattan Small Business Alliance announced a plan “help tackle the rise in retail theft,”[7] and in August 2023, the Queens DA announced the rollout of the “Merchant’s Business Improvement Program.”[8] Governor Kathy Hochul also announced her own state plan in February 2024.[9] Each of these initiatives involves a mix of commitments—some beneficial, some detrimental, and some ambiguous.
New York policymakers are not alone in paying increased attention to retail theft; across the country, there have been calls for governments at all levels to address the issue, which has captured widespread attention, fueled by viral videos of dramatic smash-and-grab incidents of flash mobs storming stores and fleeing with piles of merchandise.[10]
In New York and nationwide, retailers are blaming theft for store closings. Target, for example, recently claimed that the closure of nine stores was because of theft and nearby crime.[11] In San Francisco, Whole Foods and Nordstrom said they were closing stores because of theft.[12] The CEO of Rite Aid cited “unexpected headwinds this quarter from front-end shrink, particularly in our New York urban stores” as a factor in the decision to close Rite Aid stores in New York City.[13]
There has been some pushback on such corporate claims about rampant theft. Many argue that the closings have more to do with the post-pandemic shift in the retail landscape[14] toward more online shopping, which has meant a natural decline in foot traffic for brick-and-mortar stores. Critics suggest CEOs are exaggerating the impact of theft to deflect blame for lower-than-expected earnings potentially caused by this shift or their mismanagement.[15] Comments from Walgreens’s CFO, James Kehoe, who admitted on an earnings call that the company might have “cried too much last year” regarding theft, have fueled this suspicion.[16]
This skepticism has also been fueled by some analyses of police shoplifting data that found that stores that were closing had lower theft rates than other stores nearby,[17] which implies that stores may have closed for reasons other than crime. Some industry advocates and politicians have also misrepresented “shrink” numbers as retail-theft losses. Florida Governor Ron DeSantis, for instance, claimed in a social media post that shoplifting led to $112 billion in losses nationally in 2022; in fact, that $112 billion was the amount lost due to shrinkage, which refers to all inventory losses, including theft (external and employee), administrative errors, vendor fraud, and damaged goods.[18] The National Retail Federation (NRF) estimates that only 36% of shrink is because of external theft.[19]
In truth, it can be difficult to tell whether retail theft is a pressing issue or an exaggerated one, or somewhere in the middle. Ideally, we could use data to cut through the noise and provide us with some clarity. The data we have, however, is often incomplete or open to interpretation, acting as a Rorschach test that mirrors individuals’ predispositions and biases toward interpreting crime trends.
How Prevalent Is Shoplifting?
The NRF’s long-running annual Retail Security Survey provides a limited yet useful look at national trends in shrinkage and theft. By surveying loss prevention and asset protection professionals across retail sectors, the NRF aims to capture data on the “risks, threats, and vulnerabilities” from the previous year. The 2023 survey involved 177 major retailers, representing $1.6 trillion in sales and covering nearly 100,000 locations across 28 different retail categories.[20]
The 2023 survey reported a slight increase in shrinkage, defined as the total value lost as a percentage of total sales, rising to 1.6% from 1.4% in 2021. Shrinkage hovered around 1.6% in both FY2020 and FY2019. The NRF shrinkage estimate has changed little over the past few decades, measuring 1.79% in 1991 and 1.69% in 2000. Consistent with prepandemic analyses, only 36% of this shrinkage was due to external theft, including shoplifting.
But the NRF data can be difficult to interpret. First, it is challenging to isolate shoplifting from the other causes of shrinkage. Interpretations of NRF data also frequently suffer from an ecological fallacy—that is, the assumption that the aggregate trend applies to individual businesses. The NRF survey hints at this problem by highlighting a shift in the distribution of shrinkage percentages across businesses. In 2022, 35.8% of respondents reported shrinkage exceeding 2%, compared to 27.3% of respondents in 2019. This shows that a subset of businesses experienced more significant losses than in years prior, while the aggregate numbers stayed constant. The report also revealed variations across sectors, with pharmacies, groceries, and department stores averaging higher shrinkage than jewelry and home furnishing stores.
Small sample sizes also may limit the generalizability of the NRF survey. While participation has grown substantially, from 55 and 63 respondents in 2021 and 2022, respectively, to 177 in 2023, the number of respondents is still relatively small. And the results are subject to voluntary response bias.[21] Retailers with stronger feelings about theft or security may be more likely to take part, thereby skewing the results. Similarly, the rising salience of shoplifting might induce more retailers to take part. If so, the survey would overestimate serious shoplifting concerns.
Aggregate national figures also cannot capture variation across cities and individual store chains. A store’s vulnerability to shrinkage from theft depends on several factors: the surrounding neighborhood, store security practices, foot traffic patterns, physical environment design (including building layout and security measures), a local jurisdiction’s prosecution policies, and local law enforcement’s response to theft. Understanding the retail theft problem requires an examination of local and company-specific data. Local solutions require local data.
The Council on Criminal Justice (CCJ) Crime Trends Working Group looked at local retail-theft data in cities across the country and released a report on shoplifting trends in November 2023.[22] The CCJ has excelled at making sense of U.S. crime trends by aggregating the country’s fragmented local crime data. For their retail-theft report, they focused on 24 major American cities that kept at least five years of shoplifting data.
The report revealed a 16% increase in reported shoplifting incidents across the 24 cities when comparing the first half of 2019 to the same period in 2023. Buried within the aggregate increase were significant local variations, however. New York City was an outlier, experiencing a 64% rise during that period. When it was excluded, the remaining cities showed a 7% decline on average.
The report also considered recent year-over-year trends (2022 vs. 2023). Here, Los Angeles and Dallas had the sharpest increases, with reported shoplifting incidents surging by 109% and 73%, respectively. Seattle and San Francisco reported the largest reductions, 31% and 35%, respectively.
Many news outlets reported on the CCJ report’s findings, igniting a debate on the actual scale of retail theft. Some interpreted the data as evidence of retailer exaggeration, drawing on the well-documented tendency of people to overestimate crime rates and the possibility that retailers might have inflated the issue during earnings calls to explain lower profits.[23] Some jurisdictions saw the report as a vindication of their antishoplifting efforts. San Francisco’s mayor and police chief, for example, cited the study (which used their data) as proof of their success in tackling shoplifting.[24]
CCJ acknowledged that its analysis could be plagued by changes in reporting of theft. They note that the increase in documented incidents might not signal an uptick in thefts but rather better detection or increased store reporting. If so, then shoplifting incidents may have been more widespread and persistent than previously believed. As will be discussed, underreporting—along as well as erratic reporting—poses formidable obstacles to gauging shoplifting trends through police data.
Issues with Police Administrative Data
The limits of police administrative data have long been understood. In his book, The Sociology of Shoplifting: Boosters and Snitches Today, Paul Lemke points out that FBI records collected from police departments suggested a massive increase (over 200%) in shoplifting between 1973 and 1989.[25] However, a separate national survey spanning part of that period (1977–88) showed no change in shoplifting rates among high-school seniors. Across two surveys over a decade apart, roughly 30% of students reported shoplifting, but shoplifting rates did not change. This discrepancy suggests that widespread changes in reporting practices, not a surge in shoplifting, explain the increase. Lemke argues that the survey’s generalization, while imperfect, offers a better picture of the trend than police data.
Detection
To report shoplifting, one must detect it, but most instances go unnoticed. Older studies from the 1980s have estimated that only a small fraction of shoplifting incidents are discovered, ranging from 1 in 100 to 1 in 1,000.[26] The National Association for Shoplifting Prevention has recently claimed a detection rate of 1 in 49 thefts, but the basis for this figure remains unclear.[27] Although security technology has probably improved detection rates, the true number of incidents is likely an order of magnitude higher than what gets detected.
Reporting
Even when shoplifting is detected, it is not always reported to police, which further clouds any estimate of its prevalence. Some businesses are reluctant to report incidents. A Forbes survey of 660 small business owners partly explains why. Only 33% reported shoplifting incidents to insurance or the police.[28] Most (55%) find the reporting process too time-consuming. Nearly half (49%) are hesitant to involve the police, while another third (34%) doubt the effectiveness of law enforcement. These challenges disproportionately affect small businesses with limited resources.
This may help explain why a select few stores, typically large chain retailers, dominate the reporting. In New York City, for instance, despite the existence of tens of thousands of retail establishments, 18 individual department stores and 7 chain pharmacies accounted for 20% of reported thefts.[29] Chain stores, chain pharmacies, and department stores accounted for 75% of the city’s reported shoplifting. The sensationalized “smash and grabs” of upscale Soho boutiques, though captivating, represent the exception, not the norm.[30]
Using the same data sources as the CCJ report, we find that this pattern is consistent across other American cities. In San Francisco, half of all shoplifting reports in a single month were from a single chain store.[31] The top 25 locations in the city, which include major retail chains, account for 63.2% of the city’s reported shoplifting incidents. It’s the same situation in Minneapolis: in 2023, a single block with a Target store accounted for 22.1% of all shoplifting complaints, while another plaza with a Target store added another 20%. In St. Paul, Minnesota, a location with a department store accounted for 35% of theft reports. This pattern extends to Chicago and Seattle, where the top 25 locations account for a significant share of shoplifting complaints—27.2% and over 50%, respectively. These few locations have an outsized influence on a city’s overall reported shoplifting numbers. Changes in reporting practices at these locations can therefore give a misleading impression of shifts in citywide crime trends.
Perhaps the most stunning example of this problem comes from a single location within San Francisco’s Metreon shopping center, at 789 Mission Street. In 2021, this location saw a dramatic surge in shoplifting complaints, jumping from 6.3% of all city complaints in August to 39.8% in September. News reports attributed this spike to a new reporting system at the Metreon Target store.[32] This location then became the epicenter of shoplifting in San Francisco for nearly nine months.
In June 2022, shoplifting complaints from this same location abruptly slowed; there were no reported incidents in July, September, or October 2022 (Figure 2). The data show that reports were made only when they accompanied arrests. In 2022 until June, fewer than 2% of over 500 reported incidents resulted in arrests.
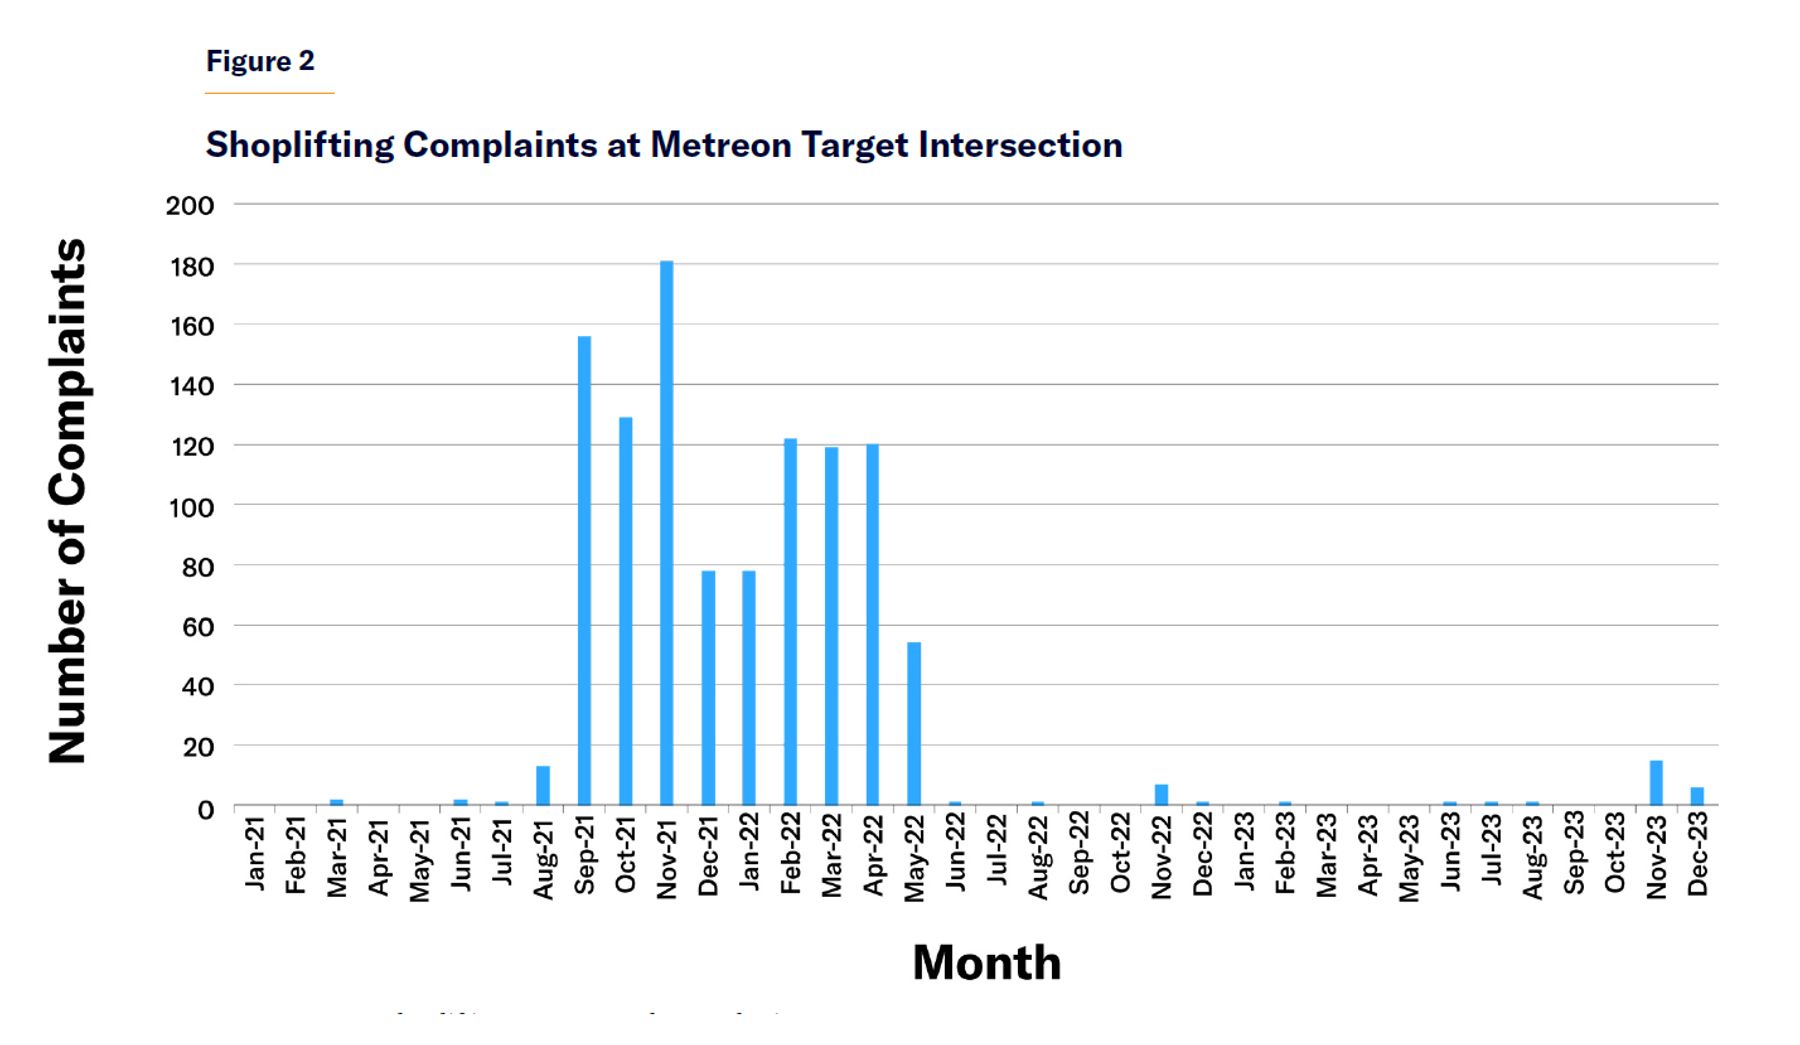
Note: Shoplifting Incidents at the Metreon Target are recorded under the intersection of 4th St. and Minna St.
On November 28, 2023, SFPD conducted a preplanned shoplifting enforcement operation, “Operation Blitz ’23,” at the Metreon location. It resulted in 17 arrests, coinciding with a sudden appearance of 15 reported shoplifting incidents at the store after a period of months with no reported activity.[33] The timing raises questions, since the SFPD justified targeting this location because of the “high number of shoplifting incidents” the store was experiencing, despite the complete absence of publicly reported thefts.[34]
Local reporter Susan Dyer Reynolds obtained public records that shed light on this choice of an enforcement target.[35] Emails between a sergeant and a commander reveal that SFPD believed that fewer than 10% of shoplifting incidents were being documented. When SFPD implemented a new phone reporting system at the Metreon Target store, the result was a surge in reported incidents, with 40 reports in just two weeks—all of which would previously have gone unreported. These figures expose the previously unknown scale of the shoplifting problem at the location. The sergeant’s e-mail suggests that before the new system, the store recorded nearly 2,000 shoplifting incident worth over $330,000, but none of these reports made it into the data.
The subsequent drop in reported incidents in June 2022 seems to represent not a decrease in shoplifting but a change in reporting practices. Since “public” reports stopped appearing after this time, it’s unclear if Target is still reporting thefts or if the SFPD’s data collection methods changed. Regardless of the reason, SFPD was presumably still aware of the true scale of the shoplifting problem at the Metreon location based on their decision to conduct an enforcement operation there. This raises serious questions about the decision of the mayor and police chief to champion their data (including the CCJ report) as proof of success and a measure of the impact of their tactics.
San Francisco’s “blitz” operations—in which it deploys plainclothes officers to target shoplifting hotspots—further expose the gap in retail-theft reporting.[36] When police look for retail crime, they find it. When they don’t, it goes unreported. The Metreon location went months without any reported incidents until SFPD conducted the blitz operation on the 28th, when they made 17 arrests and recorded 15 incidents, but shoplifting was certainly occurring on all the other days when SFPD was not around. If we assume that, on average, the store had 15 shoplifting incidents per business day (based on the number of incidents SFPD recorded on the day of the operation), then shoplifting incidents for that store alone (3,750 projected) would exceed San Francisco’s annual reported count (2,558 reported citywide in 2023). This estimate is consistent with the internal SFPD email noting 2,000 unreported thefts at this location alone in September 2021. In other words, shoplifting in San Francisco may be far more prevalent than records suggest and that the records are subject to the reporting whims of a few retailers.
This problem isn’t unique to San Francisco. The CCJ report highlights an Anaheim, California, Board of State and Community Corrections (BSCC) grant application that tells of a major beauty supply chain store that reported 20% of its shoplifting incidents in 2023 but only 8% in 2022. The application also highlights two major home-improvement retailers that recorded (but did not report to police) more incidents in 2023 than all the reports filed with Anaheim police in 2022 combined.[37] A report from the Seattle city auditor showed that major downtown retailers don’t report shoplifting at all.[38] Chicago experienced a significant drop in reported thefts at a site featuring a large national retailer, with zero incidents reported for several months.
New York City shoplifting data is similarly compromised by inconsistent reporting. In one area known for rising theft, NYPD data show almost no shoplifting at two well-trafficked stores—just one incident each over six months.[39] In 2022, one of the top three locations for reported shoplifting was the Burlington Coat Factory on Webster Avenue in the Bronx. But in 2023, this location saw a 71.2% decrease in reported incidents, with zero complaints in February. Yet during the same timeframe, nearby Fordham Road Business Improvement District saw a 55% rise in shoplifting, with Burlington excluded. It is possible that the store employed new anti-theft measures at that time, but a month without reported thefts at a store in a known high-risk area casts doubt on the data’s reliability. We should be wary of attributing these drastic drops to real declines in crime.
Any analysis of retail-theft rates must also account for the declining number of stores in the denominator. New York City’s apparent decline in theft rates in 2023 might not reflect a reduction in crime given the reduced number of stores operating in the city. Rite Aid, for example, closed several of its stores in 2022 and 2023,[40] including a store in the Bronx located on a block that had reported 451 thefts in 2022; in 2023, after the store closed, the number dropped to just 4.[41] Overall, this chain’s closures accounted for 3,500 fewer incidents in 2023, a significant part of the city’s 4,700 incident reduction. The seeming drop in shoplifting may simply be happening because there are fewer stores from which to shoplift. It’s not clear that this is a positive result.
For these reasons, police administrative data can be a dodgy measure of retail-theft trends. Most shoplifting goes undetected. Even when retailers do catch someone in the act, they often hesitate to report it. Only a few major retailers consistently report incidents, leading to a skewed representation of the problem. This inconsistent reporting consequently leads analysts to mistakenly perceive closures and inconsistent data as crime trends, resulting in flawed conclusions and policy responses.
The data on shoplifting-related violence offers a more reliable measure of the problem. Such incidents are reported with greater consistency because of their serious nature and because they typically involve a victim, which diminishes the influence of corporate reporting policies and leads to standardized reporting across various stores.[42]
The CCJ report discusses the increase in violence. National Incident Based Reporting System (NIBRS) data show an increase in the proportion of shoplifting incidents involving assaults between 2019 and 2021, despite a decrease in overall shoplifting numbers. This suggests a shift toward more violent shoplifting behavior. Similarly, the CCJ report identified a 12.5% rise in assaults in stores in a sample of eight cities between 2019 and 2022.
The 2023 NRF Security Survey also mentions the increased violence.[43] Respondents showed a 72.3% increase in concern about violence during shoplifting compared to the previous year. The survey also reveals a significant impact on retailers, with nearly half (45.3%) reducing operating hours because of violence. Nearly a third (29.7%) have adjusted product selection, and a substantial portion (28.1%) have even closed stores in certain locations.
New York City data reinforce the troubling trend of shoplifting becoming more violent. The NYPD tracks “shoplifting gone bad” incidents, categorized as robberies involving force or threat of force. These incidents nearly doubled between 2019 and 2022, and while they dipped slightly in 2023, they remain 75% higher than pre-pandemic levels. This documented rise in violence, which is forcing retailers to adapt their operations, provides a clearer picture for policymakers about the true scale of the problem.
Decision-making Without Data
The lack of reliable shoplifting data presents a major obstacle for policymakers. Bad data leads to bad decisions. Policymakers need to move beyond focusing solely on traditional police metrics. Instead, they should actively seek out any available local data points, however imperfect, to gain a clearer understanding of the specific nature and scale of the shoplifting problem in their communities.
The first step is recognizing the limits of the available data. Policymakers should not base decisions on unreliable sources, such as data prone to underreporting. San Francisco, for example, should not be using their numbers as feedback to steer their enforcement initiatives or to celebrate their progress.
Because direct shoplifting data is of questionable reliability, policymakers should instead look to related data that is reliable. The relationship between shoplifting and related violence, for example, is strengthened by consistent patterns seen across distinct data points. These data points give policymakers a starting point for devising solutions.
Talking to those affected by shoplifting also help provide more information. New York City’s retail-theft summit and task force, for example, includes local merchants, BIDs, advocates, and other stakeholders who offer local perspectives and direct experiences of the effects of shoplifting.[44] These collaborations can drive targeted, constituent-driven actions. Local groups will be more blunt, free from the need to adjust for shareholder interests.
In that same vein, policymakers can take a walk in crime-prone areas and look around themselves. Direct observation of the retail environment can be revealing. Locked products behind plastic, for example, can signal the severity of the problem. These measures deter sales and, therefore, are a last resort. Combining this ground-level view with existing quantitative data offers a more complete understanding of the issue.
By consolidating different strategies, policymakers can effectively address the shortcomings of typical shoplifting statistics, leading to the development of precise, impactful measures tailored to address local challenges. Understanding the problem allows us to develop a strategy for solving it. In New York and many other cities, this would entail improving data collection, investigations, prosecutions, and attacking the demand for stolen goods.
A Strategy to Combat Retail Theft
More Data
Given low reporting rates, it is clear every jurisdiction should try to get better data. While simply improving data collection is not a cure-all, it can offer valuable insights. Better awareness among police, prosecutors, and other policymakers leads to better responses.
One important step is to reduce barriers to reporting. Retailers cannot always spare staff to make a police report contemporaneous with an incident. Implementing user-friendly online reporting systems can simplify the process, motivating both individuals and businesses to quickly and accurately document incidents. The system should allow for investigative follow-up. To achieve this in New York, it is necessary to fix and then improve the city’s current online reporting system.[45]
Another approach involves focused outreach to increase data gathering. Collaborating with BIDs and retail associations can improve incident reporting while simultaneously facilitating interaction between shop owners and policymakers. Jurisdictions can survey these groups on retail crime. Corporate loss-prevention staff can provide insights into the patterns and challenges of shoplifting, and they can also tell analysts when corporate reporting practices change so that policymakers aren’t misled by illusory changes in crime statistics.
To grasp the scope of shoplifting, data collection must extend beyond mere incident counts. This involves tracking data on the profiles of shoplifters, their reasons for stealing, and the specific items they target. Studying criminal records and rates of reoffense is vital to assess potential future risks. It’s also important to understand whether recidivism rates are improving or deteriorating.
By collecting more comprehensive data on both incidents and offenders, policymakers can gain valuable insights into crime patterns and organization, aiding the development of more effective problem-solving strategies.
Focus on Offenders
A small group of individuals commit a significant portion of shoplifting offenses. According to NYPD, just 327 individuals accounted for 6,600 shoplifting arrests in 2022, 30% of all arrests for shoplifting that year (22,000).[46] In May, they reported that 70% of shoplifting arrestees had prior arrests, with some racking up over 30 charges in a single year.[47] Similarly, the Manhattan DA reported that from 2015 to 2021, 18% of shoplifting arrestees accounted for 42% of shoplifting arrests.[48]
Offender concentration has long been the norm in all places. The Seattle city attorney reported that 168 people committed a staggering 3,500 misdemeanor referrals between 2017 and 2022, with many of these cases involving shoplifting.[49] A 1971 study on shoplifting in Cambridge, England, revealed that a small group of offenders, just 10%, committed over half (50.6%) of the shoplifting incidents.[50] This consistency shows the importance of focusing on repeat offenders for intervention.
Many repeat retail offenders also have drug habits, which they finance by stealing. Data from Seattle’s High Utilizer Initiative, a program targeting repeat offenders through a mix of enhanced prosecution and treatment, show that drug use is a “predominant” issue among these repeat shoplifters.[51] While the program has seen some success, it also faces challenges. In its first year, eight of 168 participants died, with five confirmed drug overdose fatalities (while 51 exited the initiative).
In San Francisco, an employee at the soon-to-close Macy’s Union Square cited “drug users going after specific items for fences” as a major contributor to retail theft.[52] Similarly, a self-proclaimed addict and repeat offender confessed that acquiring money for drugs was his (and others’) motive for participating in a shoplifting ring.[53]
A 2018 UK survey of experienced shoplifters found that the majority had past or current drug problems.[54] Similarly, a review by Bennett et al. (2008) found that drug users, particularly heroin, crack, and cocaine users, were four to six times more likely to shoplift than nonusers.[55] According to one study, frequency of shoplifting is tied to the severity of one’s drug habit, with “daily” heroin users reporting 106 shoplifting incidents per year compared to 75 for “regular” users.[56]
Investigations
Publicly available data on shoplifting “clearance rates,”or solved crimes, is misleading. Underreporting artificially boosts clearance rates by shortchanging the actual denominator of total offenses. Most solved cases, or arrests, come from patrol units or store security that hands off the arrest to a responding police officer. Retail theft is rarely investigated.
For instance, NYPD’s reported shoplifting clearance rate fluctuates significantly, ranging from 28.4% in 2021 to 60% in 2017.[57] But these figures may not accurately reflect the investigative efforts dedicated to shoplifting.
The near-perfect clearance rates at specific locations show this. The Bronx Burlington Coat Factory mentioned earlier, for example, had 35 reported shoplifting incidents in 2019 (when citywide clearance rates were 48.5%).[58] NYPD arrest data for larcenies occurring at the same time and place reveals that nearly all reported incidents led to immediate arrests, suggesting a rapid response by patrol units rather than subsequent investigations by detectives, which would have led to arrests days later. When we spatially correlate NYPD arrest data with shoplifting incident data from the same location and time, we see that most shoplifting clearances result from patrol response rather than investigations.
The same can be seen in data from San Francisco, where 38 locations boasted near-perfect shoplifting clearance rates, suggesting a system that prioritizes swift arrests and lacks reporting and follow-up by detectives. As a result, cases of retail theft remain uninvestigated.
When police responses to retail theft are merely reactive, they lack focus on habitual offenders or organized theft groups, resulting in a missed opportunity for crime reduction. Thorough investigations are essential for identifying repeat offenders who drive retail losses. The extra investigative effort allows law enforcement to identify patterns and organized groups who merit additional charges and extra prosecutorial effort. By identifying the high-frequency recidivists, police and other organizations can develop targeted strategies to reduce repeat offending and prevent future crimes.
Many retail chains are well-equipped to strengthen investigations, especially with investments in technology such as facial recognition and advanced video surveillance. Target, for example, has its own forensic lab.[59] Improvements in video quality provide an opportunity for police to link individuals across incidents, identify patterns, and identify repeat offenders. However, without sufficient investigative effort, the opportunity to take advantage of this new technology is being lost.
Staffing limitations need not cripple retail theft investigations. Recruiting civilian crime or intelligence analysts is a cost-efficient way for police agencies to amplify analytical capabilities. Harnessing the expertise of loss-prevention teams from leading retail chains can also enhance investigative efforts. Collaborations with federal agencies interested in this crime, such as Homeland Security Investigations, can help local police take on organized retail crime.[60]
Prosecution
Chronic retail theft also demands a renewed focus on prosecution. While imposing harsh penalties may not be the most effective solution, ignoring the issue is equally untenable. In recent years, some prosecutors have adopted de facto decriminalization policies, only to face backlash and declining popularity due to rising crime. A critical flaw in these approaches has been the imposition of rigid, bright-line rules—such as specific dollar thresholds for prosecution—that have stripped line prosecutors of the flexibility needed during case intake. This has led not only to a neglect of petty crimes but has also unintentionally enabled the activities of chronic offenders.
District Attorneys John Creuzot in Dallas and Larry Krasner in Philadelphia have made this mistake. Creuzot initially vowed not to prosecute thefts under $750 in 2019—a stance he had to reverse by November 2022.[61] Similarly, Krasner initially adopted a policy of treating retail theft cases under $500 as summary offenses, but the policy is now being revised to eliminate the focus on dollar amounts.[62] These reversals highlight the shortcomings of inflexible policies that fail to effectively address serial shoplifters.
Manhattan DA Alvin Bragg did not set a bright-line dollar amount, but his “Day One Memo” highlighted the establishment of a task force aimed at collaborating with various community stakeholders to develop solutions to retail theft.[63] While the intention behind such initiatives is commendable, conspicuously absent from the memo was any mention of prosecuting serial shoplifters. Bragg, too, has had to walk back his initial approach as a result of public pressure over retail theft.[64]
While diversion programs and nonprosecution policies are sometimes appropriate for crimes like shoplifting, they are not sufficient to deal with repeat offenders. A more balanced approach that maintains the flexibility to prosecute serial offenders, while also providing these alternative solutions and off-ramps, is essential for addressing the complex problem of retail theft.
Sometimes, changes in law or policy that do not directly address treatment of shoplifting offenses inadvertently affect prosecutions of chronic offenders. For instance, the Manhattan District Attorney’s Office Data Dashboard shows that since 2020, prosecutions against recent and persistent petit larceny offenders—those with at least three misdemeanor convictions, including at least one within the last two years—have weakened. In 2023, 57% of cases against these offenders resulted in a conviction, with the rest being dismissed or merged with other cases.[65] This represents a significant decrease from 2018, when 94% of cases against these offenders resulted in convictions.
Much of that decrease came from merging multiple cases together, which happened in 23% of cases against these offenders in 2023, up from just 1% in 2018. This practice aims to streamline court dockets, because prosecuting each incident separately would demand significantly more effort—especially given recent changes in discovery requirements.[66] But the practice also lightens a repeat offender’s legal record for consideration in future prosecutions. Since the trend of consolidating prosecution cases began in 2020, it is most likely a response to the growing complexity of discovery laws rather than the actions of any single district attorney.
Whatever its causes, it is indisputable that these persistent shoplifters in Manhattan have faced reduced consequences for their actions. There has been a notable decline in the number of this group receiving any jail time for their offenses. In particular, there has been a significant reduction in the numbers of short-term sentences imposed: in 2018, 65% received sentences of less than a month (595 offenders), compared to 42% (50 offenders) in 2023, an increase from 22% (20 offenders) in 2022.[67] Meanwhile, the proportion of cases resulting in nine to 12-month sentences increased from 6% (57 cases) in 2018 to 25% (25 cases) in 2023. This shift shows that the Manhattan DA’s office is securing far fewer short-term sentences, marking a drastic shift in prosecutorial outcomes. With the diminished certainty of sanctions, it shouldn’t be surprising that offending rates have increased.[68]
Prosecutors should focus their resources on the small number of repeat offenders. Governor Kathy Hochul has embraced this approach in her recent initiative to address retail theft, drawing inspiration from the Gun Violence Strategies Partnership.[69] This NYPD-led initiative involves daily meetings among law enforcement agencies and prosecutors at multiple levels that focus on detaining the most dangerous gun violence offenders in NYC, all of whom are serial shooters. A similar offender-based strategy for retail theft would be just as productive, although the focus should not be just detaining offenders—given the lesser severity of the crime—but on managing the worst offenders with all available levers.
In the wake of legislative amendments to the bail reform laws in 2020 and 2022, New York State prosecutors can now request bail in some shoplifting cases, as they could in 2019 prior to the NYS bail reforms. If the offense causes harm to a person or property and the defendant has a pending case meeting the same criteria, prosecutors can invoke the “harm to harm” provision and request bail. These amendments give an opportunity, if applied, to lessen the risks posed by repeat offenders.
In New York, prosecutors also have the option to seek charge enhancements under certain conditions. If shoplifters reenter a property after being served with a trespass notice or order of protection, they may face elevated charges. Spearheaded by Queens district attorney Melinda Katz, the Merchants Business Improvement Program aims to reduce repeated shoplifting by enhancing collaboration between businesses and law enforcement, asking businesses to issue trespass notices or protection orders against habitual offenders.[70] Reportedly showing promise in Jamaica, Flushing, and Astoria, this program is poised for broader deployment throughout Queens, though we still await concrete data on its impact.
Legislation that aggregates theft amounts resulting in a more serious charge also helps deal with repeat offenders. Since the beginning of 2022, five states have introduced legislation that allows for the aggregation of multiple theft incidents.[71] In California, for example, the Retail Theft Reduction Act, cosponsored by a group of lawmakers including Rep. Rick Zbur, has an aggregation clause that allows prosecutors to charge repeat offenders with grand theft if the total amount stolen crosses a certain threshold even though individual incidents don’t qualify for the felony charge.[72] The Combating Organized Retail Crime Act of 2023 similarly includes provisions for federal charges in cases of organized retail theft in which the cumulative value of stolen items reaches or exceeds $5,000 within a 12-month timeframe. These legislative changes represent a deliberate effort to address these ongoing retail theft issues.
Prosecutors and policymakers increasingly recognize the need for developing and using alternative pathways and evidence-based diversion programs for shoplifters given the significant role that substance abuse and mental health issues play in shoplifting. Many jurisdictions, including New York City, have publicly committed to diversion efforts, acknowledging their potential effectiveness. The city’s retail theft strategy, for instance, introduces two innovative diversion programs: “Second Chance” and Re-Engaging Store Theft Offenders and Retail Establishments (RESTORE). These initiatives seek to offer nonviolent offenders an alternative to legal prosecution or incarceration, linking them to services that tackle the underlying reasons for their criminal actions. Research and reviews of diversion programs broadly show they can lower repeat offenses, though results differ among initiatives led by police, those after conviction, and those following sentencing.[73] Nonetheless, ongoing evaluation and fine-tuning are critical to ensure the effectiveness of these programs.
The city also has specialized drug courts, but the decline in participation in these courts raises questions about their current utility.[74] Unfortunately, these drug courts were last evaluated in 2013, and performance data has been missing since then. The program stopped issuing its annual reports in 2016.[75] Without public oversight, it’s not clear whether these courts are performing as promised.
These programs require oversight and active management because they are difficult to implement. In Seattle, most participants sent to an outpatient drug treatment program immediately absconded. In New York City, drug court use has dropped by over 80% since changes to the state’s bail and discovery laws in 2019.[76] Without any intervention, these programs will continue to have difficulties and fall short of their promise.
Thus, policymakers need to proceed with caution. Former San Francisco district attorney Chesa Boudin enthusiastically endorsed the city’s diversion programs prior to acknowledging the complete absence of performance data from the nonprofit program operators.[77] Like all aspects of criminal justice, diversion programs require transparency, oversight, and the willingness to adapt based on evidence to ensure they contribute to public safety and offender rehabilitation.
Fencing
Shoplifting provides a revenue stream for repeat offenders, who offload their stolen items to fences, who then flip the goods for a hefty profit. This act of reselling not only constitutes an additional crime but also presents an often-overlooked opportunity for crime control. Jack Maple, the architect behind NYPD’s CompStat, pointed this out by suggesting that targeting fences—those who buy and sell stolen goods—offers law enforcement another opportunity to deal with theft.[78] Fences, who often maintain some semblance of legitimate business, are more inclined to stop their criminal activities when they perceive that there are increased risks from law enforcement attention.
Fencing is not a new racket. It predates modern retail and has evolved alongside retail. In the mid-1800s, Marm Mandelbaum was a fence known to New York City police who ran organized theft crews throughout the city at the dawn of modern retail; she handled millions of dollars in stolen property.[79] A 1978 New York State report revealed enduring, sophisticated fencing enterprises citywide, noting historically insufficient law enforcement responses to the problem.[80] Today, the conversation around fencing has shifted focus to the digital realm, with online marketplaces becoming the key areas of concern.
Authorities can also combat theft indirectly by disrupting the market for stolen goods. Stolen goods markets range from street sales to sophisticated online operations. Seattle and Washington, DC, have prolific street markets.[81] New York City has identified warehouses and bodegas as popular fencing locations. We can understand the extent of a city’s stolen goods market only through data collection and investigation.
Enforcement strategies should reflect the specific market. Where goods are sold on the street, authorities should enforce vending regulations against those illegal vendors who peddle stolen merchandise. Unfortunately, that avenue in DC was closed off as an unintended consequence of last year’s Street Vendor Advancement Act.[82]
In New York, where otherwise legitimate businesses are fencing stolen goods, combining civil and criminal approaches would be effective. The city’s Nuisance Abatement Program is a legal initiative that enables the city to take civil action against properties involved in illegal activities, including fencing. Effective nuisance abatement would require multiple reverse-sting operations against suspected fencing locations and then publicizing these efforts loudly. Since many fences have connections to legitimate markets, the prospect of public exposure and legal repercussions may encourage them to stop (or reduce) their involvement in the stolen goods markets. NYPD public data shows that out of over 250 locations identified for nuisance abatement in 2023, only three were related to fencing, indicating a wide-open lane for the city to combat retail theft.[83]
The rise of online marketplaces has introduced new challenges in combating fencing. High-profile rings, like the one allegedly run by Michelle Mack in California, highlight the scale of organized retail crime and the use of online platforms for selling millions of dollars’ worth of stolen goods.[84] Her enterprise allegedly stole $8 million worth of makeup and other goods and then resold them on Amazon Marketplace. Legislative initiatives like the 117th Congress’s Inform Act and Governor Kathy Hochul’s recent proposal seek to enhance transparency and accountability in online marketplaces and introduce criminal penalties for their misuse.
Much of today’s conversation about shoplifting centers on “organized retail crime” (ORC), a topic mired in ambiguity. The definition of ORC is not clear, and it can include minor crimes to sophisticated schemes orchestrated by international criminal networks and individuals trafficking in stolen merchandise. According to the National Retail Foundation, ORC involves the large-scale theft of retail merchandise intended for resale and financial gain, orchestrated by a criminal enterprise that steals in bulk from various stores.[85] Homeland Security Investigations (HSI) defines ORC more narrowly, as the collaboration of two or more individuals illegally acquiring valuable items from retail outlets through theft or fraud as part of an organized crime group.[86] The Washington Organized Retail Crime Association (WAORCA) introduces additional criteria, specifying that ORC activities must span multiple occurrences or jurisdictions and involve collaboration or dual roles (booster and fencer) with the goal of converting illegally obtained merchandise into financial gain.[87] Finally, some state legal definitions simply focus on the monetary value of the stolen goods, as the law leaves less room for ambiguity.
This lack of a consistent definition makes it difficult to identify specific solutions or strategies for combatting ORC. Organized crime has long contributed to retail theft and does so today. Absent a precise definition, it can’t be measured or its extent known. Only through dedicated efforts to improve data collection, investigate retail crimes thoroughly, and prosecute those responsible, can we understand the size of organized theft’s role.
Conclusion
The hype surrounding retail theft makes it difficult to craft rational policy responses to deal with the crime. The primary obstacle is the lack of consensus on facts. Police data is inadequate, and national shrinkage numbers, while informative, do not provide local insight. Despite these obstacles, policymakers must act and use whatever reliable information they can gather. Although responses should be tailored to local conditions, certain overarching themes have consistently proven to be important across various contexts. Enhancing data collection efforts, conducting more rigorous investigations of retail crimes, prosecuting these crimes judiciously, focusing on repeat offenders, and addressing the demand side by focusing on fences are all crucial steps. By making these concerted efforts, we can achieve significant progress in both curbing retail theft numbers and deepening our comprehension of organized retail crime.
About the Author
John Hall is a seasoned police executive with over 25 years in public safety. He retired from the NYPD in 2023 and currently works at the Metropolitan Transit Authority Police Department. In his prior roles, he developed crime-control policy and managed the police department’s analytics program. Hall holds a B.A. from Cornell University, a Master of Science from NYU, and a Master in Public Administration from the Harvard Kennedy School. He is also a National Institute of Justice Law Enforcement Advancing Data & Science (LEADS) scholar.
Endnotes
Photo by: Deb Cohn-Orbach/UCG/Universal Images Group via Getty Images
Are you interested in supporting the Manhattan Institute’s public-interest research and journalism? As a 501(c)(3) nonprofit, donations in support of MI and its scholars’ work are fully tax-deductible as provided by law (EIN #13-2912529).