Assessing the Race: Polling the 2025 NYC Mayoral Election

Photo by DAVID DEE DELGADO/Getty Images
Between January 24th and January 30th, 2025, the Manhattan Institute conducted a survey of 618 registered voters in New York City, drawn from a national voter file and weighted to reflect the likely 2025 mayoral electorate on gender, age, college education, race, and vote history. This sample included an oversample of Democrats to provide granular insights into primary dynamics. Responses were collected via SMS-to-web and online outreach, with a margin of error of ±3.94%. Throughout this memo we use self-reported party registration, not party identification, to refer to voters.
Full Results Available: Toplines, Crosstabs
Direction of City and Top Issue
Most New York City voters (66%) believe that the city is heading in the wrong direction. A similar share, 68%, also believe that the country is on the wrong track. The partisan divide is stark: 48% of Republicans think the country is on the right track, while only 11% feel the same about New York City. Among Democrats, 74% believe the country is on the wrong track, with 66% sharing this view about the city. This widespread discontent reflects a broader frustration with governance at both the local and national levels.
When asked to identify the most pressing issues facing New York City (voters could select up to two), crime and public safety emerged as the dominant concern for 49% of respondents. This was followed by housing costs (29%), jobs and the economy (28%), and migrants and immigration (22%). Crime and immigration concerns are particularly pronounced among Republicans, with 65% and 61% citing these issues, respectively. However, crime remains the top concern even among Democrats (47%), underscoring its cross-partisan salience.
Favorability
President Donald Trump remains deeply unpopular in New York City, with a net unfavorable rating of –46%. Nonetheless, he maintains a notable base of support, with 27% viewing him positively. Governor Kathy Hochul fares better, enjoying a narrow net positive favorability (49% favorable to 44% unfavorable), buoyed by strong support among Democrats (+21) but significant opposition from Republicans (–56) (Figure 1).
Figure 1: Favorability of Political Figures Tested
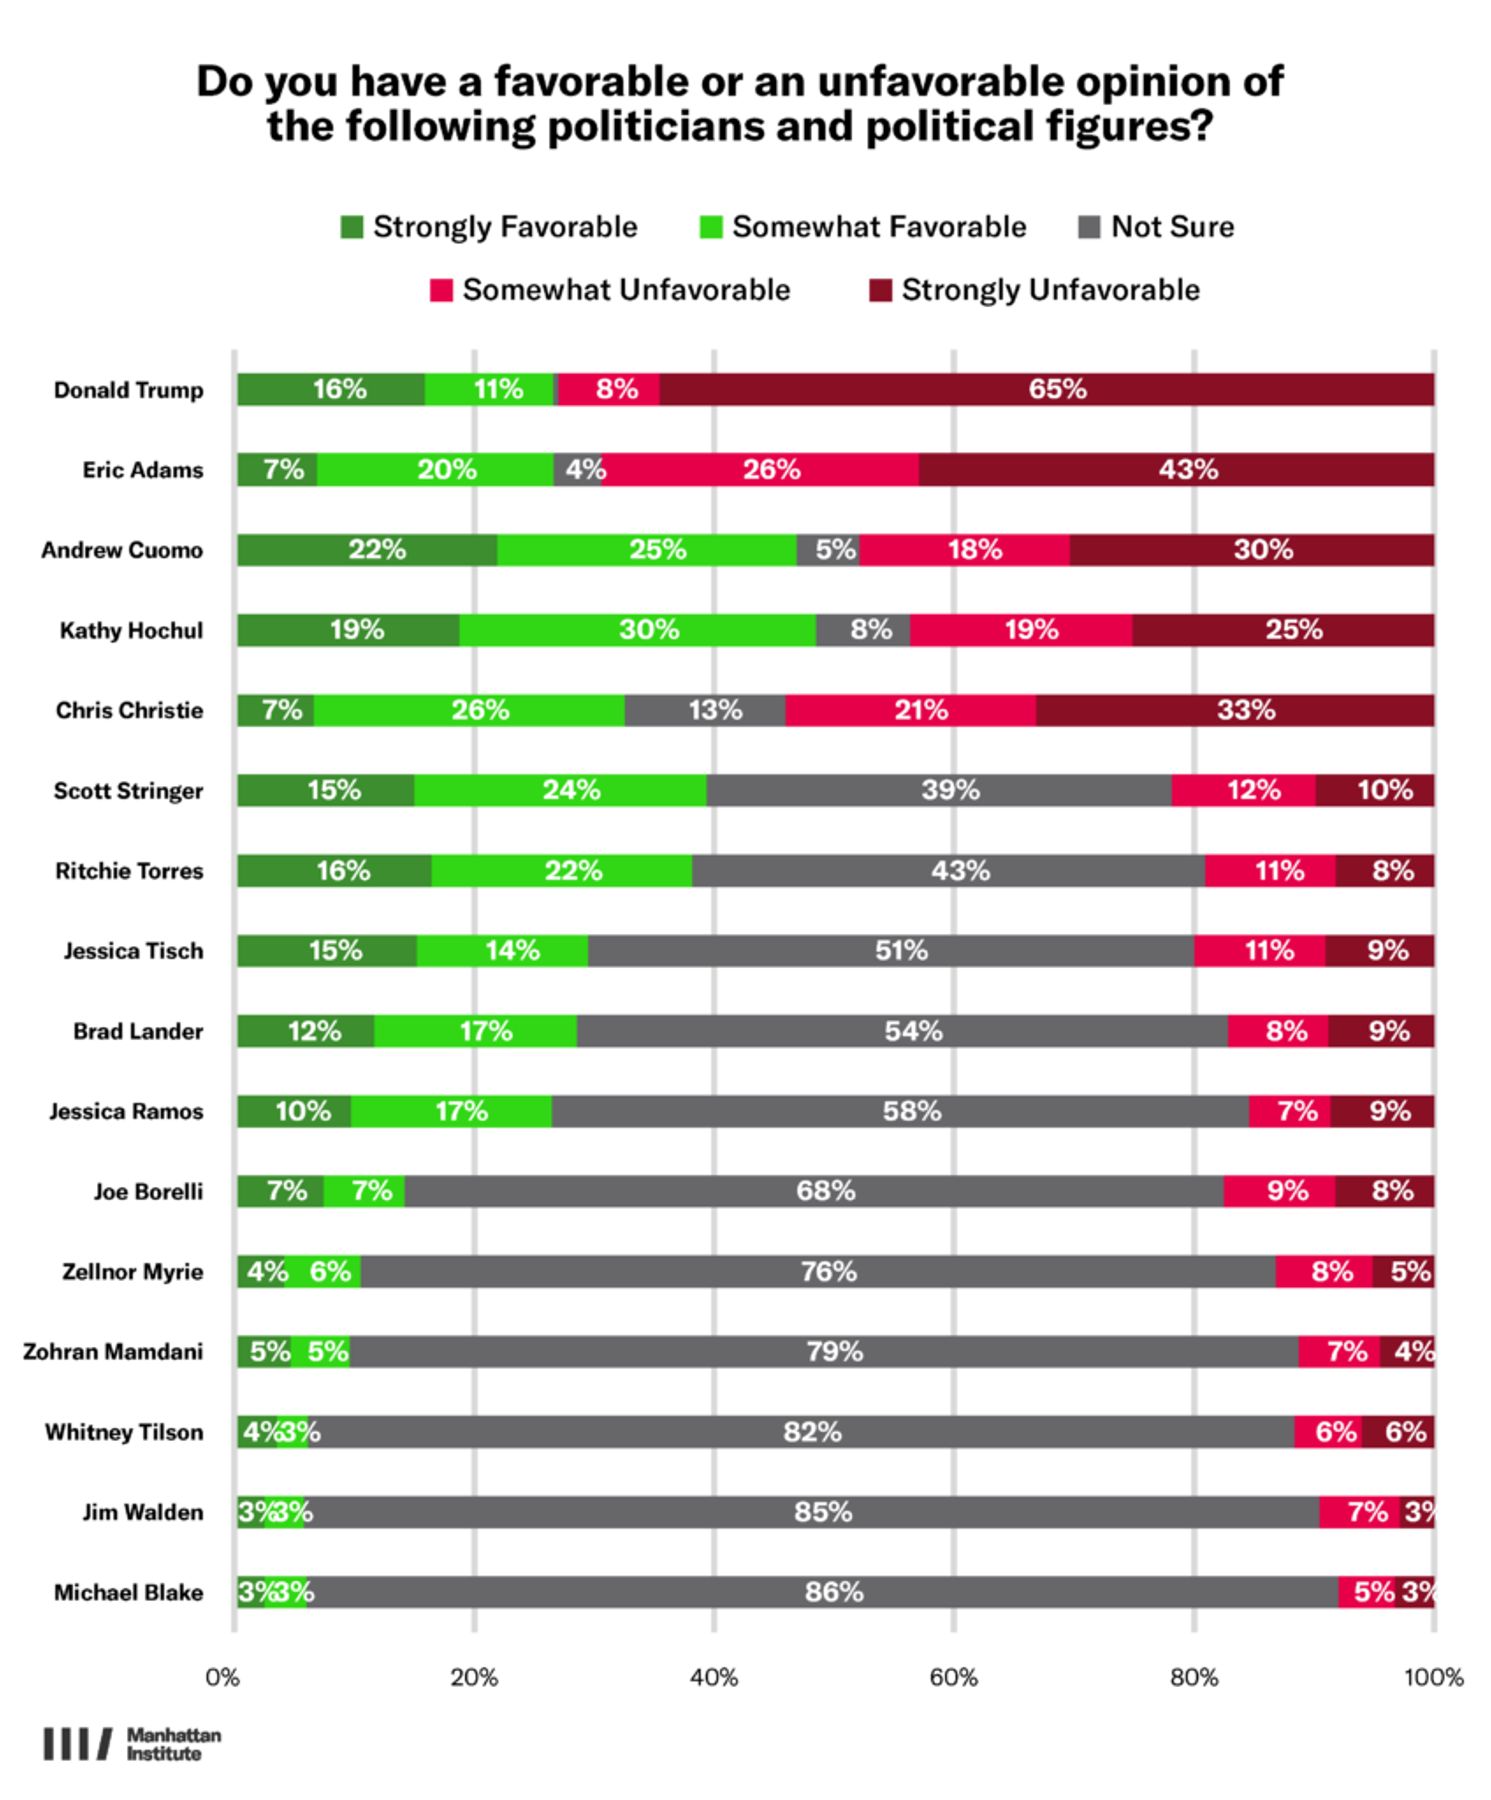
Despite his near-universal name recognition, Mayor Eric Adams struggles with public perception, with a net favorability of –46%. His standing is somewhat stronger among Black voters, where his net favorability improves to –24%. Interestingly, Adams’s job approval rating (–29%) is higher than his favorability, suggesting that some voters differentiate between his personal image and his performance as mayor. Among Black voters, the mayor’s net job approval rating is –19, while white voters disapprove by a wider margin of –36. Adams’s approval varies significantly across boroughs: he holds net positive job approval in Queens (+12) but faces negative ratings in Staten Island (–32), Manhattan (–40), the Bronx (–44), and Brooklyn (–53). These borough-level findings reflect notable geographic disparities, though small sample sizes in each borough warrant cautious interpretation.
Former Governor Andrew Cuomo has a net favorability of –3% (46% favorable, 49% unfavorable) among likely NYC voters. Despite his polarizing reputation, his strong name recognition distinguishes him from many other political figures in the city.
Brad Lander and Jessica Ramos face low name recognition, with 55% of voters unsure about who Lander is and 59% unsure about Ramos. However, both maintain net positive favorability: Lander at +13 (29% favorable, 16% unfavorable) and Ramos also at +13 (27% favorable, 14% unfavorable). Scott Stringer enjoys a solid net positive favorability of +19 (40% favorable, 21% unfavorable), though 39% of voters report not knowing who he is, highlighting that even well-established figures may face recognition gaps within certain voter segments.
Chris Christie is viewed negatively (–20 net favorability), though he retains a significant base with 33% holding a favorable opinion. Joe Borelli has neutral ratings (15% favorable, 16% unfavorable), driven by low recognition among Democrats but positive views from Republicans. Representative Ritchie Torres stands out with strong bipartisan appeal, boasting a +21 net favorability (39% favorable, 18% unfavorable). His support is uniquely balanced, with a net favorability of +26 among Democrats and +28 among Republicans. Torres’s cross-partisan popularity makes him as a formidable candidate for future citywide (or statewide) office. His ability to maintain broad appeal across party lines is rare in New York City’s polarized environment.
New York Police Commissioner Jessica Tisch also enjoys bipartisan favorability (+13 among Democrats, +20 among Republicans).
Several figures, including Whitney Tilson (83% unsure), Zellnor Myrie (77%), Zohran Mamdani (80%), Jim Walden (86%), and Michael Blake (87%), lack sufficient name recognition to gauge public opinion meaningfully.
The Mayoral Race
Andrew Cuomo is a strong candidate in the upcoming mayoral election landscape, leading the Democratic primary with 30% of first-choice votes. Cuomo also performs well in general election matchups, often securing majorities against candidates of all ideological stripes.
Rank Choice Voting Democratic Primary Simulation
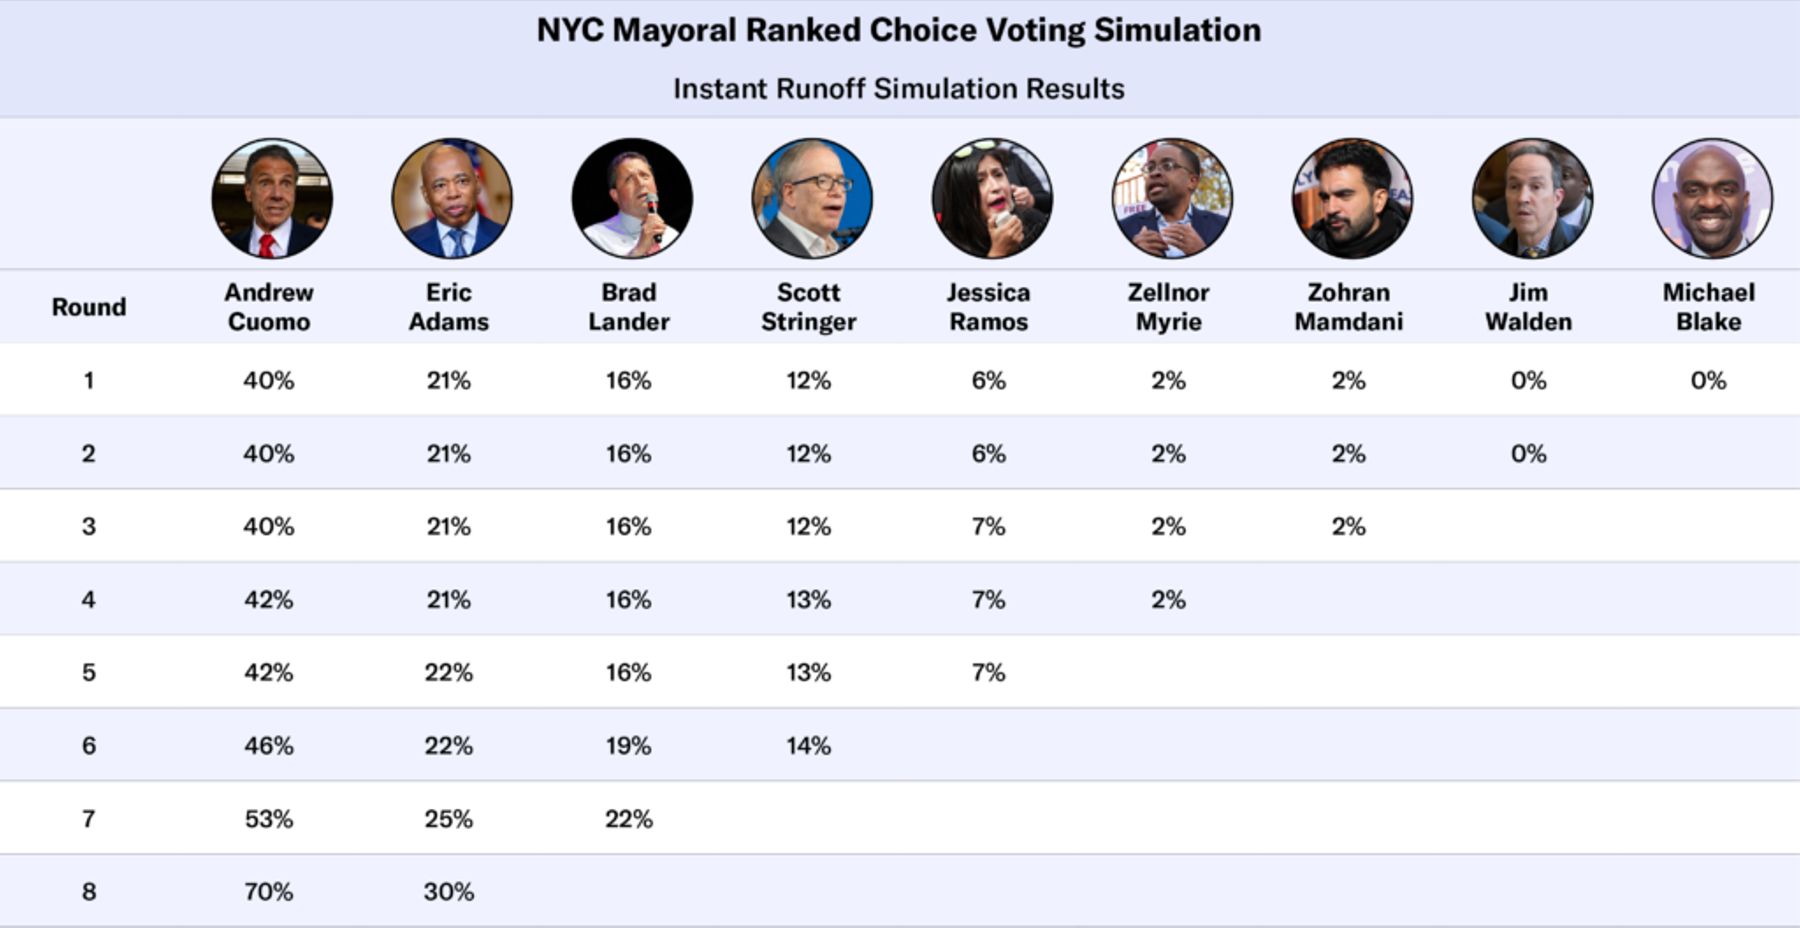
The ranked choice voting (RCV) simulation reveals intriguing dynamics (Figure 2). Voters could select up to five candidates, mirroring the actual voting process. For this simulation, we excluded respondents who said they were unsure of who they would support in a given round. Jim Walden and Michael Blake were the first eliminated, each securing less than 1% of the vote. Subsequent rounds saw the elimination of Zohran Mamdani, Zellnor Myrie, and Jessica Ramos. Ramos’s supporters disproportionately shifted to Brad Lander, enabling him to surpass Scott Stringer. In the final rounds, Adams narrowly edged out Lander (25% to 22%), but Cuomo ultimately secured a majority (53%), underscoring his broad appeal across different voter blocs. Cuomo wins this simulation comfortably, highlighting his dominant position in the current electoral landscape. However, as the campaign progresses, there is ample time for these dynamics to shift, especially since Cuomo has yet to officially enter the race.
Figure 2: RCV Simulation Round-by-Round Breakdown
General Election Matchups
We conducted several hypothetical general election matchups (Figure 3), presenting candidates without partisan labels to account for potential shifts in party affiliations. The eventual partisan labels could affect the results, as voter preferences often shift based on party identification.
Figure 3: General Election Matchups
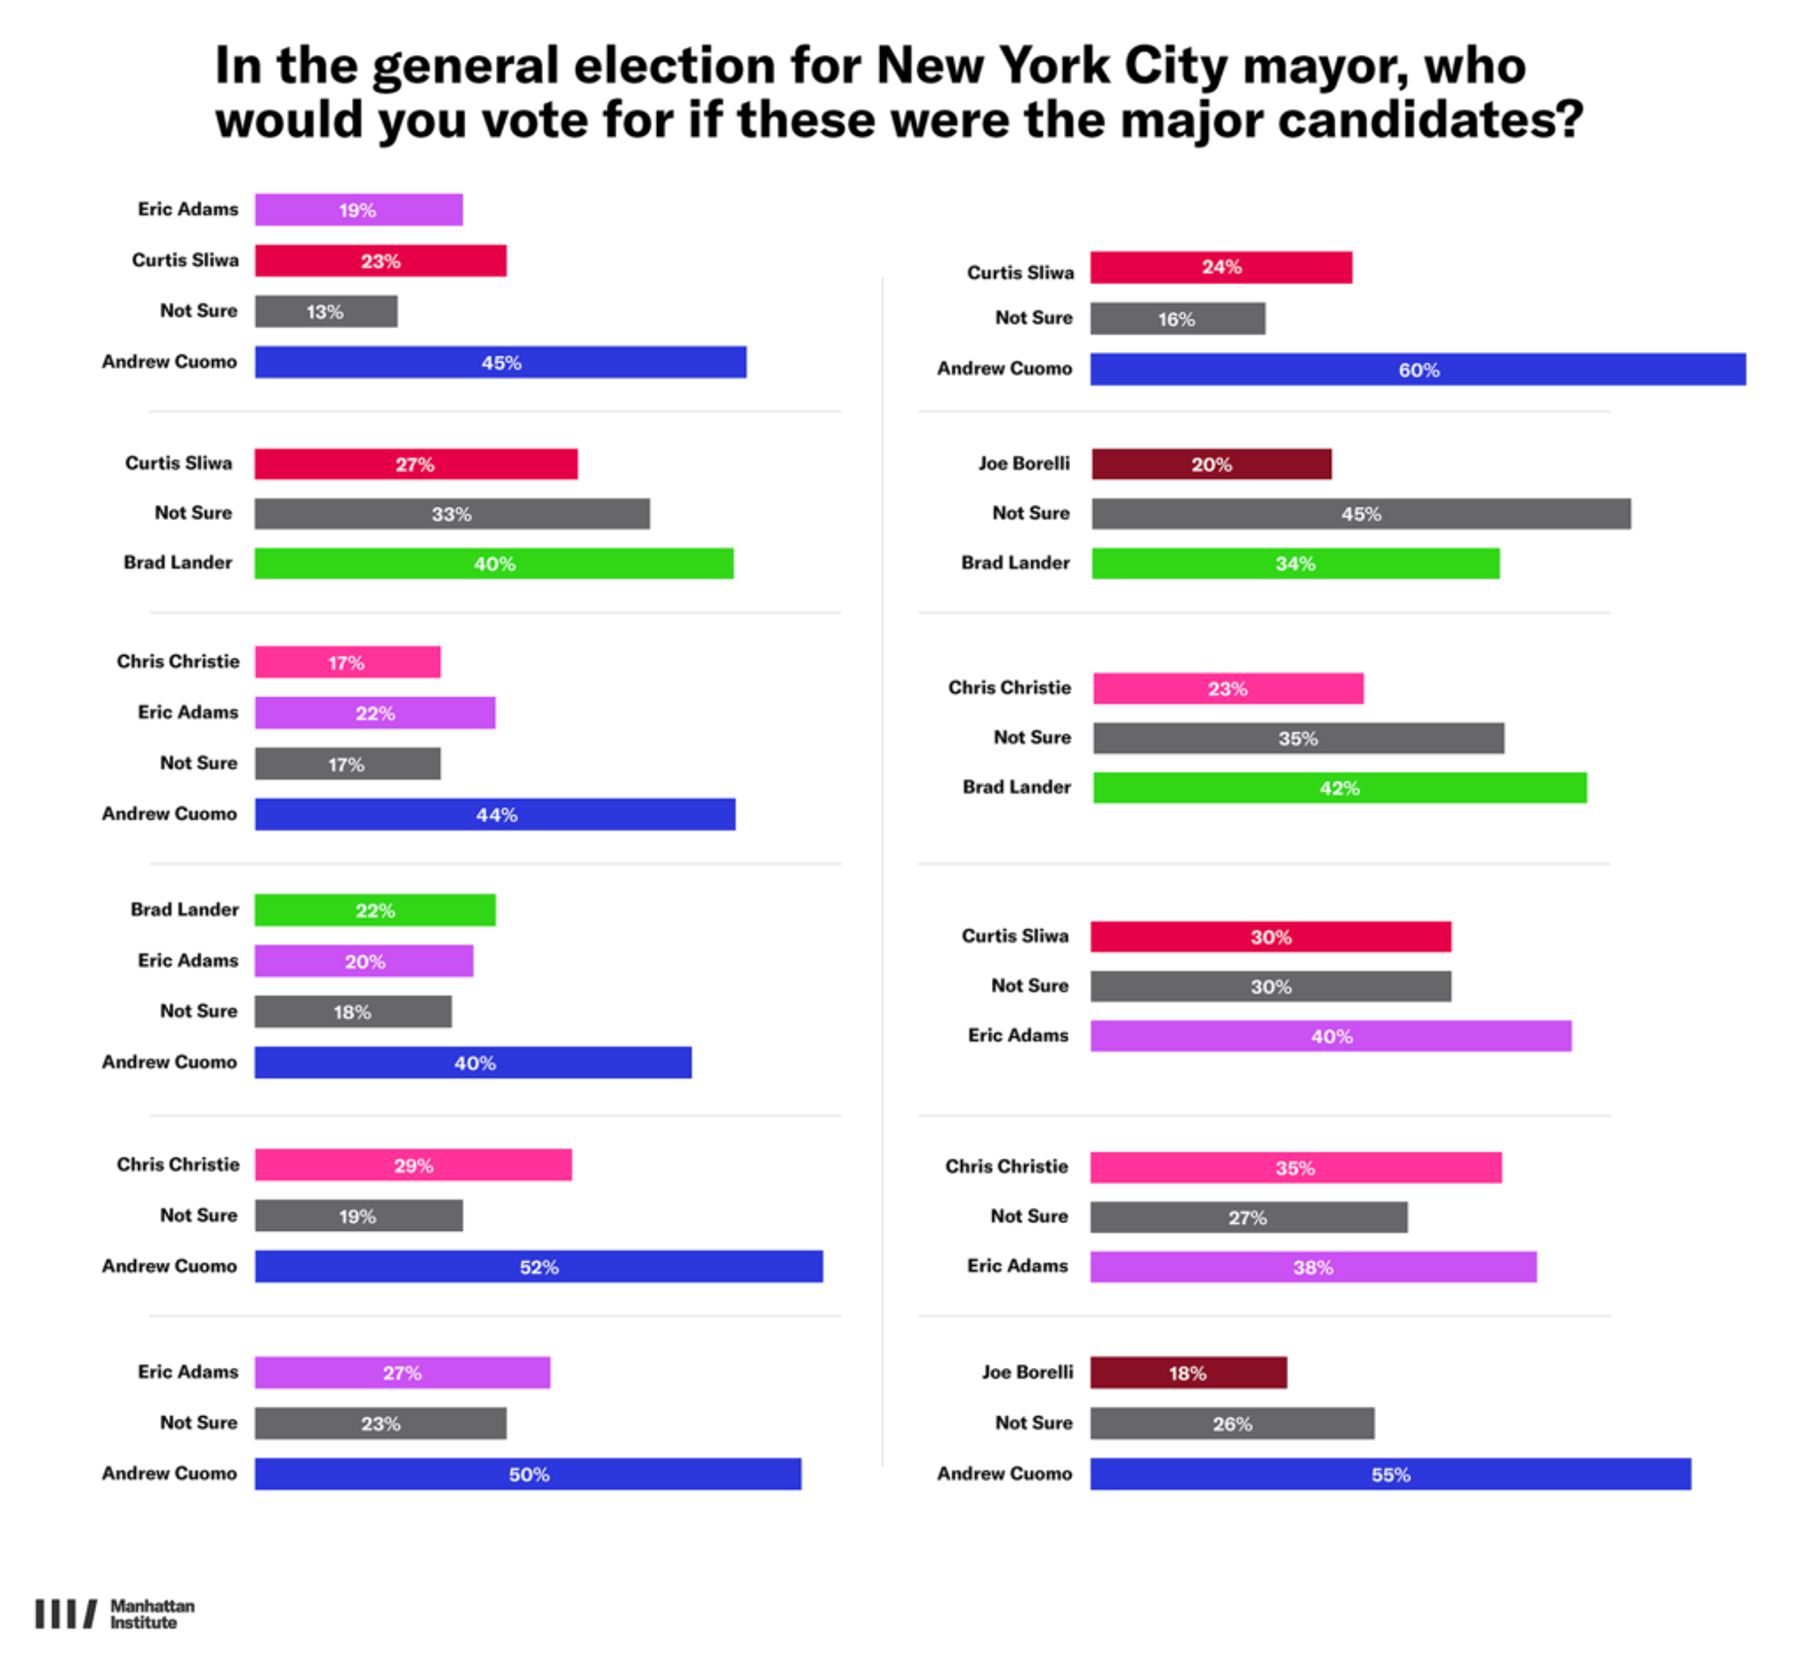
Eric Adams Matchups: Adams defeats Curtis Sliwa (40% to 30%) but fails to secure a majority, with 30% of voters undecided. Sliwa dominates among Republicans (70% to 12%), while Adams’s lead among Democrats is narrower (47% to 22%). Against Chris Christie, Adams narrowly prevails (38% to 35%), with less distinct partisan divides: Adams wins Democrats (40% to 33%), while Christie secures a smaller Republican margin (52% to 24%).
Andrew Cuomo Matchups: Cuomo handily defeats Sliwa (59% to 25%), winning 68% of Democrats. Against Christie, Cuomo leads 52% to 30%, with strong Democratic support (57% to 30%). Cuomo also leads Joe Borelli 55% to 19%, with 26% of voters undecided. Notably, Cuomo consistently garners over 50% in head-to-head contests, a remarkable achievement in a fragmented electoral environment.
In a direct head-to-head matchup between Adams and Cuomo, Cuomo holds a commanding lead, securing 50% of the vote compared to Adams’s 28%, with 22% of voters undecided. Cuomo dominates among Democrats, winning 58% to Adams’s 30%, comfortably ahead in all boroughs except Brooklyn, where he trails Adams by just 1 point.
Brad Lander Matchups: Lander secures pluralities against Sliwa (40% to 27%) and Christie (42% to 23%) but faces high undecided rates (33% and 35%, respectively), reflecting lower name recognition. In a matchup with Joe Borelli, Lander leads 34% to 20%, with 45% undecided.
Three-Way Matchups: Cuomo maintains his dominance in multi-candidate scenarios, securing 44% against Adams and Sliwa (20% and 23%, respectively). In a contest against Adams and Christie, Cuomo again leads with 44%, with Christie struggling to consolidate Republican support. Against Adams and Lander, Cuomo leads with 39%, though Lander captures 23%, indicating potential for progressive gains.
Attitudes on Parties and Election Format
Party affiliation dynamics reveal nuanced voter attitudes. Only 64% of registered Democrats cite the party’s values as the primary reason for their affiliation, while 23% register strategically to influence outcomes. Voters prefer open primaries (62%) over closed ones (26%). When given a choice between closed (19%), open (30%), or nonpartisan (37%) primaries, voters favor nonpartisan or open systems.
A striking 44% of voters believe that NYC elections are effectively decided in Democratic primaries, reducing the perceived importance of general elections; this view is especially prevalent among Republicans (52%). Voters also support increased electoral flexibility, including reducing the registration-change deadline to 29 days before elections (+36 support), shifting local elections to even-numbered years (+37), and including additional information—such as candidate endorsements from newspapers, civic groups, and political leaders—on ballots (+27).
Support for ranked choice voting remains positive but modest, with 52% in favor. Partisan divides persist: only 42% of Republicans support RCV, compared with stronger Democratic backing (Figure 4).
Figure 4: RCV Support
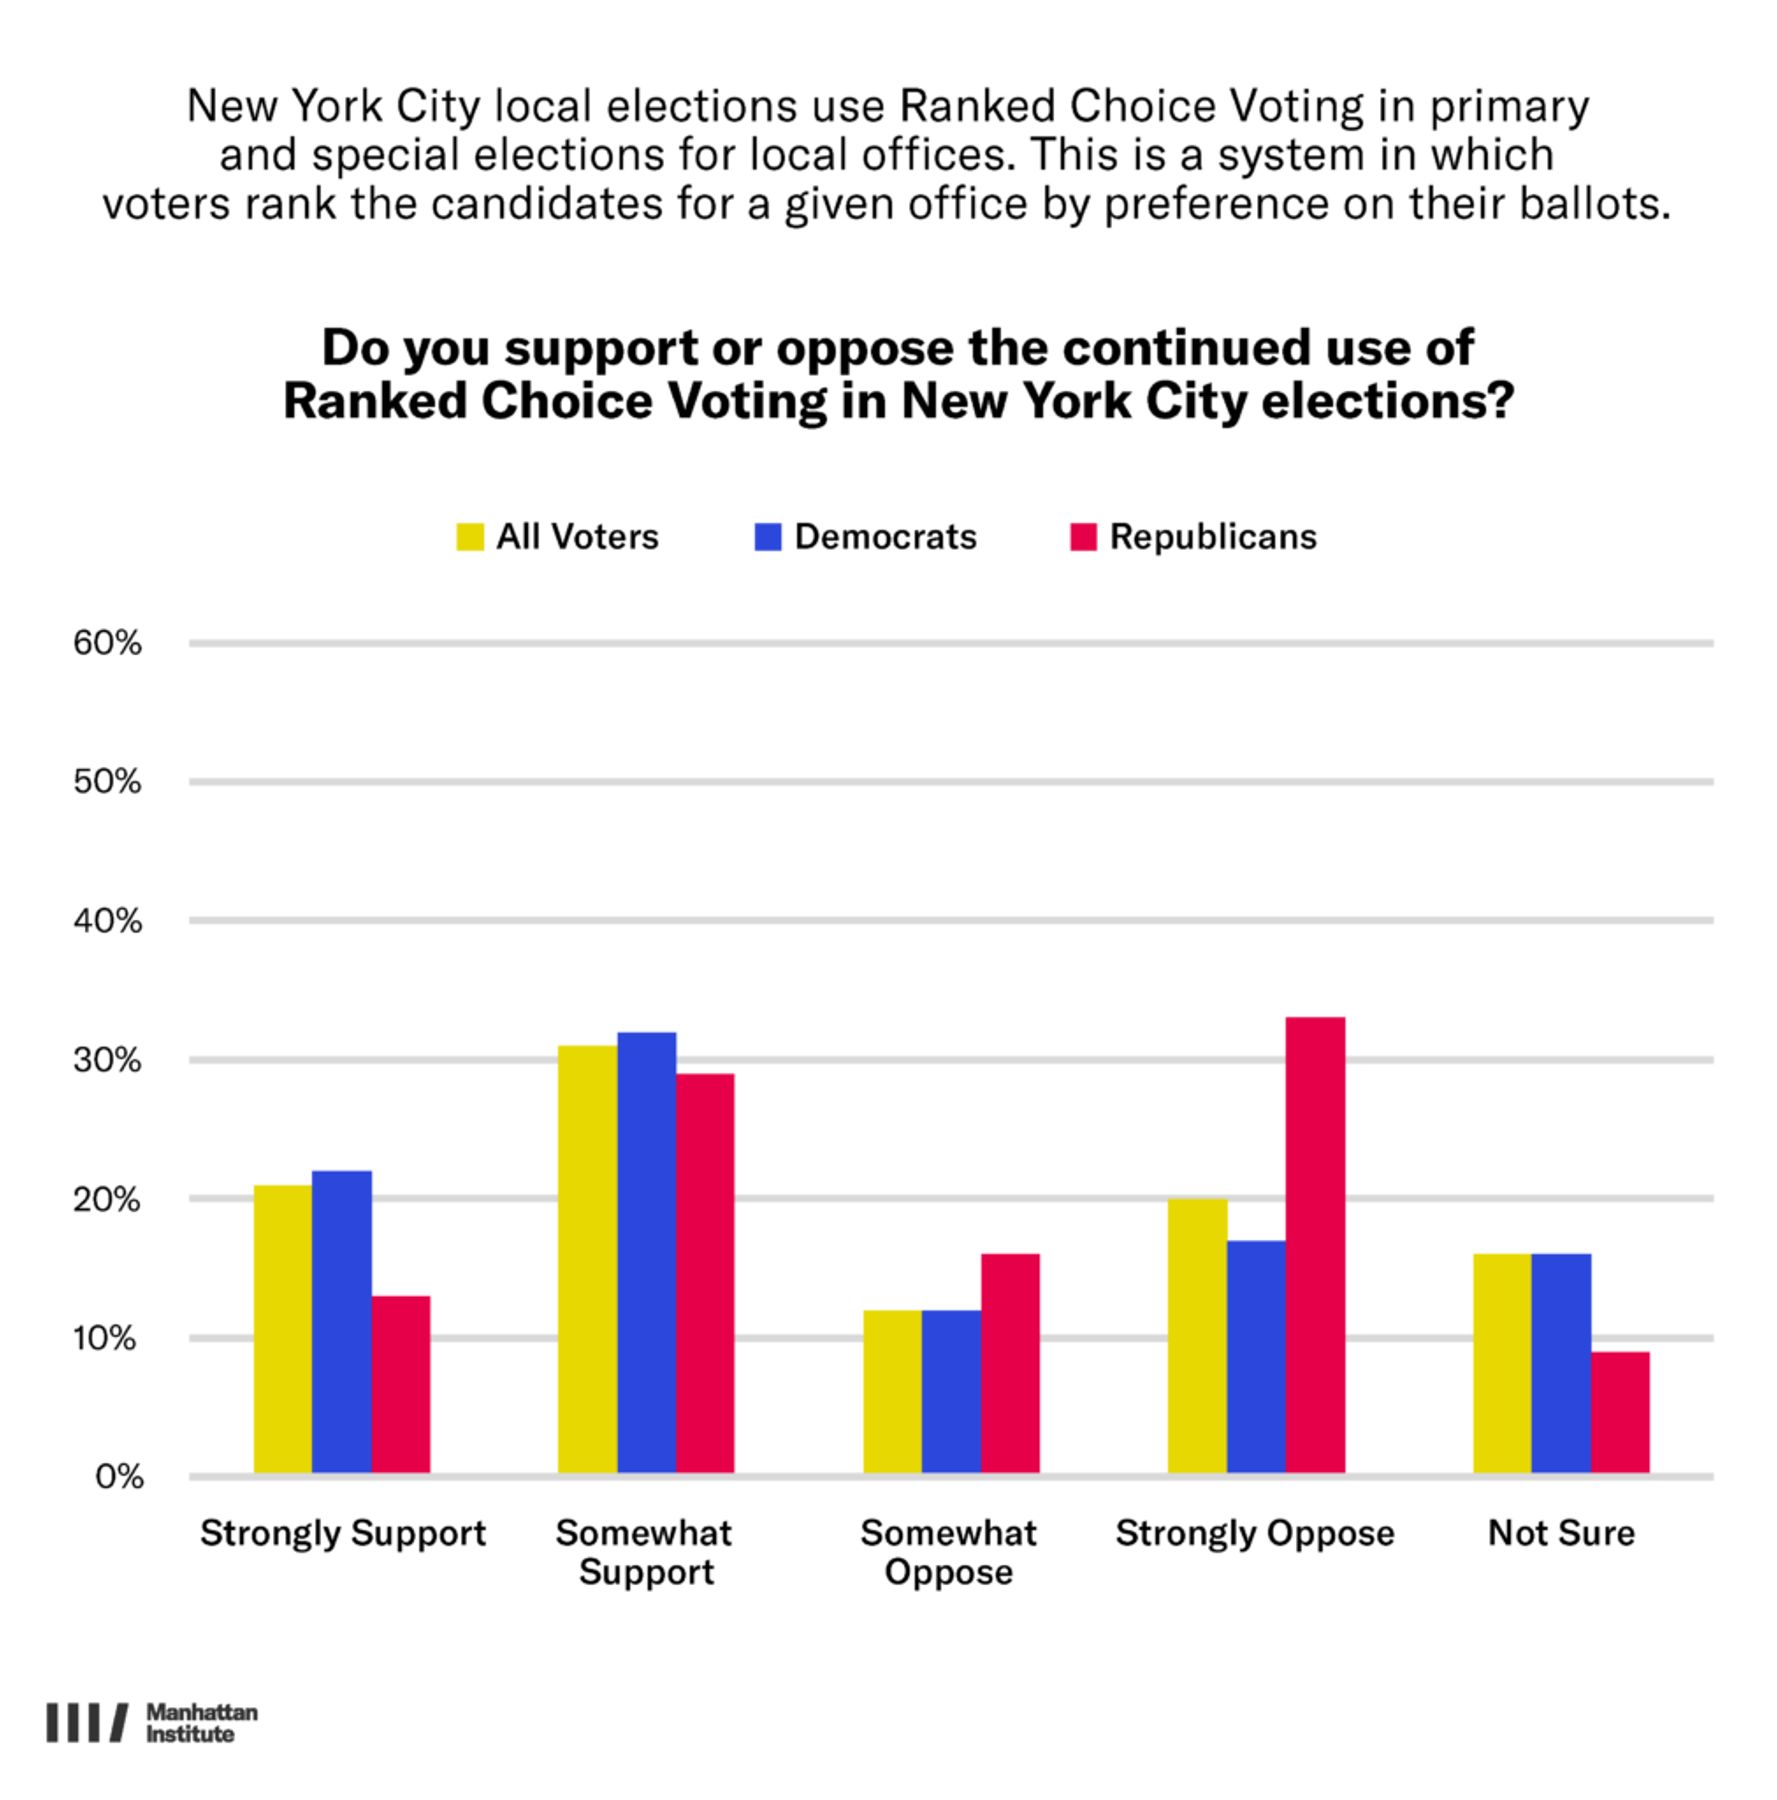
Photo by DAVID DEE DELGADO/Getty Images
Are you interested in supporting the Manhattan Institute’s public-interest research and journalism? As a 501(c)(3) nonprofit, donations in support of MI and its scholars’ work are fully tax-deductible as provided by law (EIN #13-2912529).