America’s Surprisingly Effective Welfare State Smaller Government, Better Targeted Redistribution

Photo: Douglas Sacha / Moment via Getty Images
Executive Summary
The U.S. welfare state is often disparaged for failing to distribute benefits to all citizens. But its greater targeting of expenditures makes it more effective than many European welfare systems. This is because scarce public funds are not mostly spent crowding out the use of private resources by those who are capable of providing for themselves.
In countries where funding for child care, housing, and health-care services is less reliant on a single public payer, the quality received by all is improved. Where publicly funded benefits are more reserved for the poor, taxes can be more limited to the rich.
Spending on old-age pensions has grown automatically as life expectancy has increased, and it now dominates most welfare states. European countries and the United States provide similar assistance to the elderly poor and extract similar income-tax revenues from the rich. But those nations that attempt to provide full retirement incomes for affluent seniors impose much higher consumption and payroll taxes on low-income workers.
As a result, welfare states redistribute mostly from workers to nonworkers, regardless of social class. In the largest welfare states, the poorest full-time workers are net taxpayers.
Introduction
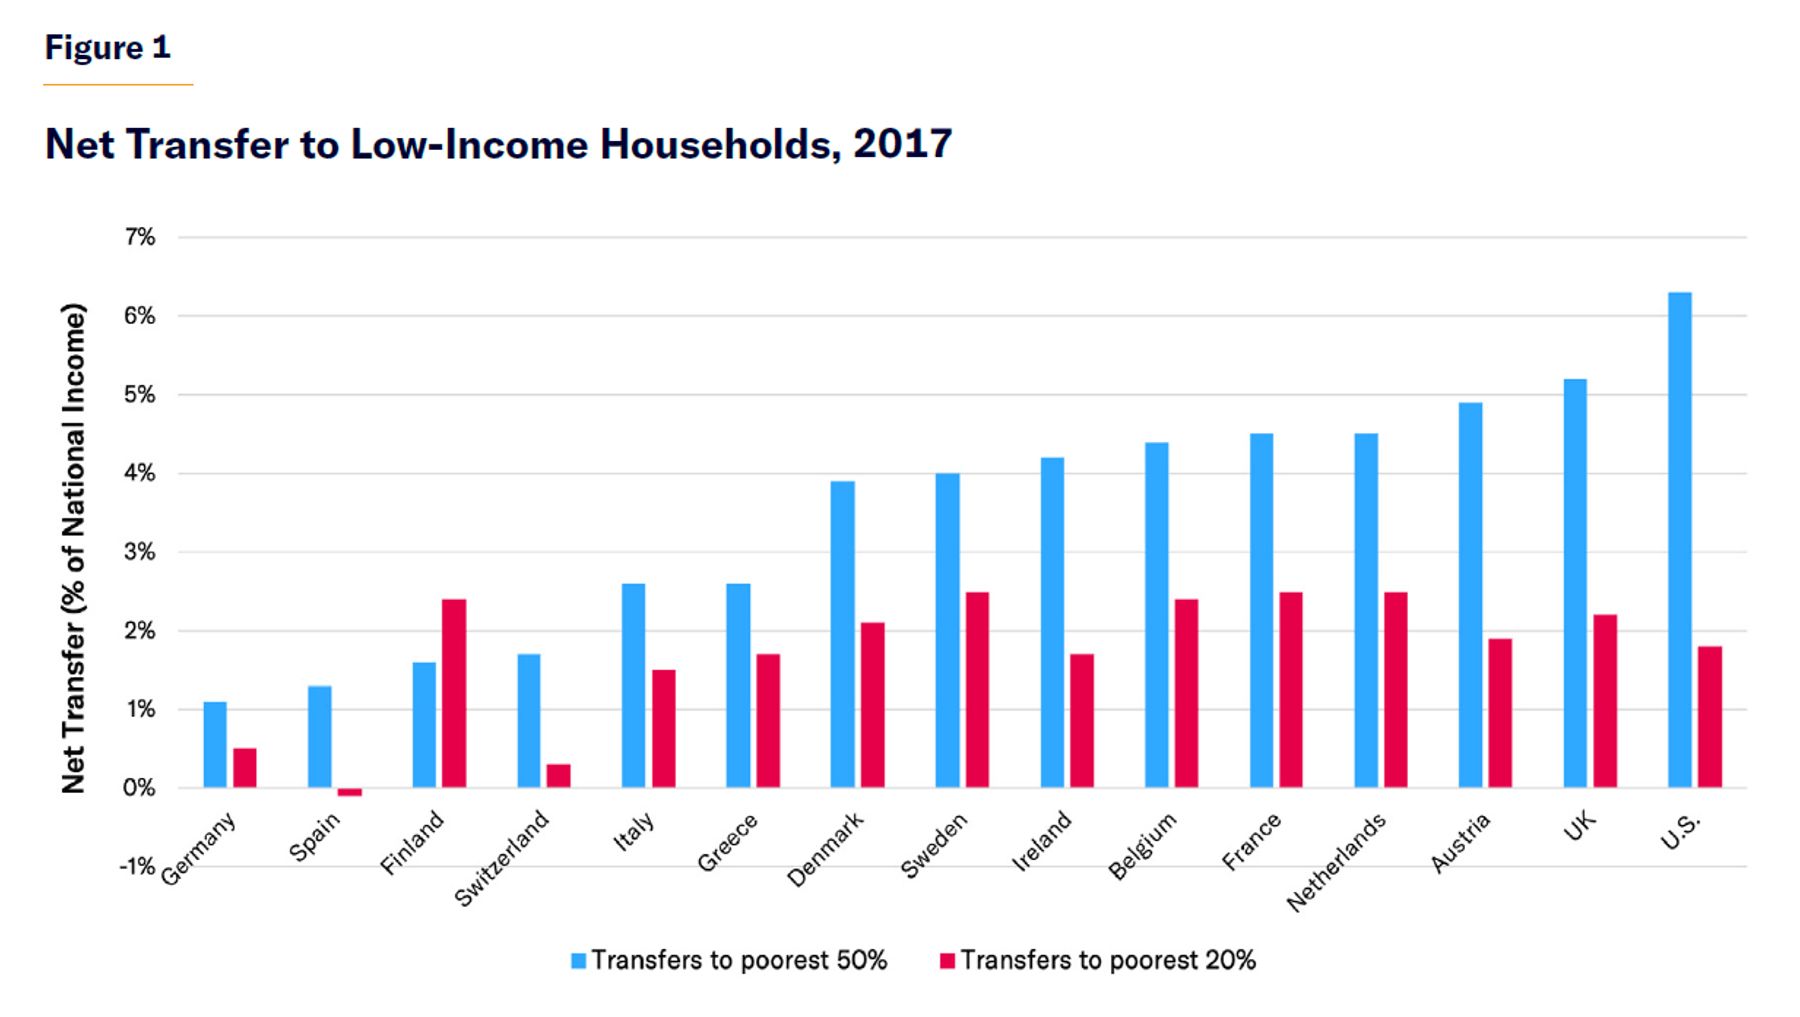
Economists at the World Inequality Lab of the Paris School of Economics recently calculated that, compared with European nations, the U.S.“stands out as the country that redistributes the greatest fraction of national income to the bottom 50 percent” (Figure 1).[1] This is not the American welfare state’s traditional reputation. How can it be so?
Europe’s welfare states are dominated by costly publicly funded “social insurance” programs, which attempt to fully support middle-class lifestyles through periods of unemployment, ill health, disability, or retirement. By contrast, American public entitlement programs are more focused on providing a safety net against poverty, and they more strictly limit eligibility for cash and health-care benefits to those who are unable to work. This further reduces the expense of financing benefits for households that could privately provide for themselves.
To pay for their more expansive entitlements, European nations must impose much higher payroll and consumption taxes on workers with modest incomes. Once the distribution of taxes is taken into account, those with below-median incomes in the U.S. benefit more from the net redistribution.[2] Although U.S. entitlements could still be better targeted, its programs are more effective than Europe’s at improving standards of living because they are better designed not to merely crowd out private resources.
The Dominance of Public Pensions
Pensions dominate welfare states and do much to determine their net redistributive effects.
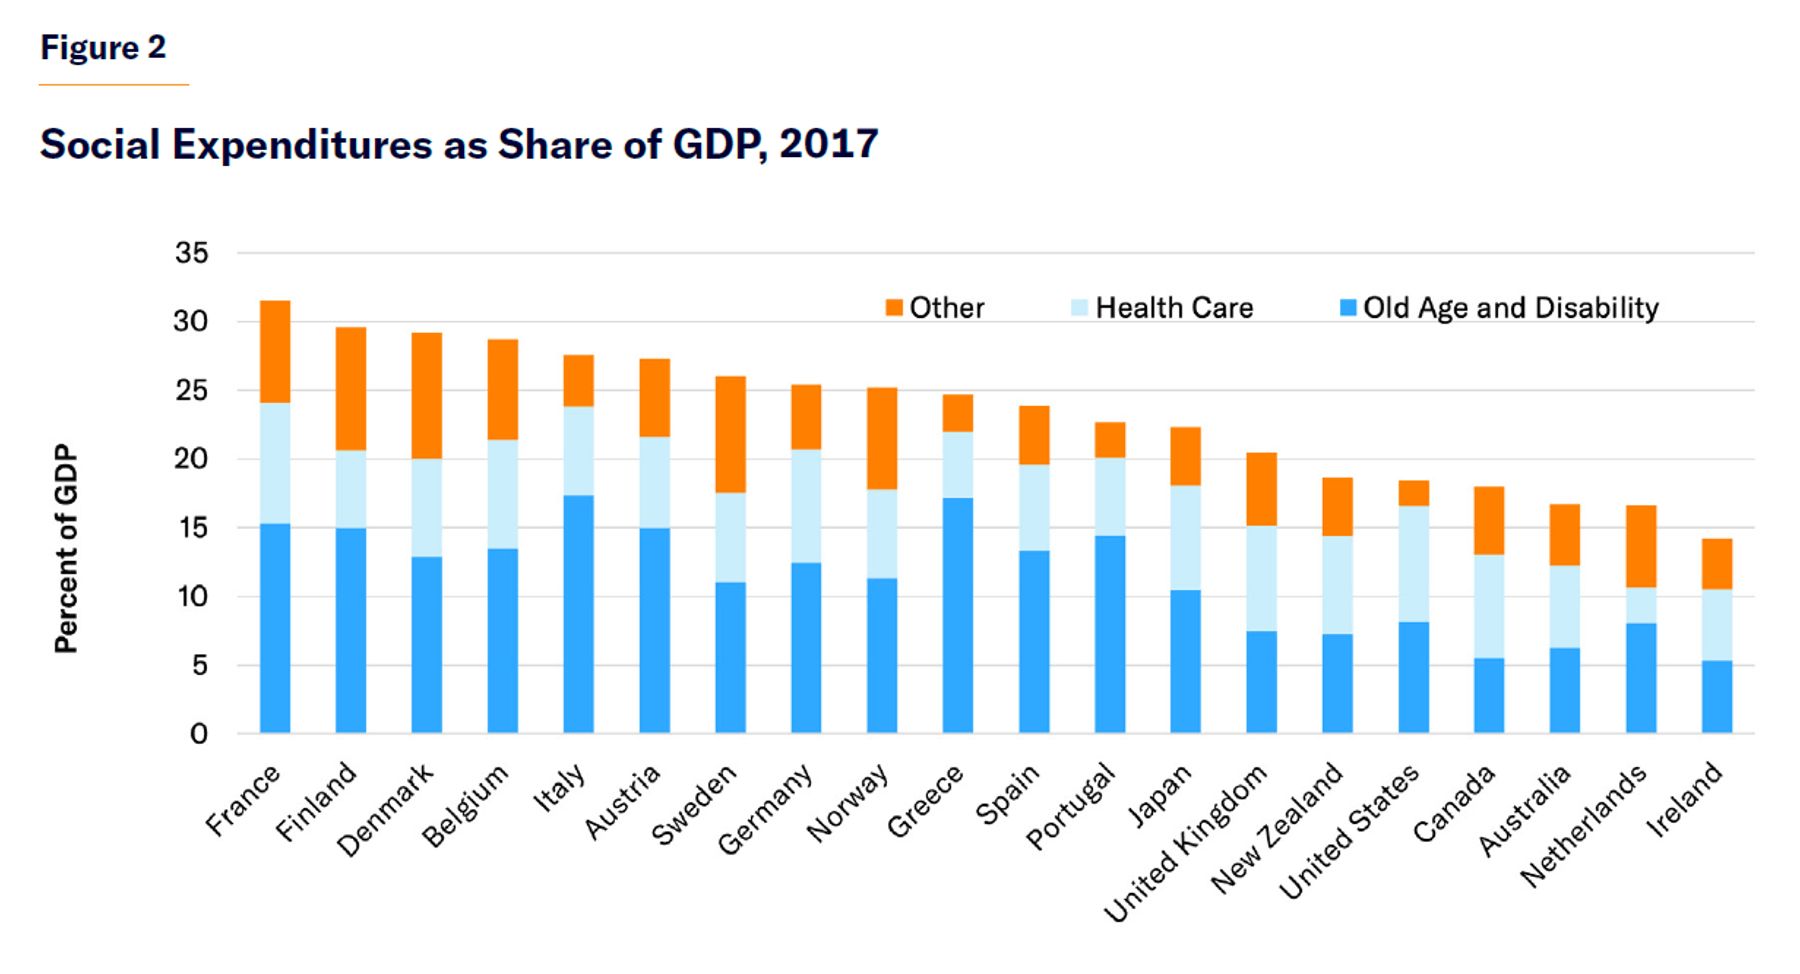
In 2019, governments spent a much smaller share of national income in the U.S. (39%) than in the European Union (47%), even though rates of public spending on education and health care were similar.[3] Much of the difference was due to higher levels of spending on public pensions by European governments (Figure 2).
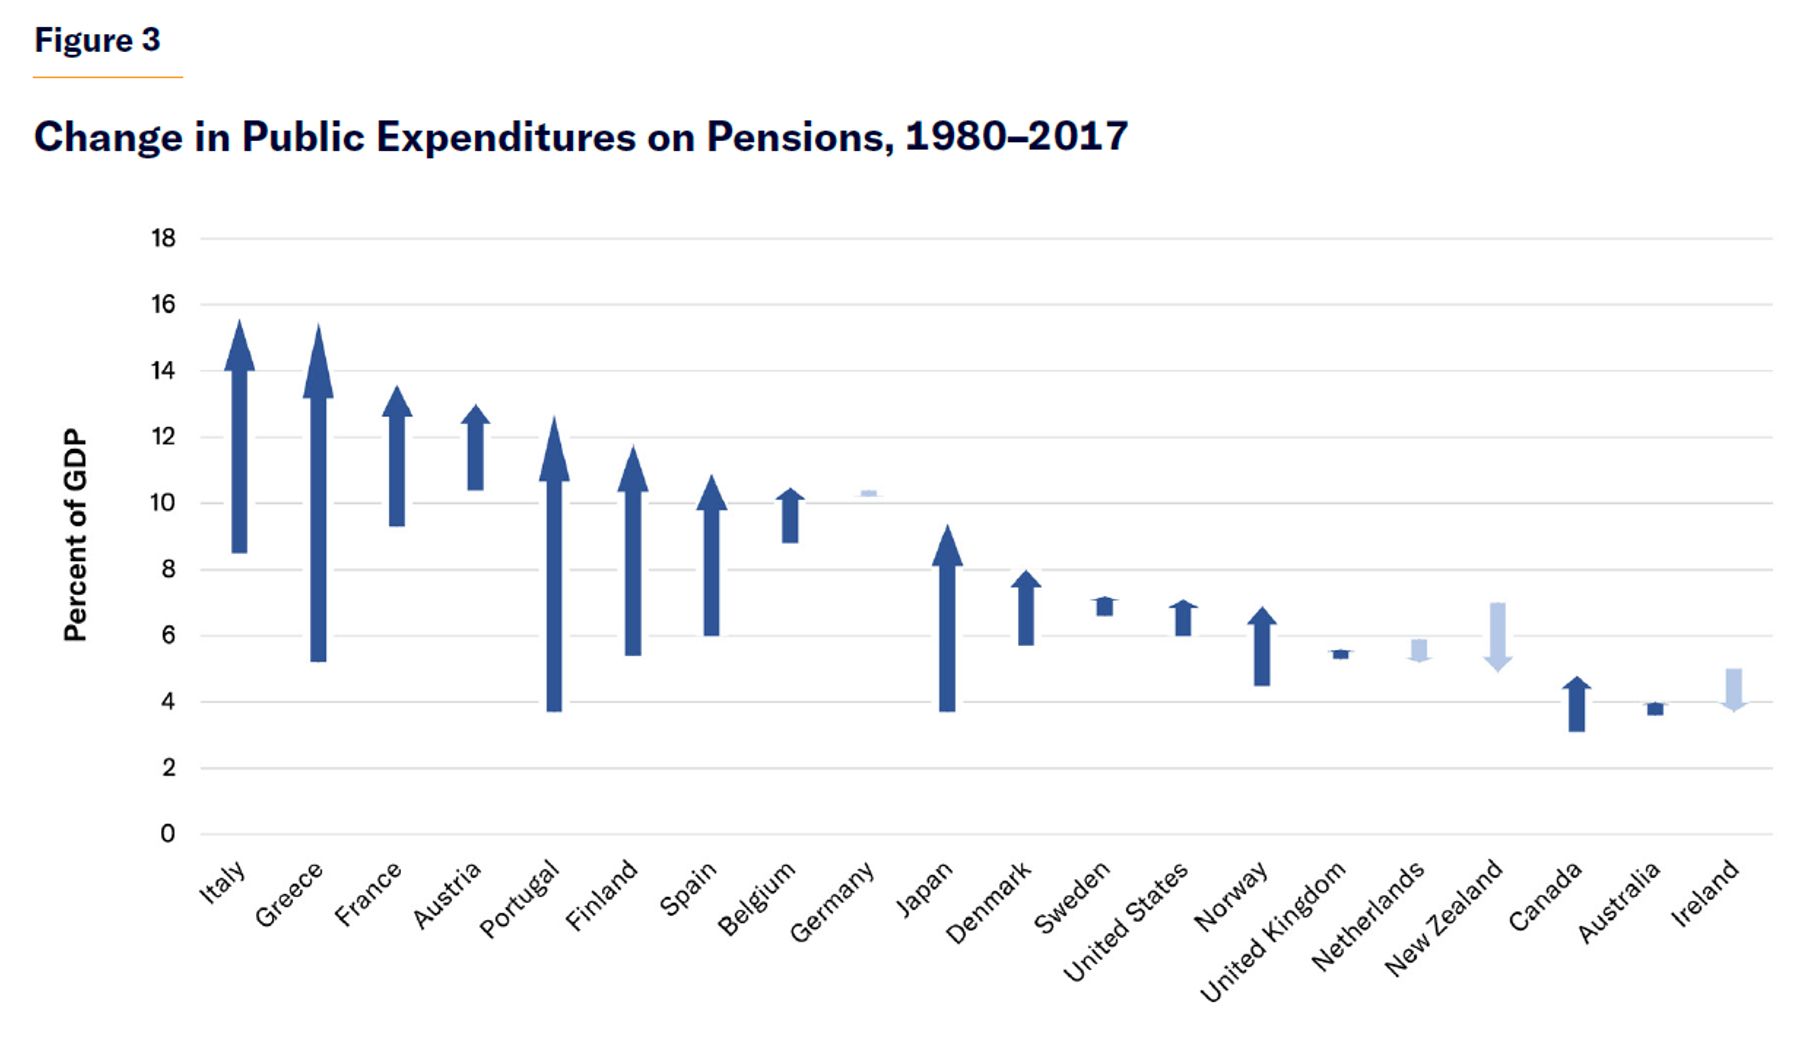
Pensions dominate entitlement expenditures because they are intended to be a permanent replacement for market income, rather than merely to supplement it (as child benefits do) or to replace it for a temporary period (as unemployment benefits do). The cost of public pension programs has risen rapidly over recent decades in both Europe and the U.S., due to the maturation of retirement benefit promises, the increase in benefits to which retirees are entitled, and the aging of the population (Figure 3).
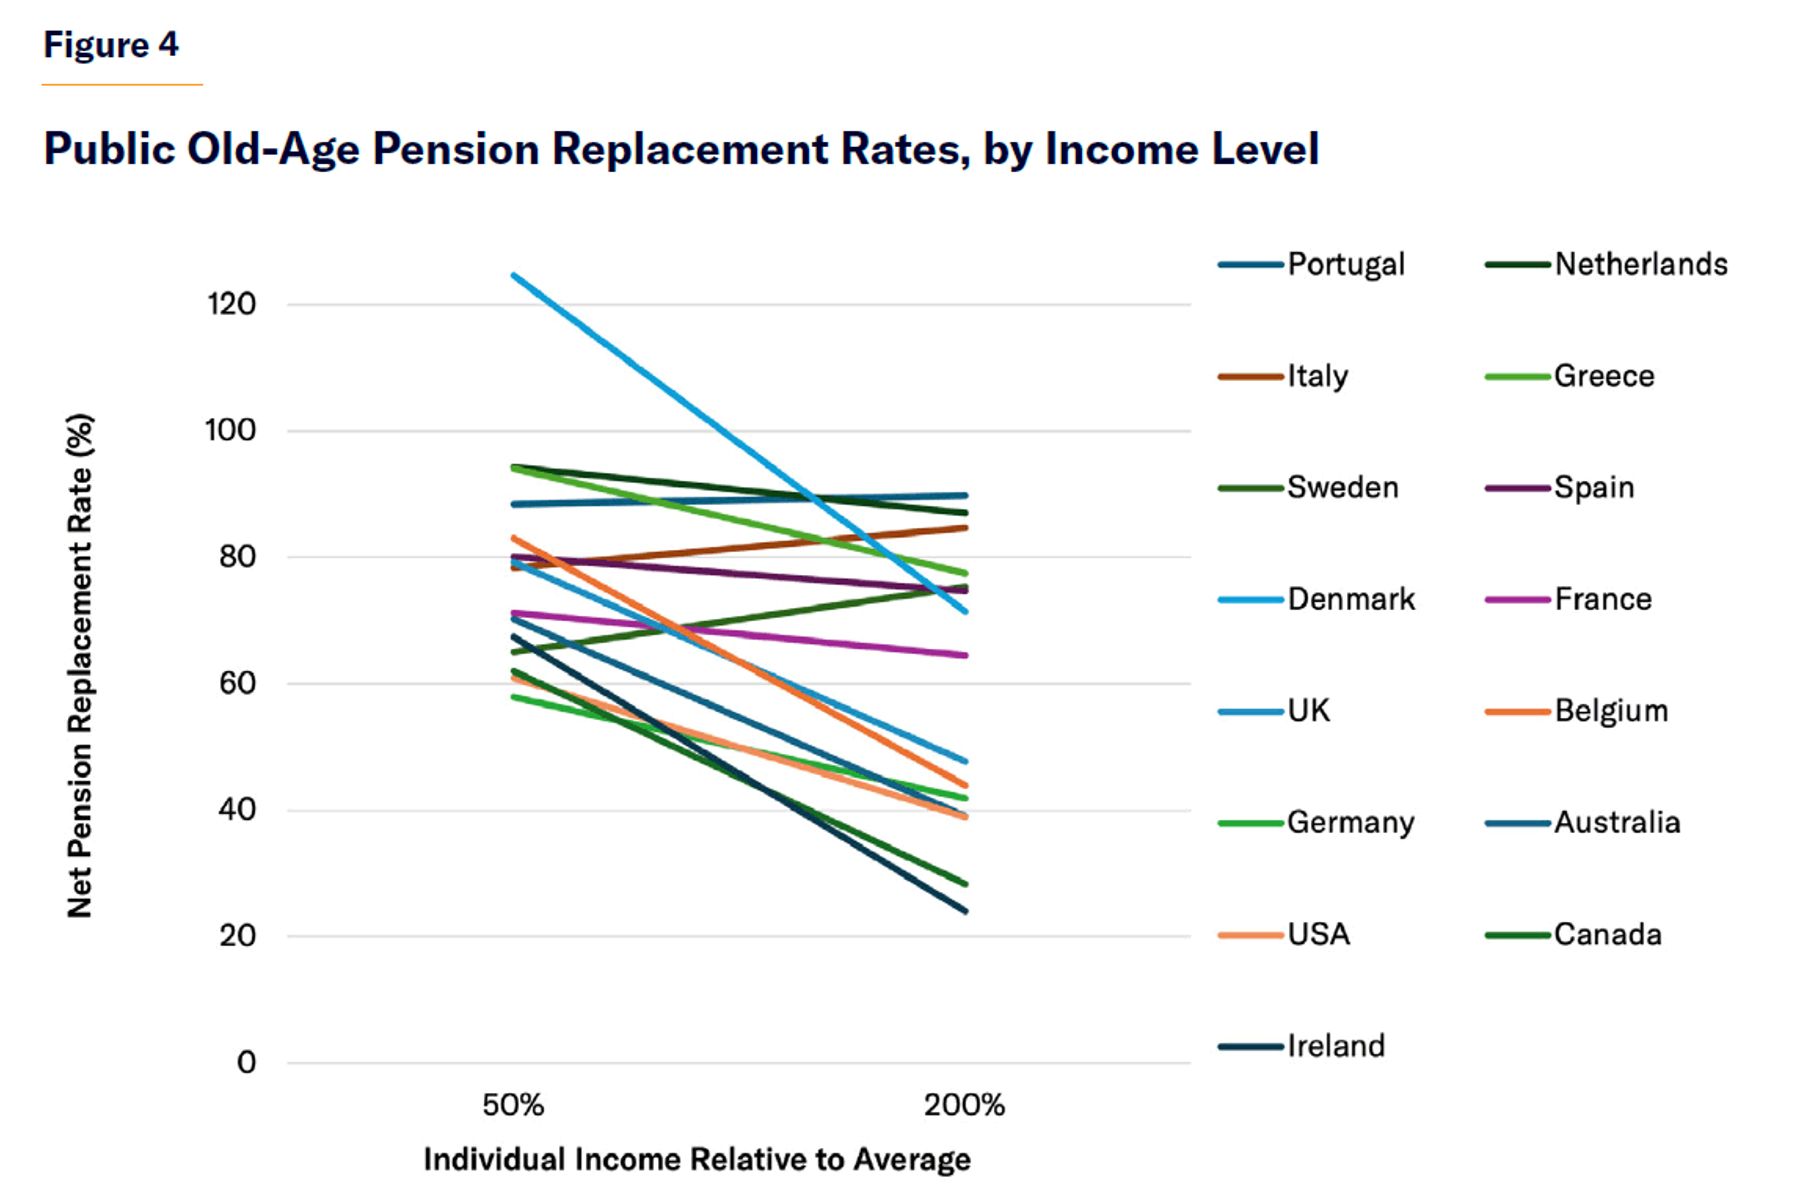
All public pension systems in the developed world ensure the elderly poor an income floor, but the costliest ones also attempt to supply a full income for the middle class in retirement (Figure 4).[4] In France, Italy, Portugal, and Spain, public pension replacement rates usually align with prior income levels, so monthly benefits are largely distributed in proportion to career earnings. By contrast, public pension replacement rates in English-speaking countries (Australia, Canada, Ireland, the U.K., and the U.S.) are designed primarily to raise the income floor for the elderly poor. Therefore, their expenditures are not so overwhelmingly directed to the affluent.
As longevity into retirement has increased most among the affluent, the costly lifetime benefits paid to higher earners have risen most, while their relative contributions have remained unchanged.[5] As a result, the cost of public pensions has risen to extraordinary levels in the nations that seek to provide full retirement incomes for all economic classes. In 2019, the share of GDP consumed by public spending on old-age pensions was 13.4% in France, 15.9% in Italy, 12.4% in Portugal, and 11.3% in Spain.[6] By contrast, costs have been much better controlled in countries where public pension spending is more focused on guaranteeing a basic floor. In 2019, public pensions cost 4.3% of GDP in Australia, 5.0% in Canada, 4.9% in the U.K., and 7.1% in the United States.[7]
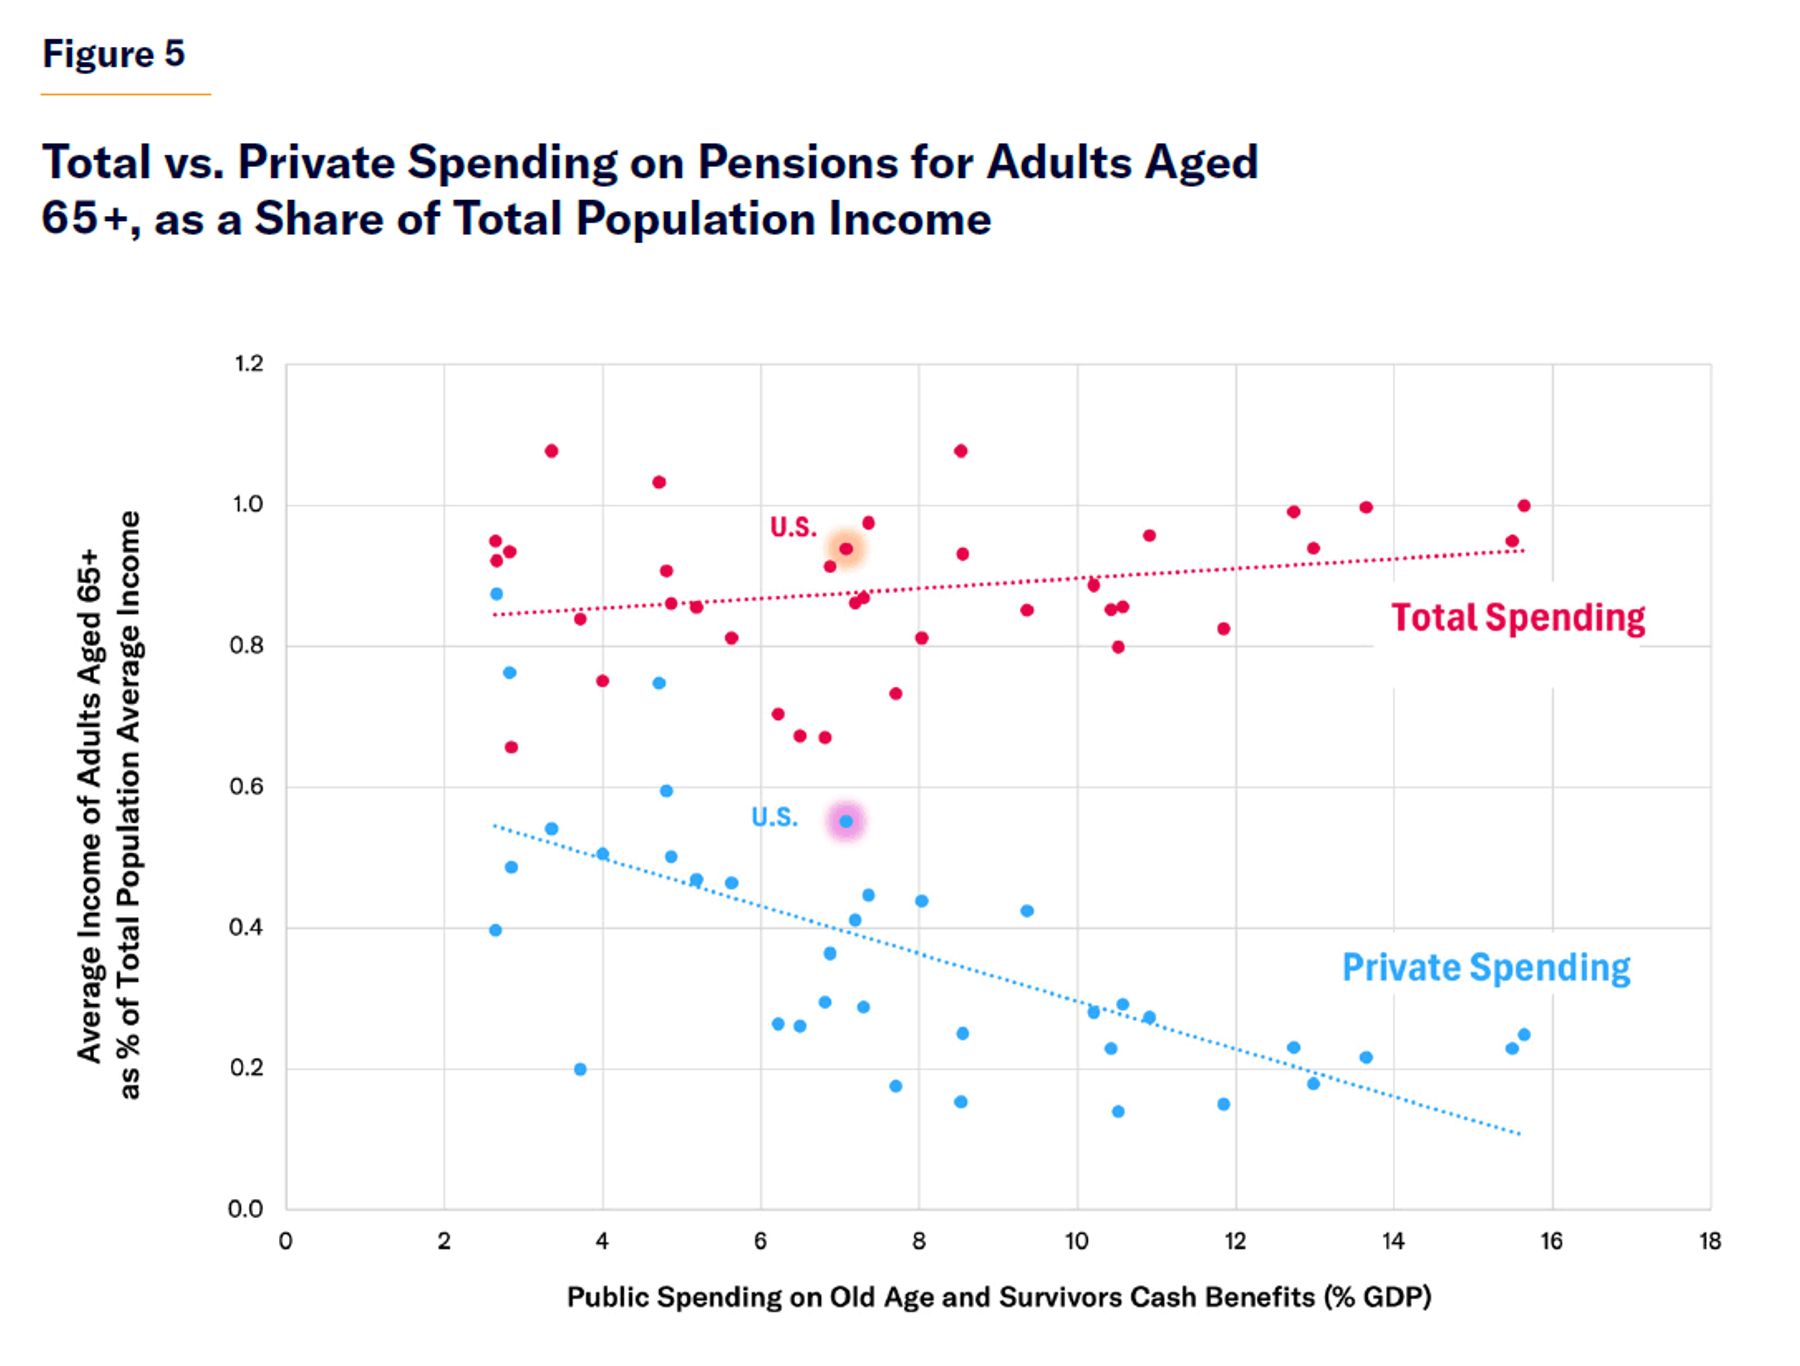
Relatively high levels of public spending on pay-as-you-go pensions do not appear to have generated significantly better outcomes for seniors. Rather, they have served largely to crowd out private provision for old age (Figure 5). This is not just due to a reduction in early retirement. In 2017, private pension payments accounted for 5.0% of GDP in Australia, 5.5% in Canada, and 5.3% in the U.S., but only 0.4% in France, 1.1% in Italy, and 0.4% in Spain.[8]
Affluent households have a wide array of financial instruments or consumption choices of durable goods (such as homeownership) at their disposal. They can use these tools to spread their incomes to retirement and defray longevity risks where they are given the responsibility for doing so. Lower state spending on pensions for higher-income households therefore tends to encourage greater savings.[9] These have often been supported by the expansion of tax-preferred retirement savings accounts, which are fully funded and do not deter employment.[10] In 2020, whereas private retirement savings amounted to 130% of GDP in Australia, 170% in the U.S., and 180% in Canada, they were only 12% in France, 8% in Germany, 13% in Italy, and 14% in Spain.[11]
The automatic escalation of spending on pension benefits for affluent retirees squeezes working-age adults.[12] In France, the median income of retirees rose from 68% of active workers’ incomes in 1975 to 102% in 2016.[13] From the mid-1990s to 2013, OECD nations increased spending on benefits for the elderly by 1.4% of GDP, while spending 0.5% less on benefits for other adults.[14]
A 2021 report by the European Commission combined individual and household income data with tax and benefit information from across the European Union to assess the net impact of taxes and transfers upon retirees and working-age households at different positions in the income distribution.[15] The commission’s study found that, across Western Europe, “the difference in total redistribution between countries is determined by the size of the pension system,” which in all countries is greater than redistribution to non-retirees.
For poor, working non-seniors, the study found that the benefits transferred (net of taxes) as a share of the nation’s average disposable income range from only 2% in Spain to 6% in the U.K. and Ireland. For retirees, the benefit transfers range from 8% in the Netherlands and the U.K. to 26% in Greece.
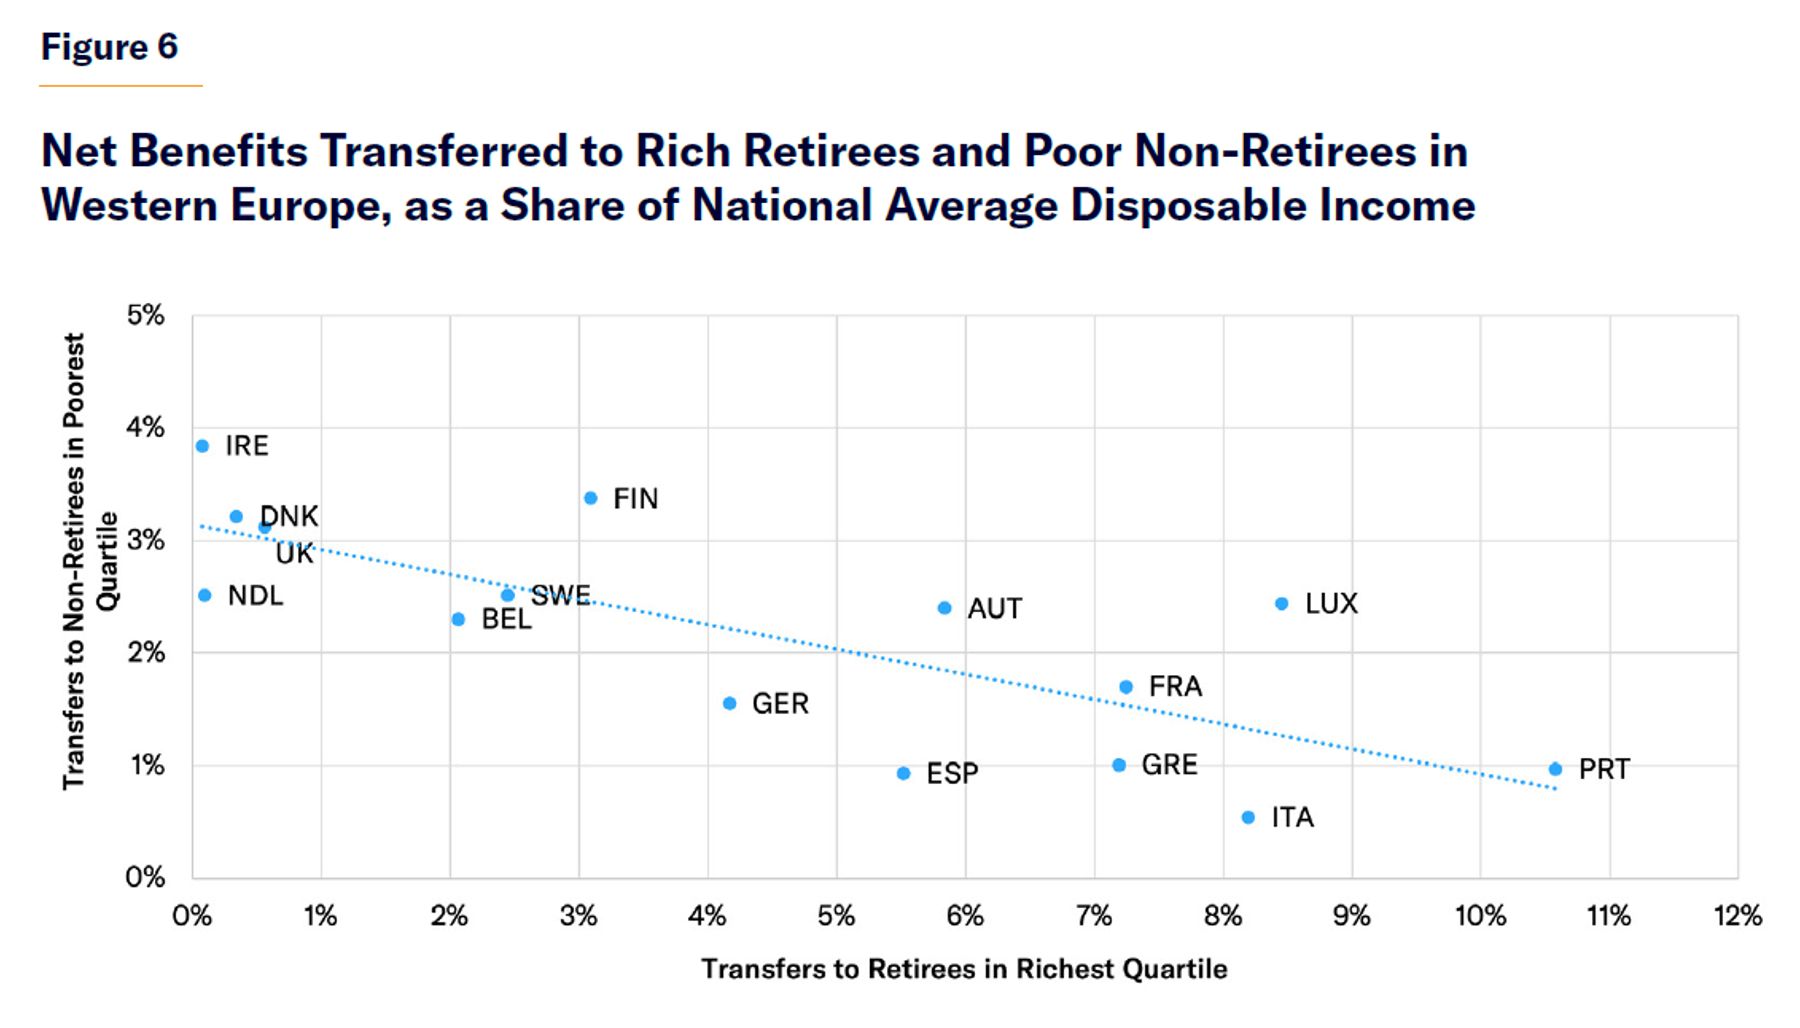
Disparities in redistribution to retirees depend primarily on differences in net benefits provided to retirees in the richest quartile of the income distribution (which ranges from 0.1% in the Netherlands and Ireland to 10.5% in Portugal). Net benefits provided to retirees in the poorest income quartile vary relatively little (from 3% in the U.K. to 8% in Belgium).[16]
The trade-off between generous pensions to affluent retirees and the net benefits provided to the working-age poor is clear (Figure 6). The authors of the European Commission study conclude that the “countries with the strongest redistribution to pensioners provide little support to households with low income.”[17] On average, redistribution to the richest quartile of retirees is more than twice as large as redistribution to the poorest quartile of non-retirees.
The Burden of Taxes
To finance their costlier pension systems, European governments do not raise more tax revenue from the rich than the United States. They just take more from those who are not rich.
Taxes in all countries exceed spending on social welfare programs because taxes are necessary for other functions of government such as national defense, police, and infrastructure. The lower the level of total government spending as a share of GDP, the more the burden of taxation can be confined to the rich. If eligibility for public entitlement programs is limited to cases where poor households have suffered misfortunes beyond their control, these programs can leave those in the greatest need better-off. But the more entitlement programs are expanded beyond this group, the more additional expenditure serves merely to displace people providing for themselves—and the more taxes must be imposed upon those of modest means, exceeding the aid that they may gain from public funds.[18]
From 2007 to 2017, the share of national income taken in taxes was much larger in Europe (47%) than in the U.S. (28%). The disparity was not the result of individual income, wealth, and corporate taxes (amounting to a combined 13% of national income in Europe and 14% in the U.S.), which typically bear more on affluent households. It was due to payroll taxes (19% in Europe and 8% in the U.S.) and indirect or consumption taxes (14% in Europe but only 7% in the U.S.), which typically take a larger share of the incomes of poorer households.[19]
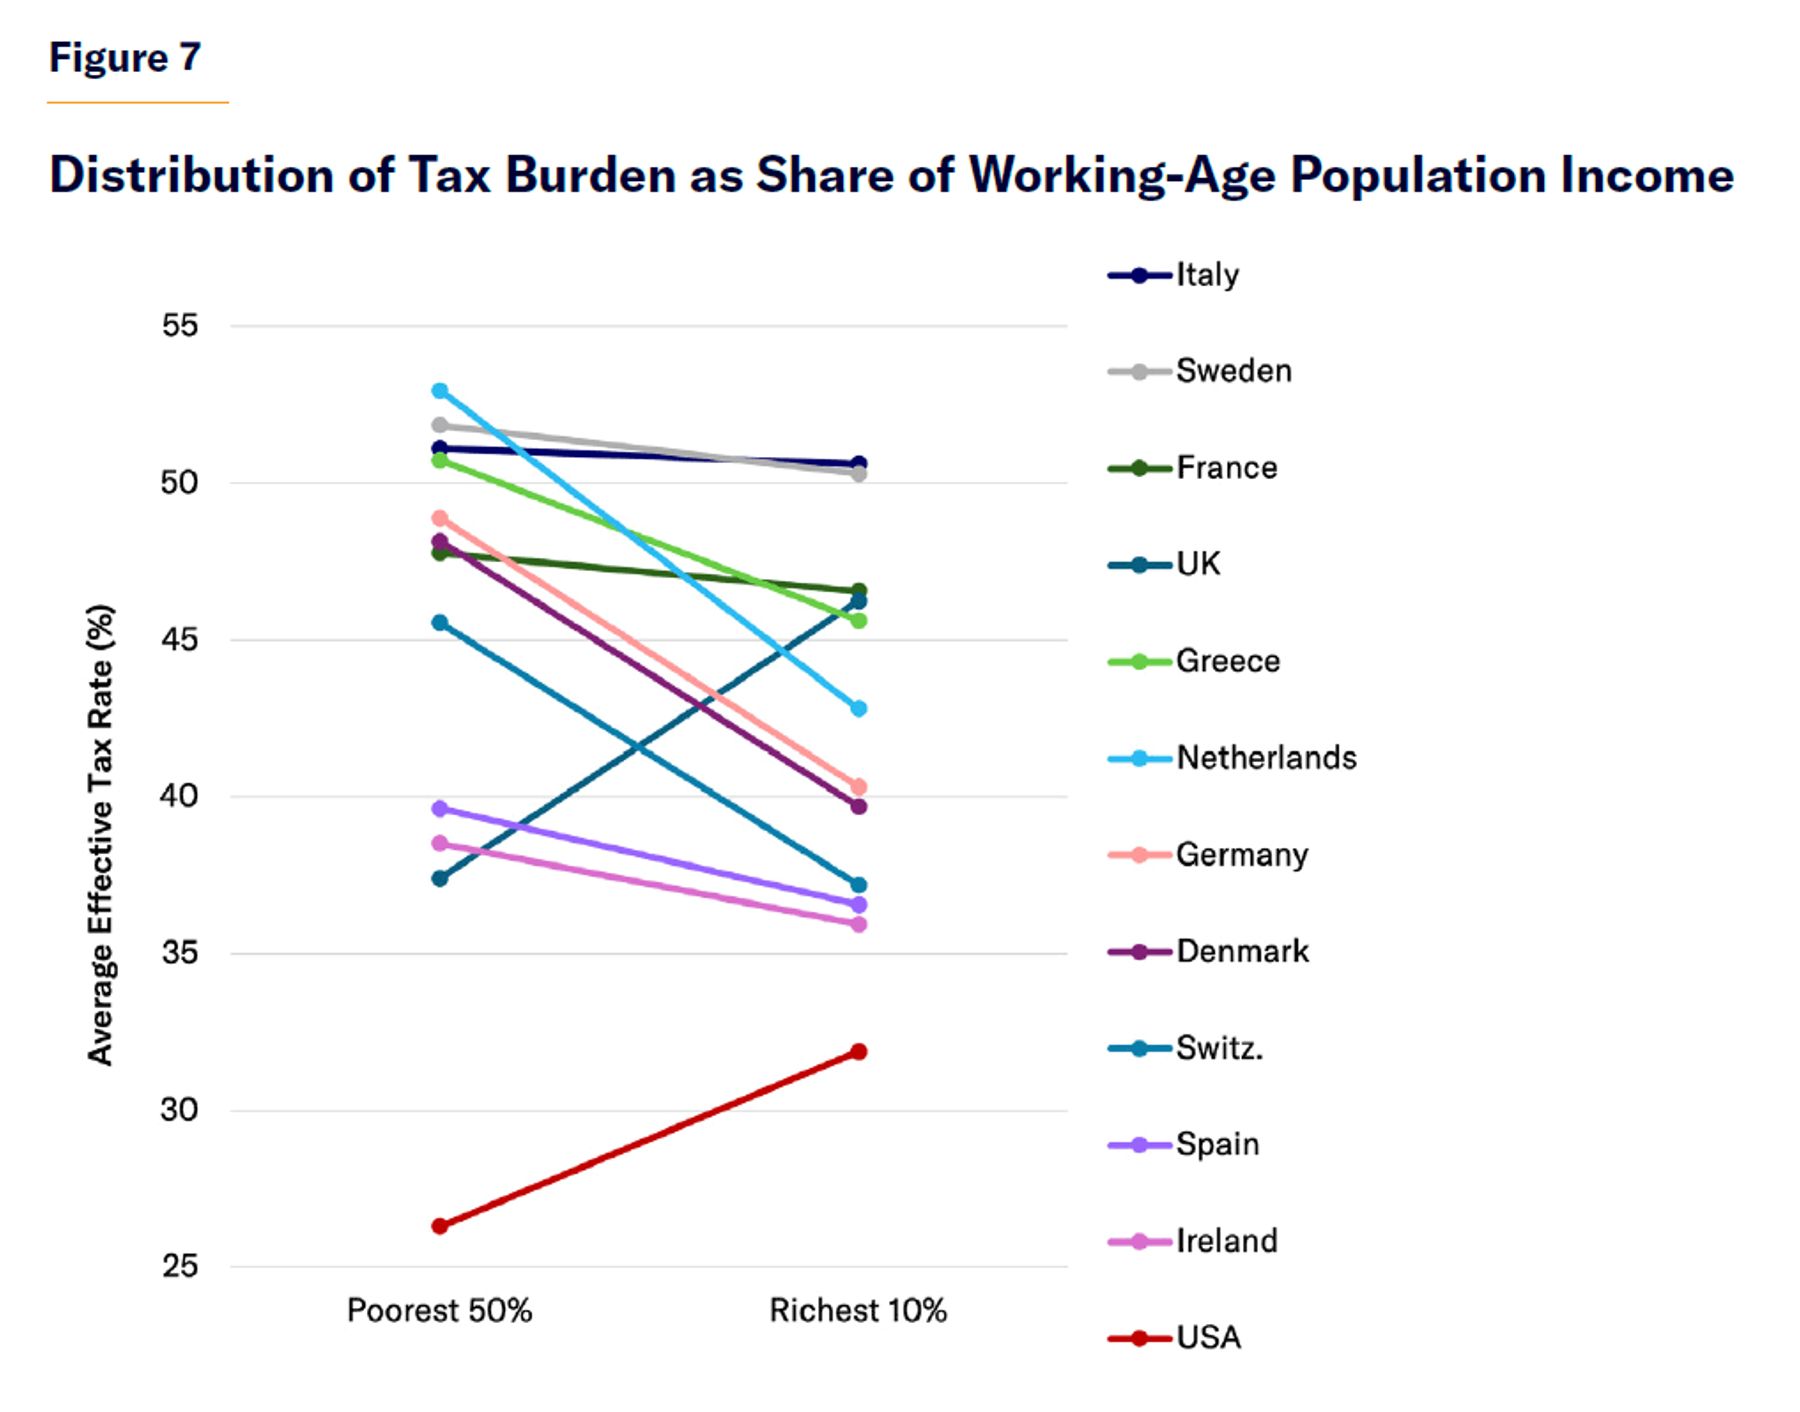
The distinctive feature of progressive tax systems in the modern world is not high taxes on the rich but lower taxes on the non-rich.[20] The U.S. is, in fact, one of the few developed countries where the half of the population with incomes below the median pay a smaller share of their income in taxes than the richest 10% of households (26% vs. 32%).
The poorest half of the population pay a much higher share of their income in taxes than the richest tenth in Germany (49% vs. 40%), Denmark (48% vs. 40%), and the Netherlands (53% vs. 43%). In the U.K., the poorest half of the population pay less in taxes than the rich (37% vs. 46%)—but their tax rates are substantially higher than in the United States (Figure 7).[21]
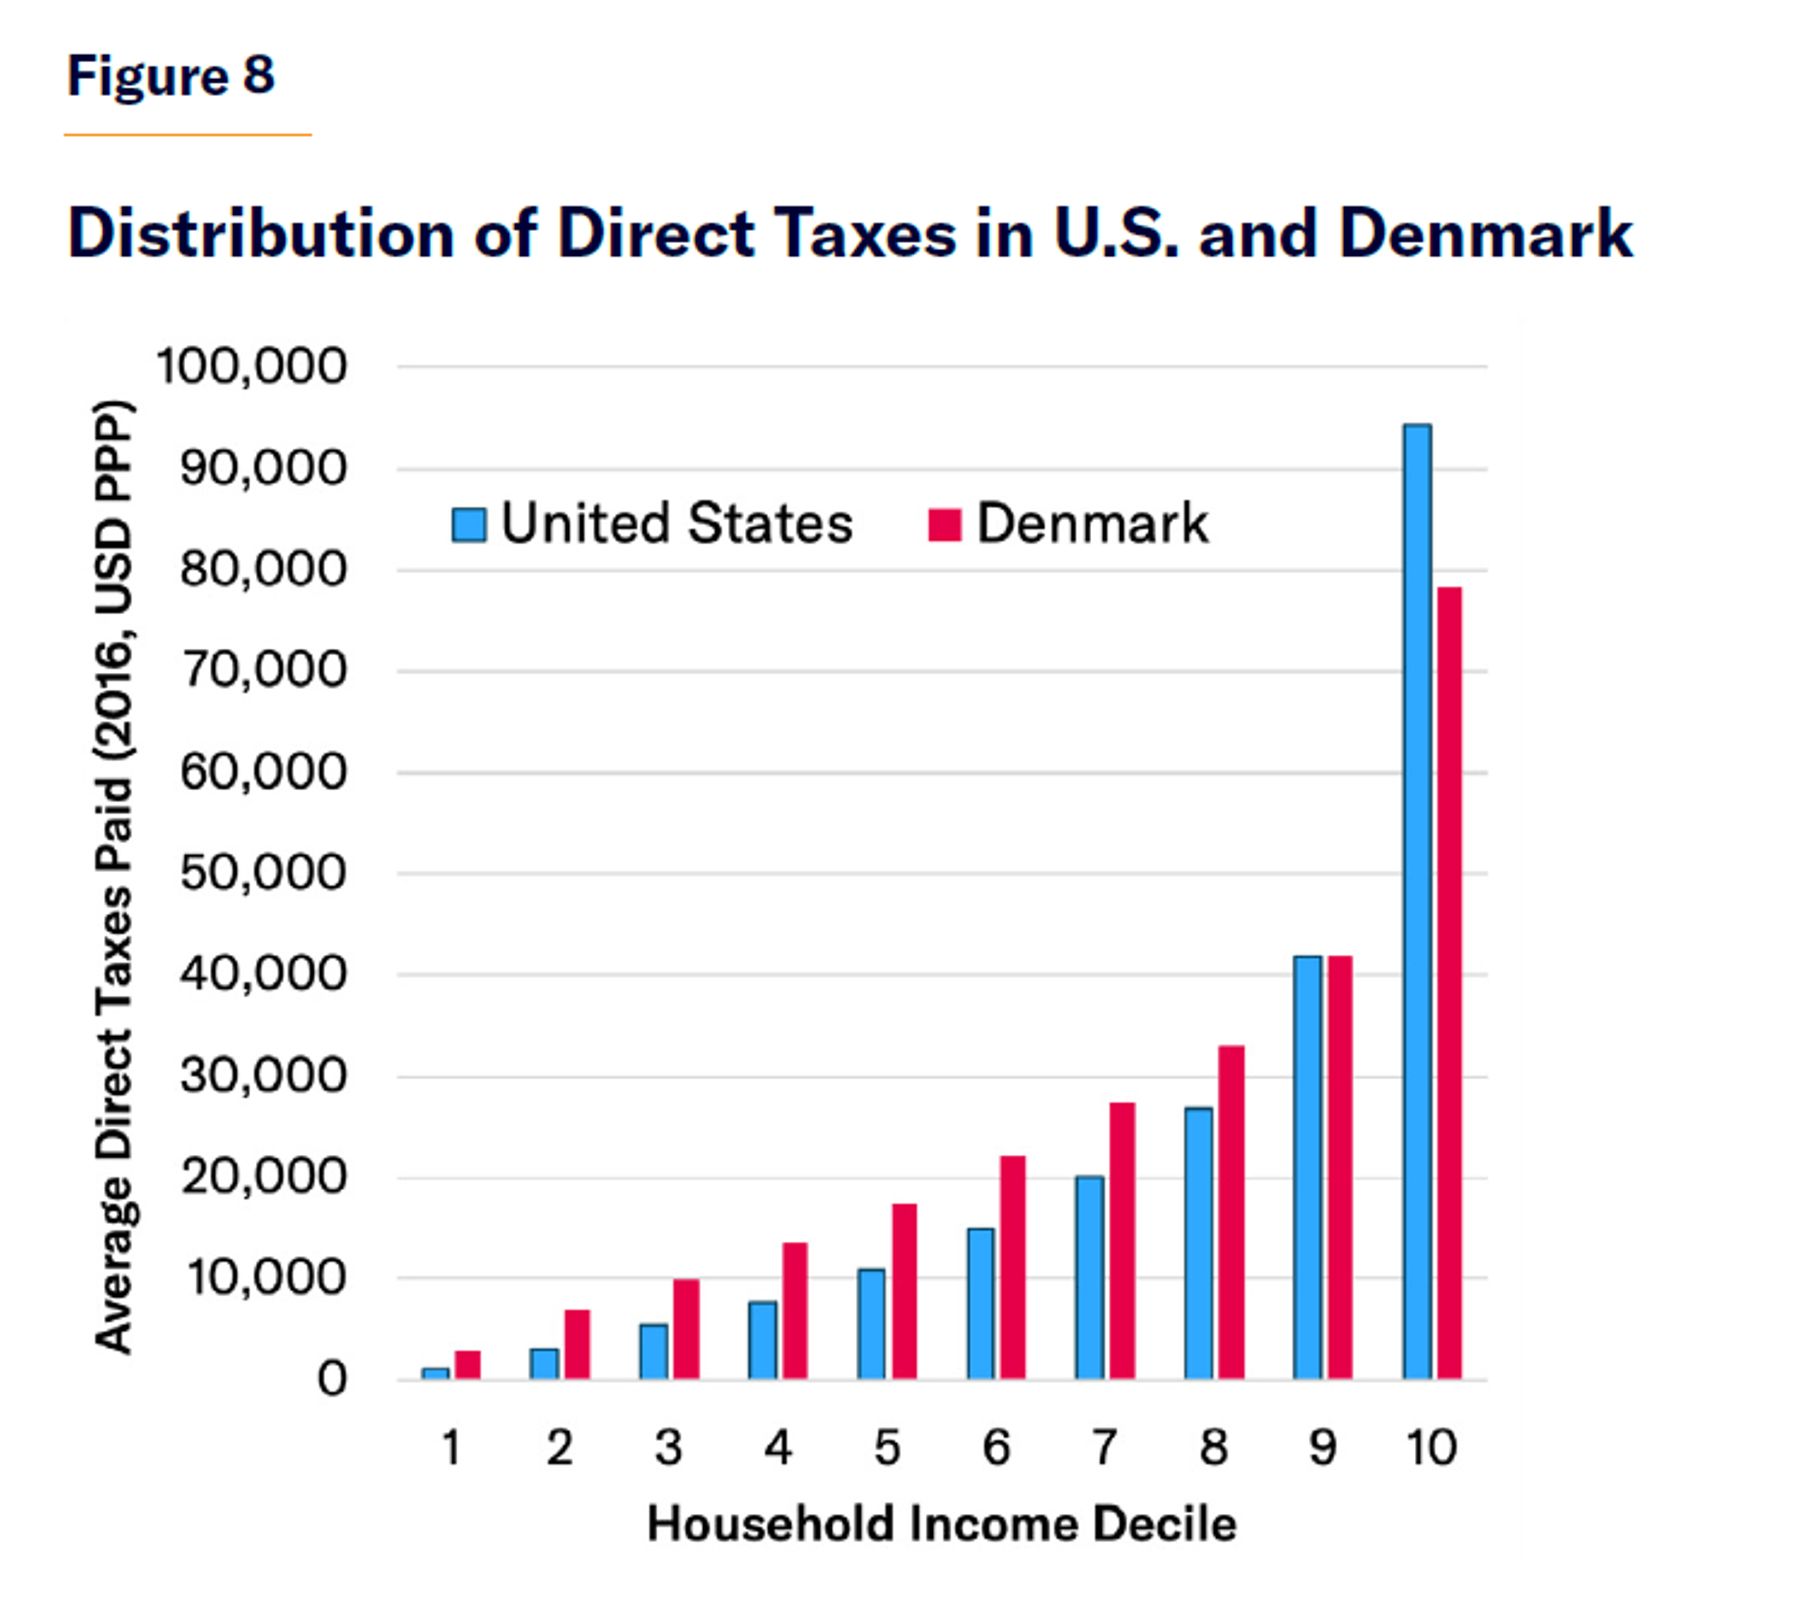
In Denmark, one of the wealthiest European nations—and which also has the highest tax rates—the richest two deciles are the only section of the population that contributed less in direct taxes than the equivalent deciles of the U.S. population (Figure 8).[22] On top of this, indirect taxes were much higher in Denmark (14% of GDP) than in the U.S. (4%) in 2019—and such consumption taxes typically tax the poor at a rate twice as great as they do the rich.[23] The U.S. therefore raises more tax revenues from the rich than many progressives’ model welfare regime, while imposing much less of a tax burden on its poorest citizens.
Aiding People Unable to Work
Entitlements in the U.S. are designed mostly to provide a targeted floor of assistance to those unable to work. This greatly reduces the cost of financing a social safety net, while doing much less to crowd out incomes from private employment.
In the modern U.S., the number of hours of work is the primary determinant of low incomes.[24] In 2022, the U.S. population was 333 million, of whom 121 million worked full-time throughout the year. Of those, only 4% earned market incomes less than $20,000. Of the 50 million Americans who worked part-time or only part of the year, 51% earned below $20,000. A further 162 million did not work at all.[25]
The majority of nonworkers were either retired or children, but the category also includes the disabled, housewives, and full-time students, as well as the long-term unemployed. Every developed country has understandably sought to provide a different form and degree of support to residents in each of these categories, reflecting their varying abilities to work. This task is unavoidably judgmental and controversial. Aiding the elderly, who are not expected to work, is, in principle, relatively uncontroversial. But the age at which individuals are deemed too old to work is the subject of substantial policy debate in every nation.
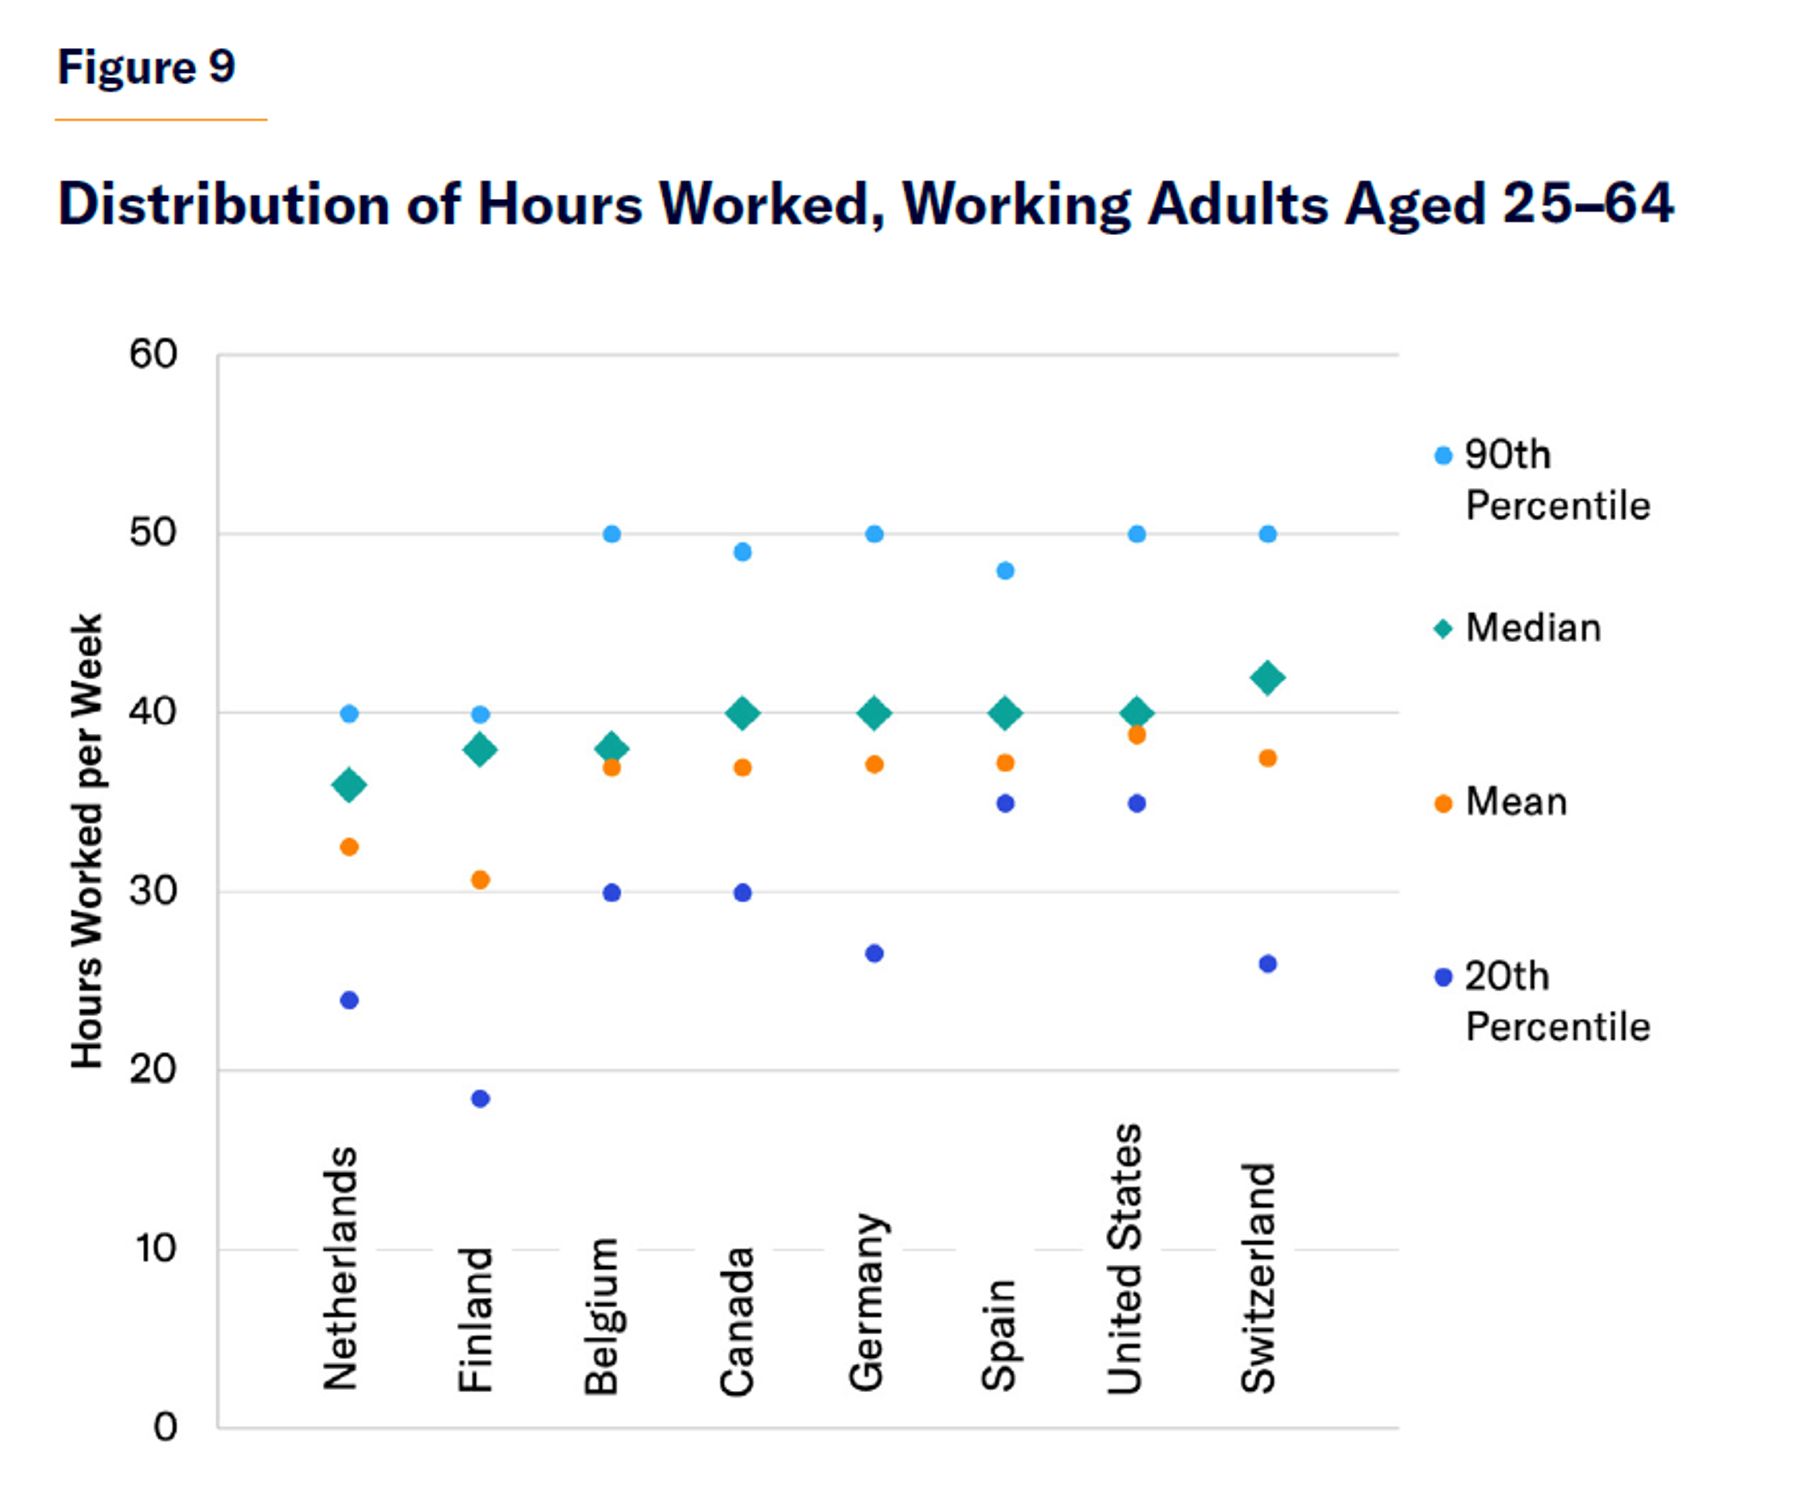
The average American does not work many more hours in a year than the average European or Canadian; but a much smaller share of the working population in the U.S. work substantially less than full-time throughout the year (Figure 9). This owes much to the design of the U.S. welfare state, which has often been disparaged as a “work-biased welfare system” because it pays pervasive attention to work incentives.[26]
In the U.S., lawmakers have made a concerted effort to restructure the welfare system to prioritize work. Cash, food, housing, and health-care benefits for the poor are all conditional on formal work requirements, time limits, and benefit designs crafted to reduce work disincentives.[27] This mitigates the adverse impact on employment that targeting aid with means tests might have.
The distinctive character of U.S. entitlements can be observed by comparing the nation’s cash benefits for the able-bodied unemployed with those in other countries.
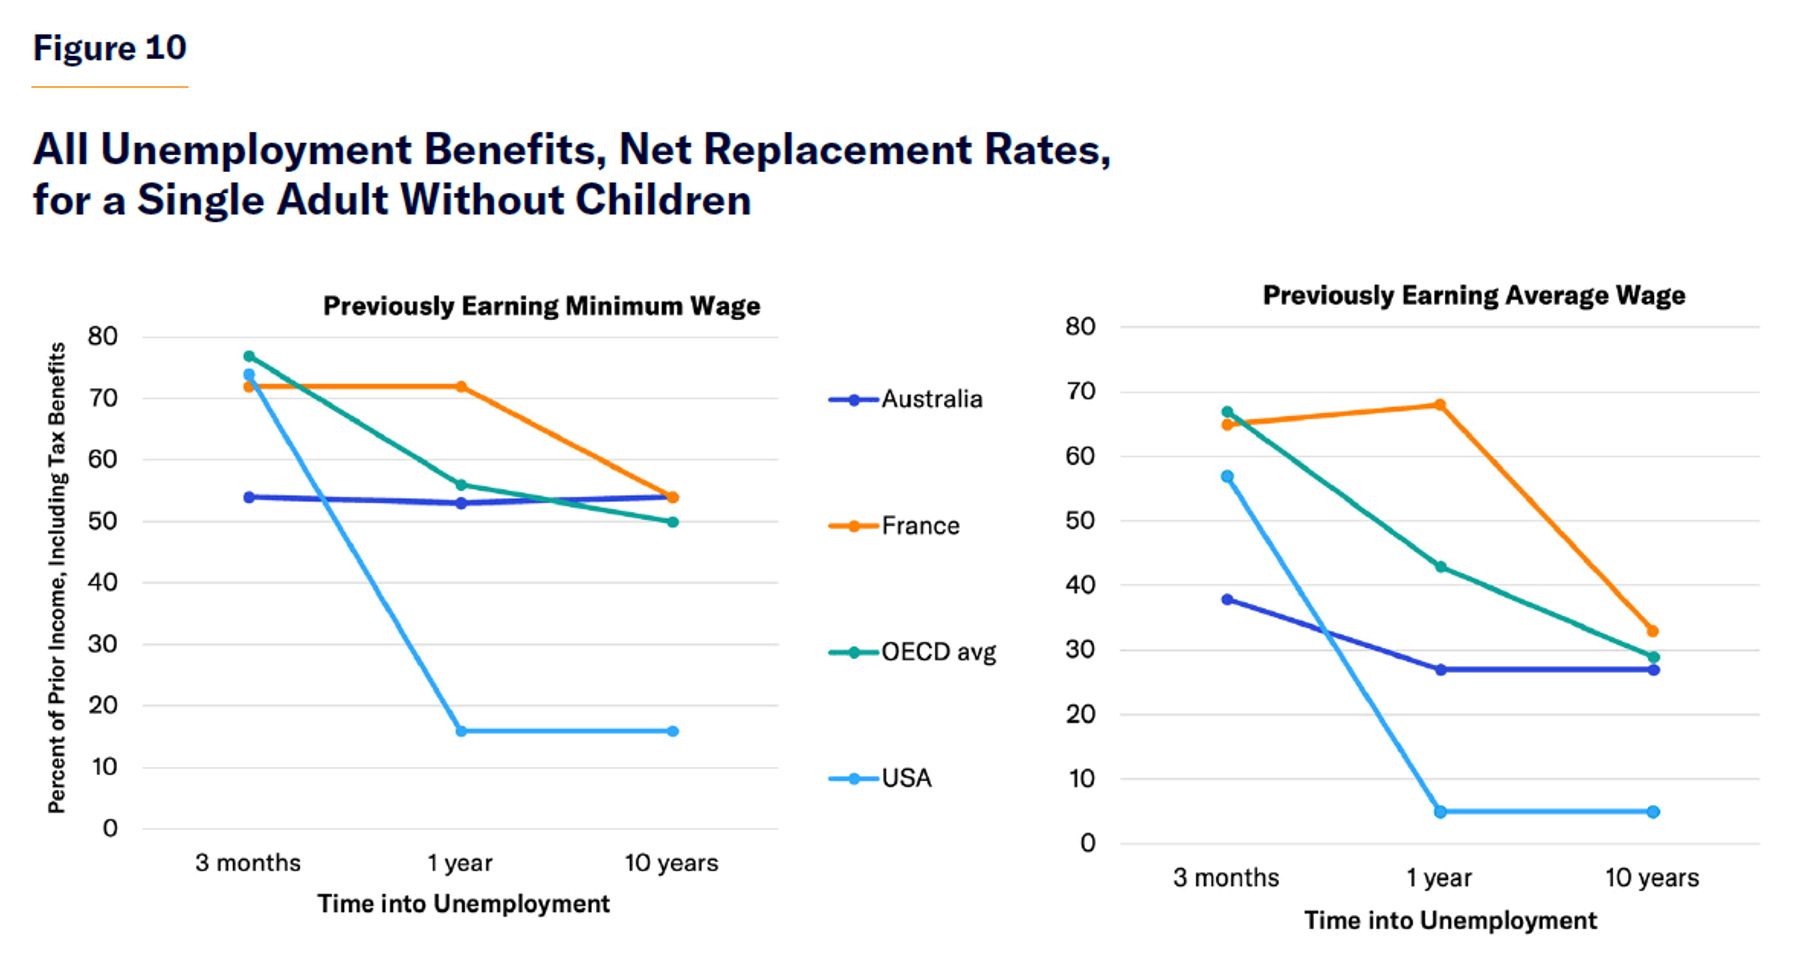
Unemployment compensation in the U.S. is better targeted than that in most other developed countries. The cash benefits that it provides to the able-bodied unemployed are initially generous for those in greatest need but reduced rapidly over time, especially for individuals who previously earned higher incomes (Figure 10).
Benefits are also more focused on counteracting business-cycle risks. In normal times, U.S. unemployment-insurance benefits are limited to 26 weeks; but Congress typically extends that limit in recessions.[28] In 2005, 2010 (a recession year), and 2015, expenditures on unemployment compensation were 0.3%, 1.1%, and 0.2% of GDP in the U.S., respectively, but only 0.7%, 0.9%, and 0.7% across the OECD.[29]
Time limits mitigate the adverse effect of assistance on employment. Since the 1970s, as the magnitude and duration of unemployment benefits have grown, unemployment in Europe has become persistently higher and longer lasting than in the United States.[30] In the first quarter of 2023, 3.5% of the labor force were unemployed in the U.S., compared with 6.0% in the European Union.[31] Whereas the proportion of the unemployed who were out of work for more than 12 months in the U.S. was 23%, it was 39% in the E.U.[32]
While unemployment benefits are intended to assist those who are temporarily unable to work due to labor-market circumstances, disability benefits are designed to identify and support those who are permanently unable to work due to personal health circumstances. Once people begin to receive disability benefits, they tend to stay on them indefinitely. Only 1% of disability-benefit recipients leave for employment in any year.[33]
Disability status is not simply the result of objectively measurable medical criteria. It reflects the availability of suitable employment opportunities and value judgments by policymakers regarding who deserves social and financial support to withdraw from the labor force.[34] The majority of disability-benefit claims now result from mental illness and musculoskeletal conditions, or unspecific symptoms such as pain, which are difficult to measure without subjective assessments.[35]
To concentrate assistance on those in greatest need, the U.S. reserves Disability Insurance (DI) benefits (averaging $1,395 per month) for those who previously worked but are now “unable to engage in substantial gainful activity.”[36] Following their application, claimants must wait five months for their claim to be assessed, without being able to draw income for work, before they begin to receive DI payments.[37] Individuals may claim lower Supplemental Security Income (SSI) cash benefits (averaging $697 per month) while they wait for approval if they own less than $2,000 in financial assets.[38] Those who have not previously worked long enough to qualify for DI may still receive SSI on a permanent basis.
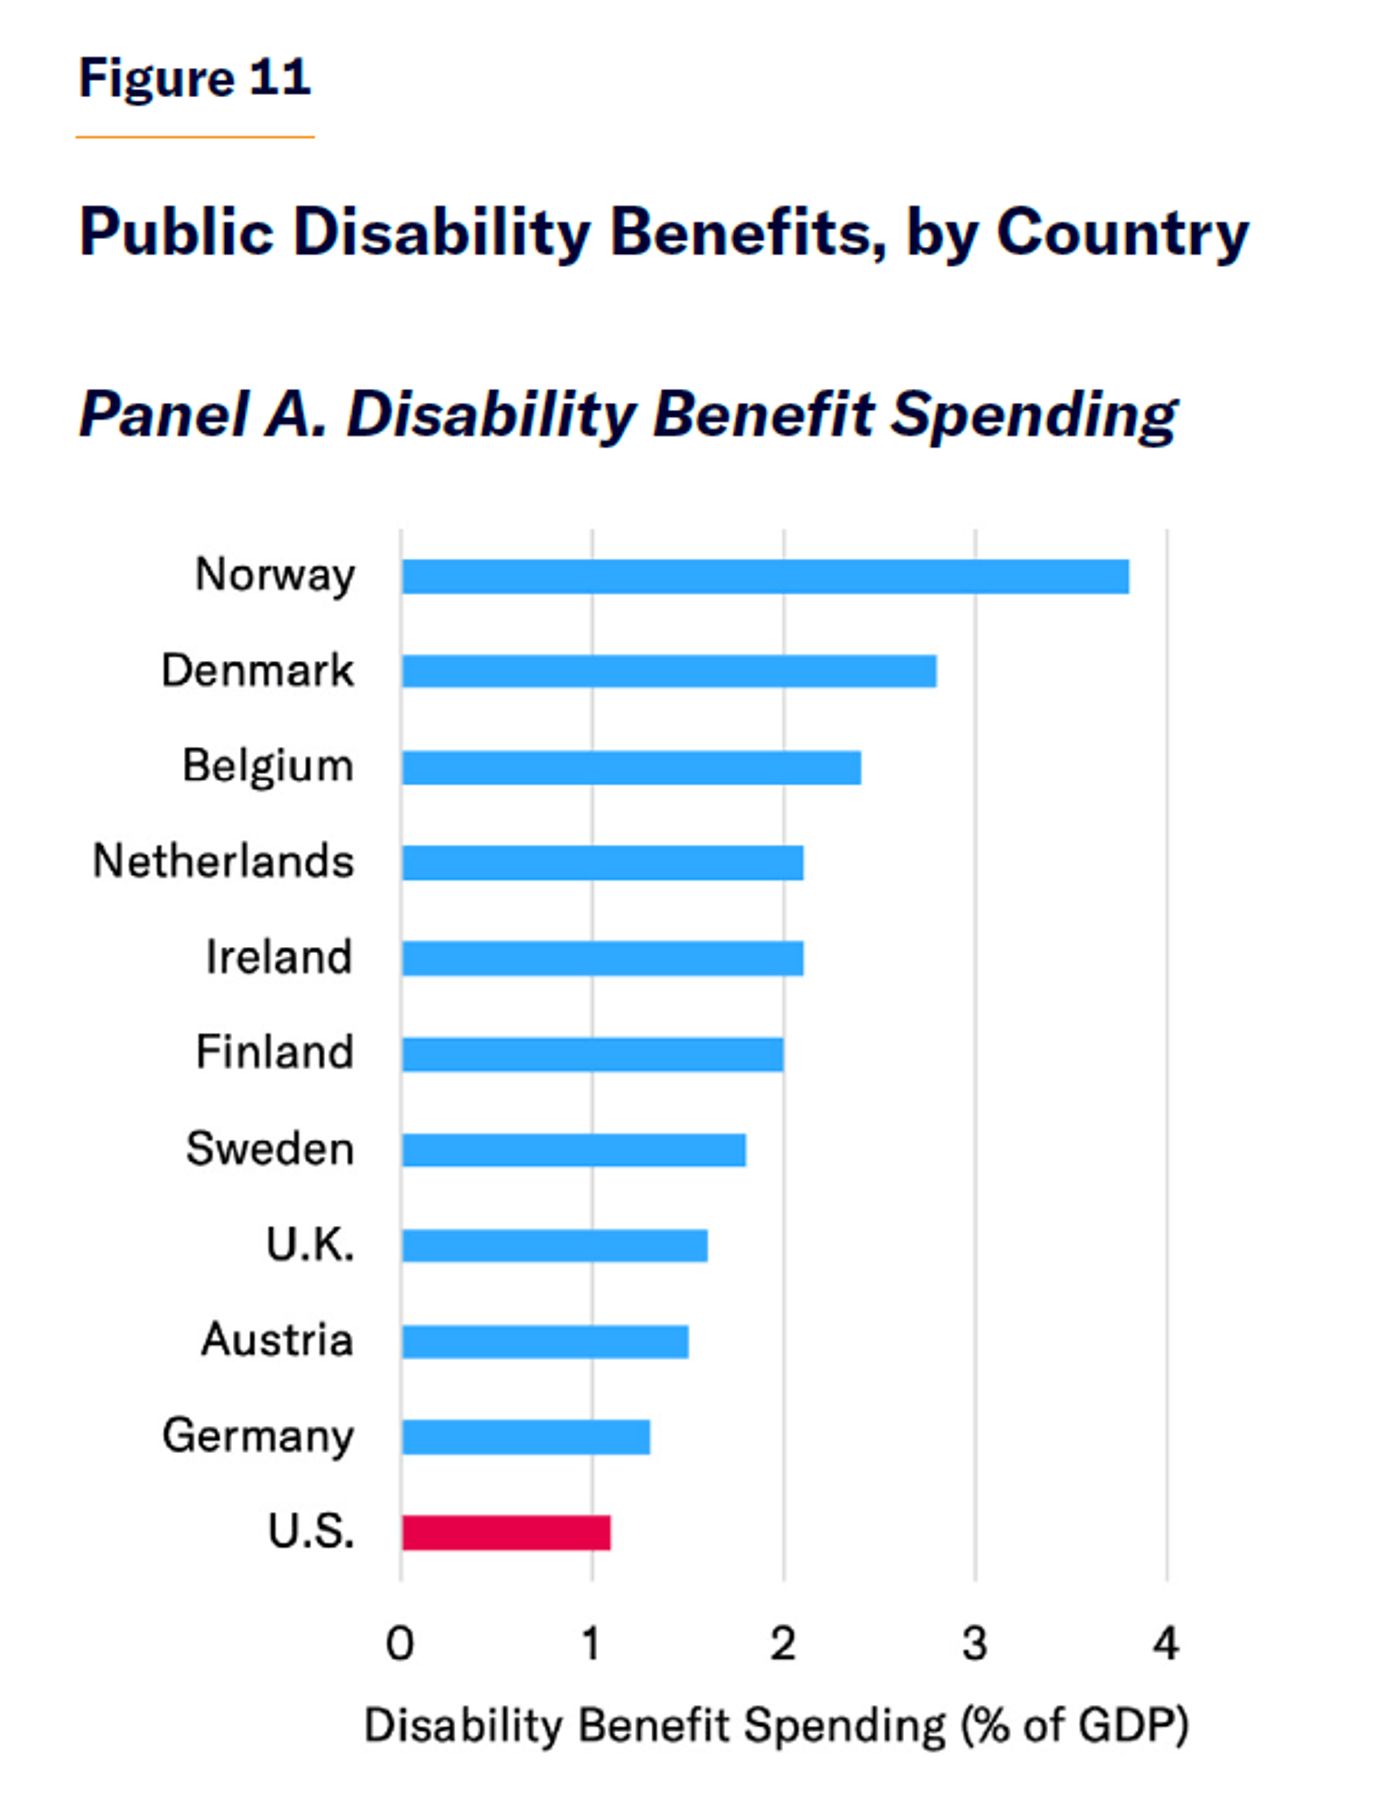
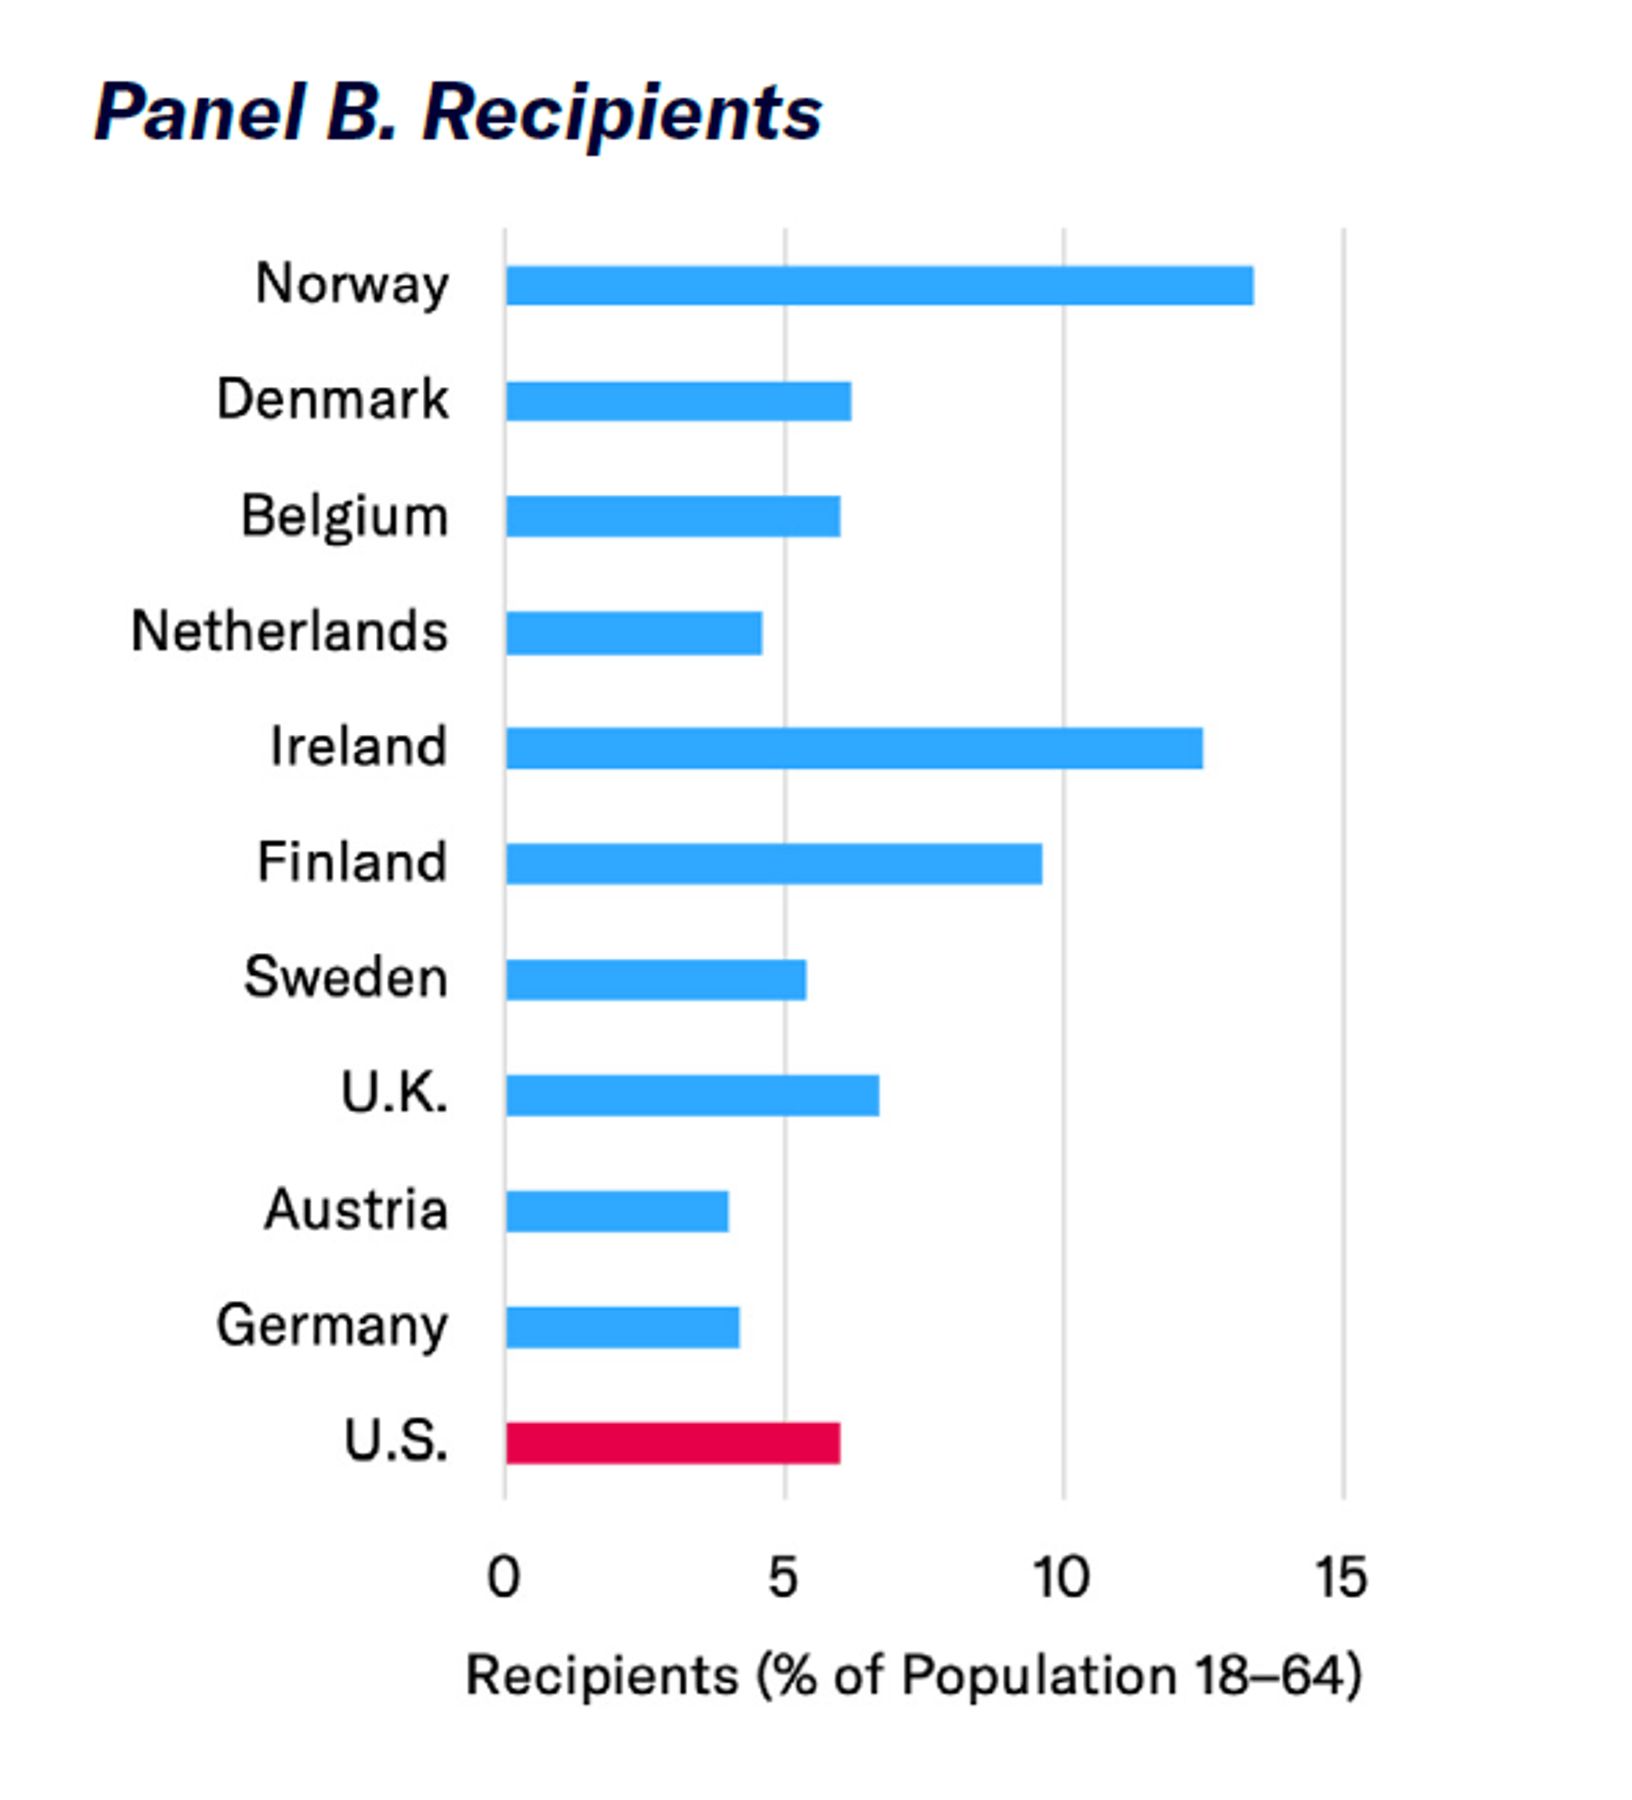
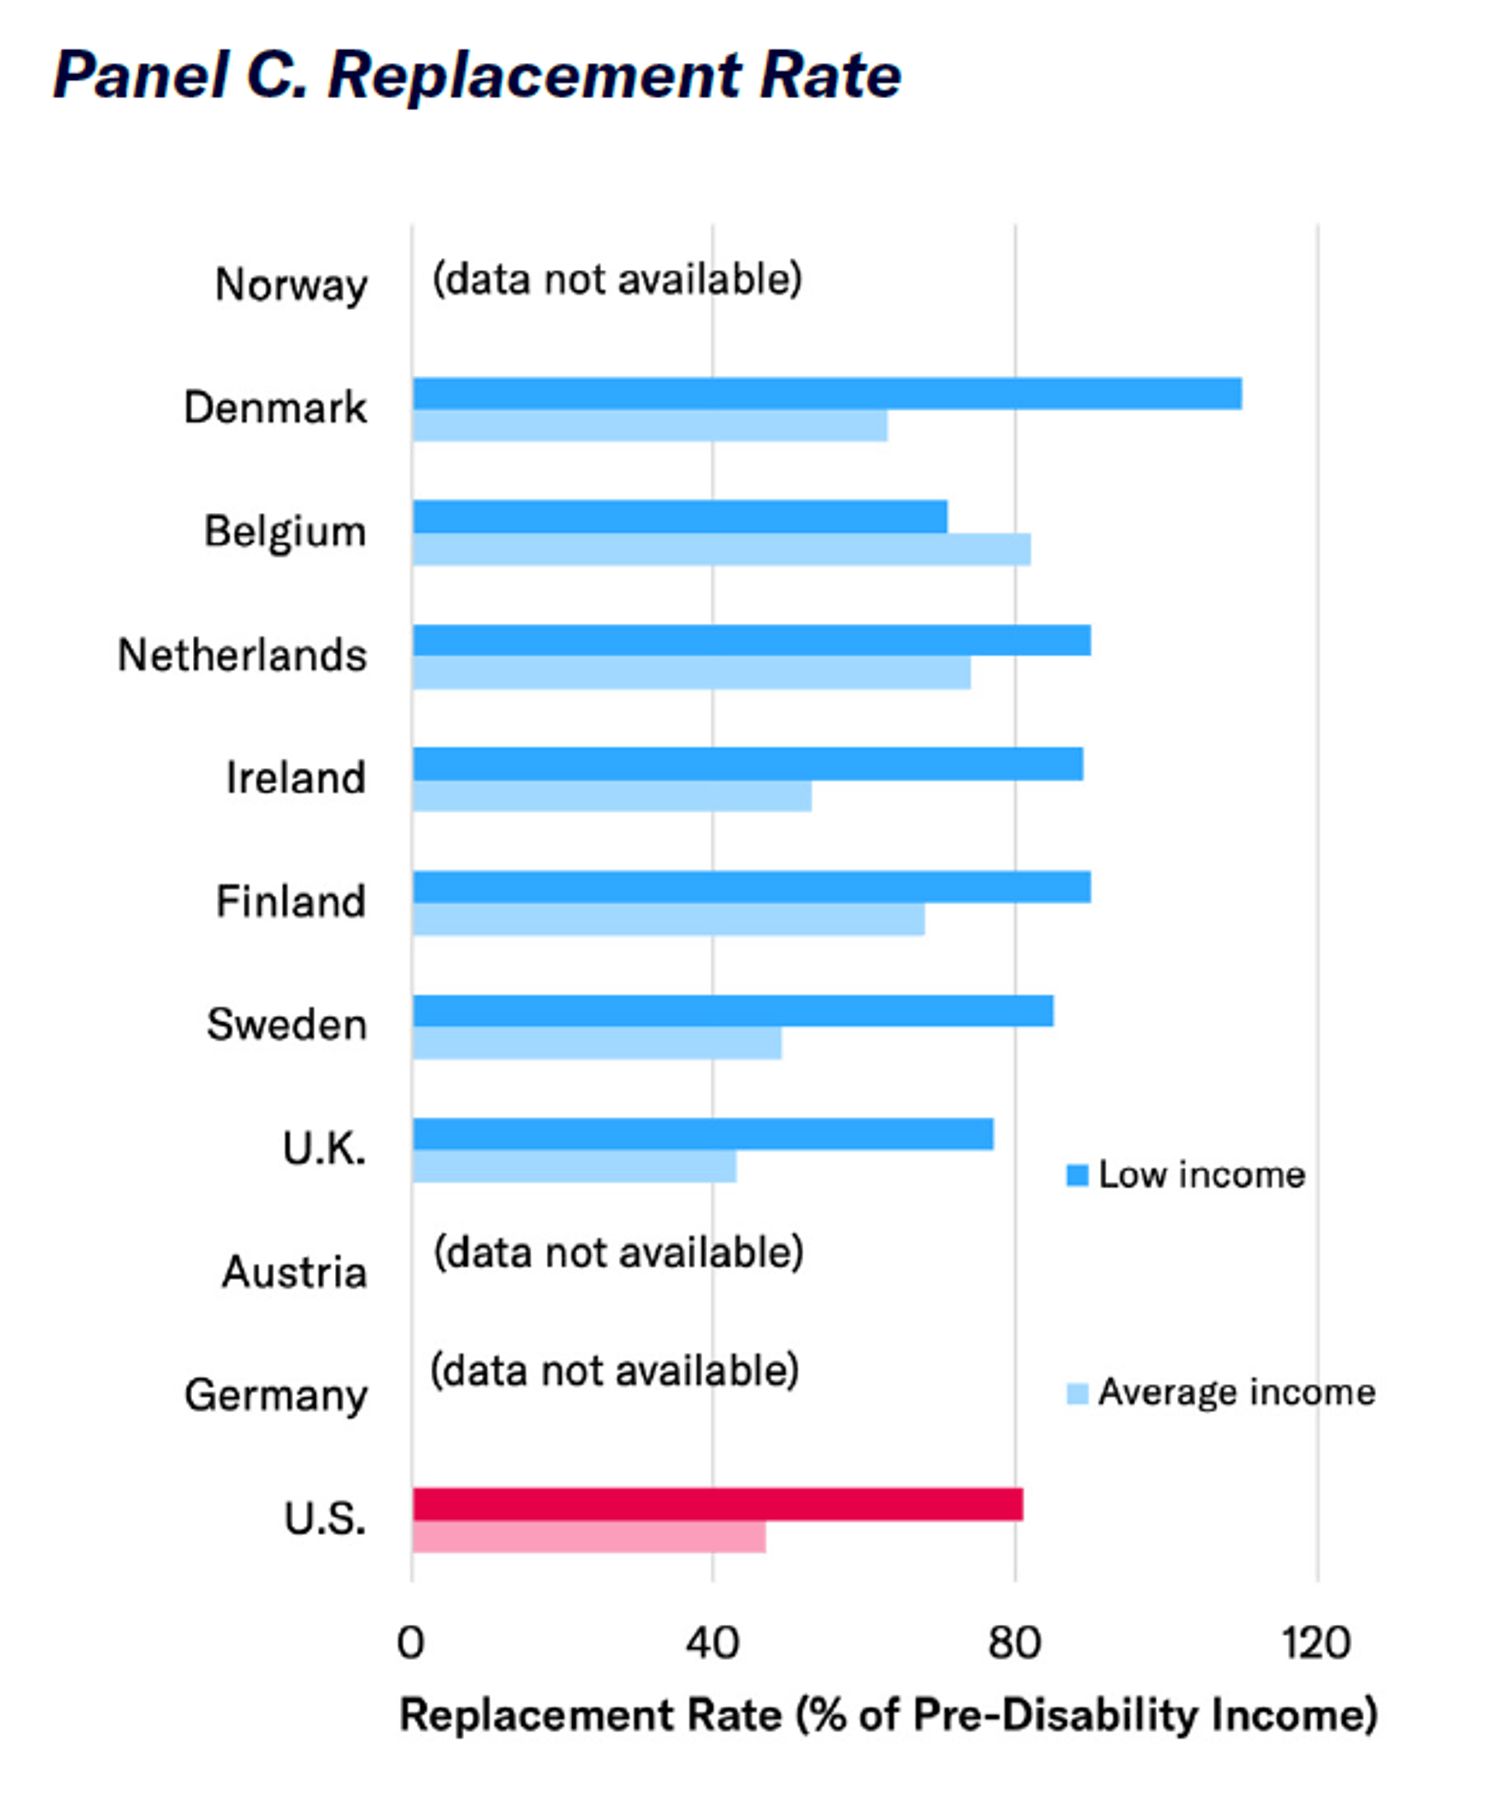
As a result of this waiting period, disability benefits in the U.S. are better targeted at those in greatest need of assistance than in other developed countries. A relatively high proportion of those near retirement (aged 50–64) in the lowest health decile receive disability benefits in the U.S., relative to Western European countries.[39] The overall magnitude of disability benefits for low-income workers and the share of the working-age population receiving disability benefits in the U.S. are similar to those in Europe. But the U.S. government spends much less on disability benefits as a share of GDP because it relies on private disability coverage to insure the incomes of more affluent citizens beyond the modest levels paid by the public DI program (Figure 11).
Benefits for those unable to work are often defined and structured very differently from country to country. The overall net effect of different cash benefits and tax provisions that assist the working-age poor is therefore best assessed by examining transfers in the aggregate, comparing five affluent developed countries. To identify those who retain the greatest unmet needs after redistribution has been undertaken, households are assessed by disposable income quintiles (i.e., after taxes and transfers).
The poorest fifth of working-age households in the U.S. are better-off than those in Canada, Denmark, the U.K., and Germany because their market income is higher and their taxes are lower, after accounting for all monetary benefits. Net cash transfers to the poorest quintile are slightly larger in Denmark than in other countries, but this effect on the poorest households’ disposable income is greatly outweighed by the much lower market incomes that it induces by disincentivizing work. Working-age households from the middle-income quintile fare best in the U.S. (in terms of market income, disposable income, and net transfers), largely because they face much lower taxes (Figure 12).
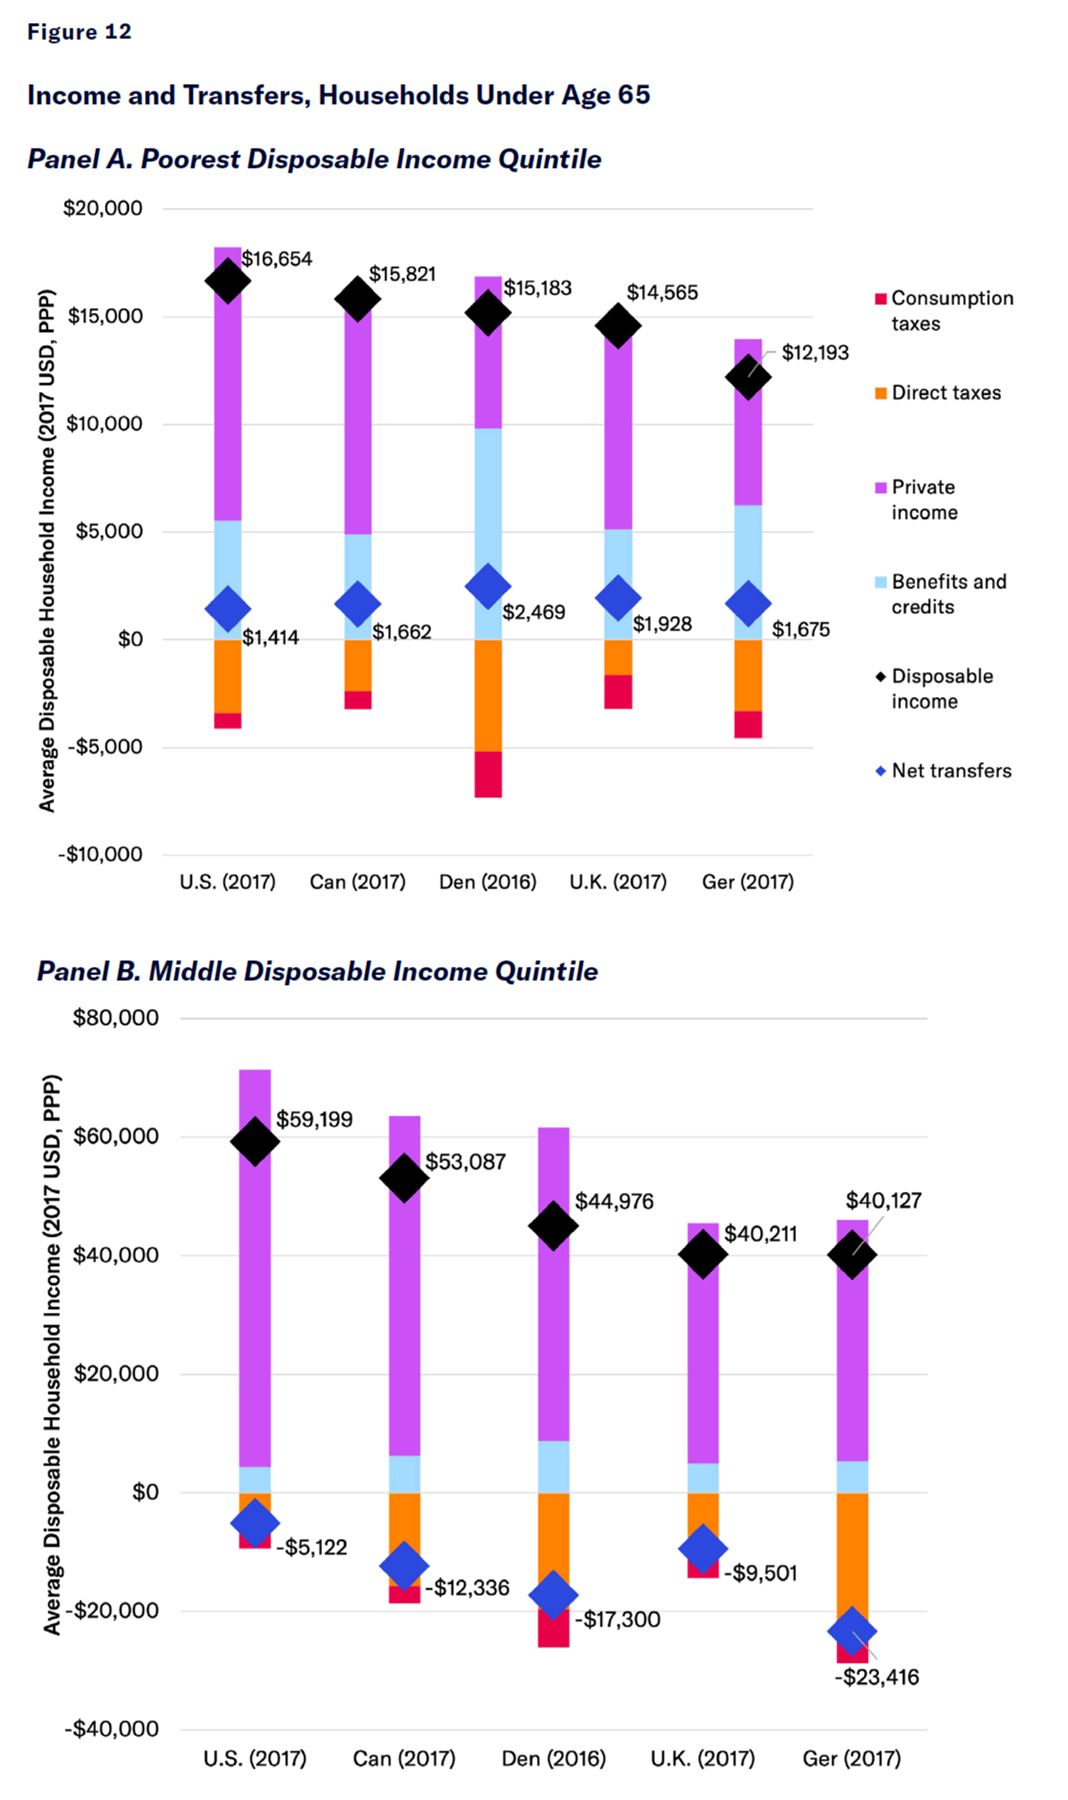
Powerful trade unions, industrial policy, minimum-wage laws, child-care subsidies, and education spending have done little to boost bottom-end incomes in Europe. Average private incomes of the poorest working-age quintile are more than twice as high in the U.S. ($14,608) as in Denmark ($7,062). High spending on public benefits has failed to raise disposable incomes above those in the U.S. but has instead served to reduce working hours and inflate taxes on the poor.
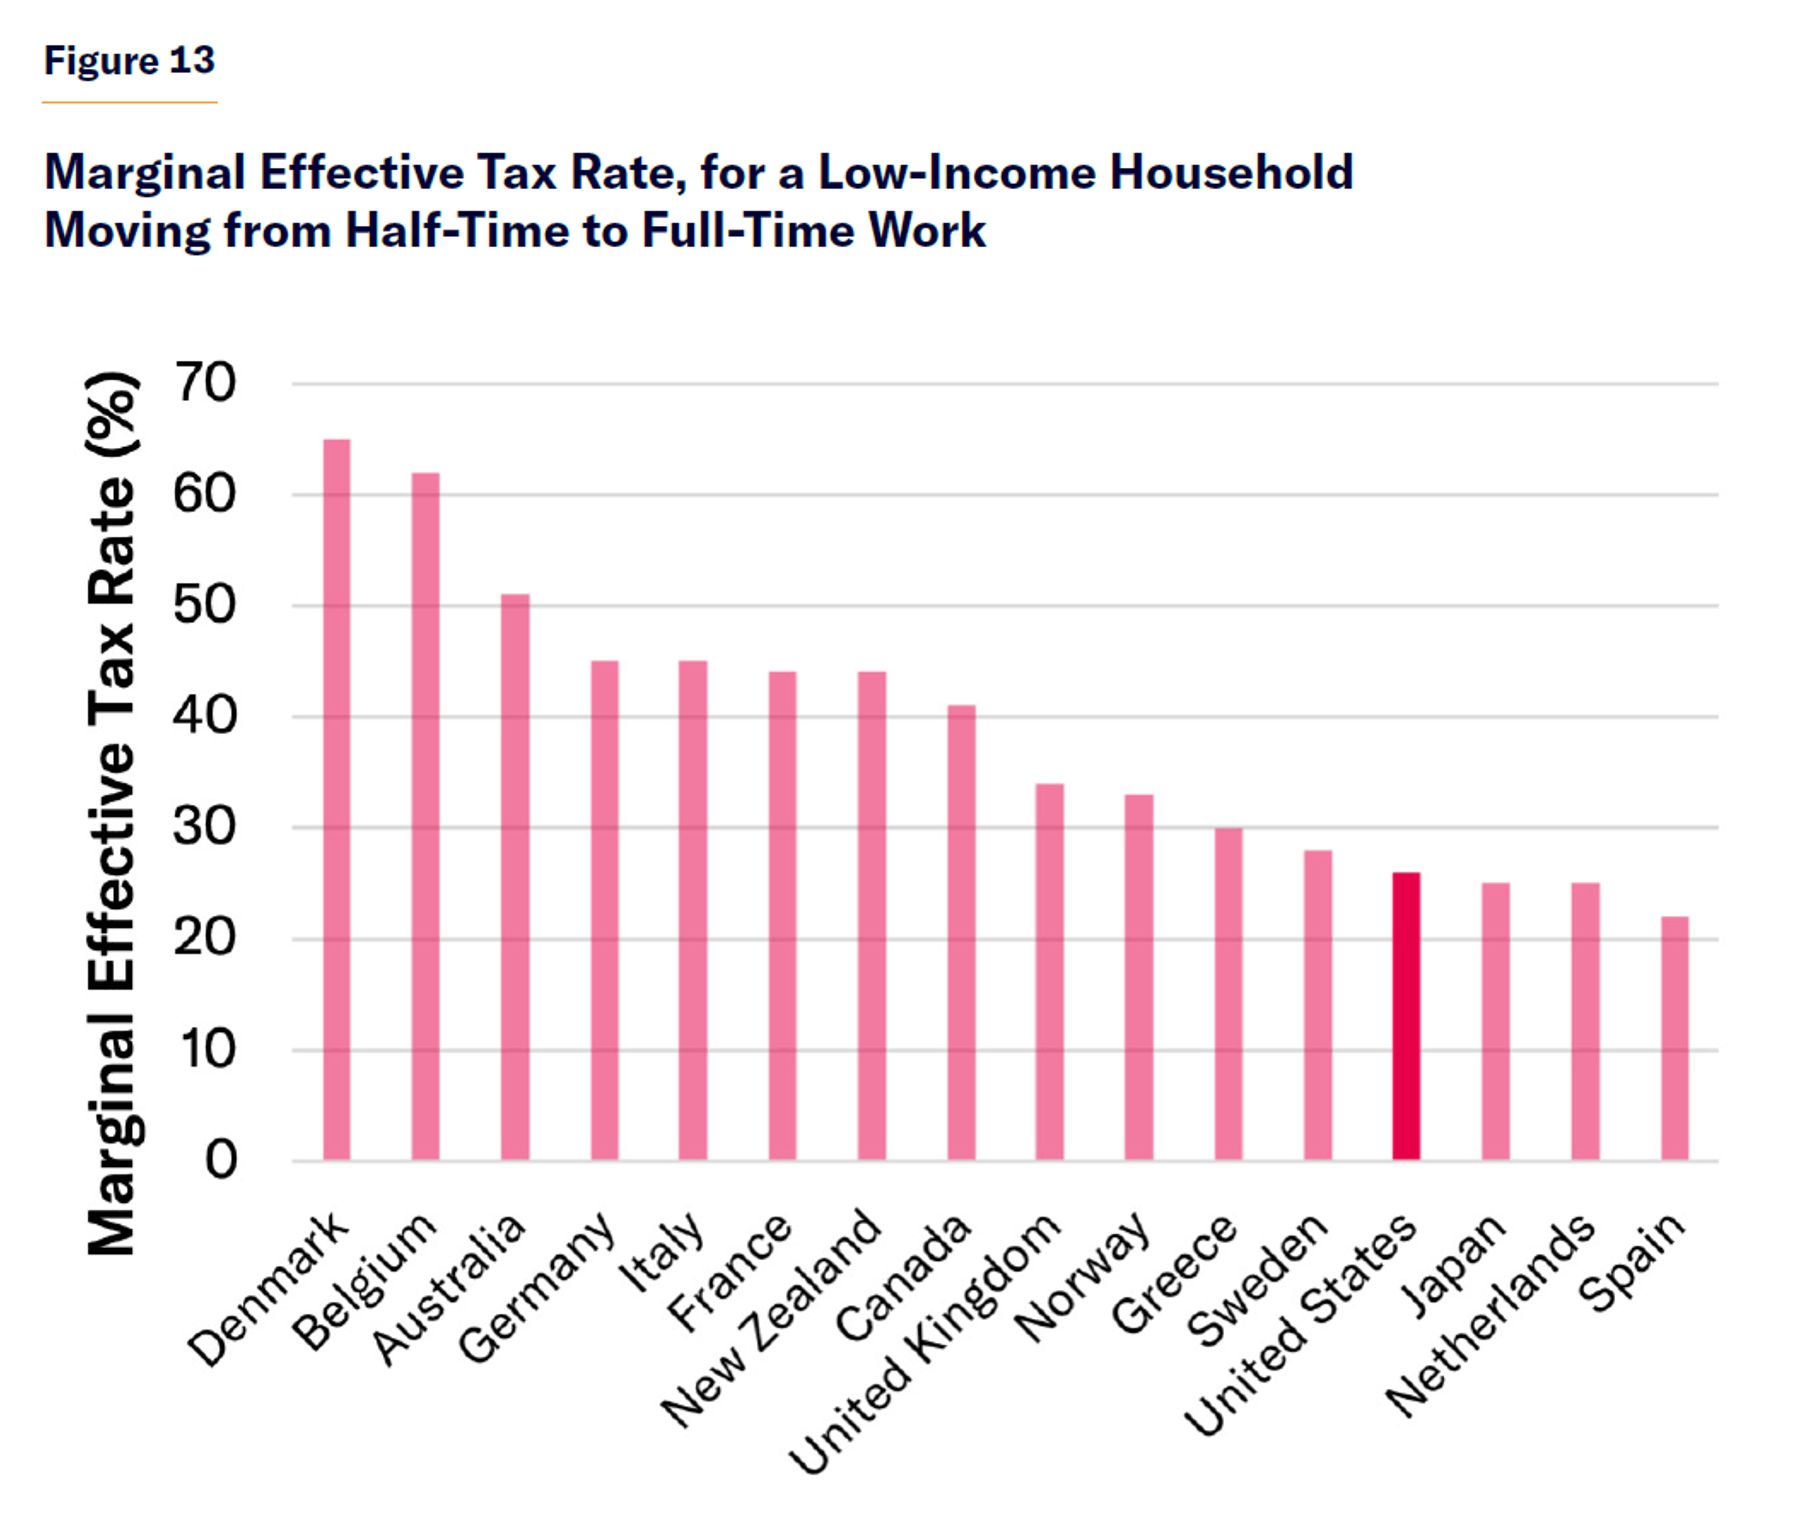
Low-income Scandinavians face substantial tax increases and losses of valuable entitlements if they move from part-time to full-time work (Figure 13). In many cases, they will actually be worse-off if they work more—even before considering the unpleasantness of menial jobs, loss of leisure time, and employment-related costs, such as commuting.[40] In the U.S., because tax rates on low-income households are lower and benefits are reserved for those who are unable to work (by time limits or categorical restrictions on eligibility for entitlements), the combined penalty of rising taxes and diminishing benefits associated with increasing work is smaller.[41]
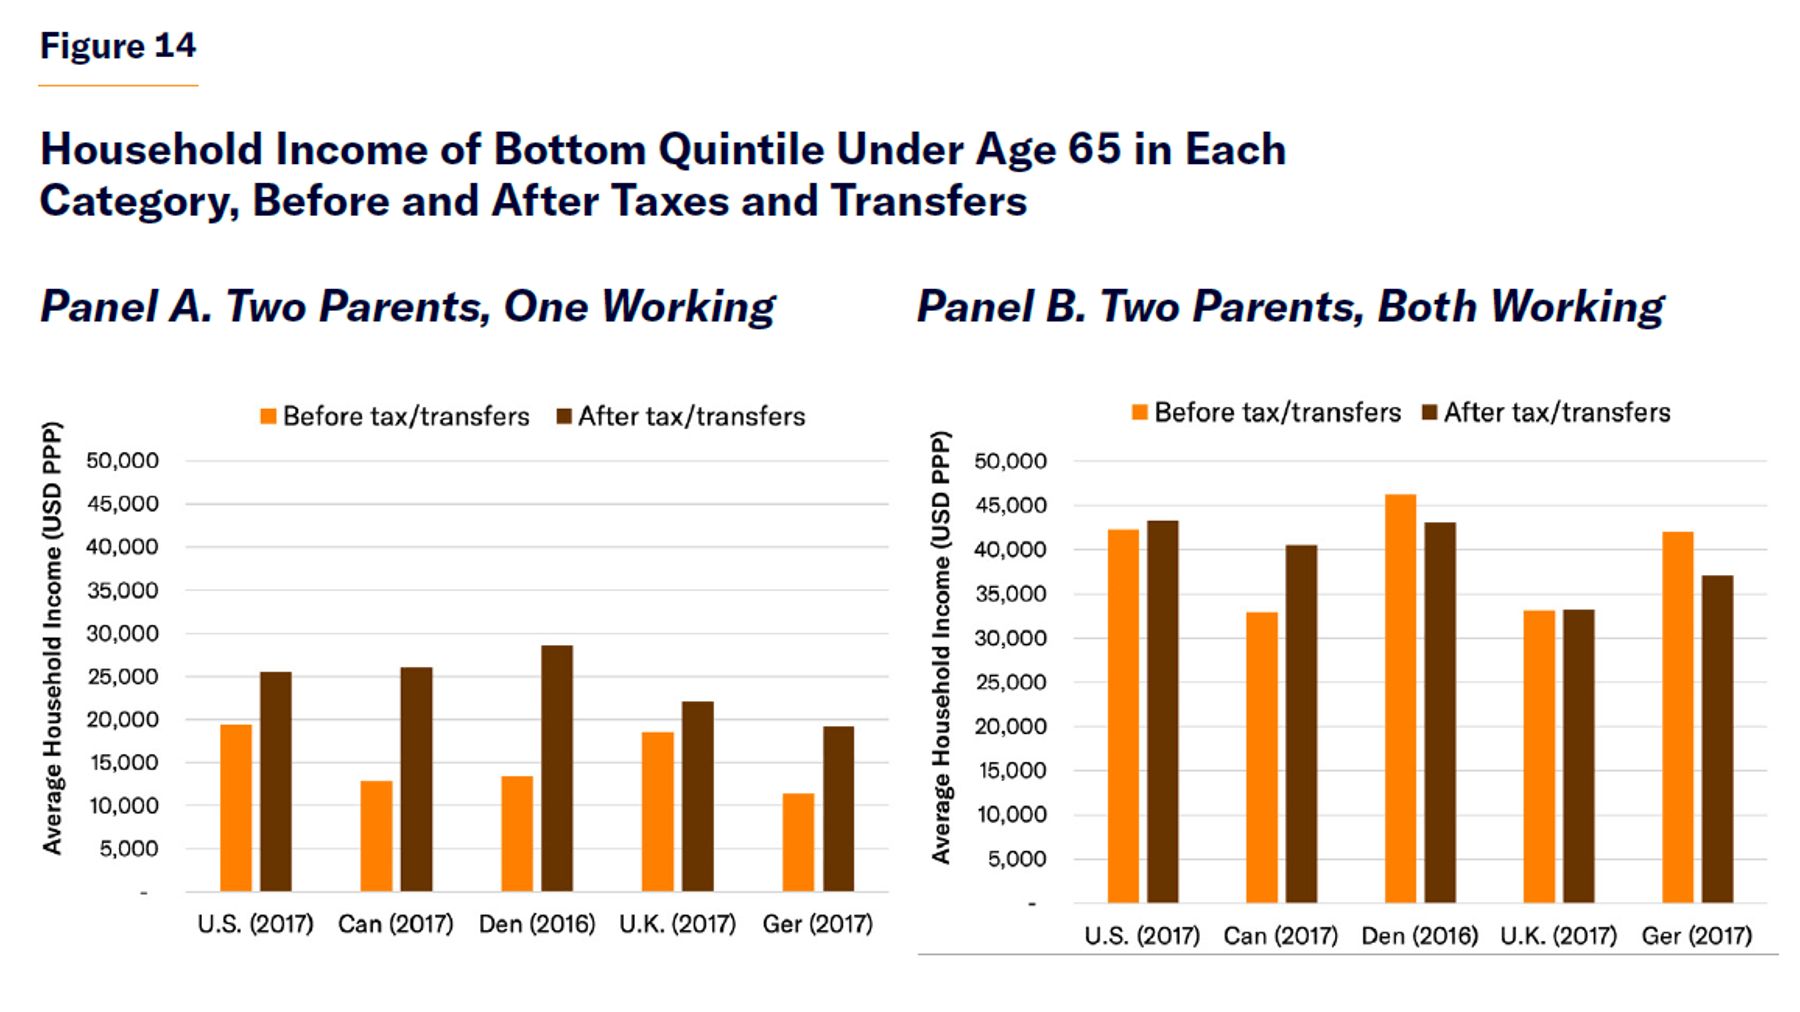
In Europe, low-income families with two working parents are typically net taxpayers (Figure 14). Welfare states across the developed world have, at varying degrees of efficiency and cost, been able to aid those who have become unable to work. But public policy is unable to substantially redistribute funds to all full-time low-income workers because all nonworkers have much lower incomes than full-time low-wage workers and because the whole category of full-time workers is already outnumbered by the large number of people recognized as nonworkers inherently entitled to substantial assistance.
The idea that expansive European welfare states are helping the working poor has very little basis in fact. They are mostly redistributing from the working poor to nonworkers of all social classes.[42]
Supporting Children
The magnitude of special provisions that countries provide to reduce families’ tax bills is dwarfed by differences in the general level of taxes to which those families are subject.
Children are the largest group of nonworkers in most countries. All nations adjust benefits and taxes to accommodate the special burdens borne by parents, who are responsible for providing for children. As most working families are net taxpayers, their cash benefits are largely equivalent to tax breaks, only partially offsetting net taxes that they owe.
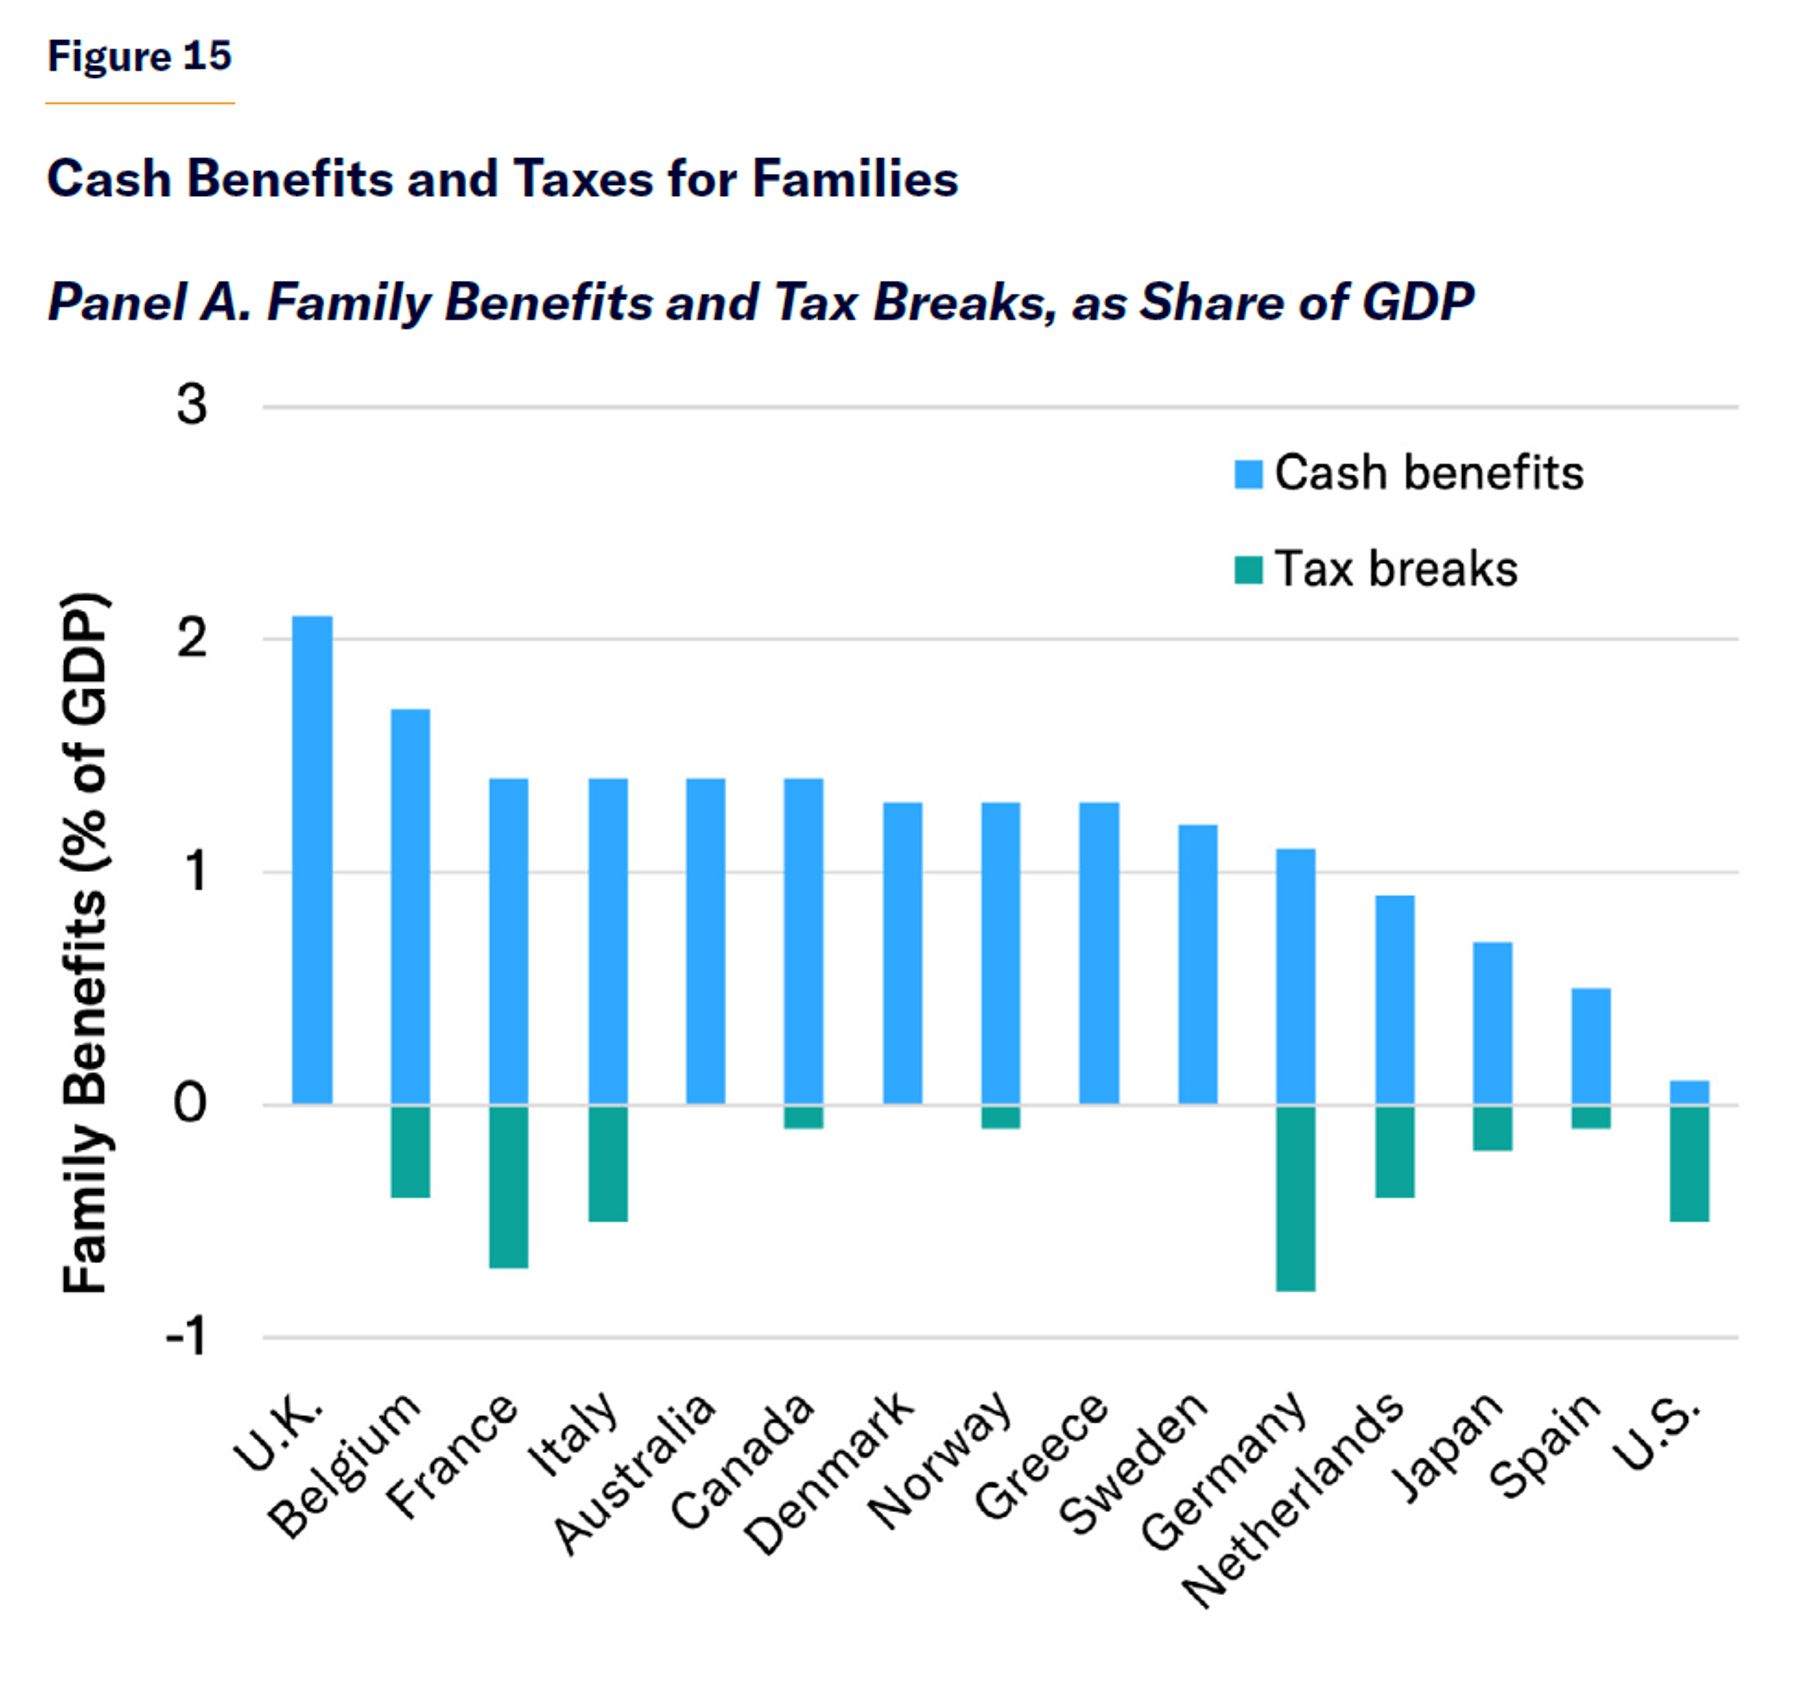
Special family benefits and tax breaks in the U.S. are smaller as a share of GDP than in most other developed countries. But the net tax burden on most American middle-income families is the lowest in the developed world (Figure 15). The fact that the overall tax burden on middle-income families is lower in the U.S. is more important than the value of special provisions for families that other countries make in order to mitigate their generally higher tax burdens.
Although the non-work of children is not controversial in the developed world, whether taxpayers should support non-working parents in raising children is controversial. The issue arises most pointedly in the case of single parents. Early in the 20th century, these were mostly widowed mothers, and states created benefits for them with broad public support. But single parenthood is now typically the result of divorce or having children out of wedlock—cases that taxpayers feel less obliged to assist. The U.S. provides various benefits to low-income single parents, but the 1996 welfare reform legislation established work requirements, time limits, job training assistance, and other safeguards to ensure that benefits do not merely serve to reduce private earnings over the long run.[43]
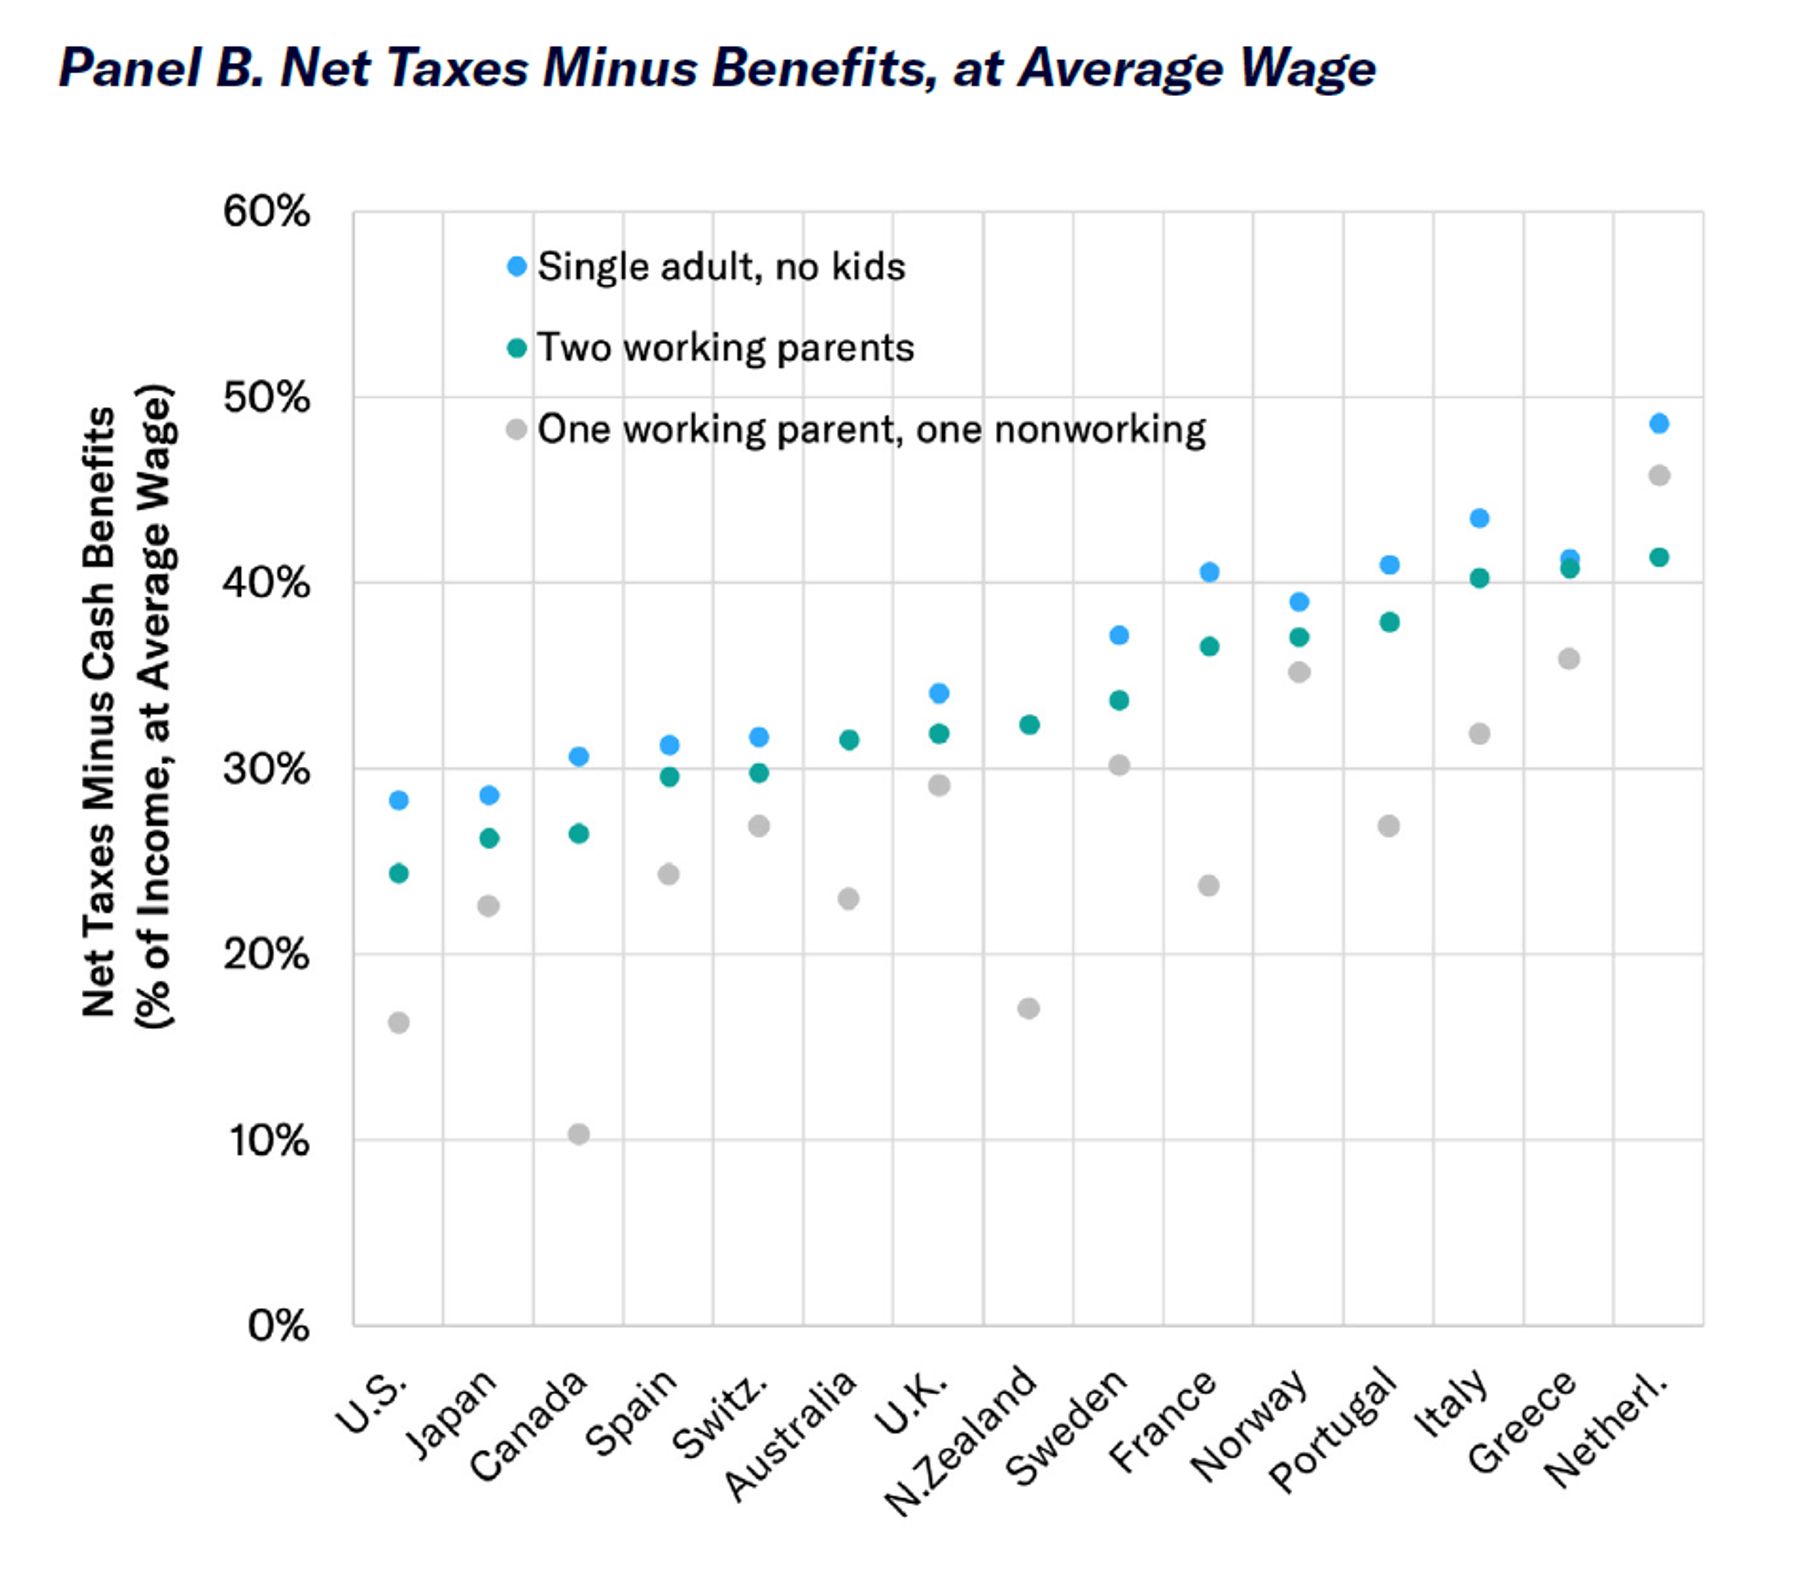
The largest net benefits to single parents who work full-time at the minimum wage are provided by Canada, Australia, and the United States. For single parents earning half the average wage (i.e., slightly better-off low-earners), net benefits remain roughly the same in Canada but are much reduced in most other developed countries. In Scandinavia, single parents working full-time but earning only half the average wage already face a substantial net tax burden (Figure 16).
The U.S. has traditionally supported child care through tax credits, so that the burden of taxes does not deter parents from engaging in work that is of greater value than the cost of child care.[44] As a result, Americans tend to use formal child care when they are willing to pay for it: 88% of American kids under the age of five are in regular day care where both parents work full-time; 27% where only one parent does.[45] Formal child care in the U.S. is a highly competitive industry, employing many low-income workers, with profit margins typically less than 1%. But the most common form of child-care provision in the U.S. is a woman looking after two kids on an informal (unpaid and untaxed) basis.[46]
Various European countries provide legal entitlements to child care for preschoolers, though not necessarily for free or full-time.[47] Some nations reserve subsidies for the poor, single parents, or larger families, and make child-care benefits contingent on parental work requirements. In the Nordic countries, taxpayers heavily subsidize institutional child care for all parents, regardless of their economic needs or willingness to work.[48]
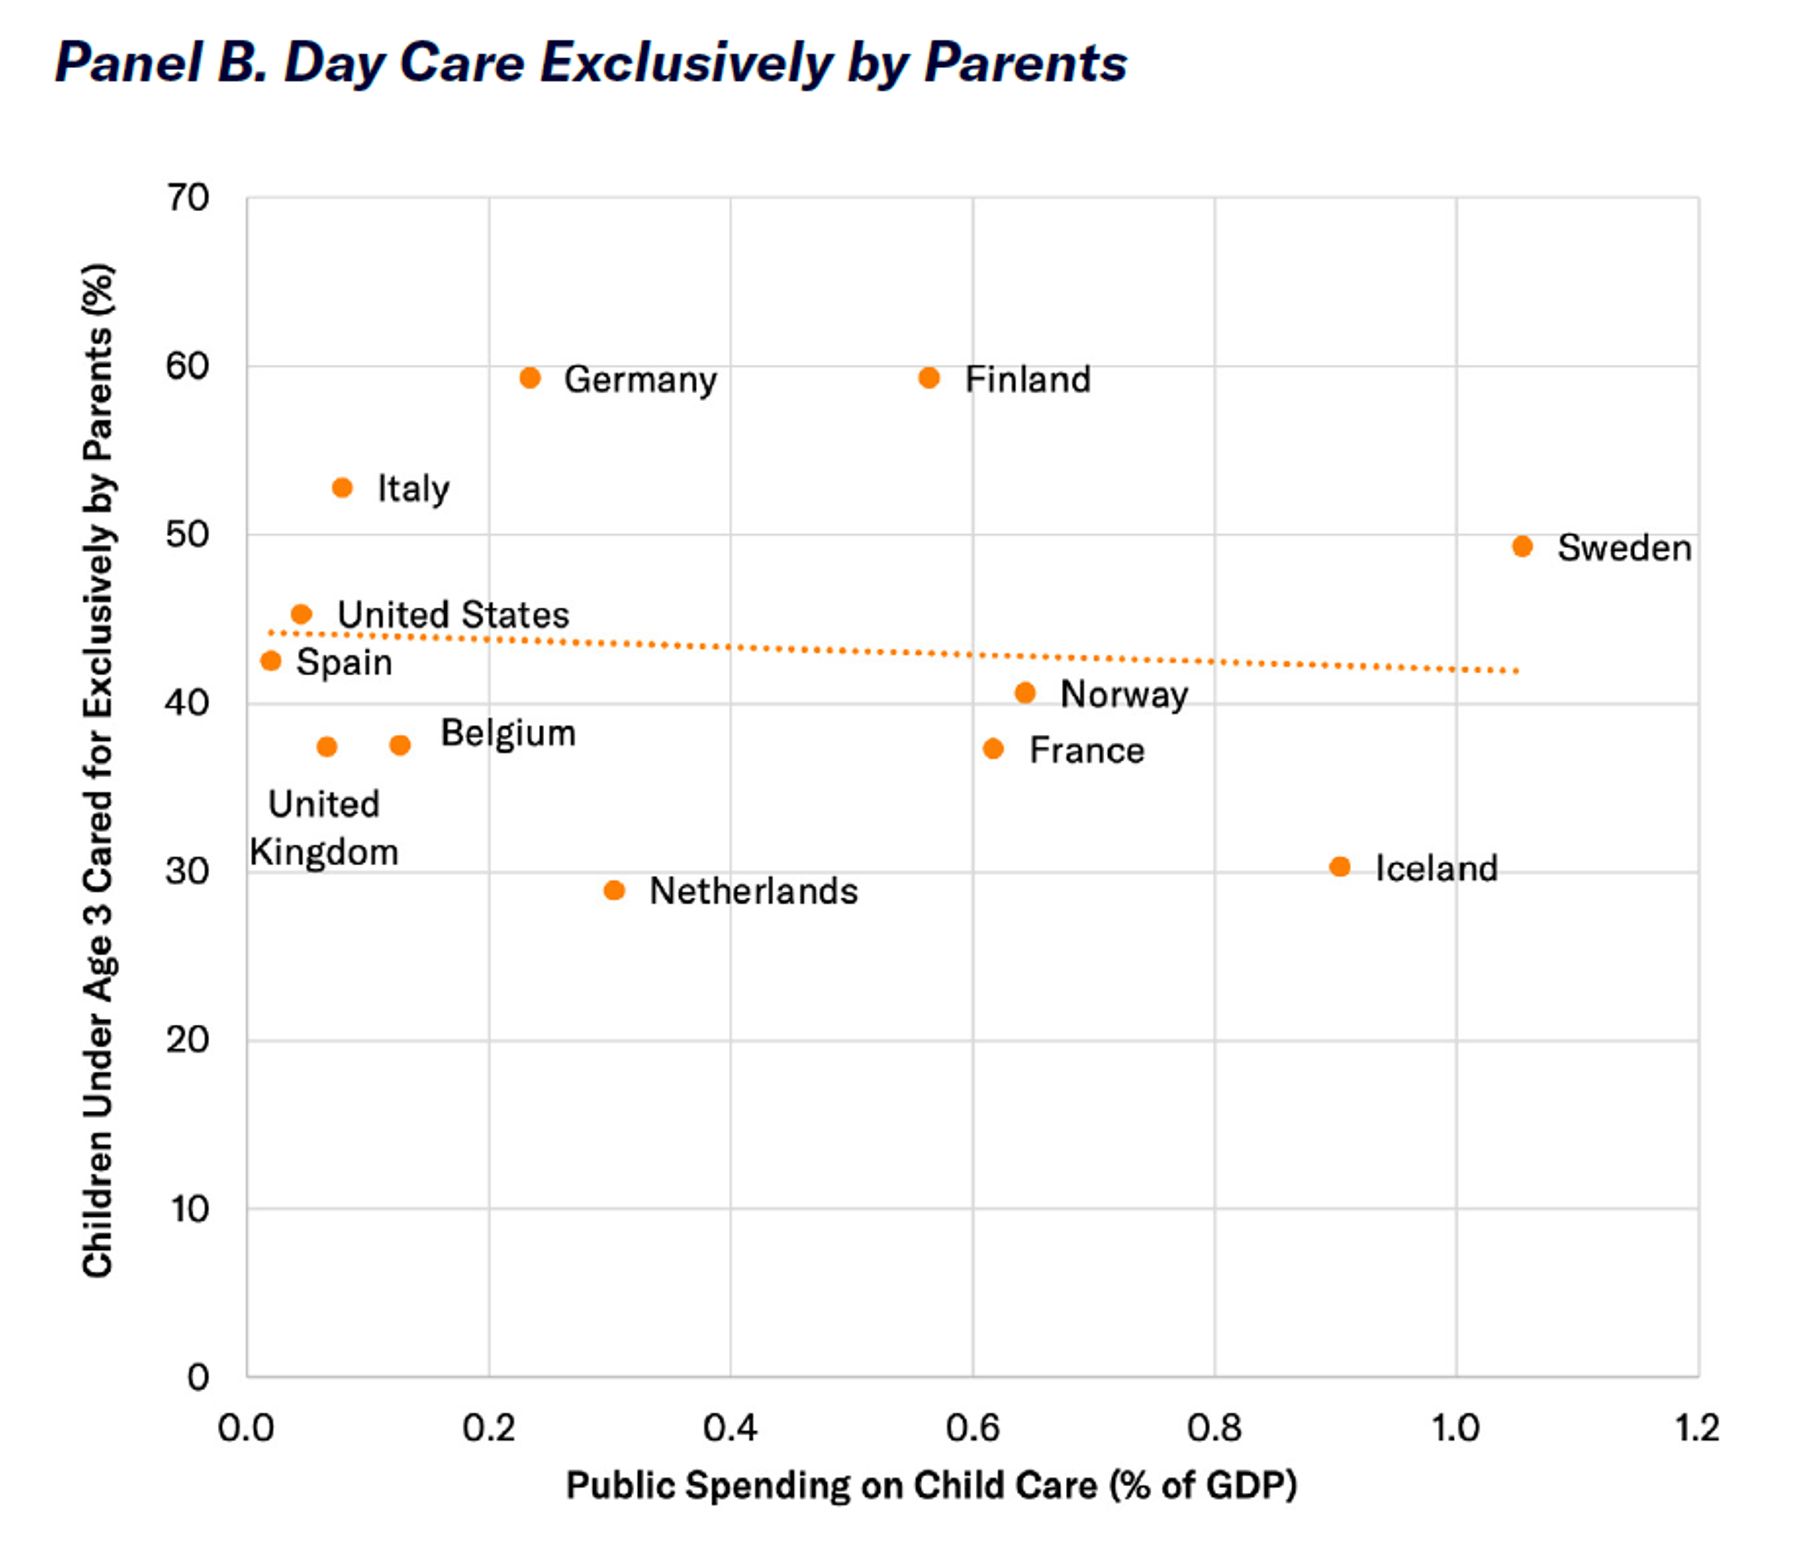
As a result, government spending on child care amounted to 1.05% of GDP in Sweden in 2017—with most of the expenditure going to the middle class. Outside Scandinavia, the cost of public child-care spending was only a small fraction of that and amounted to only 0.04% of GDP in the U.S.[49]
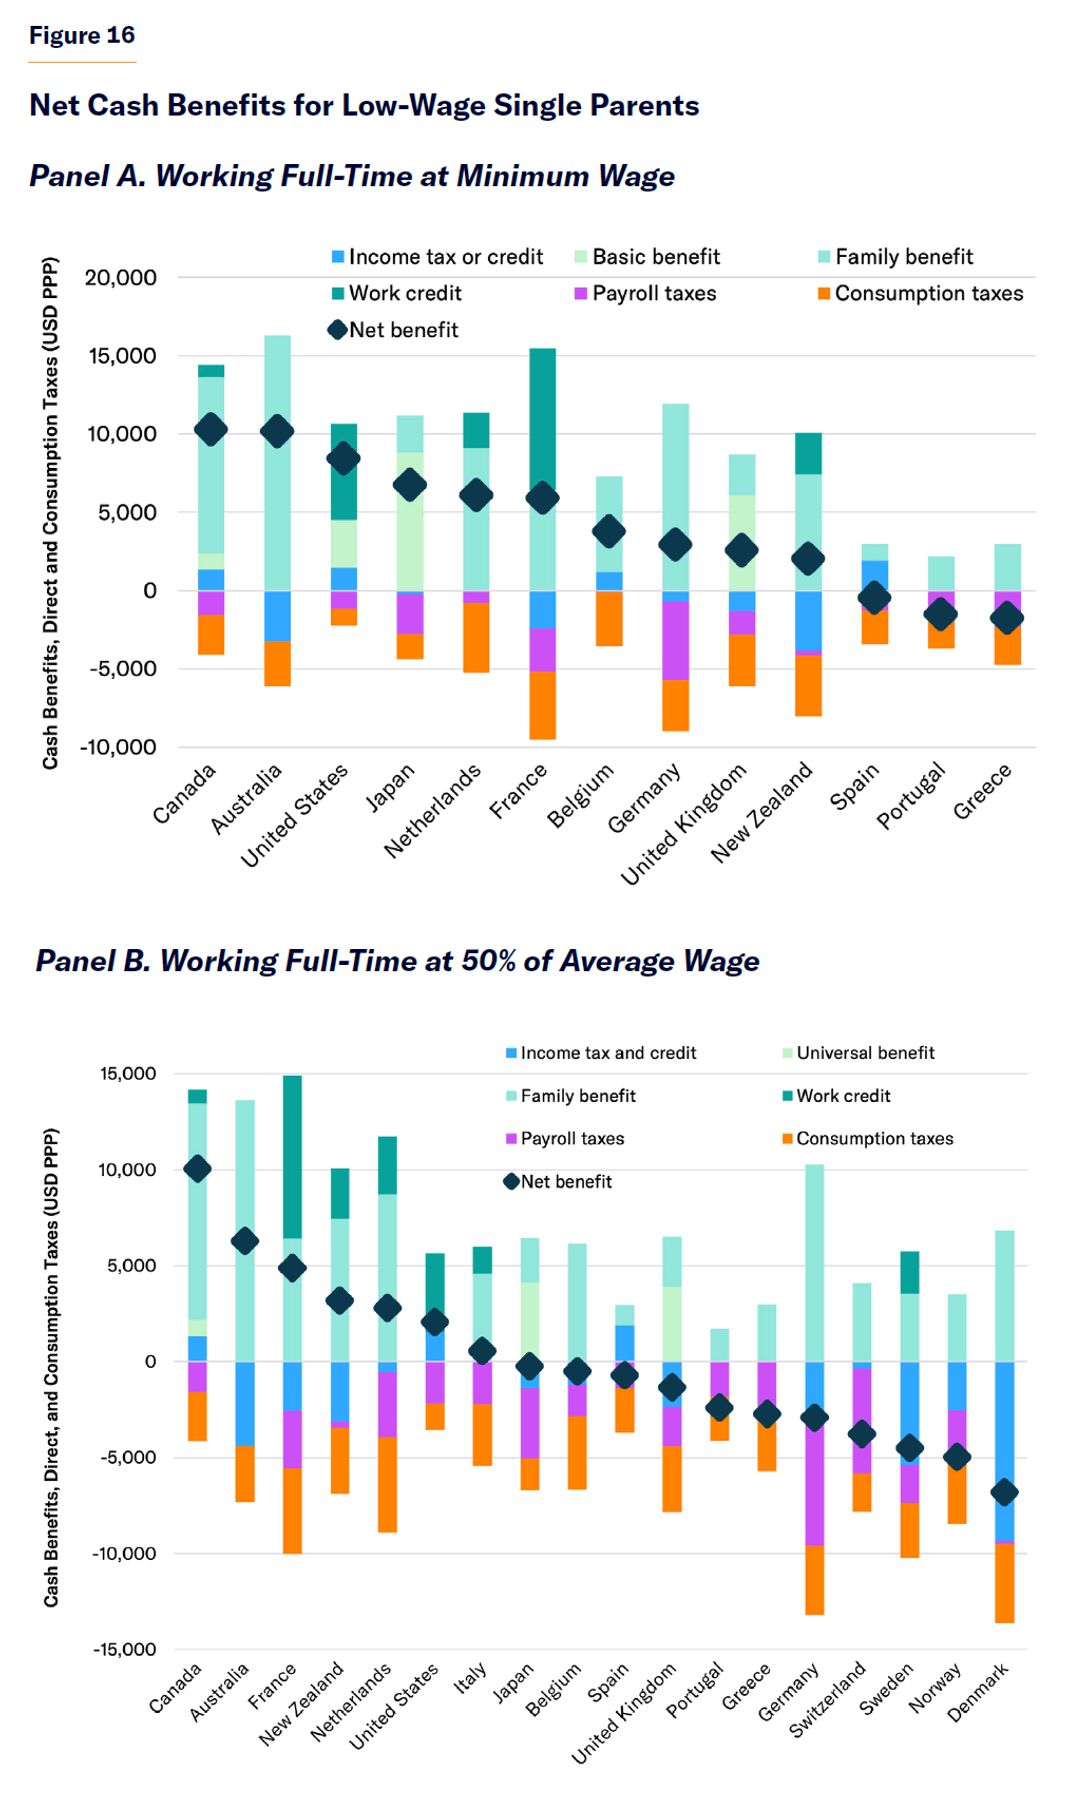
Despite the much higher level of public spending on child care in Europe, the share of kids under the age of two in the U.S. receiving some form of non-parental day care (55%) is slightly higher than that in the E.U. (52%).[50] Developed nations with higher levels of public spending on institutional child care do not appear to have significantly lower rates of parental care for children; but their rates of informal child-care provision (by parents, friends, or relatives) are much lower (Figure 17). The main effect of the most expansive child-care entitlements appears to be that it displaces close personal attention for oversight of children in large groups by strangers at a higher cost, with adverse effects on child well-being.[51]
Meeting Material Needs
The poorest Americans have levels of income and consumption substantially higher than the poorest Europeans. This remains true after accounting for in-kind benefits provided by the government or employers.
The Organisation for Economic Co-operation and Development (OECD) defines poverty as an income less than 50% of a country’s median.[52] Many studies of welfare states have embraced this definition of “relative poverty,” as though inequality and poverty were synonymous.[53] Yet preventing entrepreneurs from accumulating capital tends to diminish the capacity for a nation to elevate the productivity and incomes of its working poor and inhibits the creation of wealth that might be used to support those who are unable to work.
As China moved away from Marxist economics to permit the development of wealth and inequality, the nation progressed from near-starvation to become an economic superpower. From 1981 to 2005, the share of Chinese living on less than $1.25 (USD, PPP) per day declined from 85% to 15%, yet “relative poverty” as measured by OECD roughly doubled.[54] As writer Tim Worstall notes, “a measure of poverty that not just ignores, but actually gets the sign wrong on, the largest reduction in poverty in the history of our species is of limited value.”[55]
Economist Gordon Tullock has suggested that measuring poverty on a relative basis is like assuming that “if everybody has a toothache, it doesn’t hurt.”[56] According to OECD’s relative definition, the poverty rate is higher in the U.S. than in Mexico.[57]
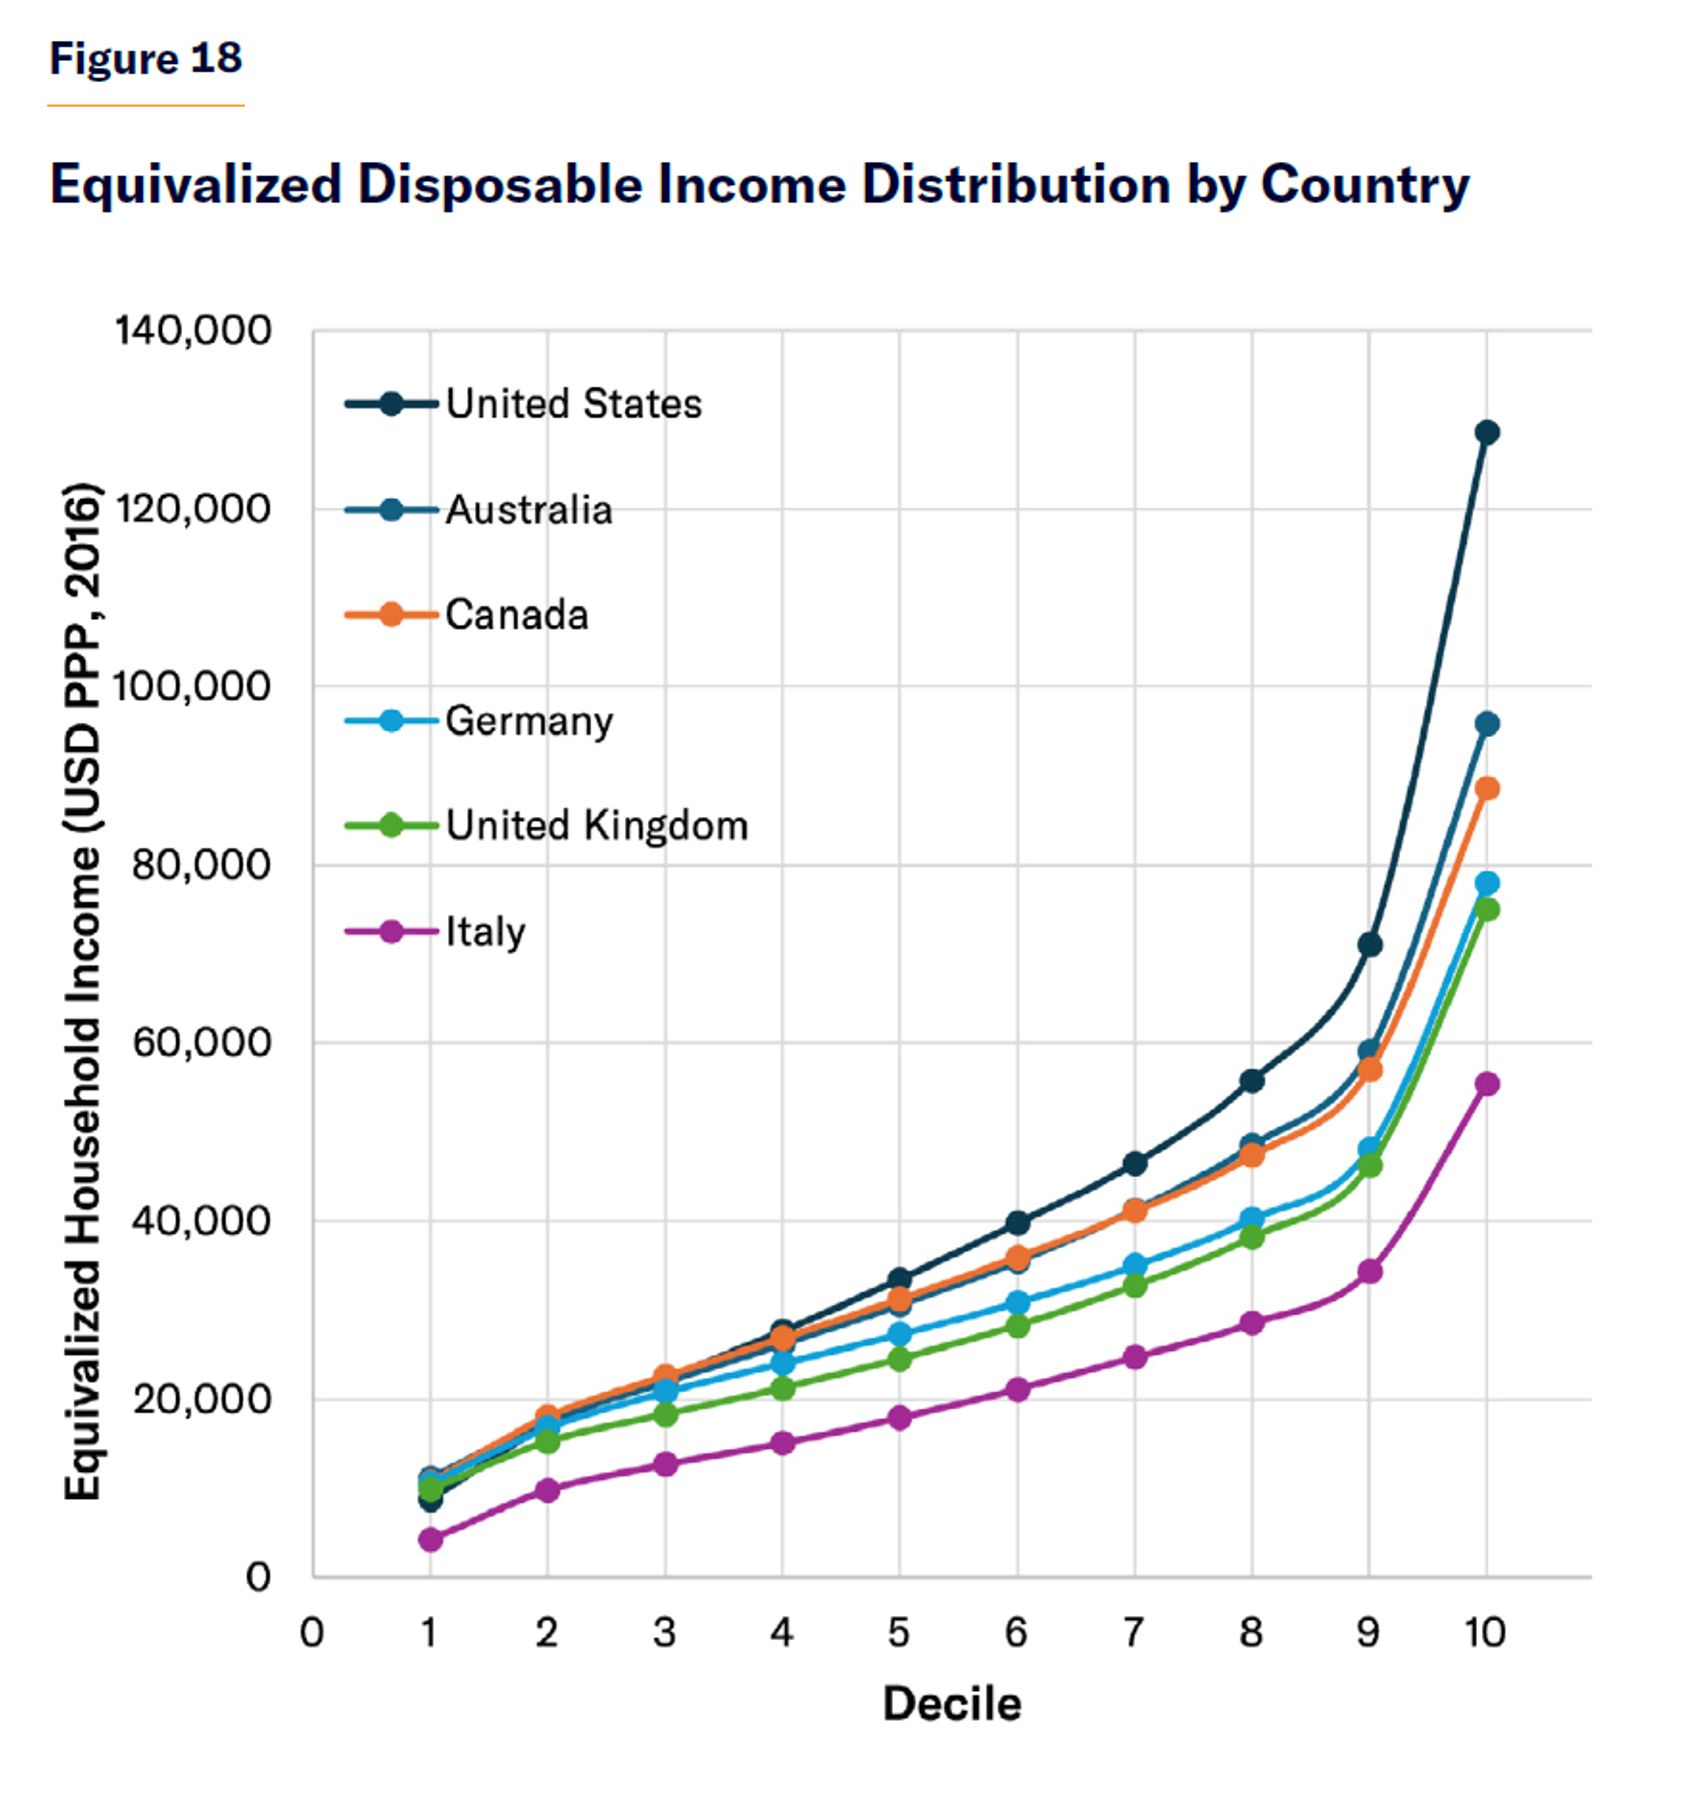
The U.S. does not have greater inequality than other developed nations because it has more poor people but because its nonpoor earn a lot more (Figure 18). In 2017, after adjusting for differences in the cost of living, only 19% of Americans lived in households with disposable incomes less than $20,000, compared with 22% in Germany, 27% in the U.K., and 53% in Italy. By contrast, while 32% of Americans enjoyed disposable incomes greater than $50,000, only 12% of Germans, 12% of Brits, and 4% of Italians did so.[58]
Consumption data give a more comprehensive picture of overall material well-being than annual income data, as they incorporate the broader permanent income effect of savings, borrowing, and informal assistance available. For instance, a college student from a wealthy family or someone starting up a new business will often have low income but not low consumption. Consumption data are also less subject to underreporting than income data, which are often tied to taxes or eligibility for means-tested entitlements. In the U.S., only 54% of TANF benefits, 57% of SNAP, and 63% of SSI were reported in surveys of income, and expenditures by the poorest decile exceed their reported incomes by about a third.[59]
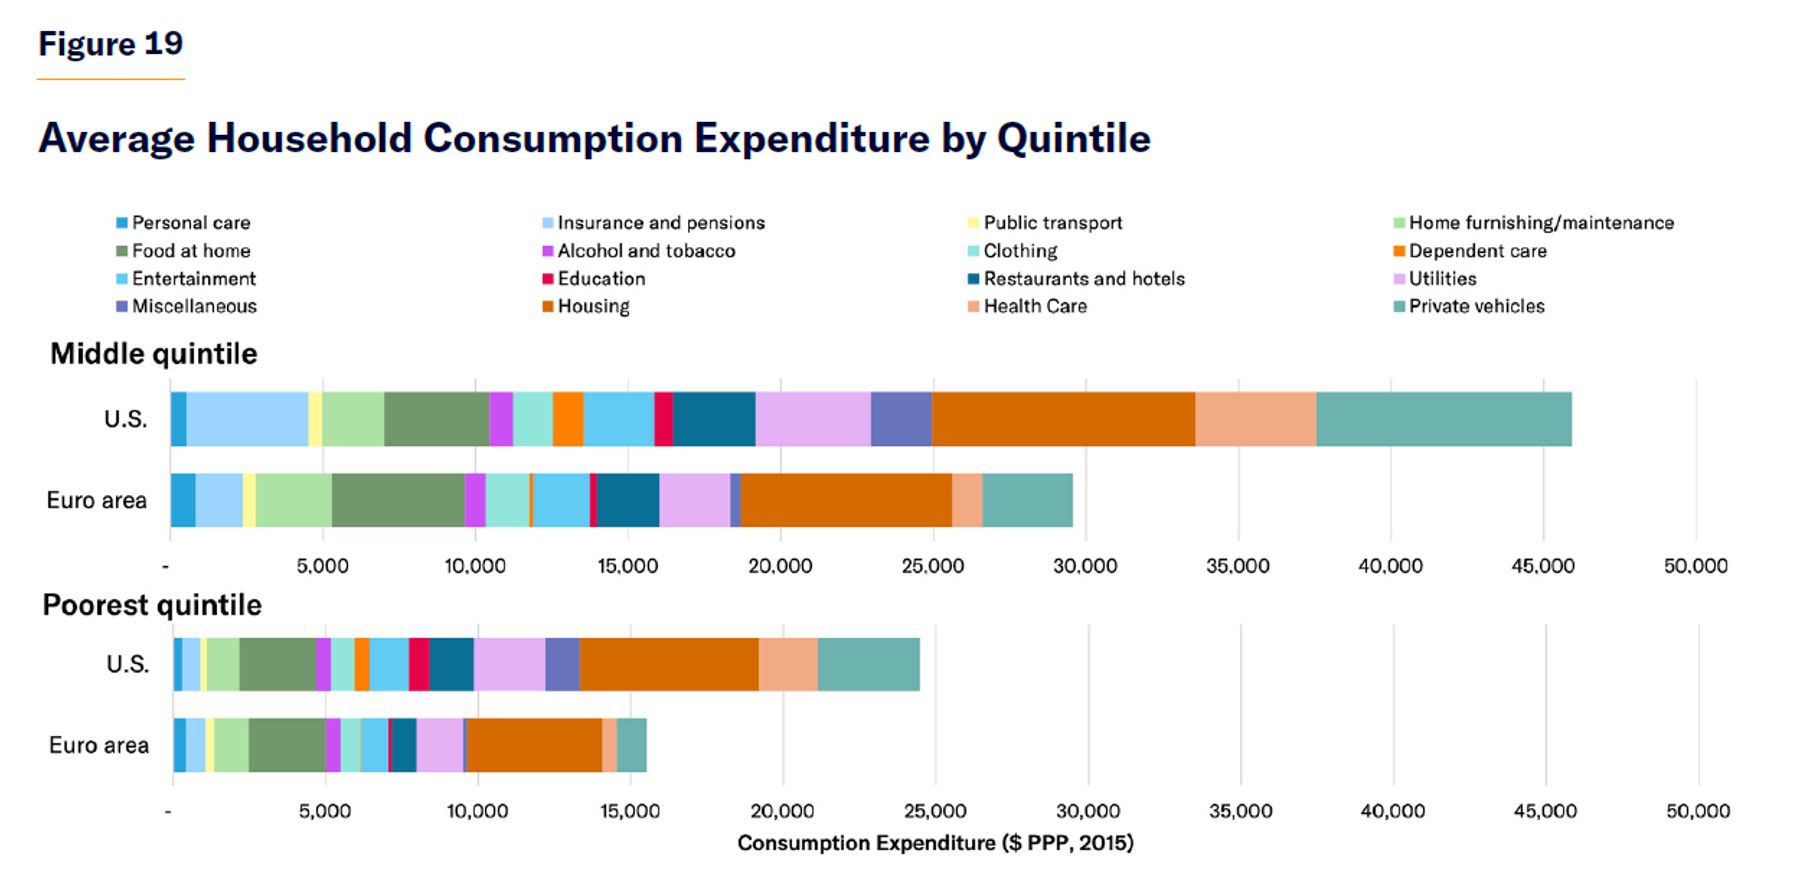
In 2015, the poorest quintile of households consumed $24,471 in the U.S., but only $15,506 in the Euro area, after adjusting for differences in the cost of living (Figure 19). The poorest Americans and Europeans consumed similar amounts of basic goods, such as food at home, alcohol, clothing, personal-care products, home maintenance, and public transport. But the poorest Americans tended to consume substantially more goods whose consumption was less satiable or that had a substantial qualitative dimension, such as private vehicles, health care, housing, utilities, education, dependent care, restaurants/hotels, and other entertainment.
Critics suggest that surveys of income or consumption fail to capture the value of expansive in-kind benefits, the value of which is not attributable to particular households. Of course, it is also a mistake to assume that the poorest members of society are made better-off simply because the state is spending money. Therefore, it makes sense to assess what specifically is achieved by the most substantial in-kind expenditures.
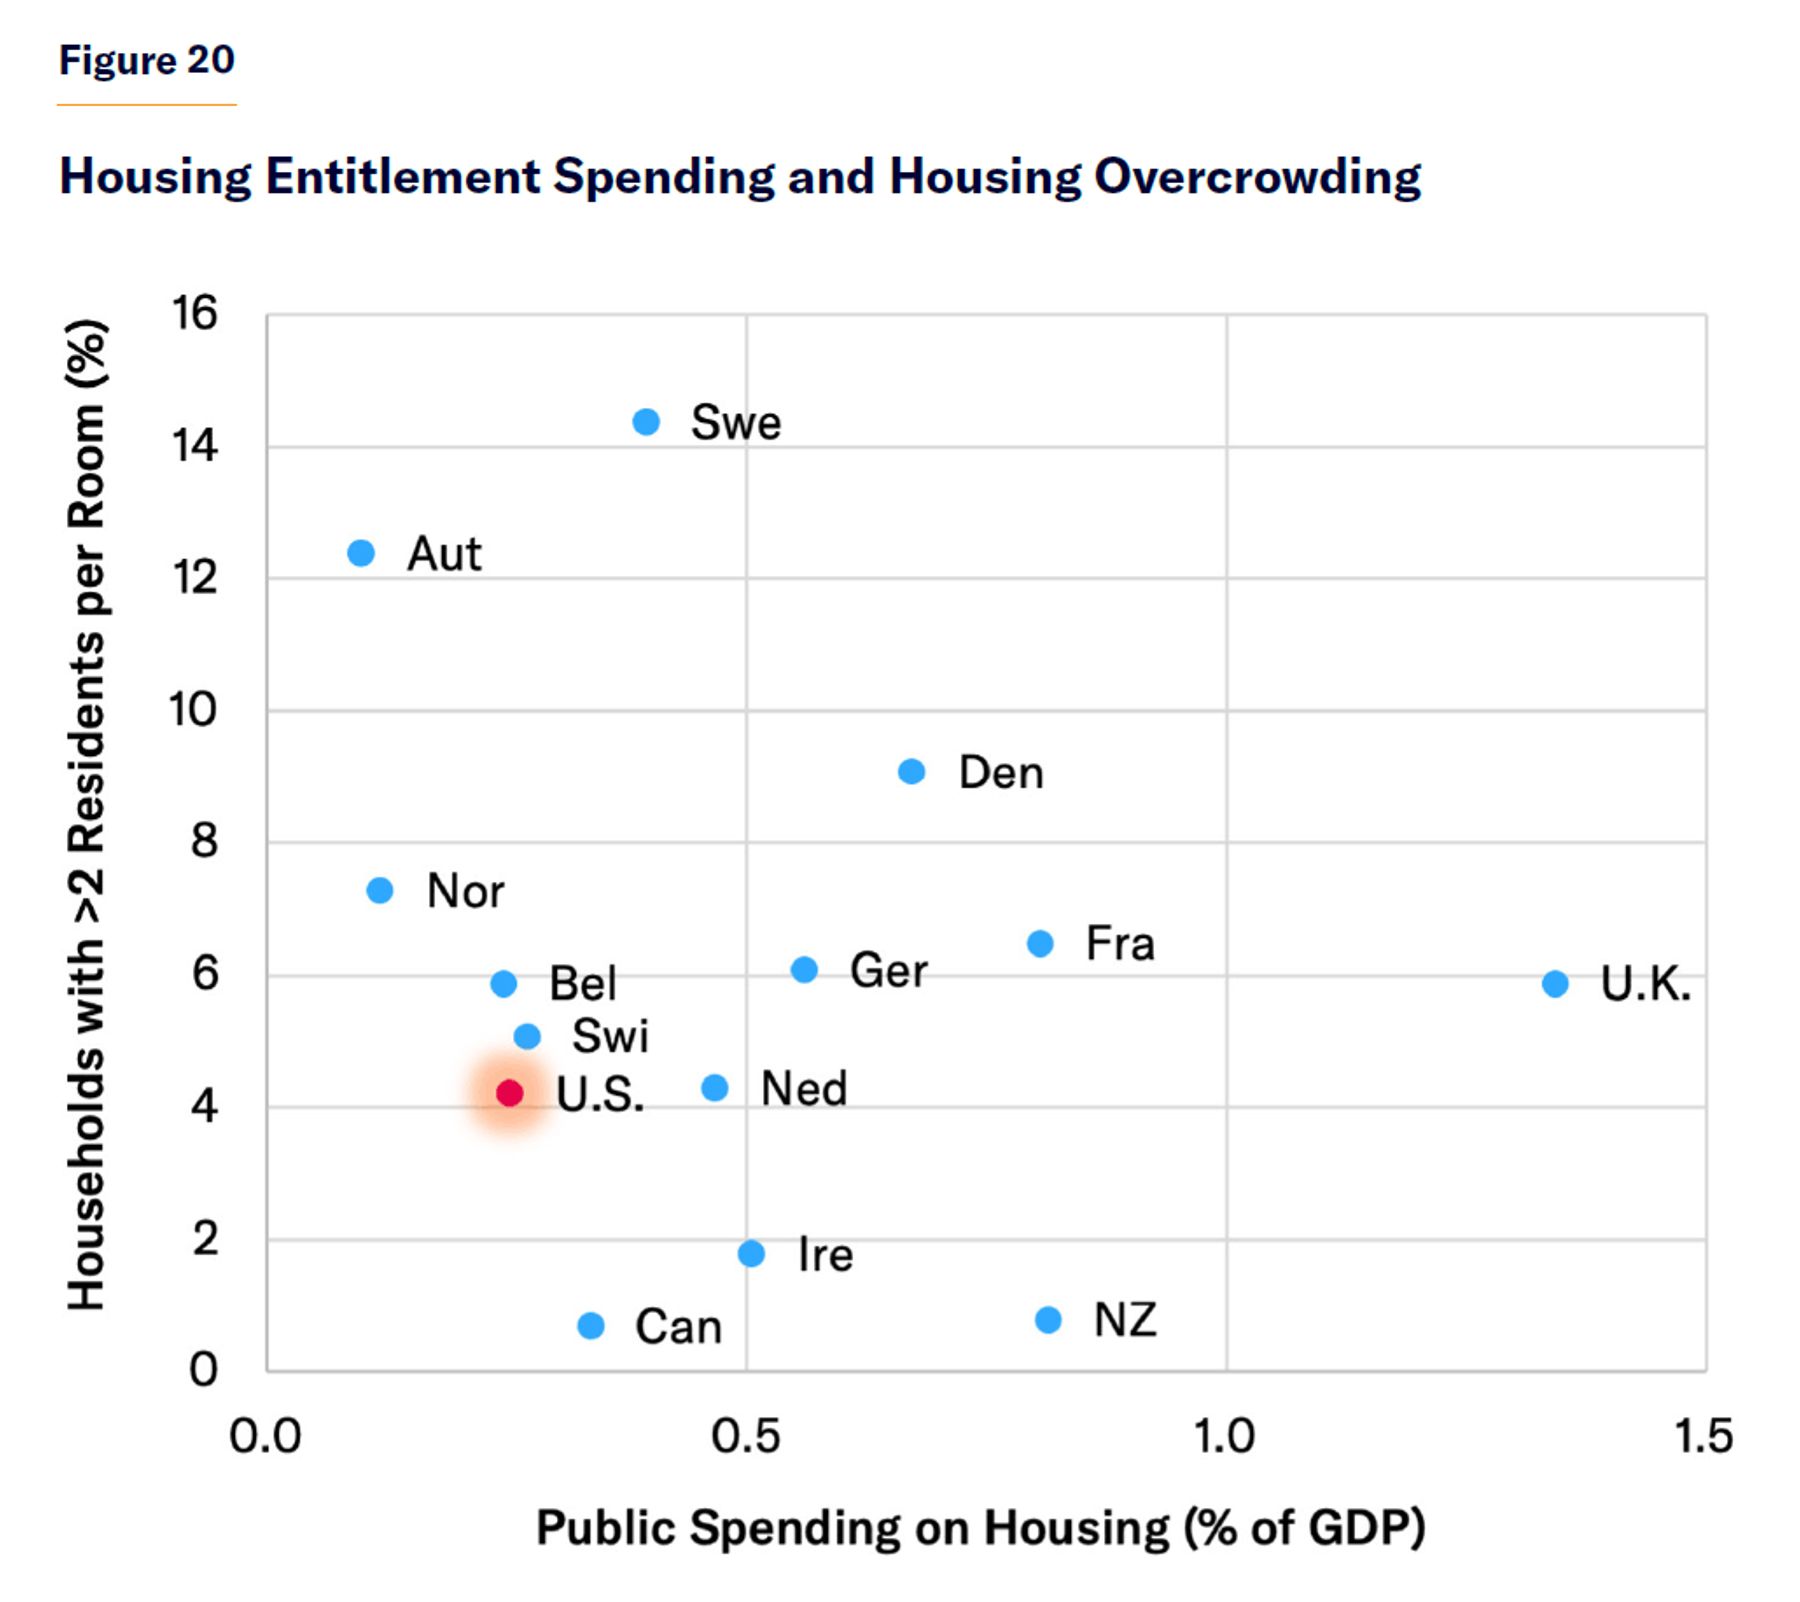
Let’s consider housing. The U.S. government spends only 0.25% of GDP on housing benefits, much less than the U.K. (1.3%), France (0.8%), or Denmark (0.7%). Yet those nations suffer more overcrowded housing. While only 4% of Americans live in households with more than two residents per room, 6% in the U.K., 7% in France, and 9% in Denmark do (Figure 20). Americans live in houses that are, on average, twice as large as those of Europeans, but the average resident of France, Germany, or the U.K. has less living space than the poorest quintile of Americans.[60] The share of the population that is homeless is also substantially lower in the U.S. than in France, Germany, or the U.K.[61]
Whereas only 4% of the U.S. housing stock is publicly owned, 21% of that in Denmark, 14% in France, and 16% in the U.K. is.[62] Public housing projects typically still charge residents rent; but the overall affordability of housing for the poor in those nations is still largely determined by factors influencing the demand and supply of privately owned buildings. Expenditures on public housing might be high, but much of this might fail to increase the overall supply and might be distributed to residents who are not necessarily poor. When the housing supply is largely fixed, subsidies to make housing affordable for some often serve merely to push up prices, which makes it unaffordable for others.[63] Furthermore, the nature of the subsidy might lead people to live in lower-quality accommodation than they would choose if they had full control of funds. A great deal of money can be spent merely to subsidize poorer citizens living in more expensive locations—an expenditure that confers no net social benefit if the overall housing supply is fixed.
Health-Care Systems
As Americans’ average disposable income exceeds that of almost every other nation, so does their consumption of most goods and services. Health care is no exception.
In 2019, 89% of Americans received either publicly subsidized or employer-sponsored health insurance in addition to their cash income.[64]
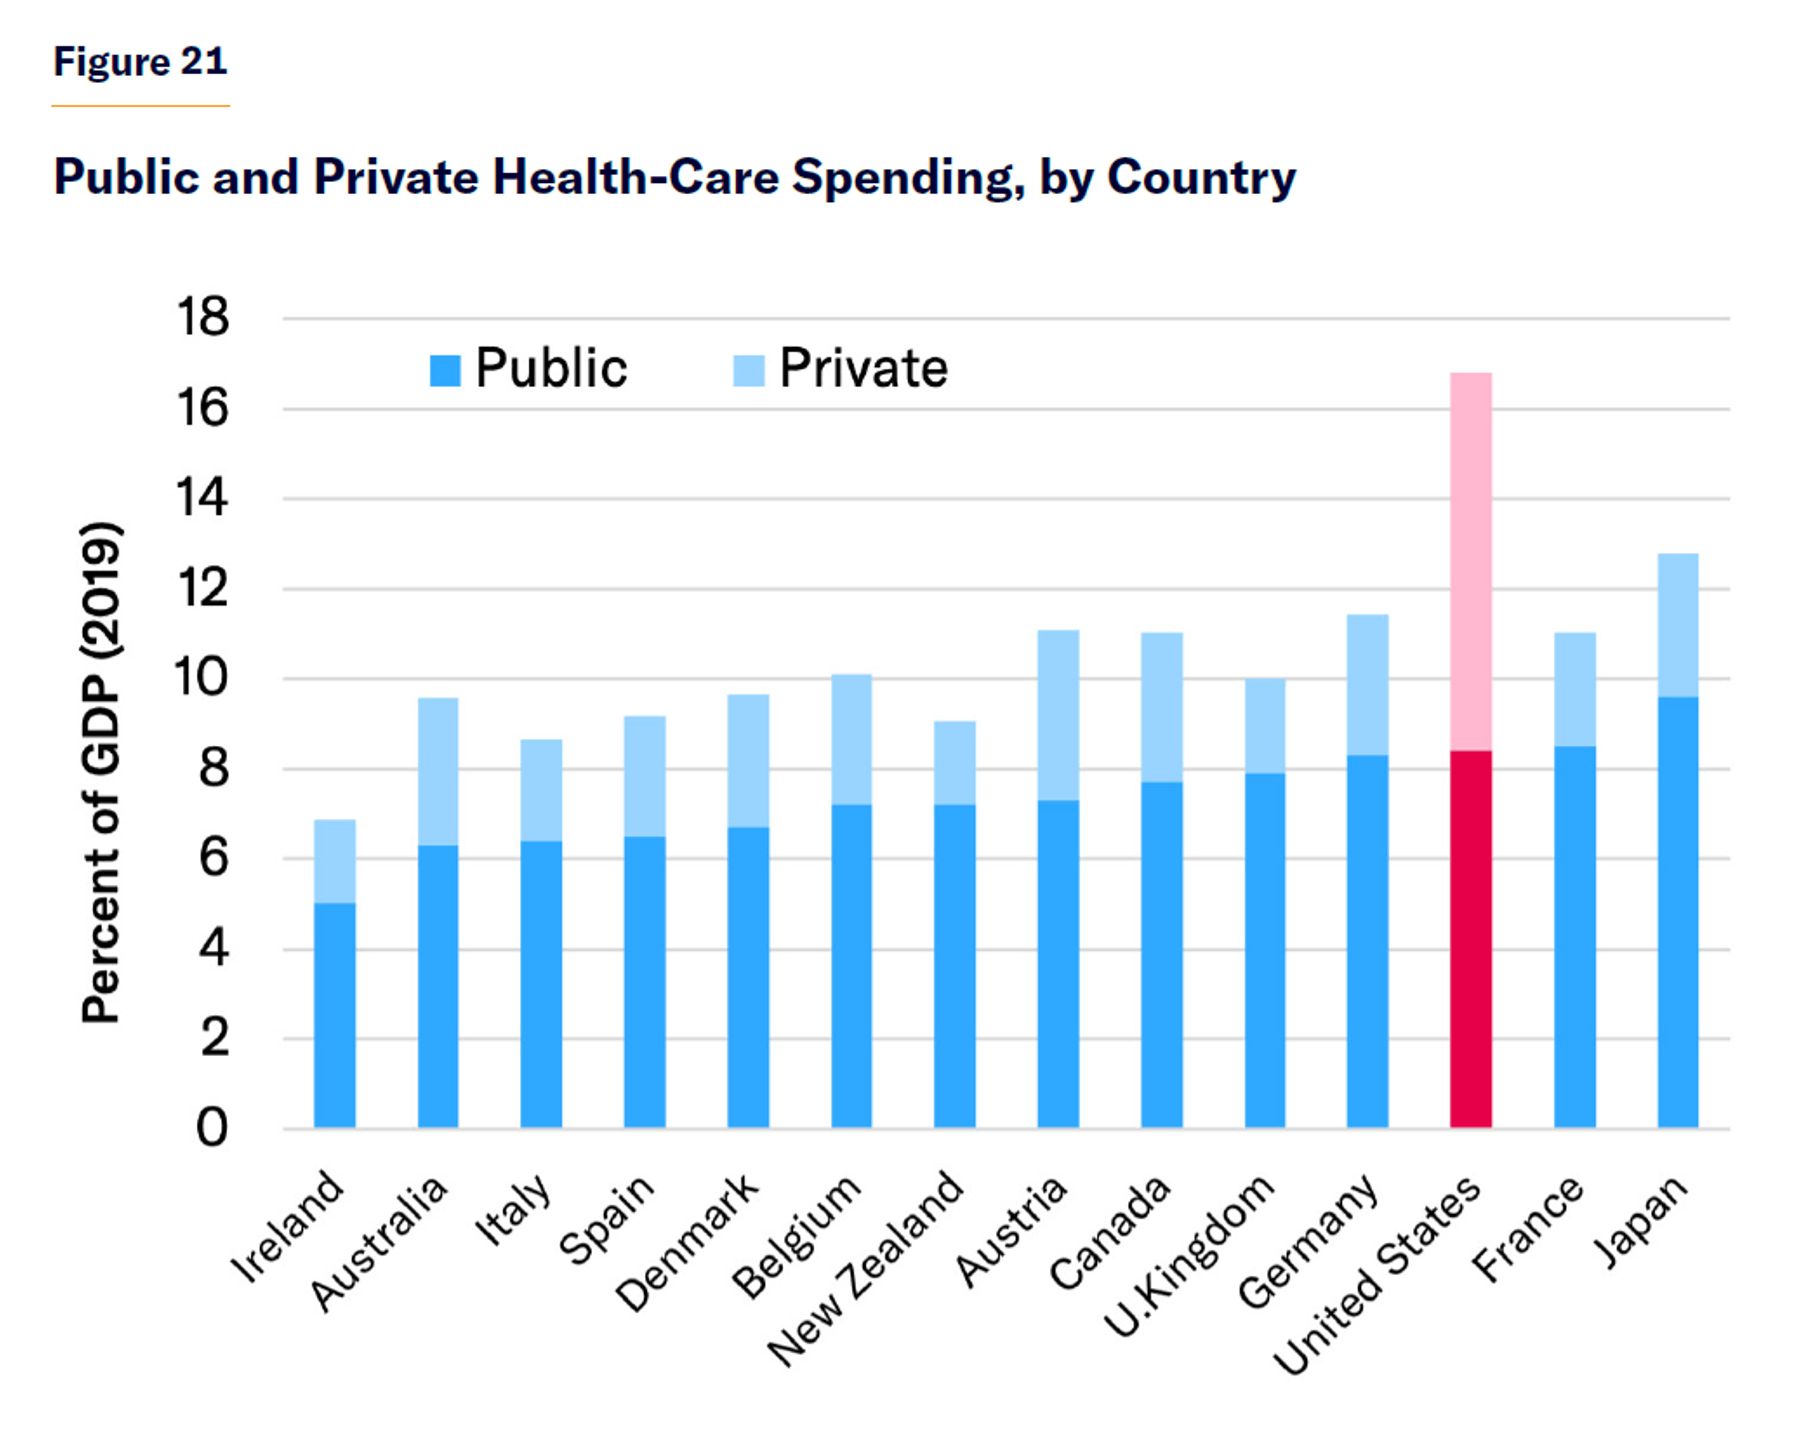
That year, the U.S. government spent a similar share of GDP on health care as those in other developed countries (Figure 21). But because most working-age households are ineligible for publicly financed health care, there is less crowd-out of private health-care finance in the U.S., so the nation spends a total of 17% of GDP on health care, compared with 10% in the E.U.[65]
While public funds are stretched across the entire population in predominantly publicly financed health-care systems, resulting in shortfalls in access to care, Medicaid and Medicare focus on the 34% of the U.S. population that is elderly, disabled, or less able to pay for themselves.[66] As a result, the 82 million low-income Americans covered by Medicaid in 2019 paid no premiums, deductibles, or coinsurance but faced less rationing of access to doctors, hospitals, and newly developed drugs than the middle class in many other countries.[67]
It is often suggested that the high level of health-care spending in the U.S. is simply explained by Americans overpaying for medical care because its private insurers pay more than twice what those in other countries do for equivalent procedures.[68] Yet this merely observes the downside of price discrimination. Across both public and private payers in the U.S., the average price paid for hospital care is less than 60% of that paid by U.S. private insurance plans alone—and in line with peer nations abroad.[69]
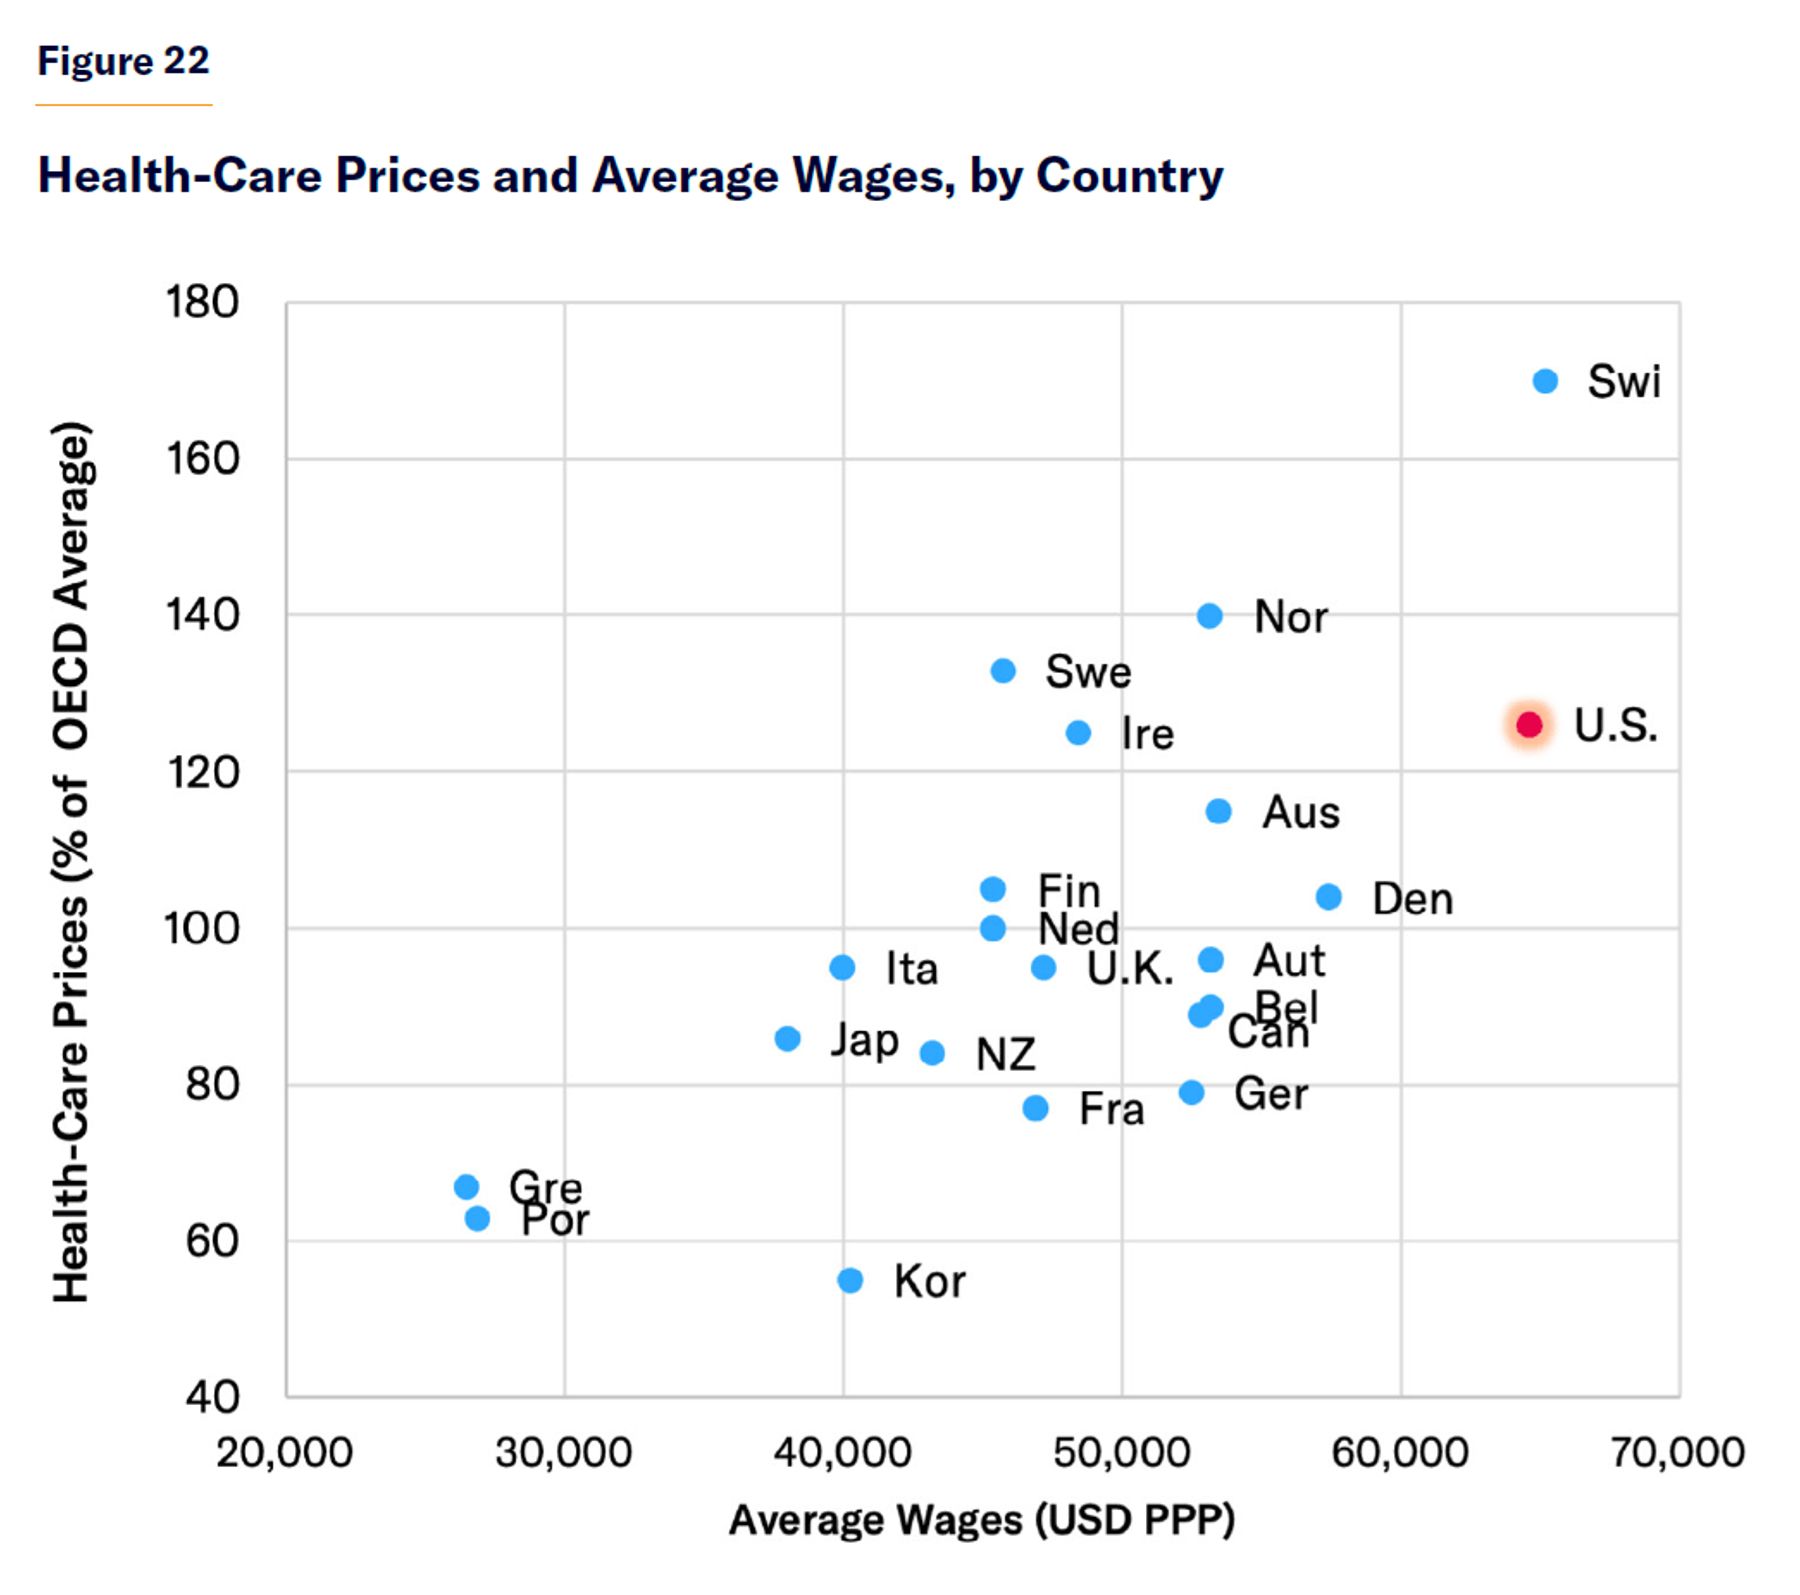
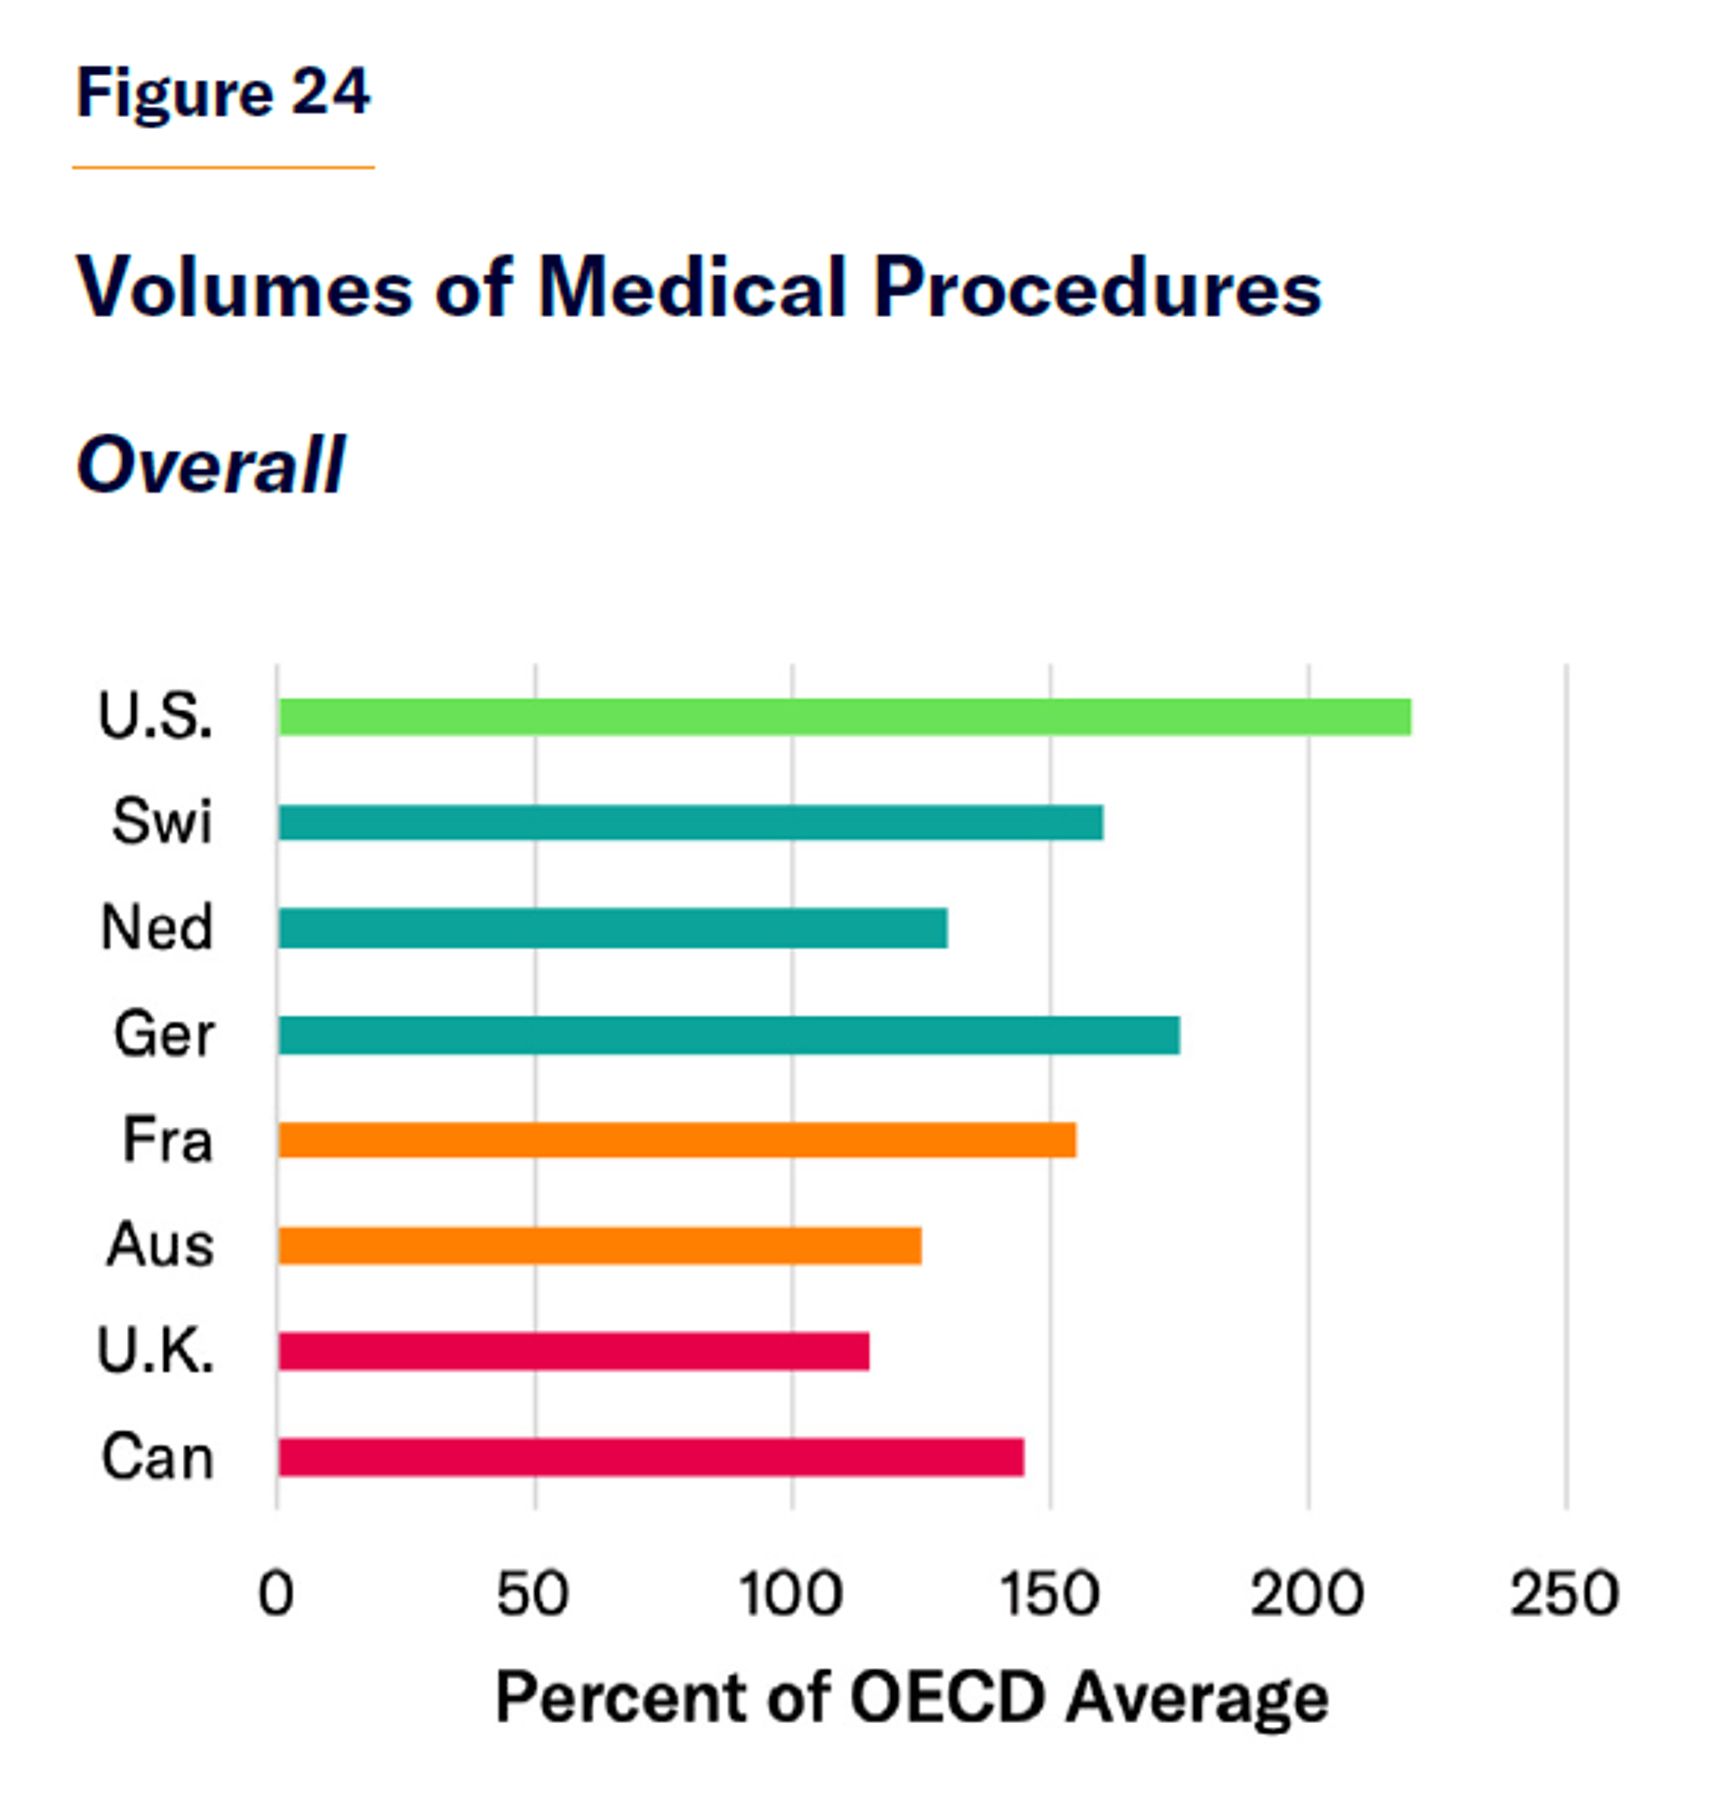
Attempting to disentangle the effect of prices and service availability, a 2020 OECD study estimated that while the U.S. spends three times the average of member nations on health care, this was more due to higher volumes of services (220% of the average) than to higher prices (which were 126% of the average).[70] As a labor-intensive industry, health-care costs are very sensitive to wages for high-skilled labor in general, which are much greater in the U.S. than in most European nations (Figure 22).[71]
Government regulation of health-care prices is therefore more a method of redistributing trade-offs, by indirectly rationing care, than a ticket to a free lunch.[72]
No bright line demarcates medical necessity from waste. Health care exists on a spectrum of cost-effectiveness: from antibiotics, which are cheap and highly effective, to costly hospital procedures for the chronically ill, which may do little to improve outcomes.[73] Diminishing returns mean that the less a health-care system does, the more value it will get out of each dollar. But that does not imply that the best health-care system is one that pays only for antibiotics.
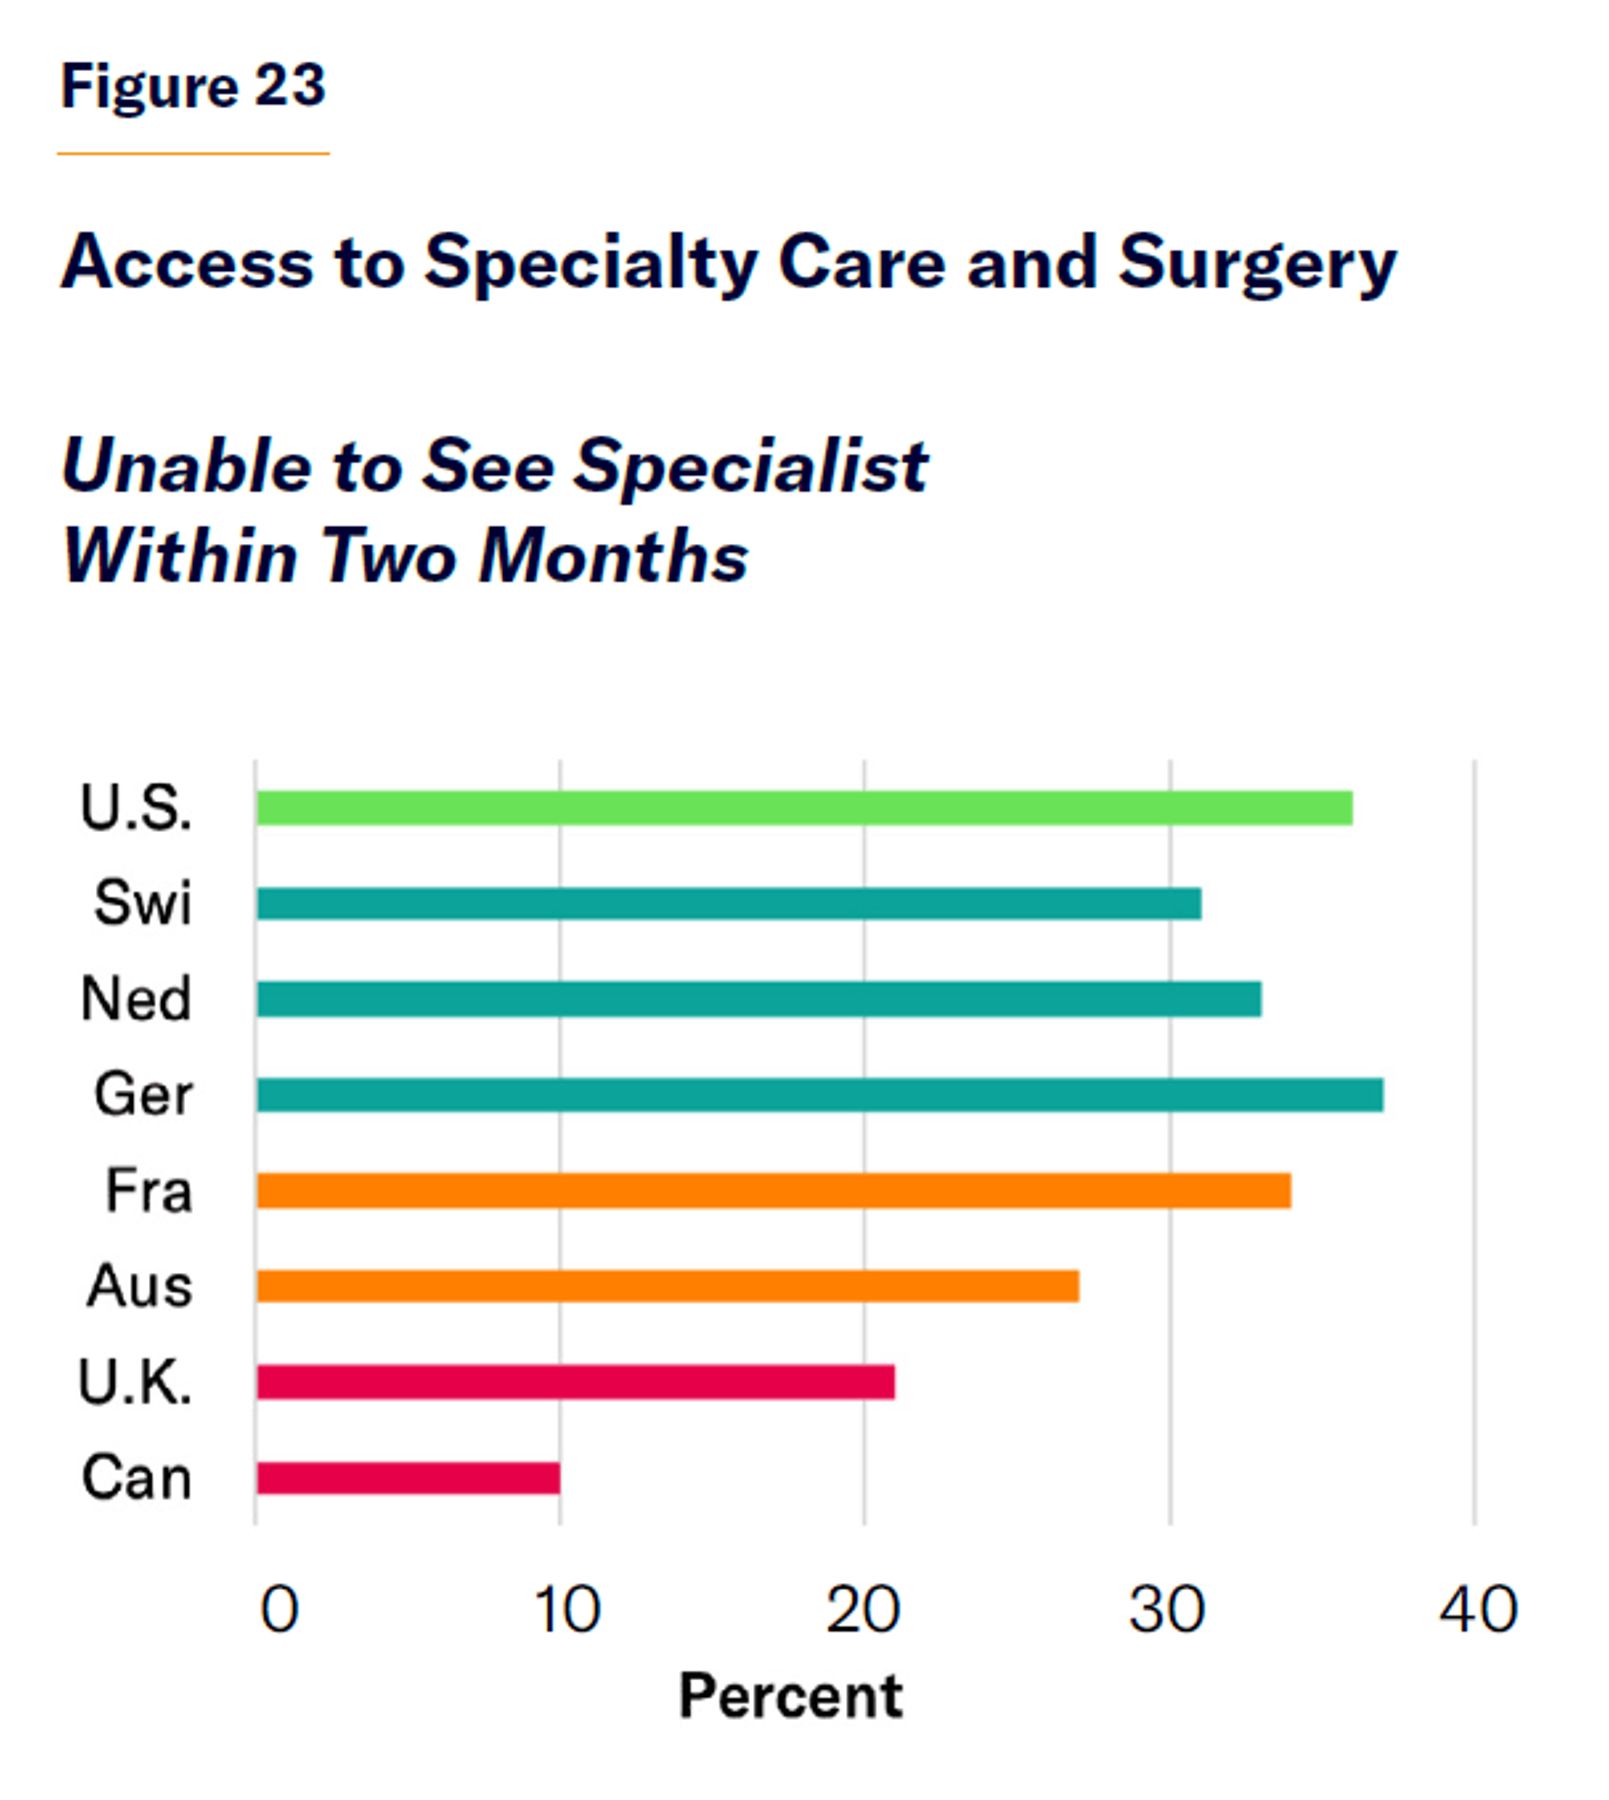
Canada’s health-care system saves funds by restricting the use of the costliest diagnostic services, drugs, and surgery (Figure 23). Specialists can be seen only following a referral by a general practitioner, and patients then face waiting times that average four weeks for an oncologist and 32 weeks for an ob-gyn. Operating-room time is particularly tightly controlled, so patients must wait an average of 59 weeks for neurosurgery.[74]
Such waiting lists genuinely do save money, as some patients get better while they wait, others give up trying to obtain care, and some die before it is their turn to use it.[75] As affluent groups have a greater ability to mobilize politically to capture scarce resources, waiting times tend to fall disproportionately on those in the lowest-income groups.[76]
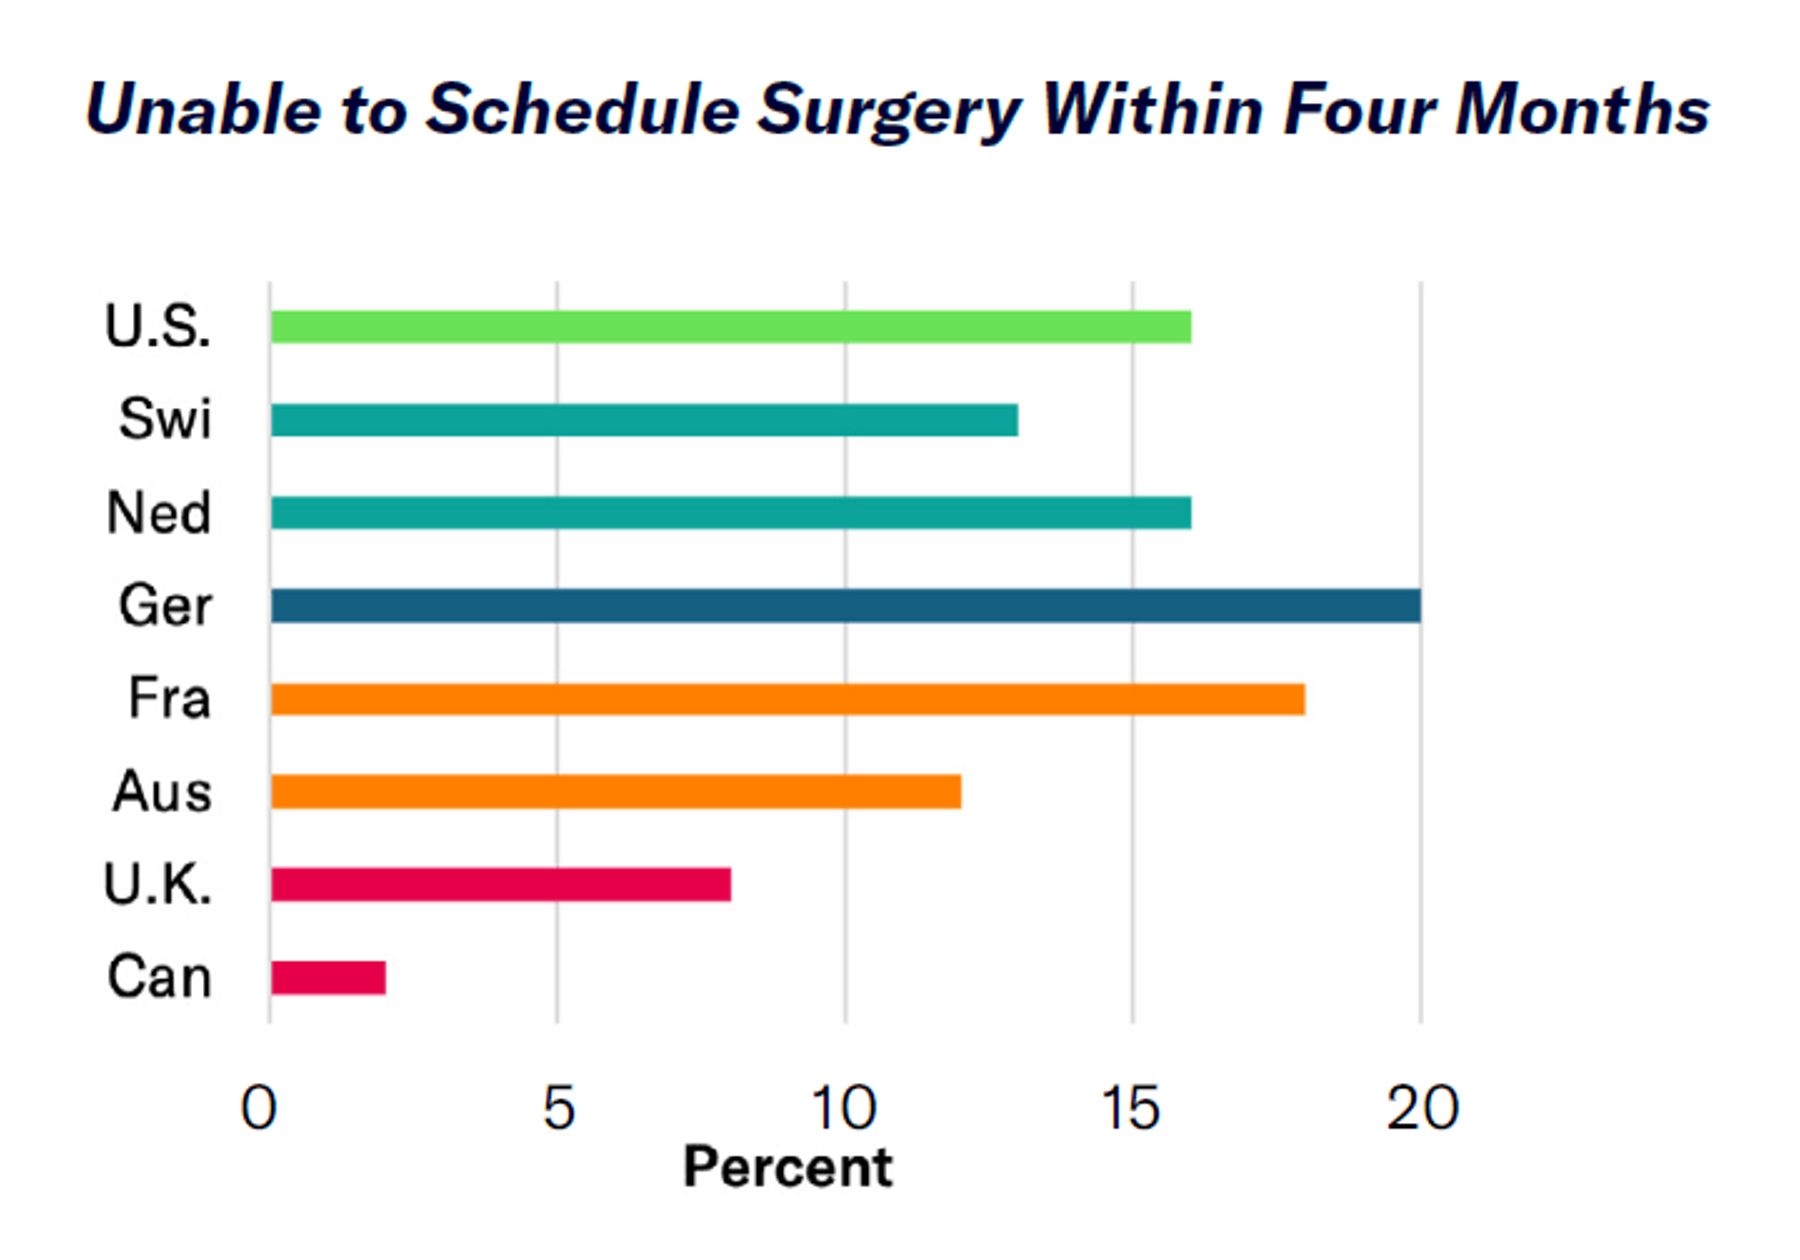
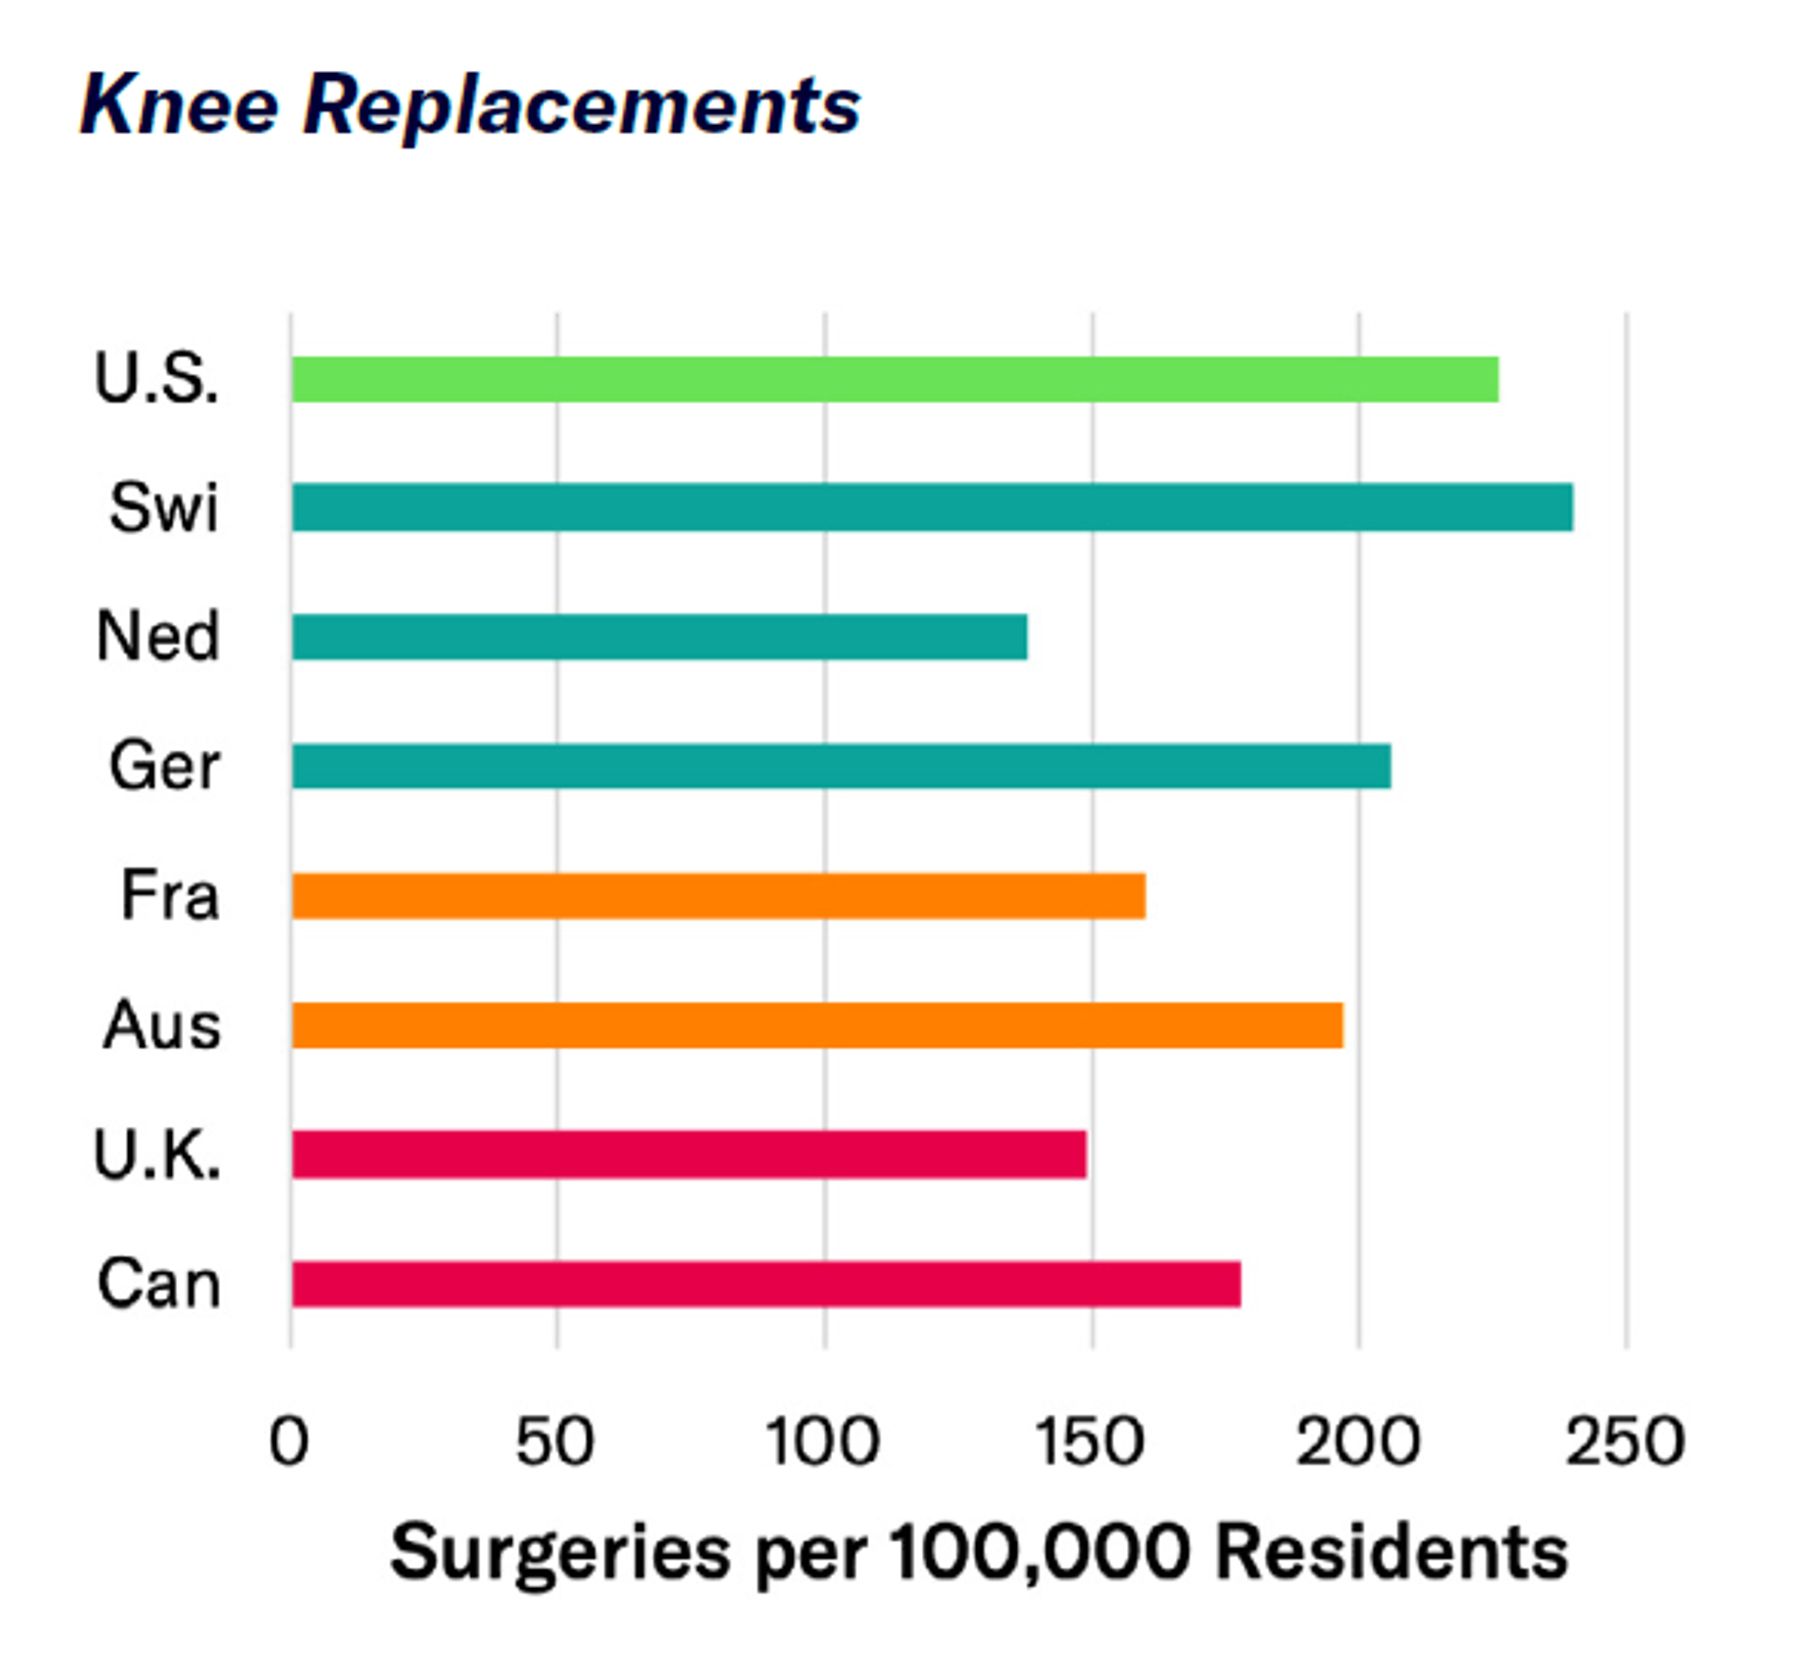
Canadian authorities have tried to save funds for lifesaving and emergency procedures by withholding resources from services deemed relatively inessential, such as orthopedic care. As the soaring demand for joint replacements has threatened to bust public health-care budgets, waiting lists have risen to an average of 38 weeks.[77] But though long waiting lists for orthopedic surgery might greatly reduce costs without altering life-expectancy statistics, they effectively sentence 80-year-olds who need hip replacements to an extended period of house arrest and isolation (Figure 24).
Drug prices are determined everywhere by the willingness of insurers or governments to pay for them—which depends, in turn, on their willingness to walk away if they deem the price too high. For existing therapies, many of which have cheap generic substitutes (the case for 90% of all drugs consumed), this is easy, and prices remain low everywhere.[78] But for valuable new drugs, for which no alternative previously existed, a trade-off is necessary. Publicly financed health-care systems typically set cost-effectiveness thresholds above which they refuse to pay for drugs. This helps drive down prices but often leaves patients needing to pay the full amount out-of-pocket for therapies that aren’t covered.
Health care is a business of damage mitigation. Even the best medical care will not make a sick person healthier than someone who never fell ill to begin with. The health-care system in the U.S. has much more work to do. Rates of heart disease and cancer are more than twice as high in the U.S. as in Europe, and the incidence of lung disease, strokes, and diabetes is 50%–80% higher than in Europe.[79] In 2019, 43% of Americans were obese, compared with 28% of Brits, 24% of Canadians, 17% of French, and only 5% of Japanese.[80] The burden of these conditions is multiplicative and increases the risk of death following heart attacks, strokes, and Covid-19 several times over—along with the risks of complications from surgical procedures.
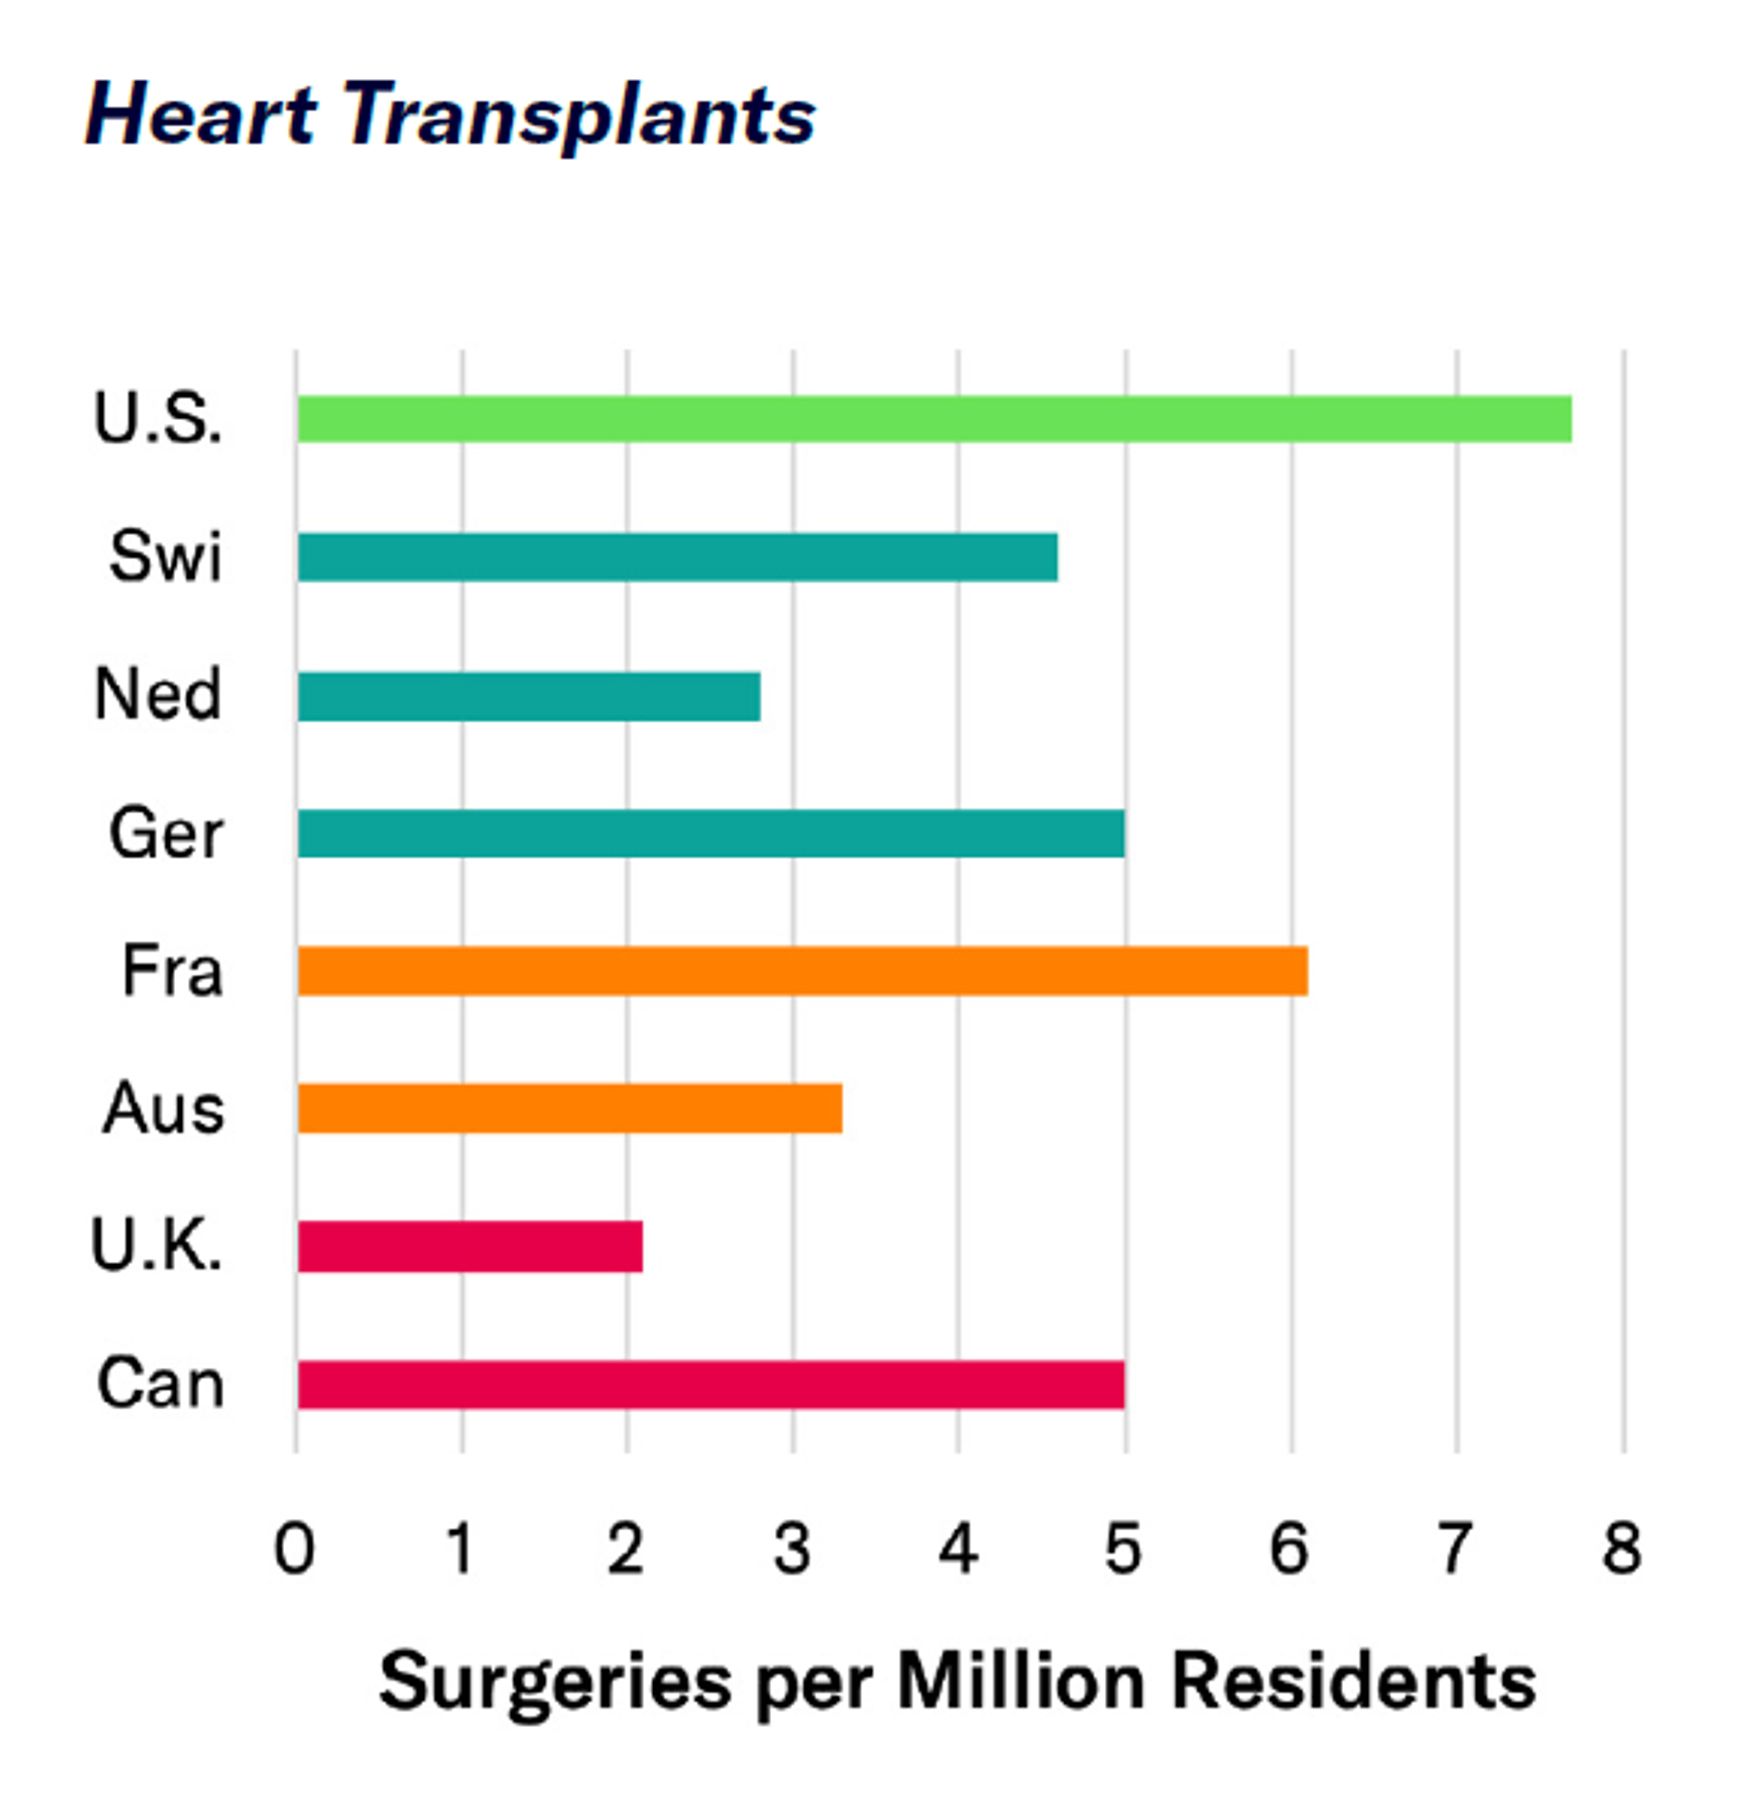
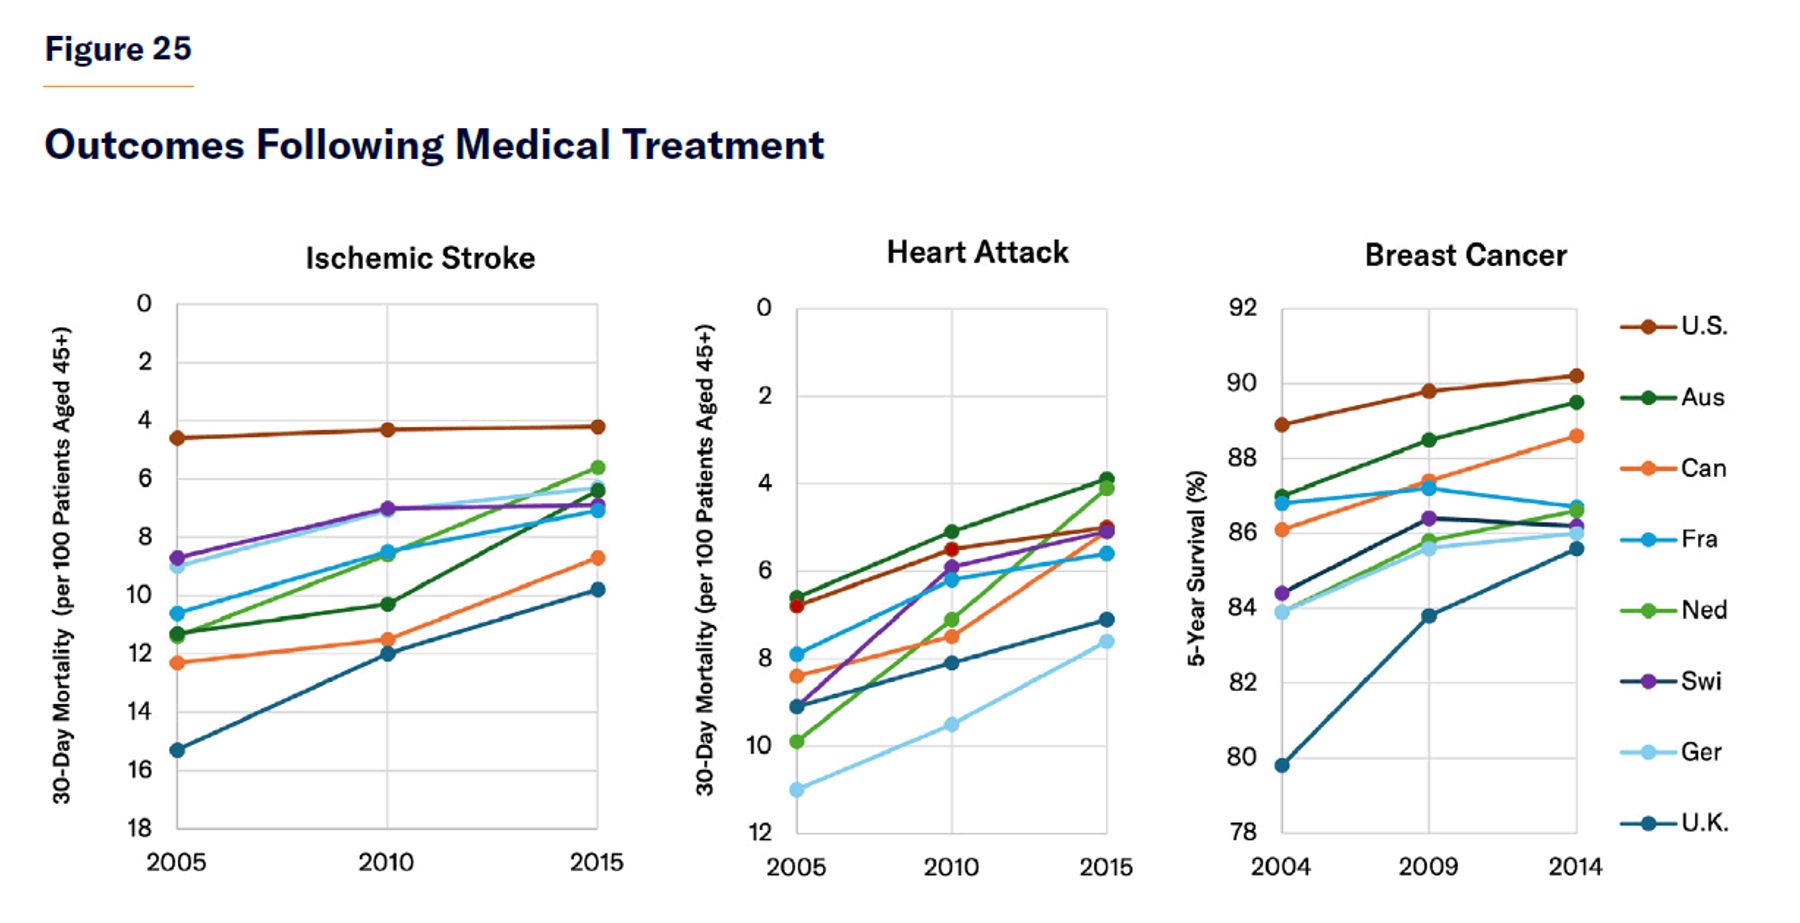
Nonetheless, the greater degree of access and utilization in the U.S. of specialty care, diagnostics, newly developed drugs, and surgical procedures seems clear (Figures 23 and 24). Survival rates following cancer, heart attacks, and strokes are consistently higher in the U.S. than in other developed nations, despite American patients’ greater comorbidities.[81] Yet Americans’ lead in outcomes after major medical events has shrunk, reflecting the influence of diminishing returns to improvements of medical capabilities (Figure 25).
Although Americans use more medical services, the pattern of utilization across social classes is similar in the U.S. to other developed countries. In both the U.K. and the U.S., hospital spending on the richest quintile is similarly 3/4 of that on the poorest quintile—for children, working-age adults, and retirees alike.[82]
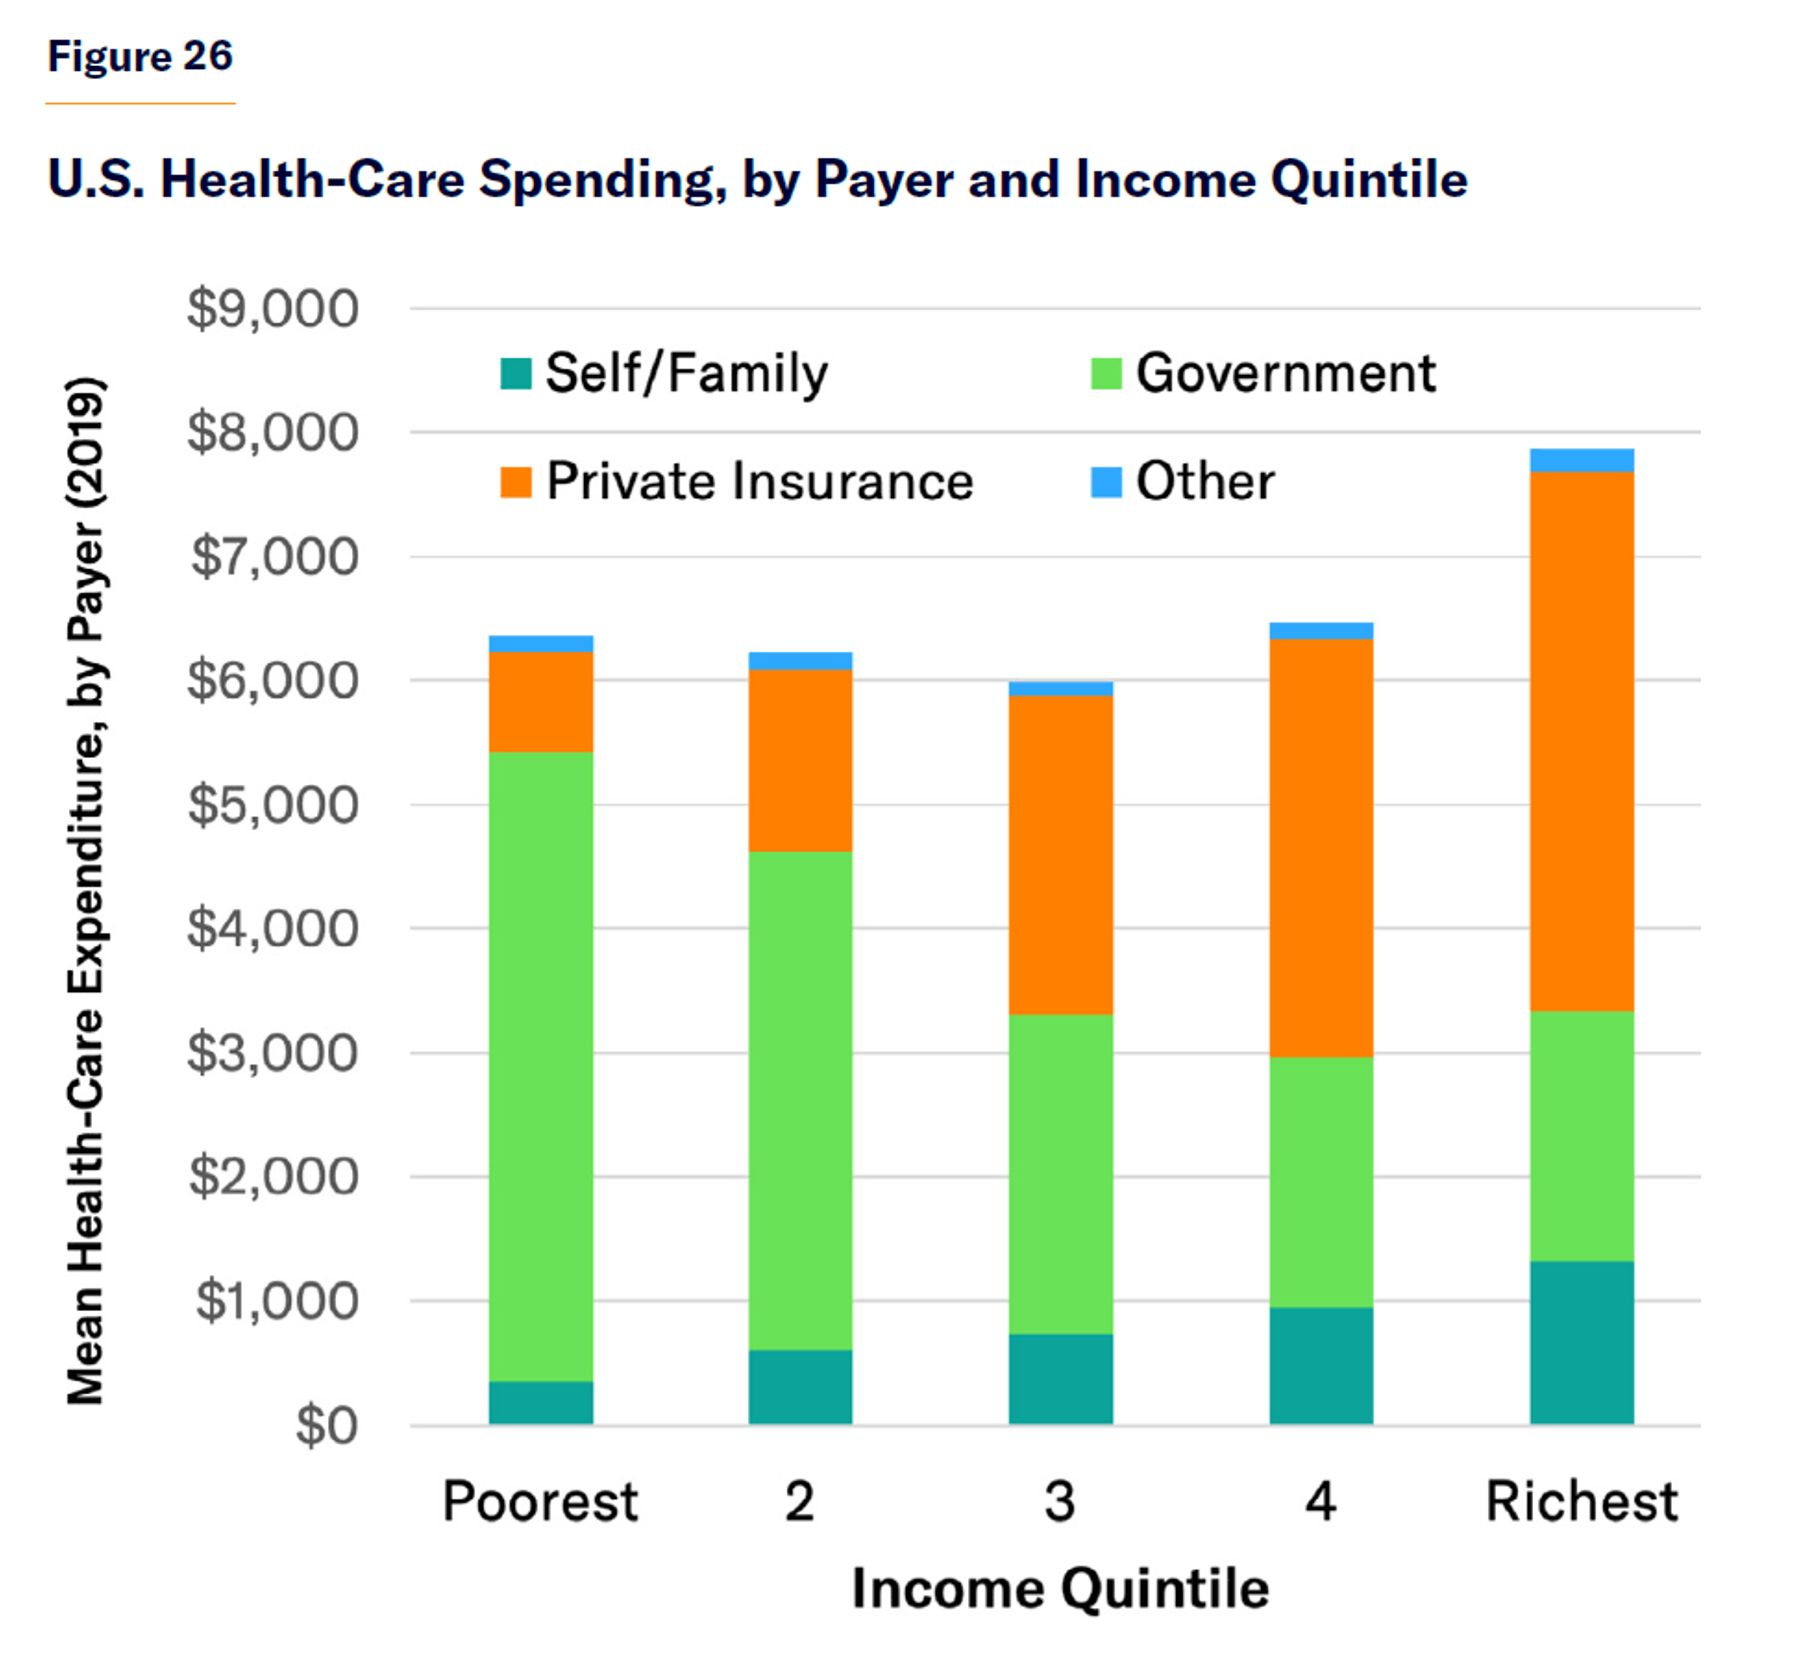
But because public health-care expenditures in the U.S. have been expanded incrementally to fill in gaps in private insurance coverage, they are focused on the poor and structured more progressively. Public spending covered 80% of the health-care costs incurred by the poorest quintile of Americans but only 26% of the richest fifth. While levels of consumption vary little by income quintile, the rich bear more of the cost out-of-pocket and through insurance premiums (Figure 26).[83]
As many of Europe’s health-care entitlements originated as compulsory employer-sponsored insurance, they yield little more redistribution to the poor than American private insurance plans. Whereas 43% of U.S. health-care spending comes from general government revenues, only 29% does in Europe—leaving a larger proportion to be raised from compulsory insurance premiums and payroll taxes, which weigh heaviest on earners with low incomes.[84]
While the progressivity of American health-care finance is underappreciated, the general exposure of Americans to high out-of-pocket health-care costs is often exaggerated by politicians and the press. Because their insurance coverage is generally comprehensive, Americans spend a smaller share of household consumption (2.5%) on out-of-pocket medical payments than the OECD average (3.0%).[85] Indeed, Americans spend a smaller share of their family budgets on out-of-pocket payments for prescription drugs than Europeans, where low reimbursement rates and narrow formularies leave patients on the hook for more of the cost (Figure 27).
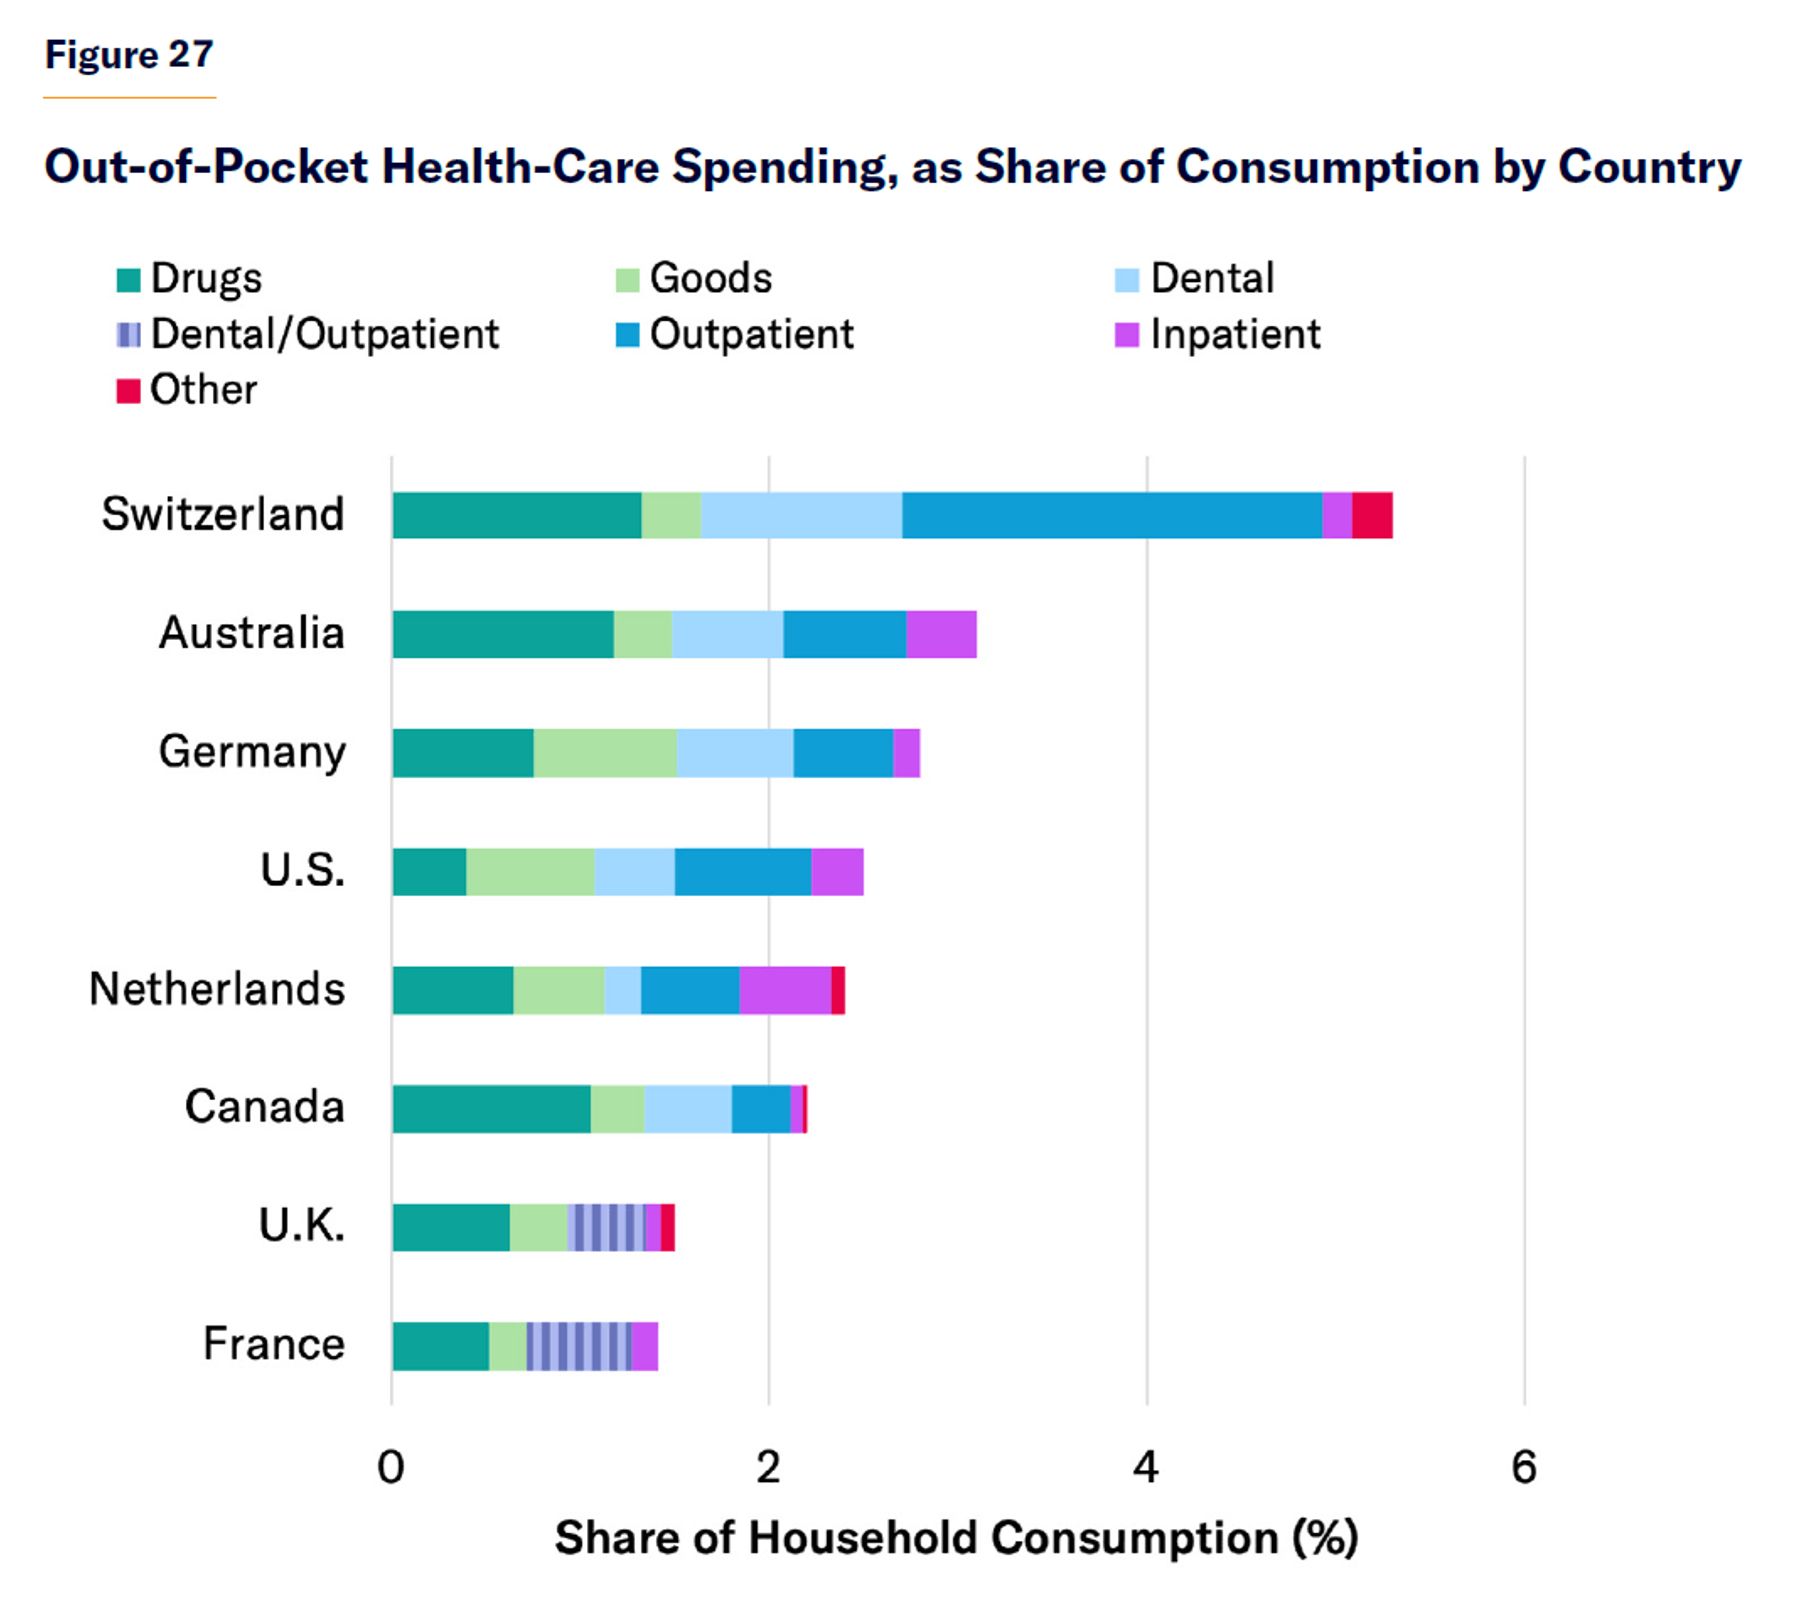
Note: Outpatient and dental expenditures are reported together for the U.K. and France.
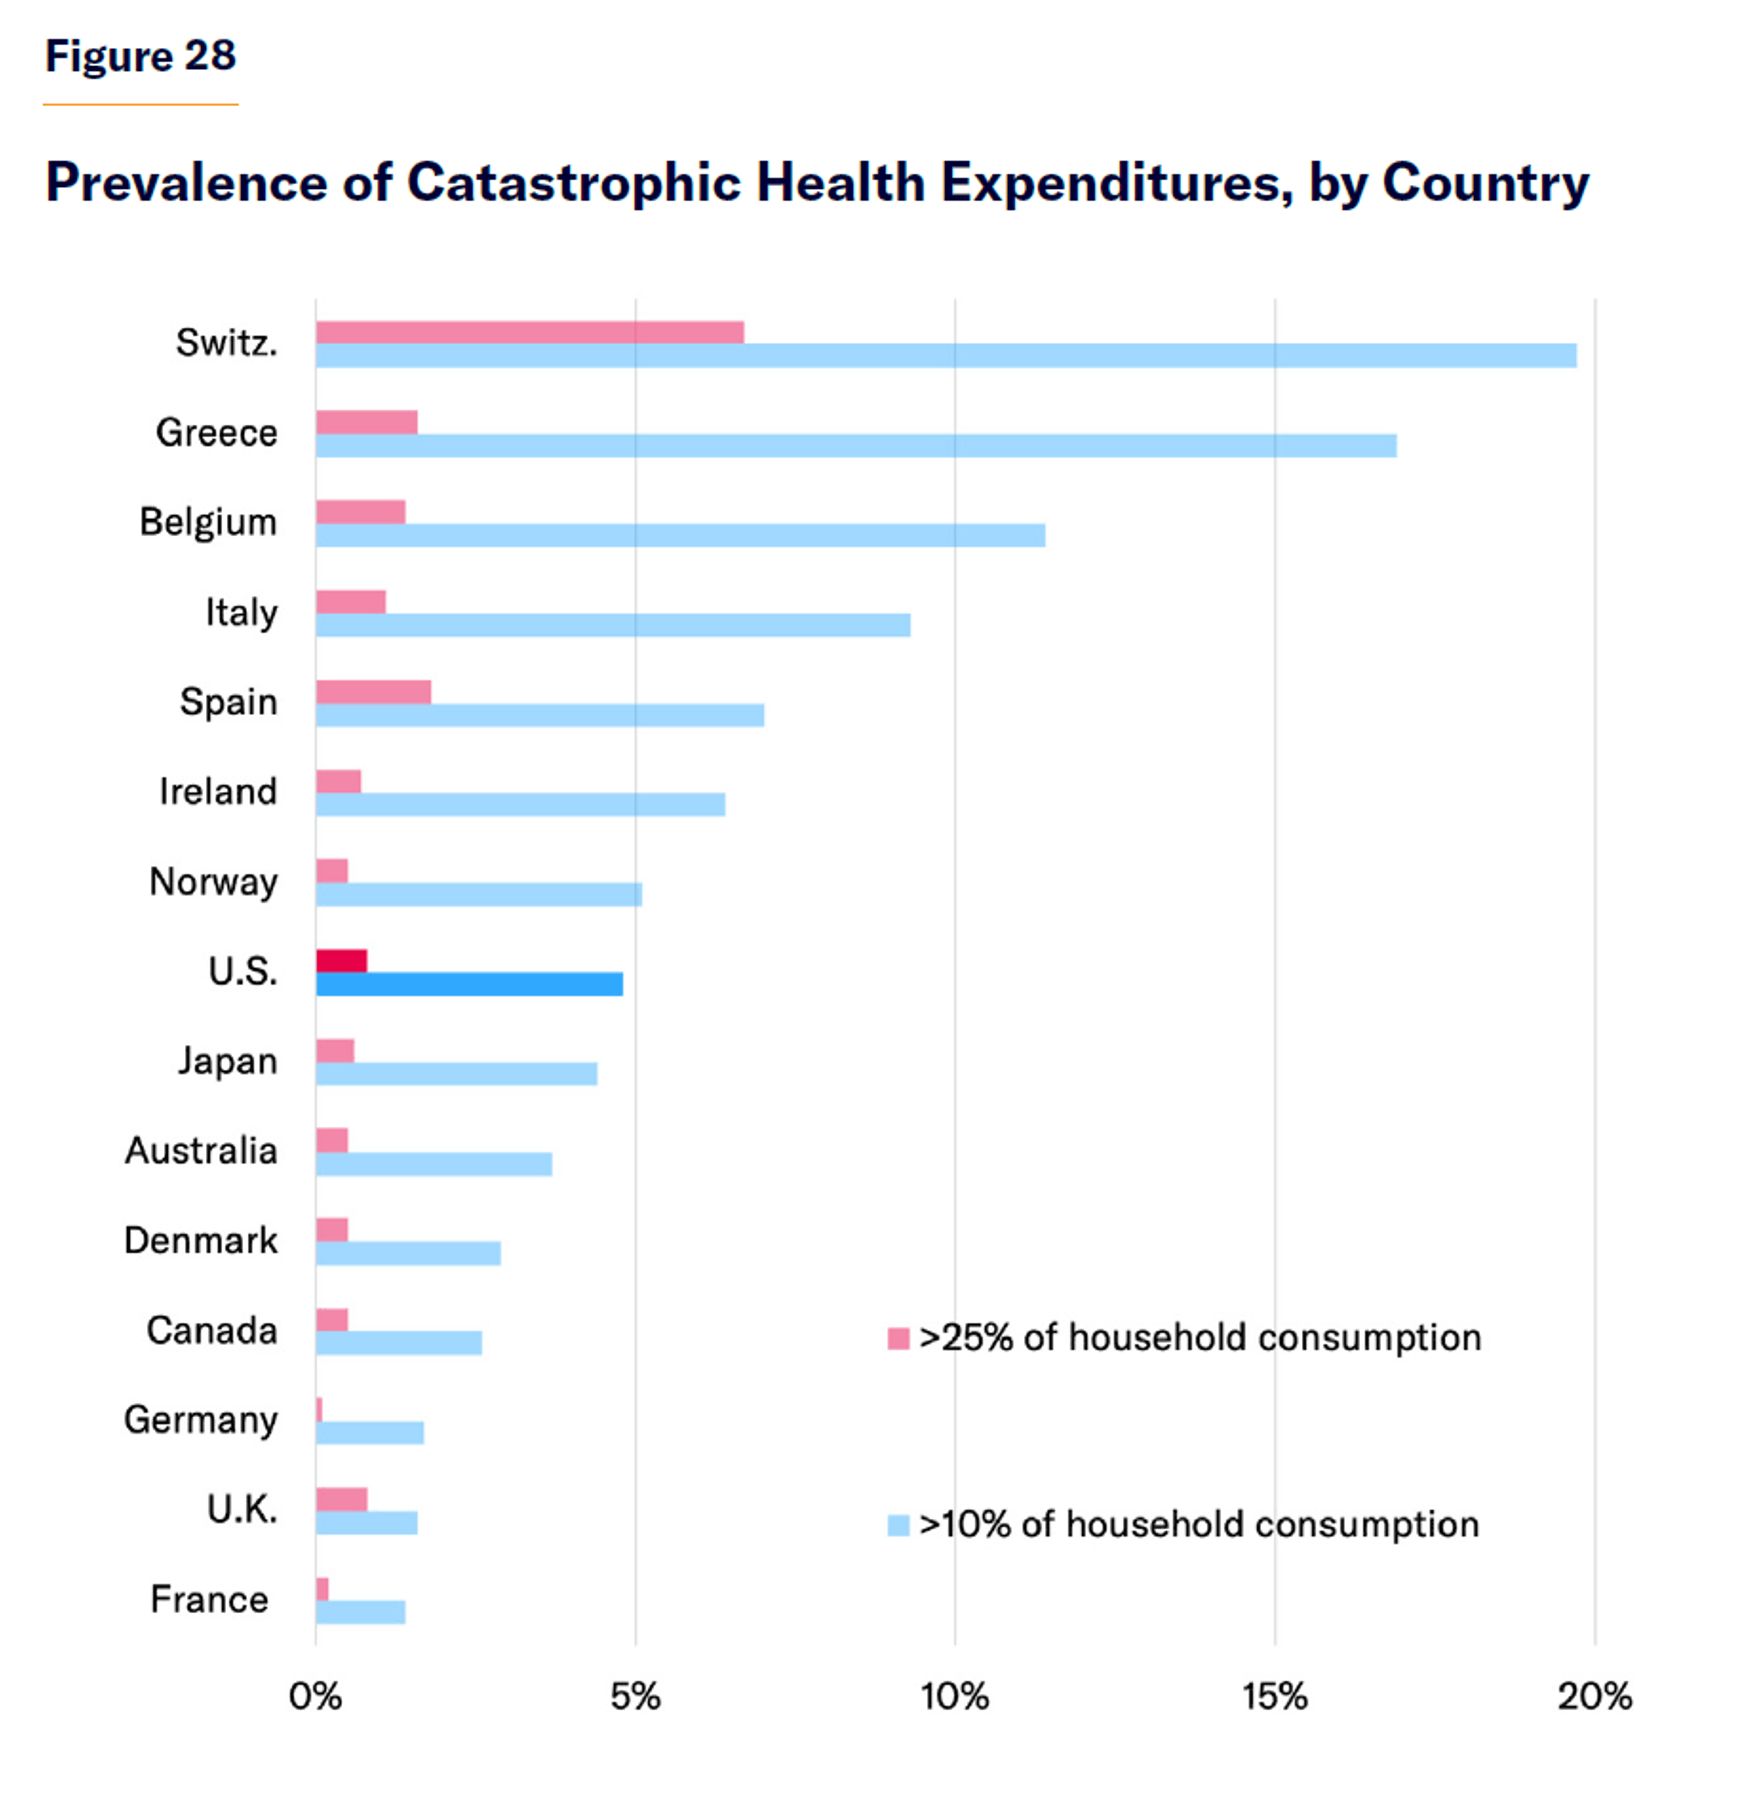
Whereas “universal” publicly financed health-insurance systems cover everyone in theory but often fall short in practice, American health care offers no universal guarantees but in practice makes available all kinds of assistance to people who cannot provide for themselves. Its safety net has multiple layers. Even if those who cannot afford insurance are not eligible for Medicare or Medicaid, they may be entitled to “uncompensated care” from hospitals and other health-care providers—for which Congress provided $42 billion in 2019.[86] As a result, the 0.8% of the U.S. population bearing catastrophic medical expenses (i.e., those exceeding 25% of annual personal consumption) was only slightly higher than that in the U.K. and Canada (0.5%) but much less than in Spain (1.8%) or Switzerland (6.7%) (Figure 28).[87]
Conclusion
Old-age pensions dominate the welfare state’s expenditures. Due to promises to provide benefits in proportion to prior wages and rising life expectancy, the automatic escalation of pension benefits for affluent retirees has grown to greatly exceed all other transfers.
Whereas European welfare state expenditures are largely dedicated to supporting middle-class living standards through periods of unemployment, disability, ill health, or retirement, publicly financed entitlements in the U.S. are more focused on helping those who cannot provide for themselves. This approach greatly reduces the cost of programs, allowing the U.S. to impose much lower taxes on citizens with modest incomes.
Because the U.S. does more to reserve eligibility for entitlements to those unable to provide for themselves, its social welfare expenditures are less likely to pull people out of employment. Poor Americans therefore enjoy higher private incomes than their European counterparts, and public funds can be better concentrated on a smaller set of needy beneficiaries. The smaller U.S. welfare state is therefore able to achieve a greater degree of net redistribution to its least fortunate citizens and to assure them of higher standards of living.
But as the U.S. population ages, the burden of financing retirement benefits on American workers is set to increase.[88] To avoid this, Social Security should be better focused on assuring a floor of income to retirees, while Medicare should be reformed to ensure that costs are considered before additional health-care services are added to its standard benefit package.[89] Better targeting can also improve the effectiveness of assistance for the unemployed, while alleviating the payroll-tax burden on current workers.[90]
Endnotes
Photo: Douglas Sacha / Moment via Getty Images
Are you interested in supporting the Manhattan Institute’s public-interest research and journalism? As a 501(c)(3) nonprofit, donations in support of MI and its scholars’ work are fully tax-deductible as provided by law (EIN #13-2912529).