American Attitudes on Welfare, Waste, Crime, and the Political Environment

(Photo by Jakub Porzycki/NurPhoto via Getty Images
A new national survey conducted by the Manhattan Institute examines Americans’ attitudes toward the welfare state thirty years after President Bill Clinton’s landmark welfare reform, as well as the political environment heading into the 2026 midterm elections and the emerging 2028 presidential nominating contests. The survey also explores approval of the death penalty and the abolition of police, prisons, and borders. The poll reached 1,121 respondents who are likely voters in the 2026 midterm elections.
This study helps clarify a central question confronting American social policy: Do voters still support the principles that reshaped the nation's welfare system in the 1990s? Or has public opinion shifted toward a more universal and unconditional vision of government assistance?
The findings reveal a durable public consensus in favor of assistance that is targeted rather than universal, tied to work where appropriate, and focused on providing a basic standard of living rather than reducing income inequality. Voters also place a high priority on reducing waste, fraud, and abuse within government assistance programs.
The survey reveals a significant generational divide, with younger voters consistently more supportive of universal benefits, unrestricted cash assistance, and universal basic income than older Americans, suggesting that many of the assumptions underpinning the modern welfare state are less firmly held by the rising generation.
Beyond welfare policy, the survey also finds that Democrats hold a narrow advantage on the generic congressional ballot, JD Vance leads the early 2028 Republican presidential field while Donald Trump remains the party's dominant kingmaker, and that the Democratic nominating contest remains wide open. The results also show majority support for the death penalty for egregious crimes and overwhelming public opposition to abolitionist proposals such as eliminating police departments, prisons, or U.S. borders.
Full Results Available: Toplines, Crosstabs
Methodology
Between July 1 and July 6, 2026, the Manhattan Institute surveyed 1,121 likely voters nationwide. The sample was reached primarily via online panels (701 interviews) with an SMS-to-web component (420 interviews).
Results were weighted to reflect voters nationwide on age, race, gender, education, and the 2024 presidential vote.
For the 2028 presidential primary questions, answers were filtered to a sample based on whether they said they were more likely to vote in the Republican or Democratic primary. For the political ideology questions, answers were filtered to a sample based on whether they reported leaning to the right or left.
The margin of error is ±3.1 percentage points.
Midterm Political Environment
The political environment remains competitive heading into the 2026 midterm elections. President Donald Trump receives a 44% job approval rating, while 54% disapprove, including 48% who strongly disapprove. The president's coalition remains strongest among Republicans (88% approve) and voters aged 50–64 (53%), while independents (60% disapprove), college graduates (61%), women (60%), and black voters (80%) express substantially more negative views.
The congressional landscape remains closely divided, with Democrats holding a narrow 47% to 43% advantage on the generic congressional ballot. One in ten voters is still undecided. Democrats' advantage is driven primarily by younger voters (58% to Republicans’ 30%), college graduates (54% to 38%), and black voters (76% to 15%), while Republicans perform better among non-college voters (47% to 42%) and voters between the ages of 50 and 64 (51% to 39%). Independents currently lean toward Democratic congressional candidates (45% to 31%), though roughly one-quarter remain undecided, underscoring the unsettled nature of the current political environment.
The 2028 Republican Primary
Vice President JD Vance begins the 2028 Republican presidential primary as the clear frontrunner. Among likely Republican primary voters, Vance receives 37% support, well ahead of Secretary of State Marco Rubio's 20%. Donald Trump Jr. places a distant third at 9% followed by Florida Governor Ron DeSantis at 7%. No other candidate tested exceeds 2% (Figure 1).
Figure 1
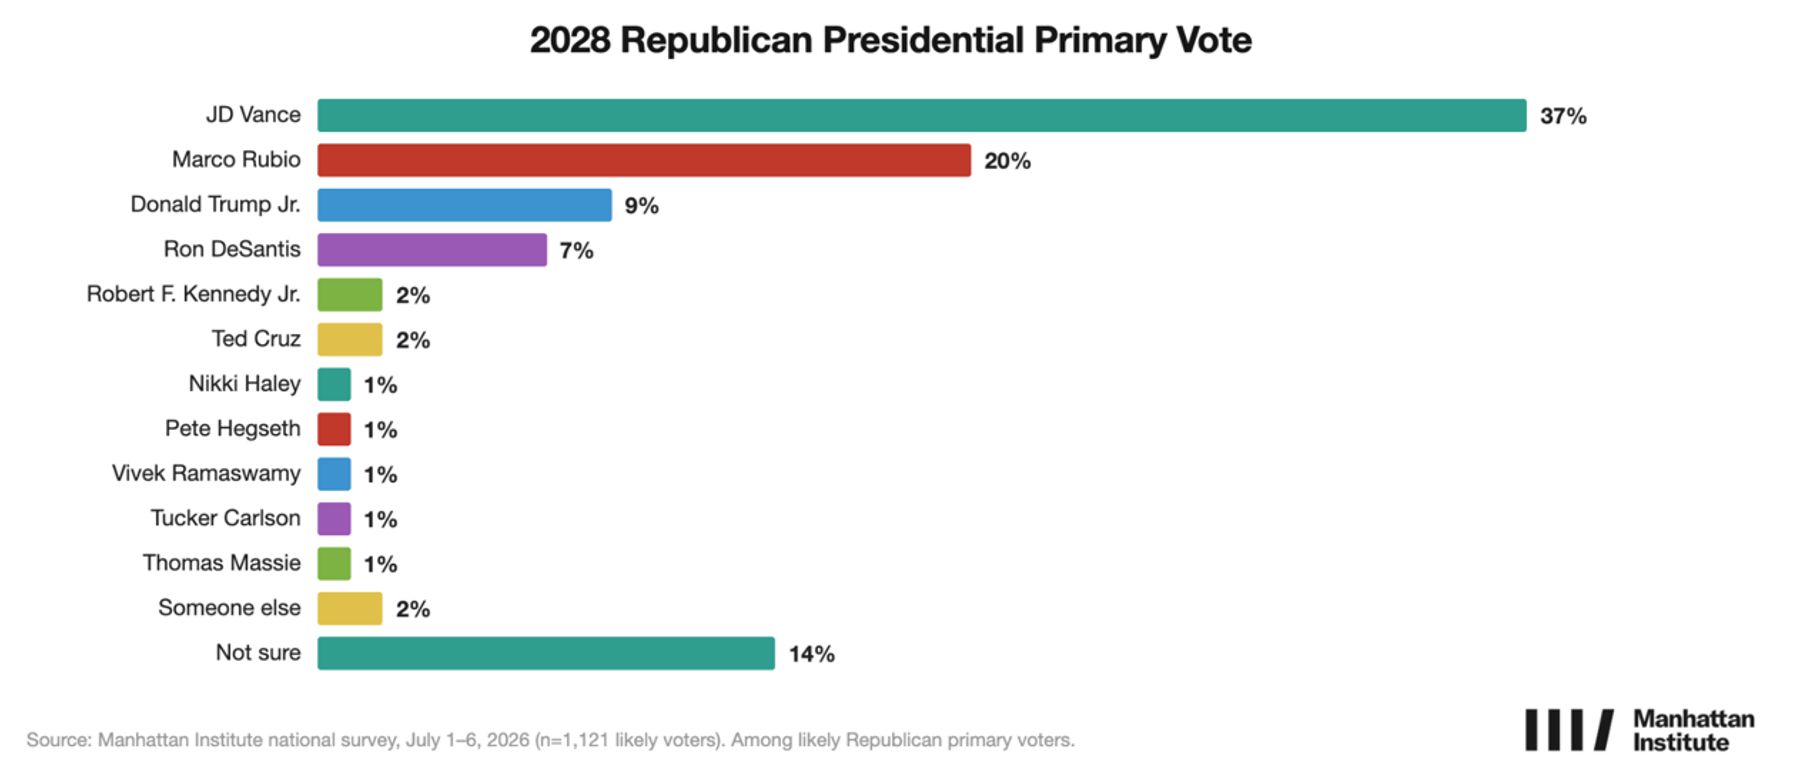
Vance’s advantage is driven largely by his strength among the “MAGA” coalition, where he leads self-identified MAGA movement voters with 49% to Rubio’s 16%.
Although Vance currently holds a commanding lead, the survey tested the effect of a presidential endorsement in both directions, revealing that Donald Trump remains the party's most influential political figure.
In a head-to-head contest between Vance and Rubio, Vance leads 48% to 29%. But when respondents are asked to reconsider with a hypothetical Trump endorsement of Rubio, the race reverses, with Rubio moving ahead 43% to 36%, including with the support of 49% of MAGA movement voters. Conversely, a Trump endorsement of Vance expands the vice president's advantage to 53% to 26% (Figure 2).
Figure 2
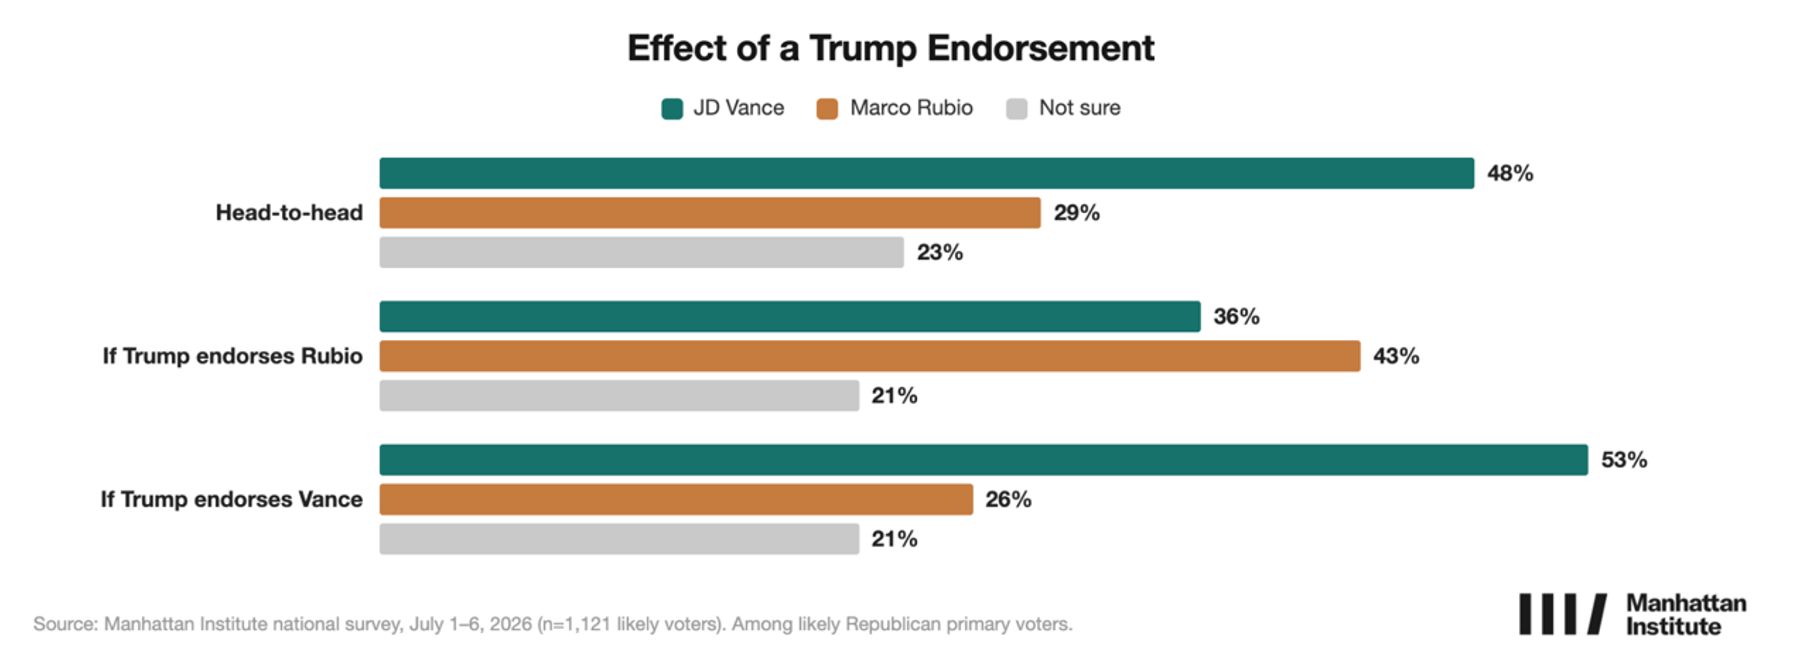
The findings suggest that while Vance enters the 2028 cycle as the early favorite, the Republican nomination contest remains highly dependent on Trump's political influence.
The 2028 Democratic Primary
The 2028 Democratic primary field remains remarkably fluid and has no early frontrunner. Among likely Democratic primary voters, Former Vice President Kamala Harris leads the field with 19%, followed by California Governor Gavin Newsom at 15%, former Transportation Secretary Pete Buttigieg at 13%, and Representative Alexandria Ocasio-Cortez at 12%. Senator Mark Kelly received 6%, Pennsylvania Governor Josh Shapiro received 4%, and Senators Jon Ossoff and Cory Booker each received 3%. 16% of likely Democratic primary voters remain undecided (Figure 3)
Figure 3
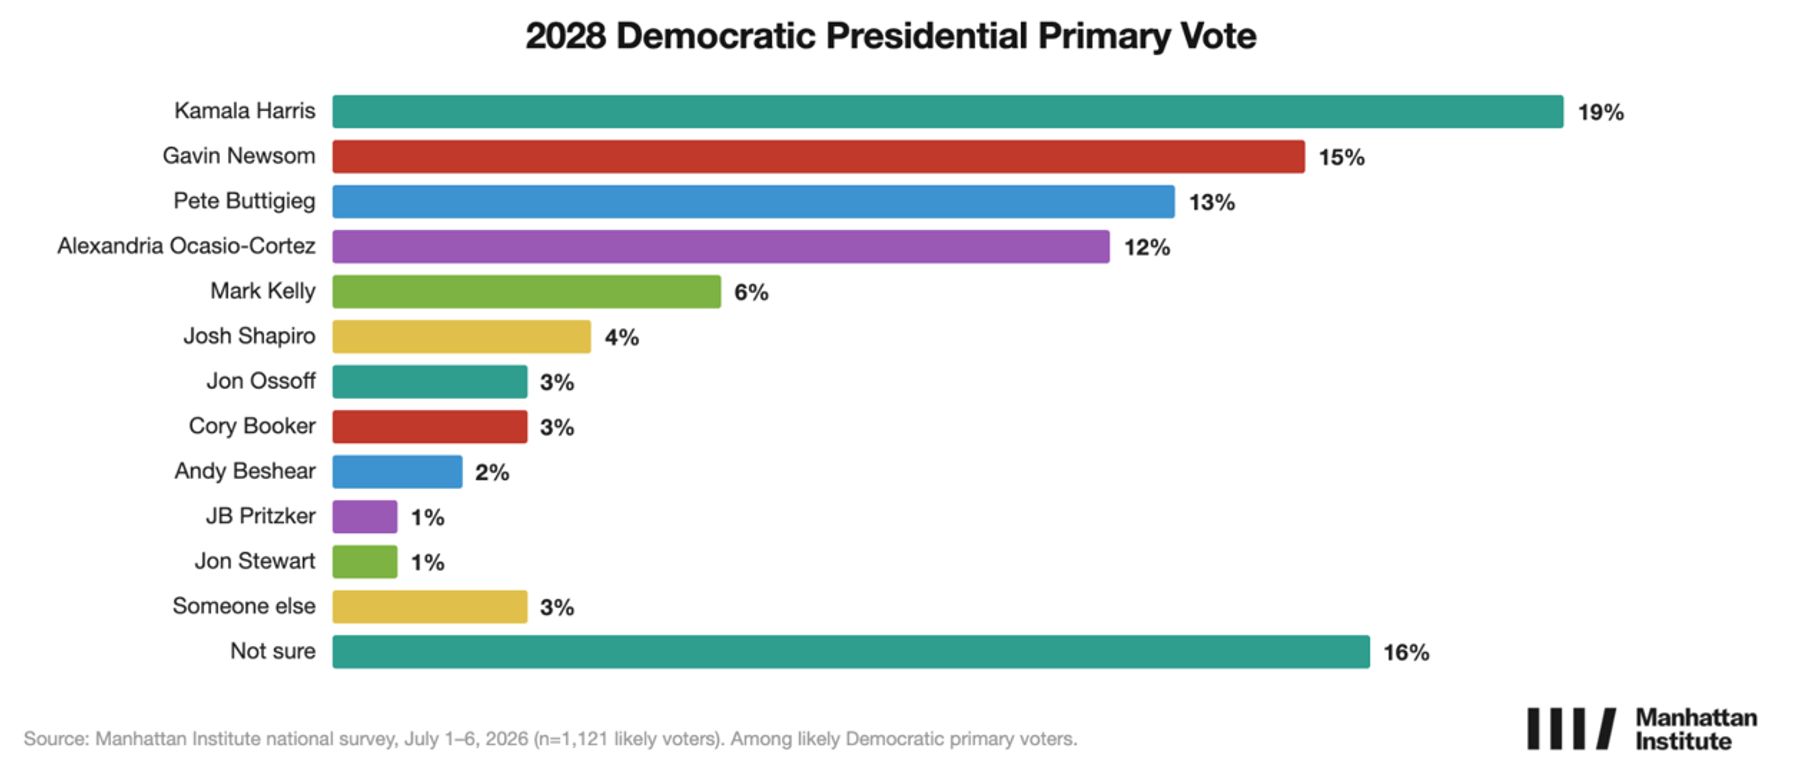
Harris’s slight lead is driven largely by her strength among black voters (45% support), Hispanic voters (42%), and younger voters (37%). She receives support from just 10% of white voters and 7% of those 65-and-over. Newsom and Buttigieg fare better among older voters (25% of 65-and-over voters support Newsom, 16% support Buttigieg), and Ocasio-Cortez draws her strongest support from younger voters (20% of voters age 18–34 and 35–49).
Among independents who plan to vote in the Democratic primary, no candidate reaches 15%, and one in five is undecided.
The findings demonstrate that Democrats have yet to coalesce around a single candidate capable of uniting their competing ideological and demographic constituencies. Unlike Republicans, whose early preferences are heavily shaped by Trump's continued influence, Democrats enter the 2028 cycle without a dominant figure or an obvious successor to lead the party.
Identity Within the Parties
The survey asked right-leaning and left-leaning voters to identify the political tradition that best describes them, offering a window into how each party's coalition understands itself.
Among right-leaning voters, a majority (58%) identify as traditional conservatives, while 42% identify with the MAGA movement. Younger voters aged 18–34 overwhelmingly identify as traditional conservatives (79%) rather than MAGA (21%). The MAGA identity is strongest among Hispanic voters (54%) and voters aged 50–64 (51%).
Among left-leaning voters, a slight majority (51%) identify as traditional liberals, while 49% identify as democratic socialists. Traditional liberals are most represented among older voters (71% of 65-and-over, 55% of 50–64), while the democratic socialist identity is strongest among younger voters (67% of 18–34, 56% of 35–49), black voters (57%), and Hispanic voters (55%) (Figure 4).
Figure 4
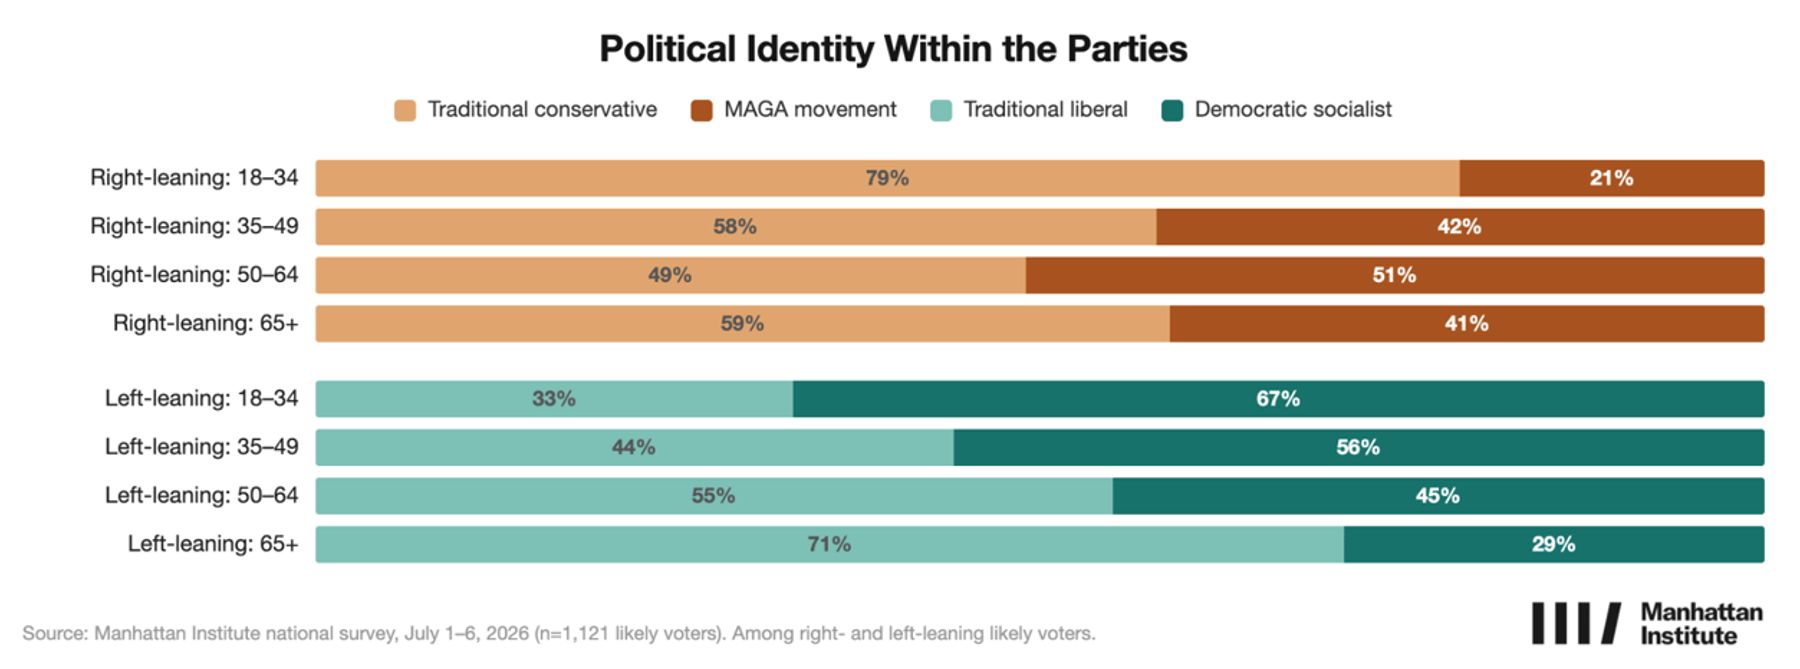
The findings suggest the parties' internal debates are being shaped by very different generational dynamics, with the younger right-leaning coalition identifying less with the MAGA movement, as younger left-leaning voters increasingly embrace the democratic socialist label.
Thirty Years After Welfare Reform
Thirty years after Congress enacted the Personal Responsibility and Work Opportunity Reconciliation Act of 1996, its central principles retain broad public support.
Figure 5
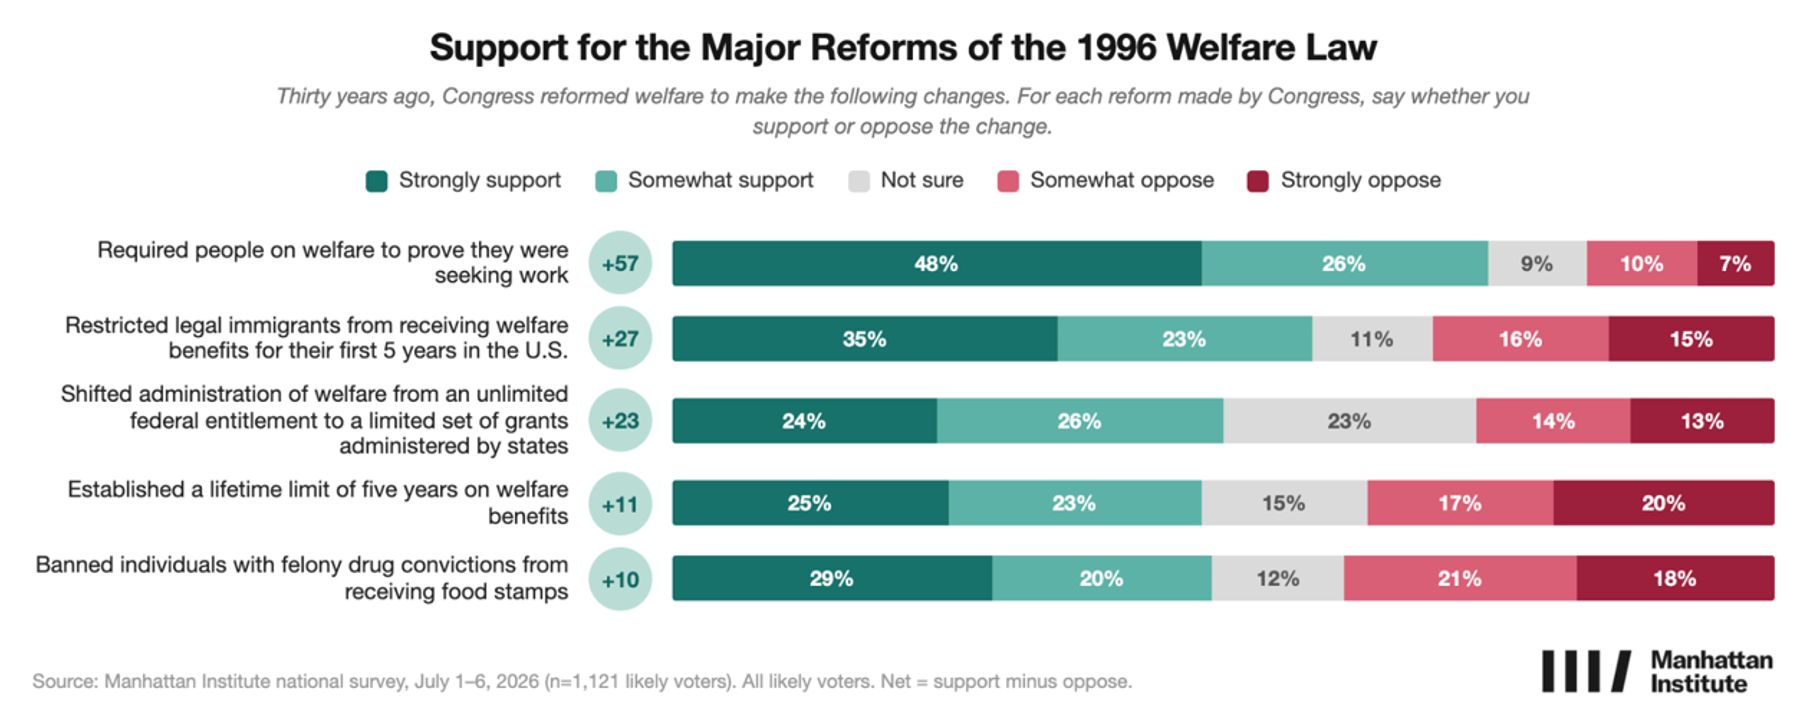
Asked about the law's major reforms, voters express overwhelming support for requiring welfare recipients to demonstrate that they are seeking work (74% support to 17% oppose). A majority supports restricting welfare eligibility for recent legal immigrants (58%), while pluralities support replacing the former federal entitlement with state-administered block grants (50%), limiting lifetime welfare benefits to five years (48%), and restricting food stamp eligibility for individuals with felony drug convictions (49%) (Figure 5).
Work requirements remain the law's most durable legacy. Support extends across virtually every demographic and political group, including majorities of Republicans, independents, and Democrats. Even among somewhat left-leaning voters, more than six in ten support requiring welfare recipients to seek employment.
The Safety Net Concept
Beyond specific welfare reforms, the survey asked voters a series of first-principles questions about the purpose and design of the modern safety net. Across these questions, respondents articulate a consistent philosophy. Americans generally favor assistance that is targeted toward those most in need, encourages work and self-sufficiency, provides a basic standard of living rather than equalizing incomes, and delivers benefits through specific programs rather than unrestricted cash payments.
Figure 6
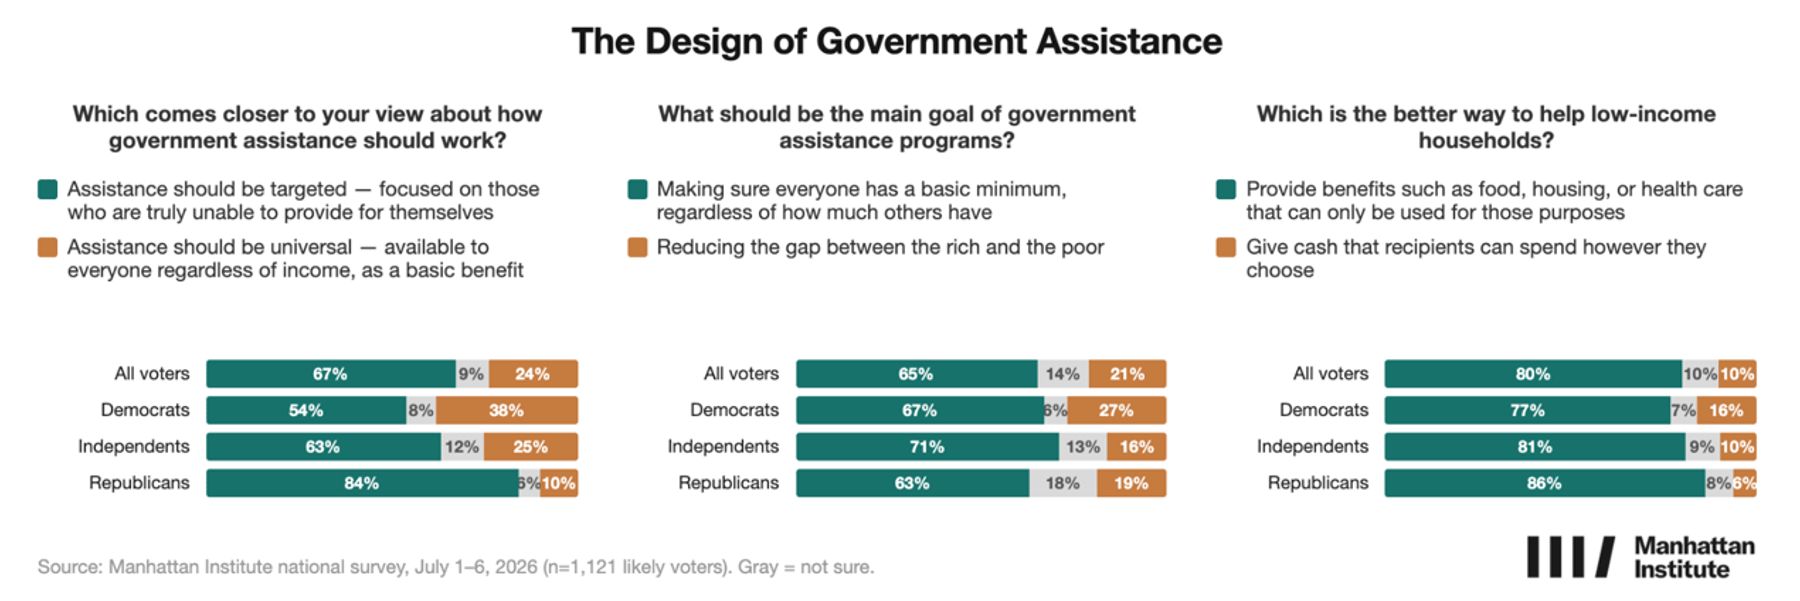
By an overwhelming majority, 67% to 24%, respondents say that government assistance should be focused on those who are truly unable to provide for themselves rather than made available universally as a basic benefit. Similarly, nearly two-thirds of voters (65%) say the primary goal of welfare programs should be ensuring that everyone can meet their basic needs, while just 21% believe the goal should be reducing the gap between rich and poor (Figure 6). Even among Democrats and self-described left-leaning voters, the basic-minimum approach commands substantially more support than redistribution.
The strongest consensus concerns how assistance should be delivered, with 80% of voters, including majorities of every demographic and political subgroup, reporting a preference for providing benefits such as food, housing, and health care that can only be used for those purposes rather than giving recipients unrestricted cash.
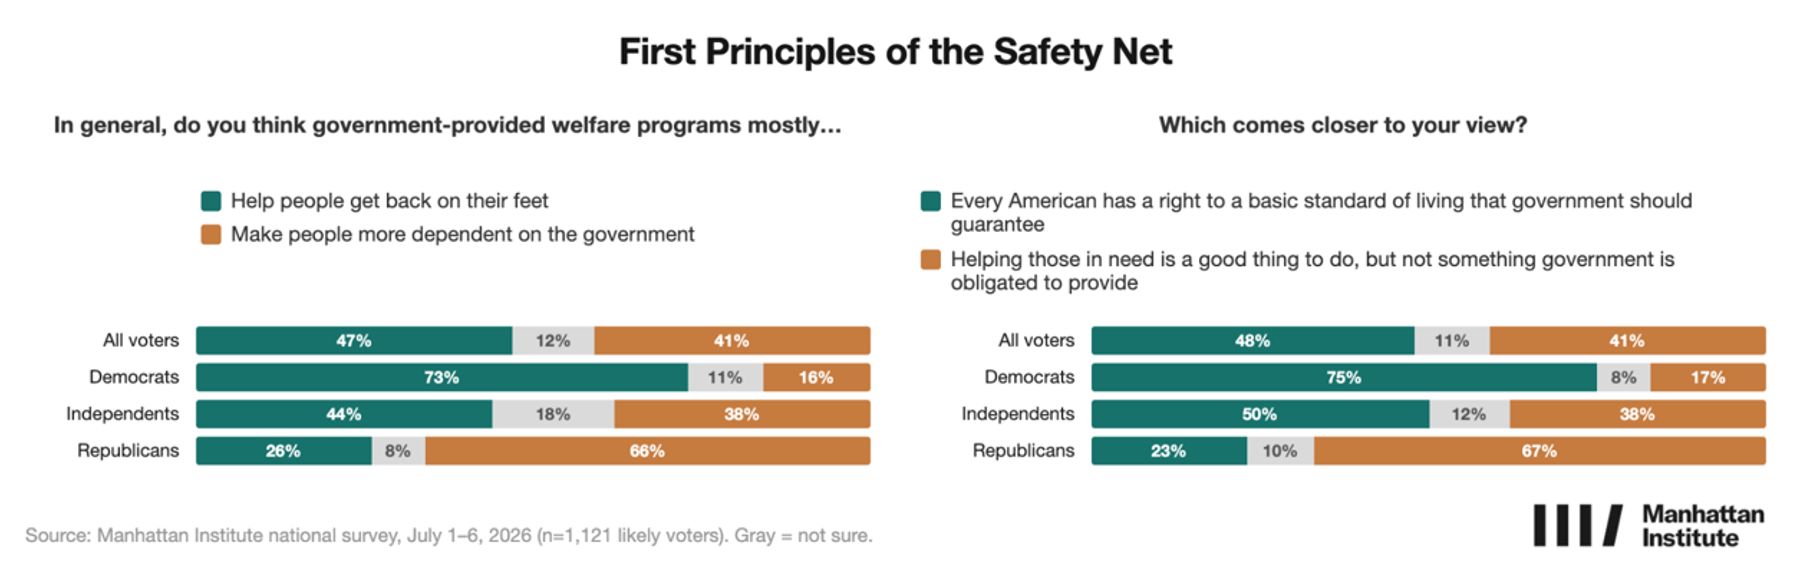
On other philosophical questions, however, the electorate is more evenly divided. Voters narrowly believe that welfare programs help people get back on their feet rather than make them more dependent on government (47% to 41%), and they are similarly split over whether government has an obligation to guarantee every American a basic standard of living (48%) or whether doing so is a good deed but not an obligation (41%) (Figure 7).
Figure 7
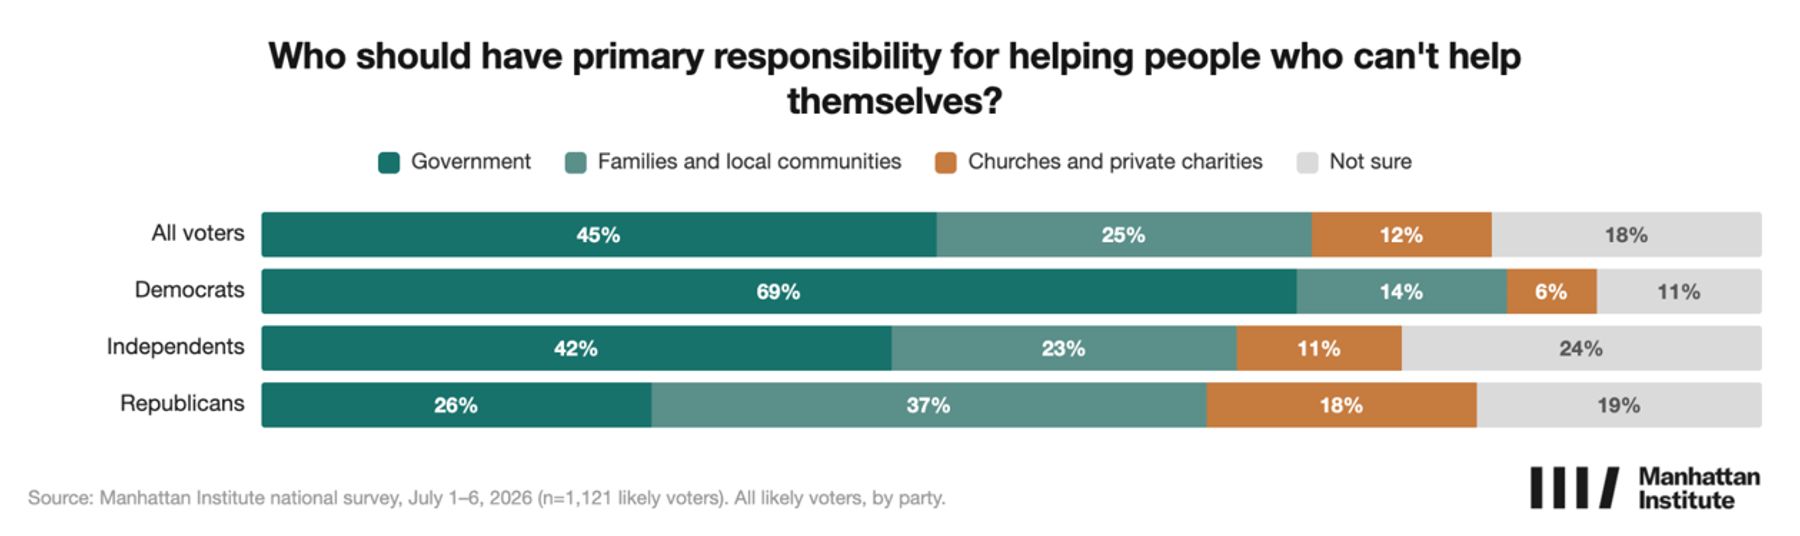
Americans are further divided over who bears the primary responsibility for helping those who cannot help themselves: 45% say government, while a combined 37% point first to families, communities, churches, and private charities (Figure 8).
Figure 8
These questions reveal the survey's widest partisan and racial divides. Democrats overwhelmingly support a government-guaranteed standard of living (75% to 17%), while Republicans reject it by nearly the same margin (67% to 23%). Black voters are also substantially more likely than the electorate overall to say welfare helps people get back on their feet (63% to 24%) and that guaranteeing a basic standard of living is a government responsibility (62% to 27%).
Age is one of the strongest predictors of attitudes toward the welfare state. Across nearly every first-principles question, voters under age 35 express a more expansive view of government's role than older Americans. Younger voters are substantially more likely to believe that welfare programs help people get back on their feet (63%), compared to voters age 65-and-up (46%). Younger voters are also more supportive of a government guarantee of a basic standard of living (64%) than voters age 65-and-up (39%) and favor universal rather than targeted government assistance by a 46% to 41% margin.
Voters are skeptical of the fiscal tradeoffs required to expand the welfare state, with just 10% of voters supporting raising taxes to pay for more generous benefits, while 41% would prefer reducing other government spending, and 33% would decline to expand benefits altogether. When told that countries with the most generous universal benefits pay for them through higher taxes on most households, including middle- and working-class families, only 13% of voters would accept higher taxes on families like theirs. These findings suggest that the broad public consensus underpinning Nordic-style welfare states—universal benefits financed by higher taxes on households across the income distribution—has little support among American voters.
Universal Basic Income
Universal basic income (UBI) lacks broad bipartisan support, with Democrats backing the proposal while independents and Republicans largely oppose it. Voters oppose a UBI—described as a monthly payment to every adult regardless of income or work that would require significant government funding—by a 50% to 32% margin, with strong opposition (36%) more than twice as common as strong support (15%). A version of UBI that would replace most existing welfare programs rather than supplement them performs no better, with 52% opposed and 30% in favor (Figure 9).
Figure 9
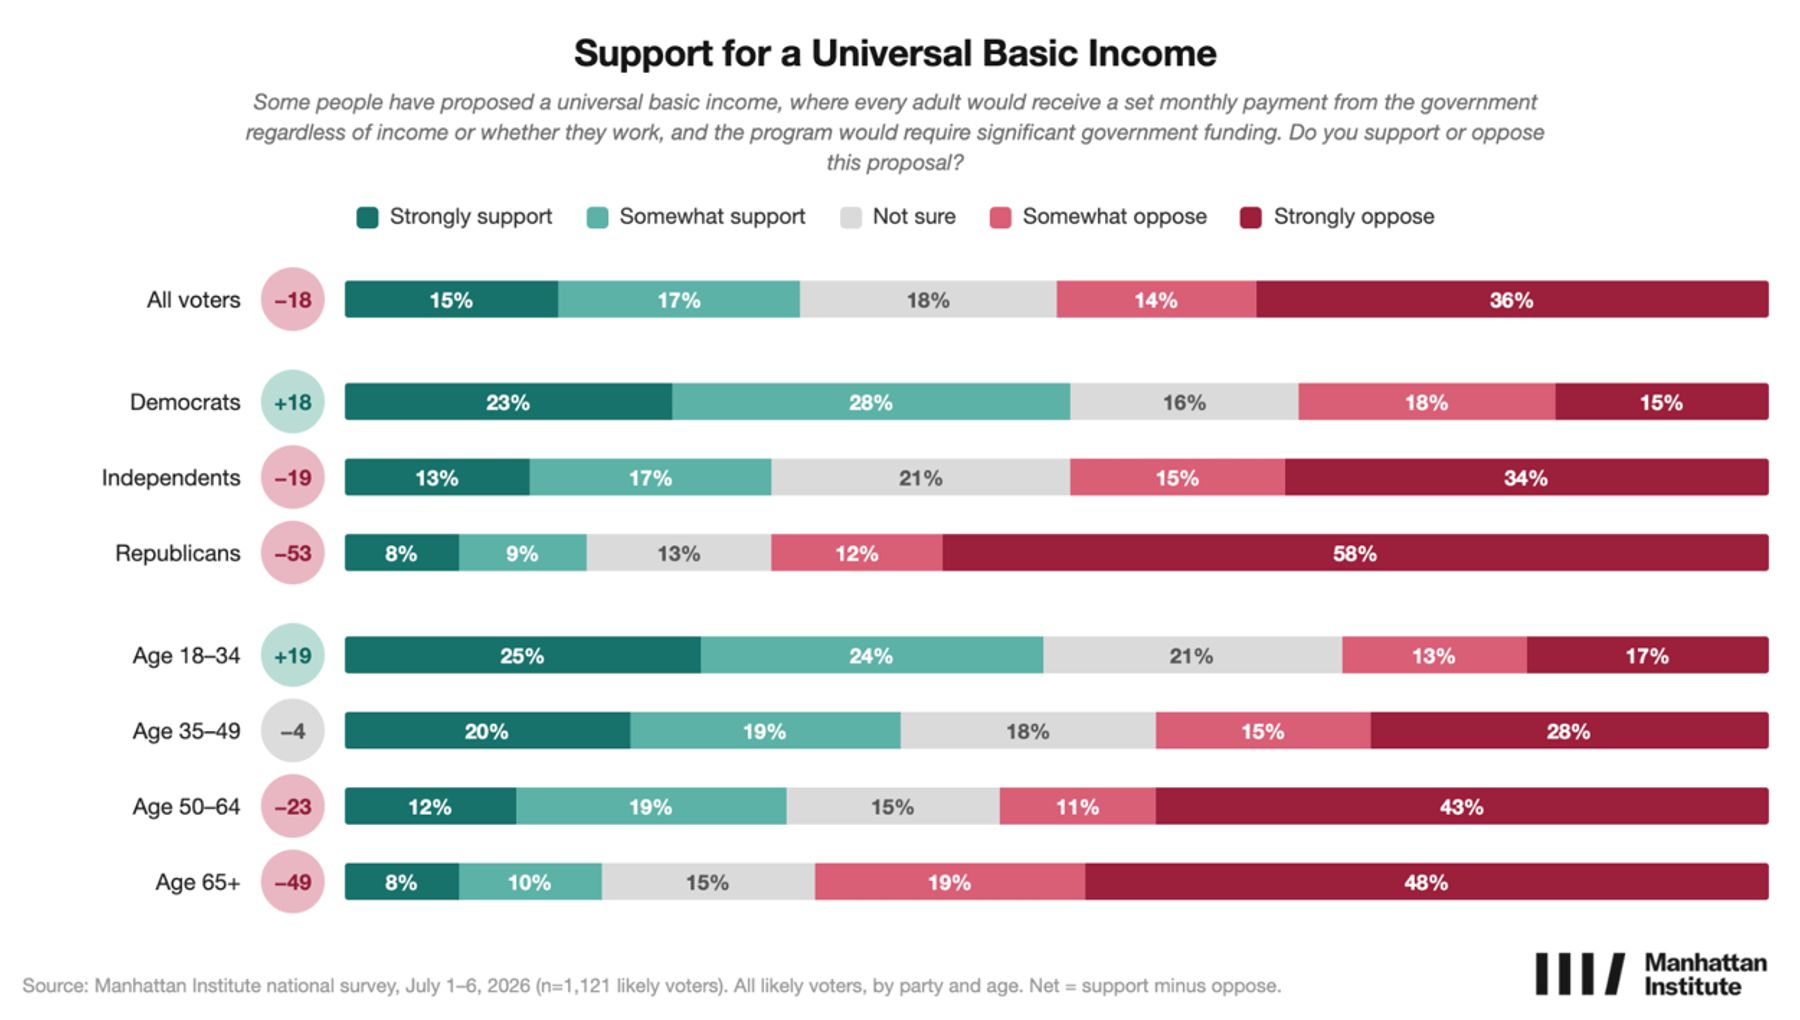
The most striking finding about UBI is the sharp generational divide. Voters under age 35 are the only age group to support UBI, backing it 49% to 30%, while opposition increases steadily with age. Among voters age 65 and older, UBI is rejected by nearly four to one (67% to 18%).
Democrats favor the proposal (51% to 33%), while independents oppose it (49% to 30%) and Republicans reject it overwhelmingly (70% to 17%). Education, by contrast, has relatively little effect on attitudes toward UBI, with college and non-college voters expressing similar levels of opposition.
Waste, Fraud, and Abuse
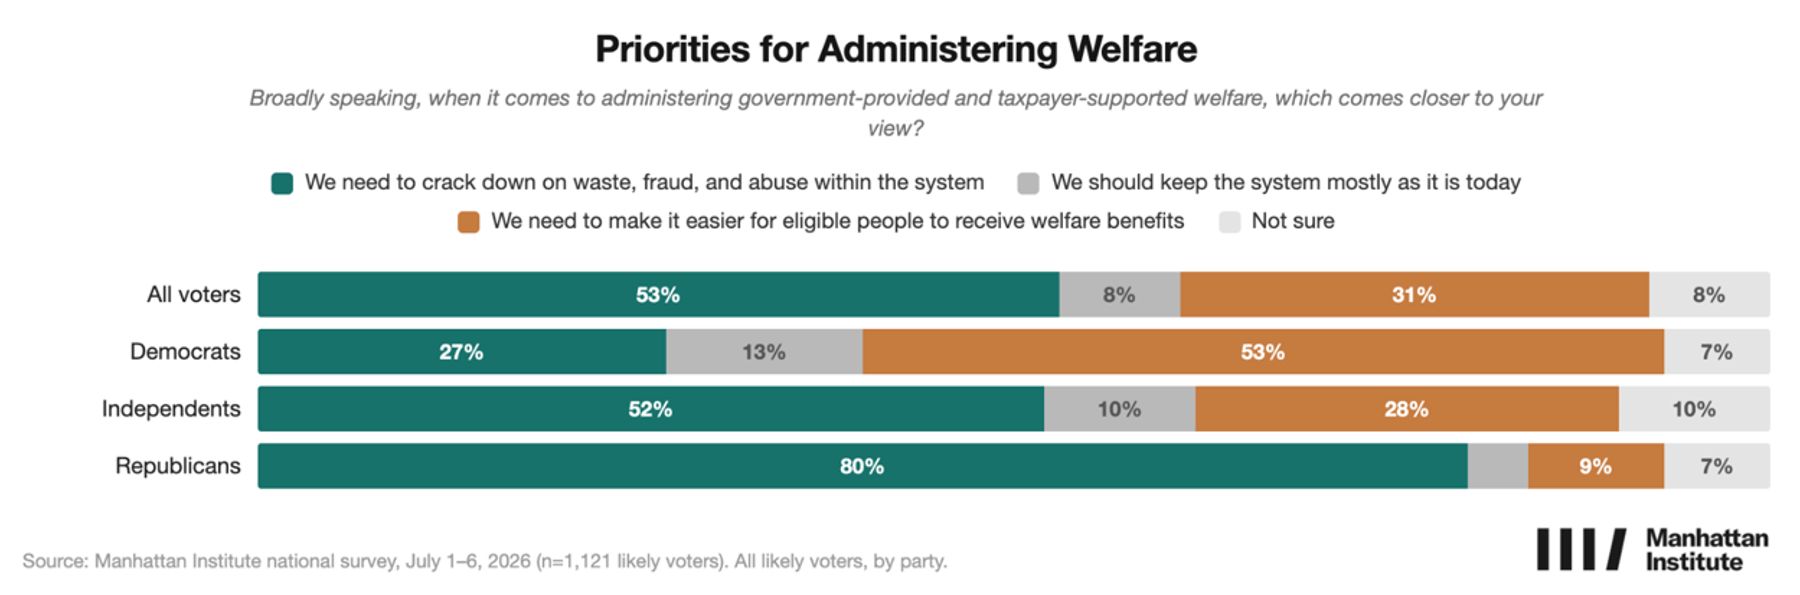
Concerns about waste, fraud, and abuse emerge repeatedly throughout the survey and appear central to how Americans think about the welfare system. When asked to choose between cracking down on waste, fraud, and abuse or making it easier for eligible people to receive benefits, a majority of voters (53%) prioritize enforcement, compared with 31% who prefer making benefits easier to access. Independents favor cracking down on waste, fraud, and abuse by nearly two to one (52% to 28%), while Democrats prioritize easier access (53% to 27%) (Figure 10).
Figure 10
Nearly half of voters (48%) believe that most welfare spending is lost to waste, fraud, and abuse rather than reaching people who truly need assistance (37%). That view is shared by a plurality of independents (46% to 38%) and moderates (42% to 37%), while black voters are the principal exception, with nearly half (49%) believing most welfare dollars reach those in need.
These concerns are particularly evident when voters consider the Supplemental Nutrition Assistance Program (SNAP), also known as the federal food stamps program. Nearly three-quarters (73%) say that reducing waste, fraud, and abuse in the program should be an important priority for Congress, including 71% of independents and 57% of Democrats. Three-quarters of voters (75%) also report being at least somewhat concerned about fraud within SNAP, while a 42% plurality believes that the federal government is currently doing too little to address it.
Despite these concerns, neither party has established a clear advantage on the issue. When asked which party they trust more to deal with welfare programs responsibly, 39% choose Democrats, and 36% choose Republicans, while 26% trust neither party. Democrats enjoy a commanding advantage among black voters (61% to 13%) and lead among college graduates (44% to 32%), while Republicans hold a narrow edge among non-college voters (38% to 35%). Among independents, nearly half (46%) trust neither party, suggesting that concerns about waste, fraud, and abuse remain politically salient but that neither party has yet established ownership of the issue.
SNAP Reform
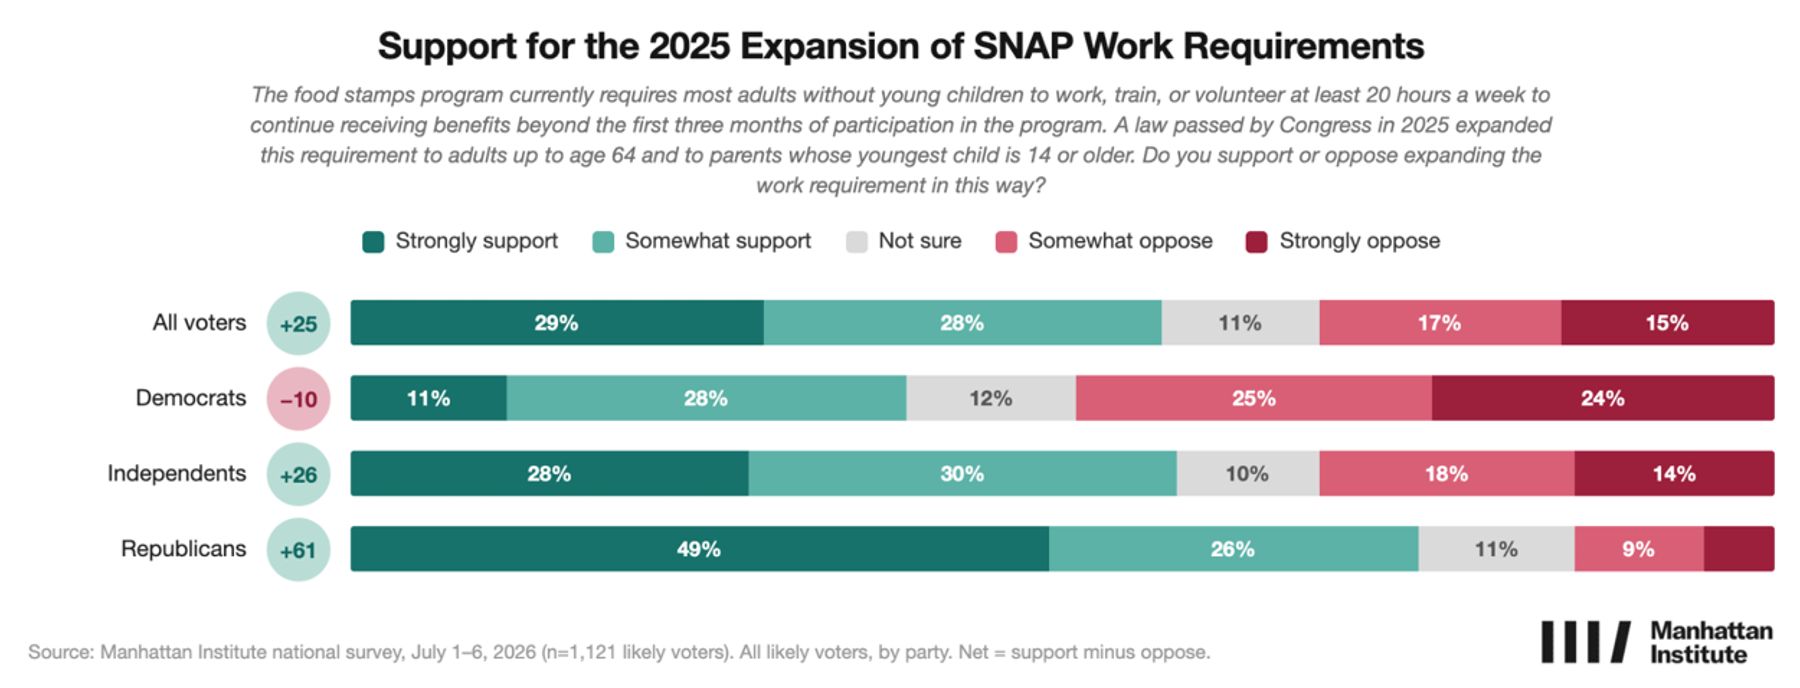
Congress’s 2025 expansion of SNAP work requirements—which extended the program's 20-hour weekly work, training, or volunteer requirement to able-bodied adults up to age 64 and to parents whose youngest child is age 14 or older—is supported by a 57% to 32% margin. Independents support the reform 58% to 32%, while Democrats oppose it narrowly (49% to 39%) (Figure 11). There is virtually no education divide, with majorities of both college and non-college voters supporting the policy.
Figure 11
Voters also express concern about the program's continued growth. After learning that the share of Americans receiving SNAP has roughly doubled since 2000—from approximately one in seventeen Americans to one in eight—55% say that the increase is a bad thing, compared with just 7% who say it is good. A plurality of Democrats (41%) and a majority of independents (53%) also view the increase negatively. Asked whether elevated post-pandemic enrollment should have declined as the economy recovered, however, the electorate is evenly divided: 45% believe enrollment should have fallen, while 44% say current participation remains appropriate because many Americans still need assistance.
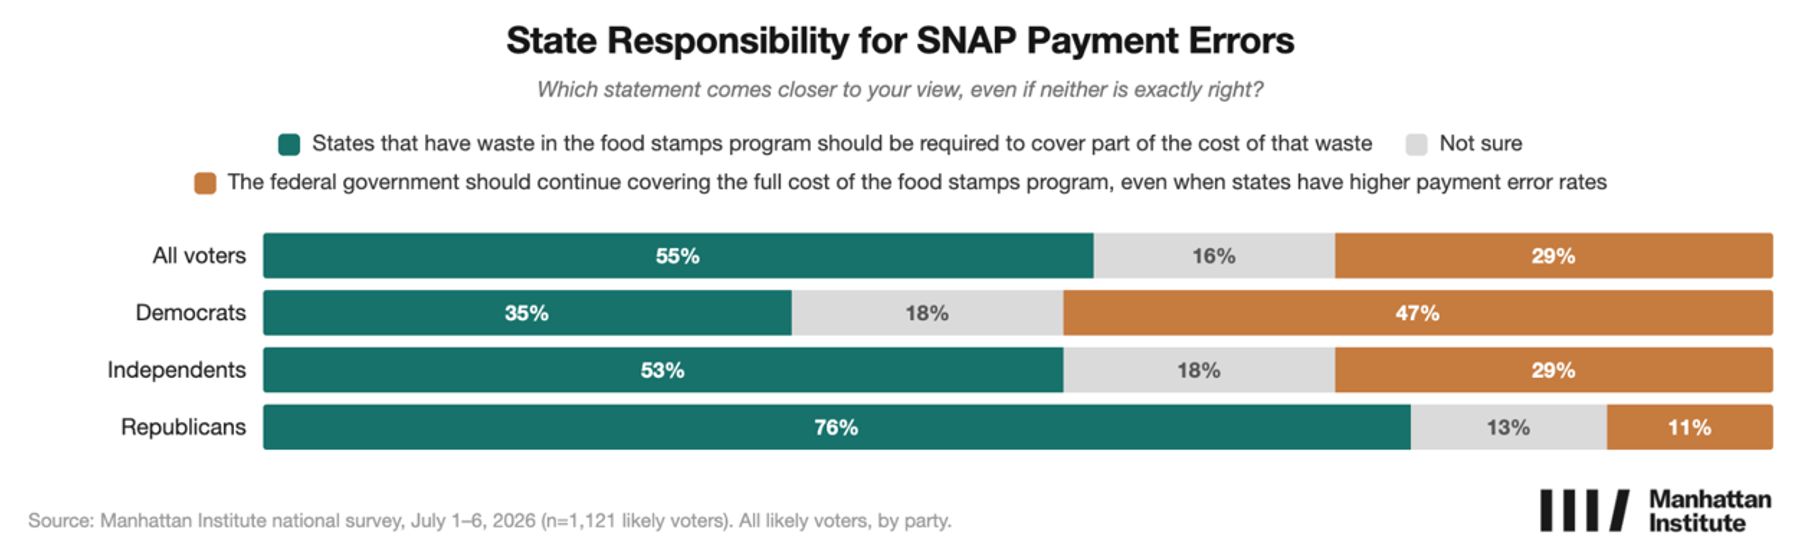
Congress’s 2025 SNAP reforms requiring states to bear greater responsibility for administering SNAP effectively maintain broad support (55% to 29% opposed), with voters supporting the requirement for states with high payment error rates to cover part of the cost of those errors. When asked about the current legislative debate over delaying implementation, voters oppose delaying state cost-sharing requirements by a 46% to 27% margin, with independents opposing a delay 45% to 28% (Figure 12).
Figure 12
Notably, these views are not confined to voters with no personal experience of the program. Three in ten respondents report that they or someone in their household either currently receives SNAP benefits (15%) or has received them in the past (15%).
Death Penalty
Capital punishment commands majority support among American voters. Nearly six in ten (58%) support making the death penalty available for select egregious crimes, compared with 28% who oppose it.
Republicans support capital punishment overwhelmingly (78% to 10%), and independents favor it by more than two to one (62% to 27%), while Democrats oppose it (48% oppose to 39% support).
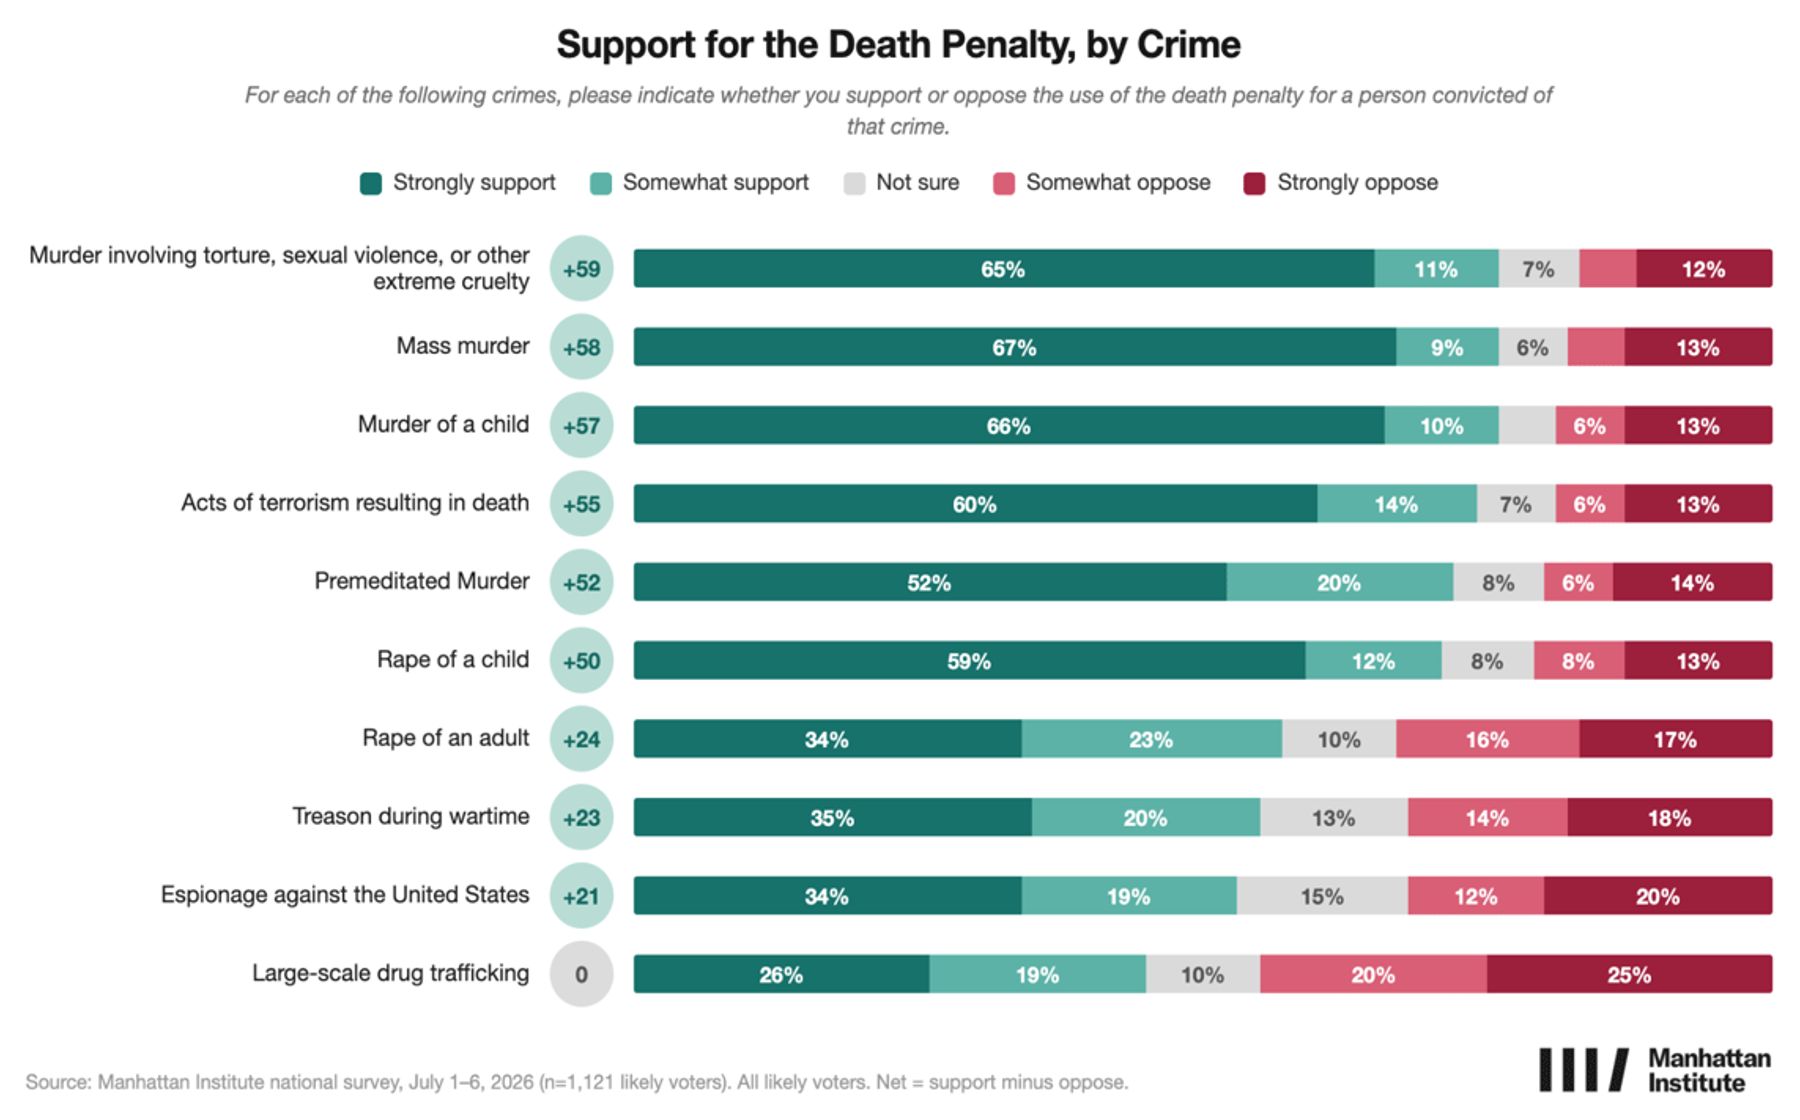
Support for the death penalty depends heavily on the underlying offense. Roughly three-quarters of voters support capital punishment for mass murder (76%), murder involving torture or extreme cruelty (76%), the murder of a child (76%), deadly acts of terrorism (74%), premeditated murder (72%), and the rape of a child (71%). Support is more modest for the rape of an adult (57%), treason during wartime (55%), and espionage (53%), while voters are evenly divided over applying the death penalty to large-scale drug trafficking (45% support, 45% oppose), suggesting that public support is strongest when capital punishment is reserved for the most serious violent crimes (Figure 13).
Figure 13
Abolition of Police, Prisons, and Borders
The survey tested public attitudes toward three ideas associated with the abolitionist politics that have gained prominence in recent years: abolishing police departments, abolishing prisons, and abolishing the borders of the United States. Each proposal is soundly rejected by roughly four in five voters (Figures 14–16)
Figure 14
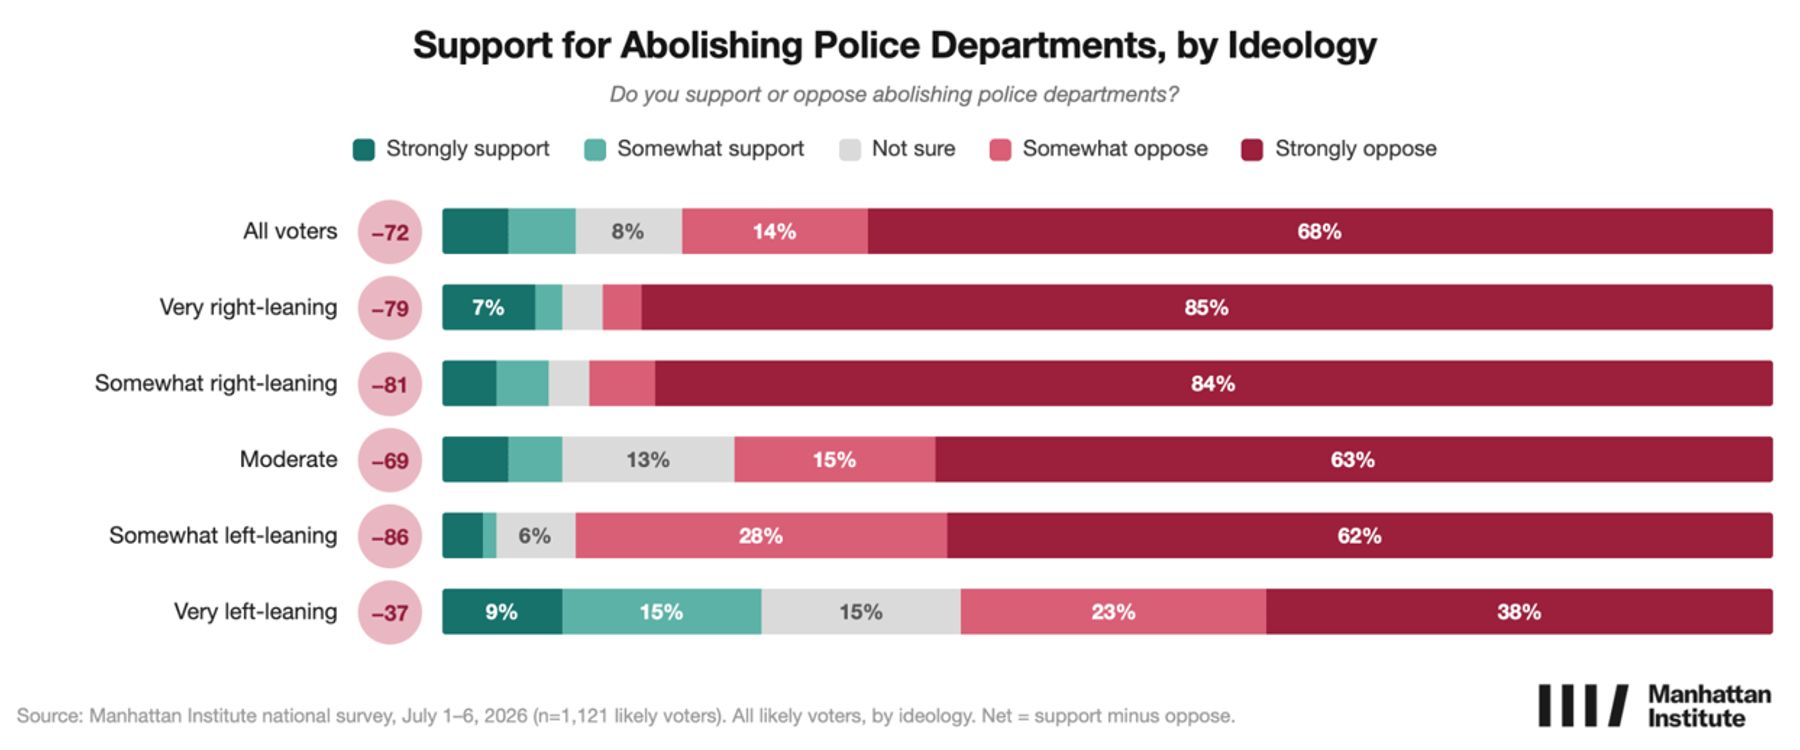
Figure 15
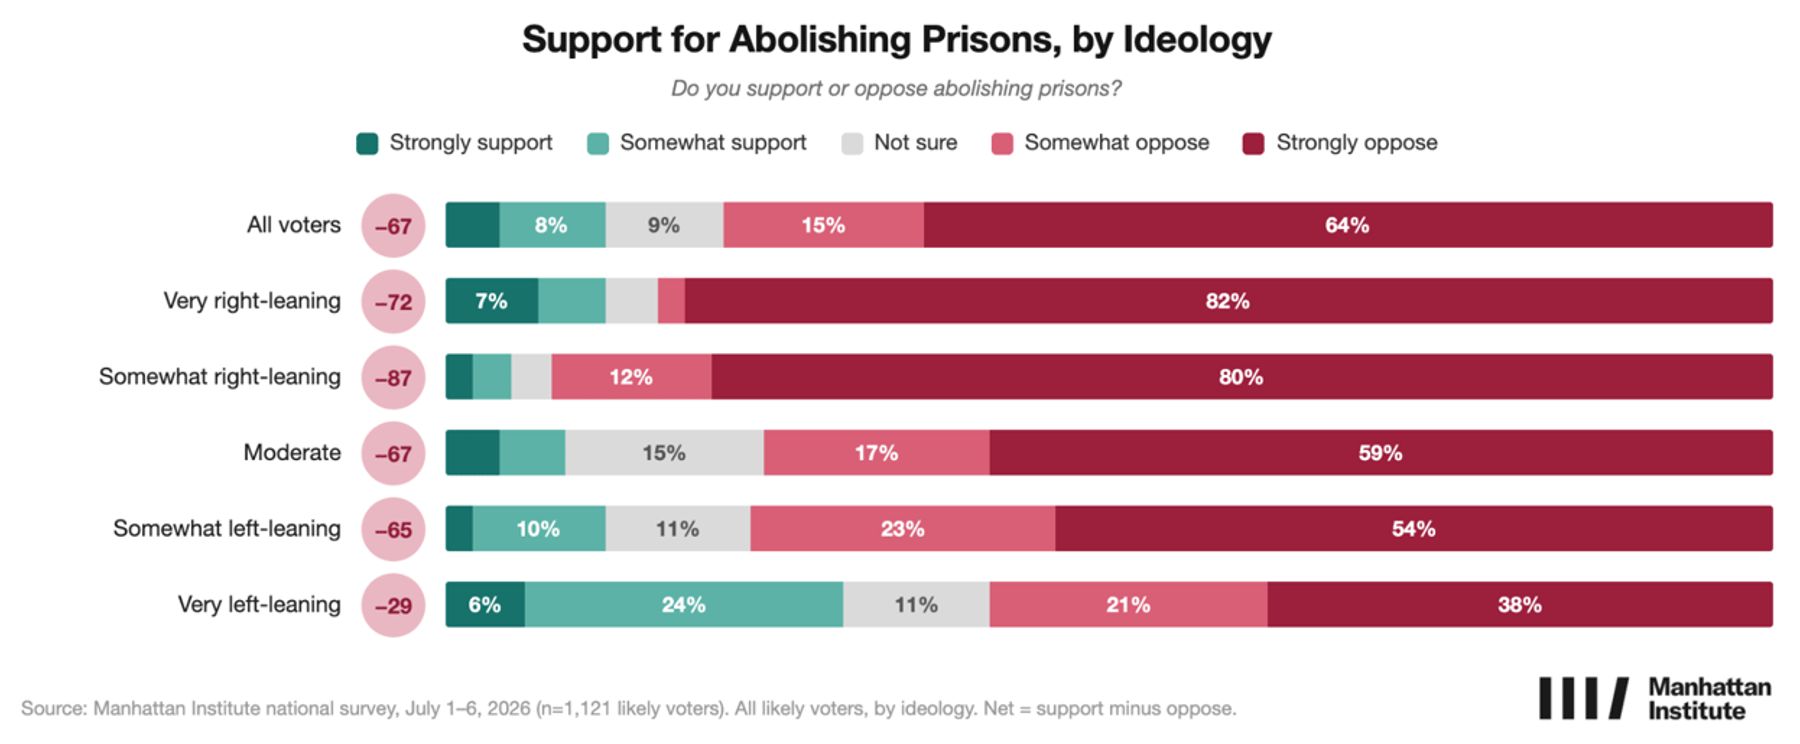
Figure 16
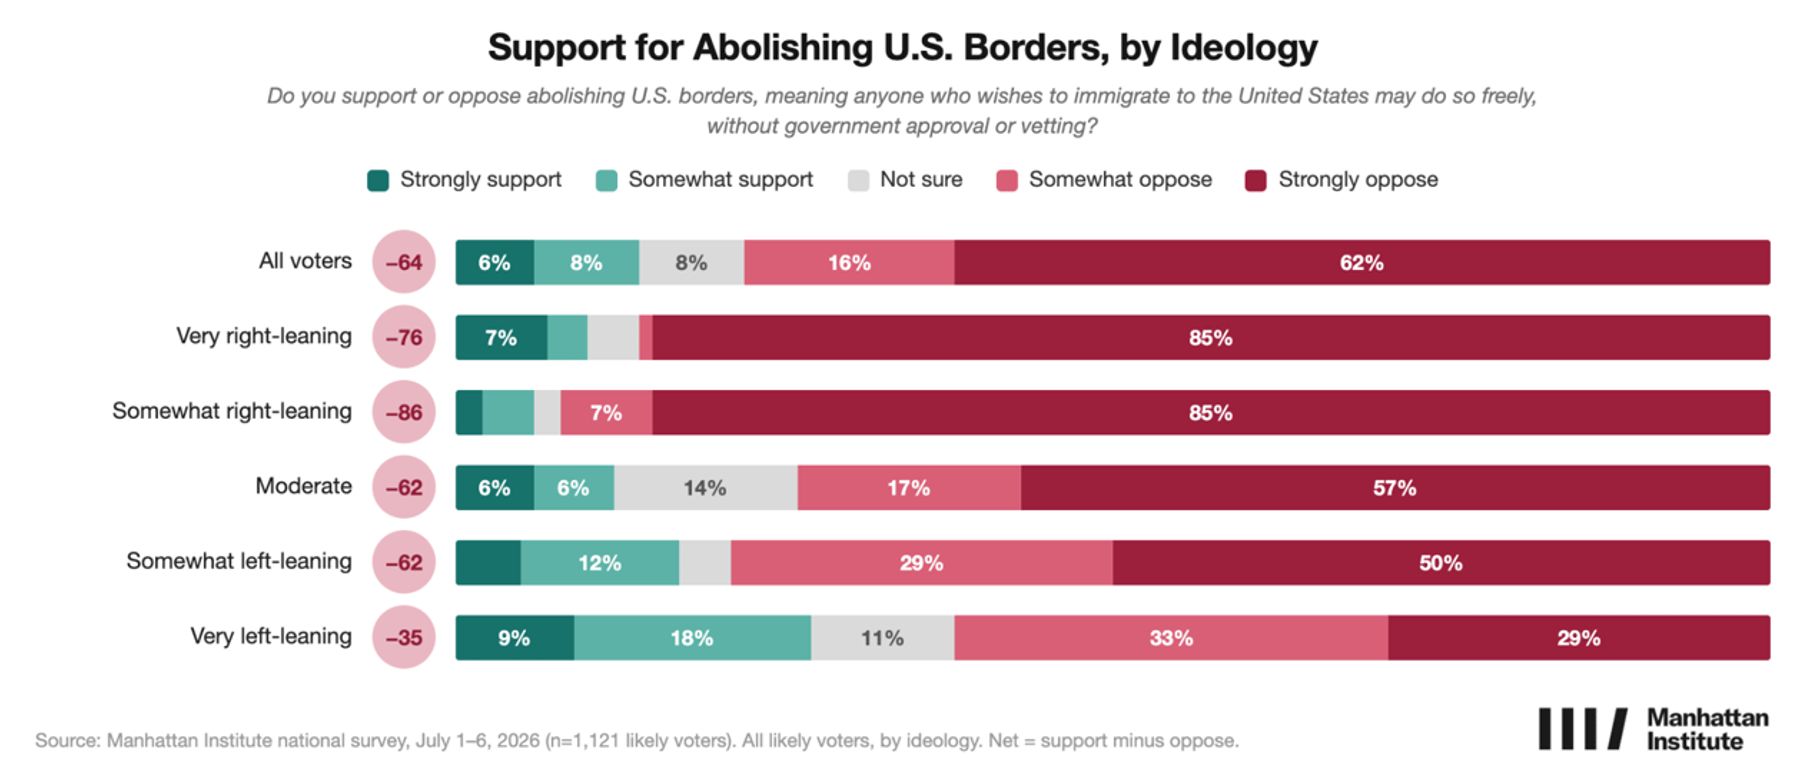
82% oppose abolishing police departments, including 68% who strongly oppose it while 79% oppose abolishing prisons and 78% oppose abolishing U.S. borders.
Opposition extends well beyond Republicans. Democrats oppose abolishing police departments by a 76% to 13% margin, abolishing prisons by a 73% to 15% margin, and abolishing U.S. borders by a 69% to 21% margin. Even among self-described very left-leaning voters, majorities oppose abolishing police departments (61% to 24%), prisons (59% to 30%), and U.S. borders (62% to 27%).
The findings suggest that these abolitionist proposals remain well outside the American political mainstream, drawing majority opposition even among the constituencies most closely associated with them.
Are you interested in supporting the Manhattan Institute’s public-interest research and journalism? As a 501(c)(3) nonprofit, donations in support of MI and its scholars’ work are fully tax-deductible as provided by law (EIN #13-2912529).