A Comprehensive Federal Budget Plan to Avert a Debt Crisis

Photo: Manuel Augusto Moreno / Moment via Getty Images
Note: This report updates the author’s 2018 long-term debt-stabilization proposal and includes additional details and savings recommendations.
Executive Summary
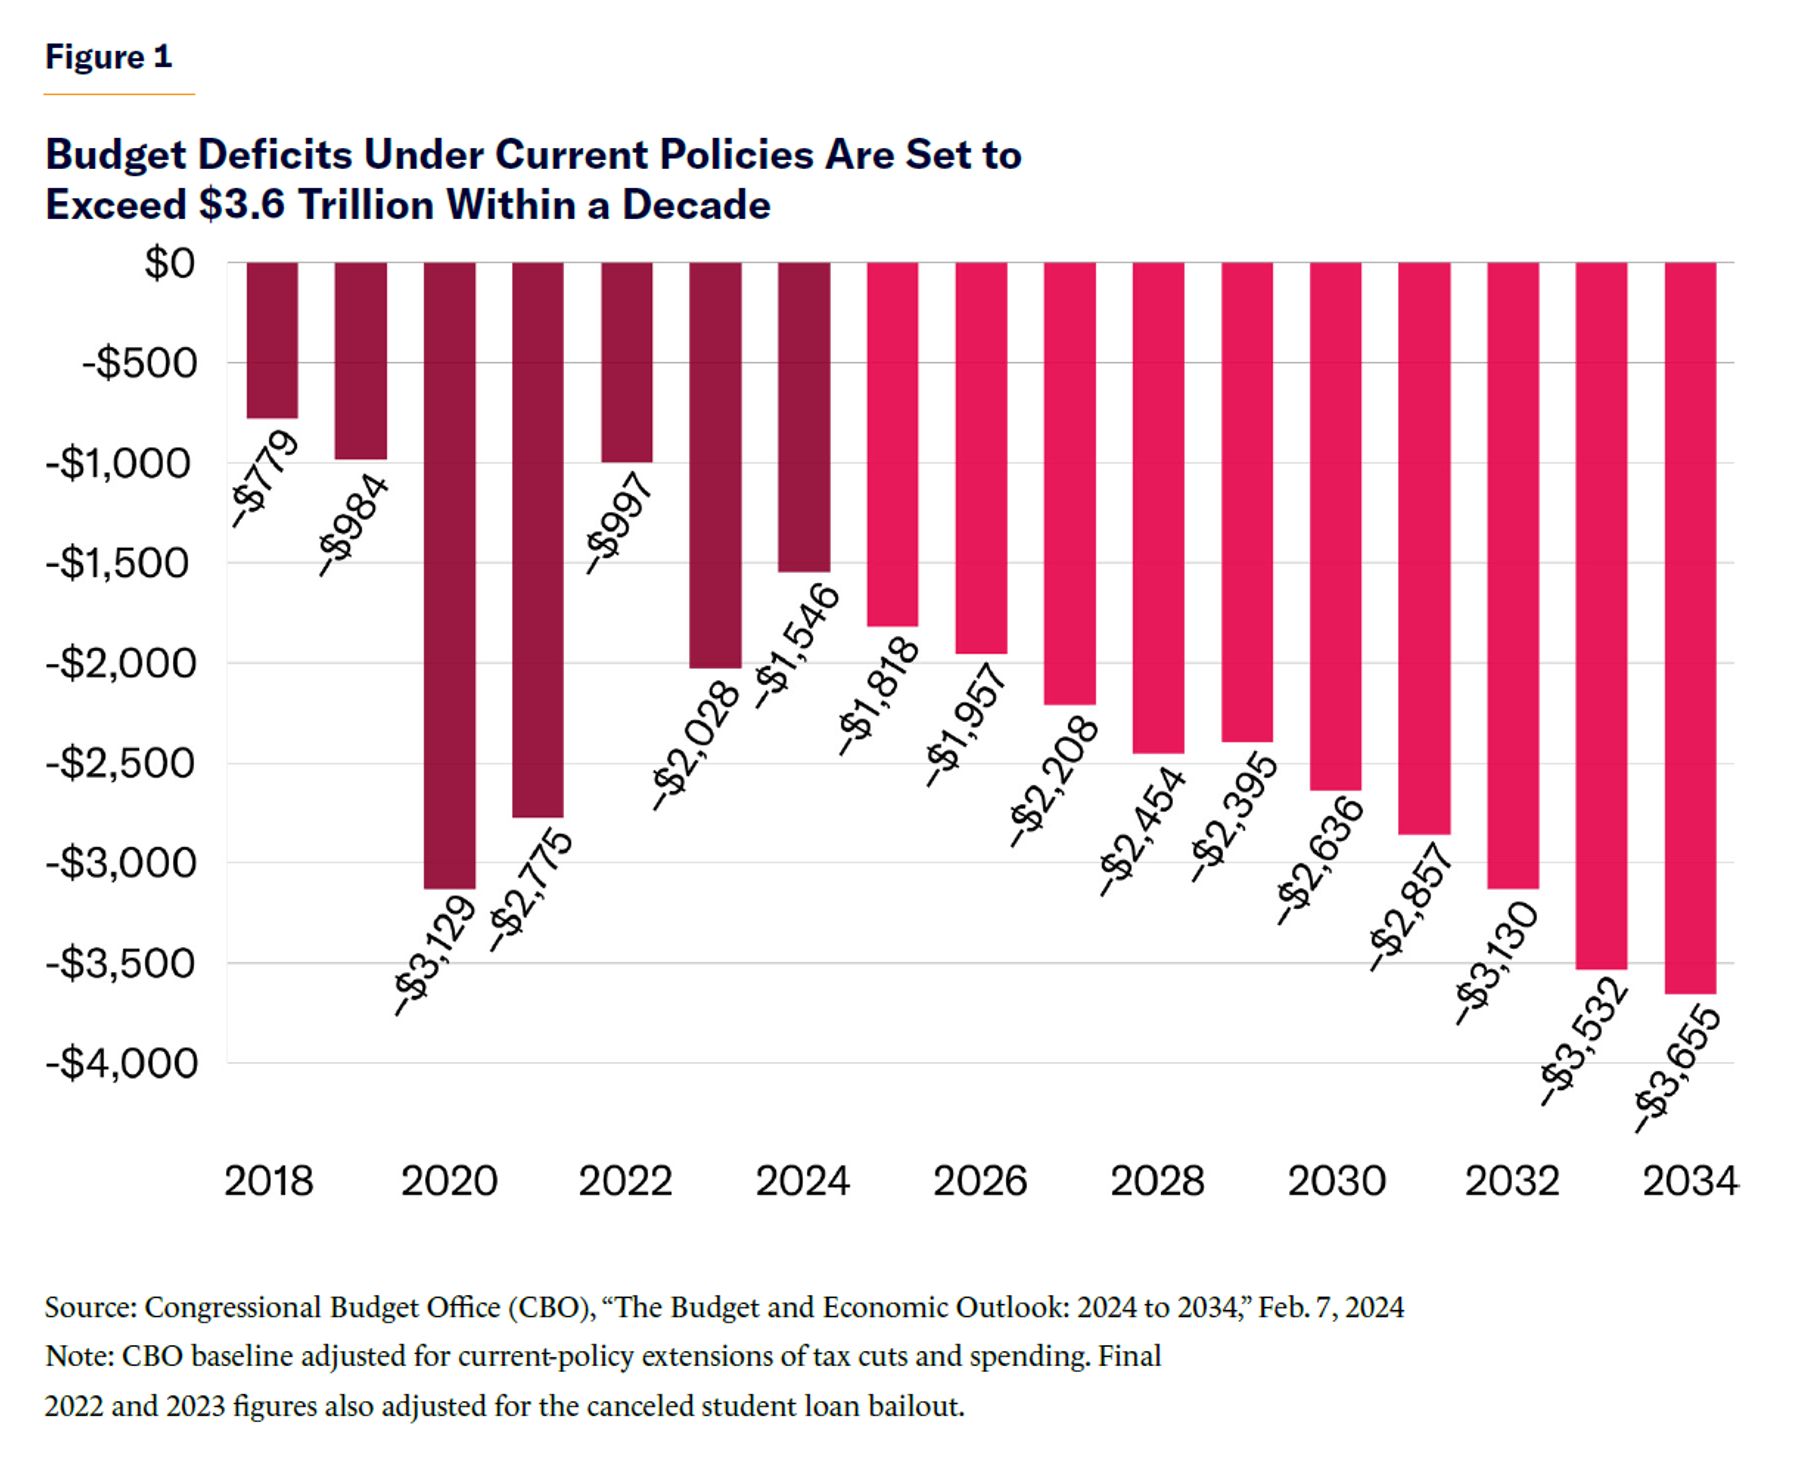
Annual budget deficits doubled to $2 trillion over 2022–23 and are headed toward $3 trillion a decade from now. Social Security and Medicare face a combined $124 trillion cash deficit over the next 30 years. The national debt is projected to soar past 165% of gross domestic product (GDP) within three decades—or as high as 300% of GDP if interest rates remain elevated and Congress extends expiring policies. At that point, interest costs could consume half to three-quarters of all federal tax revenues. Unless reforms are enacted, Washington’s escalating borrowing demands will come to overwhelm the capacity of financial markets to supply this much lending at plausible interest rates. When that event occurs, or even approaches, interest rates will soar and the federal government will not be able to pay its bills, with dire consequences for the U.S. economy.
In short, Washington is on a totally unsustainable fiscal path, and a debt crisis is coming.
There is a way to avert this debt crisis. However, lawmakers must act quickly to reform Social Security and Medicare, as every year 4 million more baby boomers retire into those programs, and the eventual cost of reform rises by trillions of dollars. This report presents a realistic, nonpartisan, and specific 30-year blueprint—each element of which is “scored” using data from the Congressional Budget Office (CBO)—to stabilize the national debt at the current 100% of GDP, and even reduce it eventually.
The fiscal consolidation in this report calls for trimming some Social Security and Medicare benefits for upper-income recipients. Some taxes would rise. Spending on defense would continue to fall as a share of the economy. In short, there is something in this blueprint for everyone to oppose. But letting the country plunge into a debt crisis would be far more painful than this blueprint’s reforms.
Introduction
Annual budget deficits doubled to $2 trillion over 2022–23 and are headed toward $3 trillion a decade from now (Figure 1).[1] Social Security and Medicare face a combined $124 trillion cash deficit over the next 30 years. The Congressional Budget Office (CBO) projects that the national debt will soar past 165% of gross domestic product (GDP) within three decades—or as high as 300% of GDP if interest rates remain elevated and Congress extends expiring policies.[2] At that point, interest costs could consume half to three-quarters of all federal tax revenues. Unless reforms are enacted, Washington’s escalating borrowing demands will, at some point, overwhelm the capacity of financial markets to supply this much lending at plausible interest rates. When that event occurs, or even approaches, interest rates will soar and the federal government will not be able to pay its bills, with dire consequences for the U.S. economy.
In short, Washington is on a totally unsustainable fiscal path that virtually ensures some version of a debt crisis. Yet most lawmakers tasked with the responsibility of averting that outcome express little interest in doing so. No recent president has presented a specific plan to stabilize the long-term budget, and Presidents Trump and Biden each added trillions in new debt. Congress continues to drive up federal spending, and is soon likely to renew trillions of dollars in expiring tax cuts. President Biden and Republican lawmakers compete to see who can most vociferously oppose any reforms to Social Security and Medicare’s massive shortfalls, as well as any new taxes for all but the top-earning 5% of earners. Deficits rise by $1 trillion annually while proposals to trim even a few billion dollars are met with overwhelming resistance. Surveys show that voters continue to demand even more tax cuts and spending hikes.[3]
Thus, American presidents, lawmakers, and even voters are in deep denial of the fiscal reckoning that is ahead. Interest rates are already rising, and politicians have made popular long-term spending commitments that vastly exceed what they are willing to tax and what the financial markets will be able to lend. The only decision is whether Washington gradually imposes savings proposals on its own terms, or whether it waits for a debt crisis to impose much more drastic and painful savings reforms.
There is a way to avert this debt crisis without historic broad-based tax increases or significant cuts to antipoverty and social spending. However, lawmakers must act quickly to reform Social Security and Medicare, as every year 4 million more baby boomers retire into those programs and the eventual cost of reform rises by trillions of dollars.
This report presents a specific 30-year blueprint—each element of which is “scored” against the most recent CBO Long-Term Budget Outlook—to stabilize the national debt at the current 100% of GDP. Section I identifies the drivers of long-term debt. Section II addresses false “easy” solutions deployed to avoid real reform. Section III presents the blueprint. Section IV defends the blueprint against both conservative and liberal objections.
The approach of this report requires a careful explanation. Yes, the current political environment renders virtually every significant deficit reduction proposal fatally unpopular and unpassable (otherwise, they would already have been enacted). However, at some point down the road—whether due to a courageous Congress, a voter uprising, or (most likely) fiscal constraints imposed by financial markets and a weak economy—Congress and the White House will likely be forced to confront deficits and placed previously rejected savings options back onto the table. When Congress finally commits to stabilizing the debt, this report will provide a specific, scored, and potentially bipartisan proposal to achieve that goal.
In other words, this report does not propose yet another hyper-partisan conservative or liberal fantasy scenario. It does not necessarily even feature reforms that the author would select if political compromise were unnecessary. Nor is it just a set of generic (and unrealistic) long-term spending and tax targets without detailing specific programmatic reforms that could meet those targets. This report is intended to provide a specific, well-crafted blueprint that could realistically appeal to both parties if they ever commit themselves to stabilizing the debt.
The fiscal consolidation in this report calls for some Social Security and Medicare benefits for upper-income recipients to be trimmed. Some taxes would rise. Spending on defense would continue to fall as a share of the economy. In short, there is something in this blueprint for everyone to oppose. But letting the country plunge into a debt crisis would be far more painful than this blueprint’s reforms.
I. Why the Debt Is Soaring
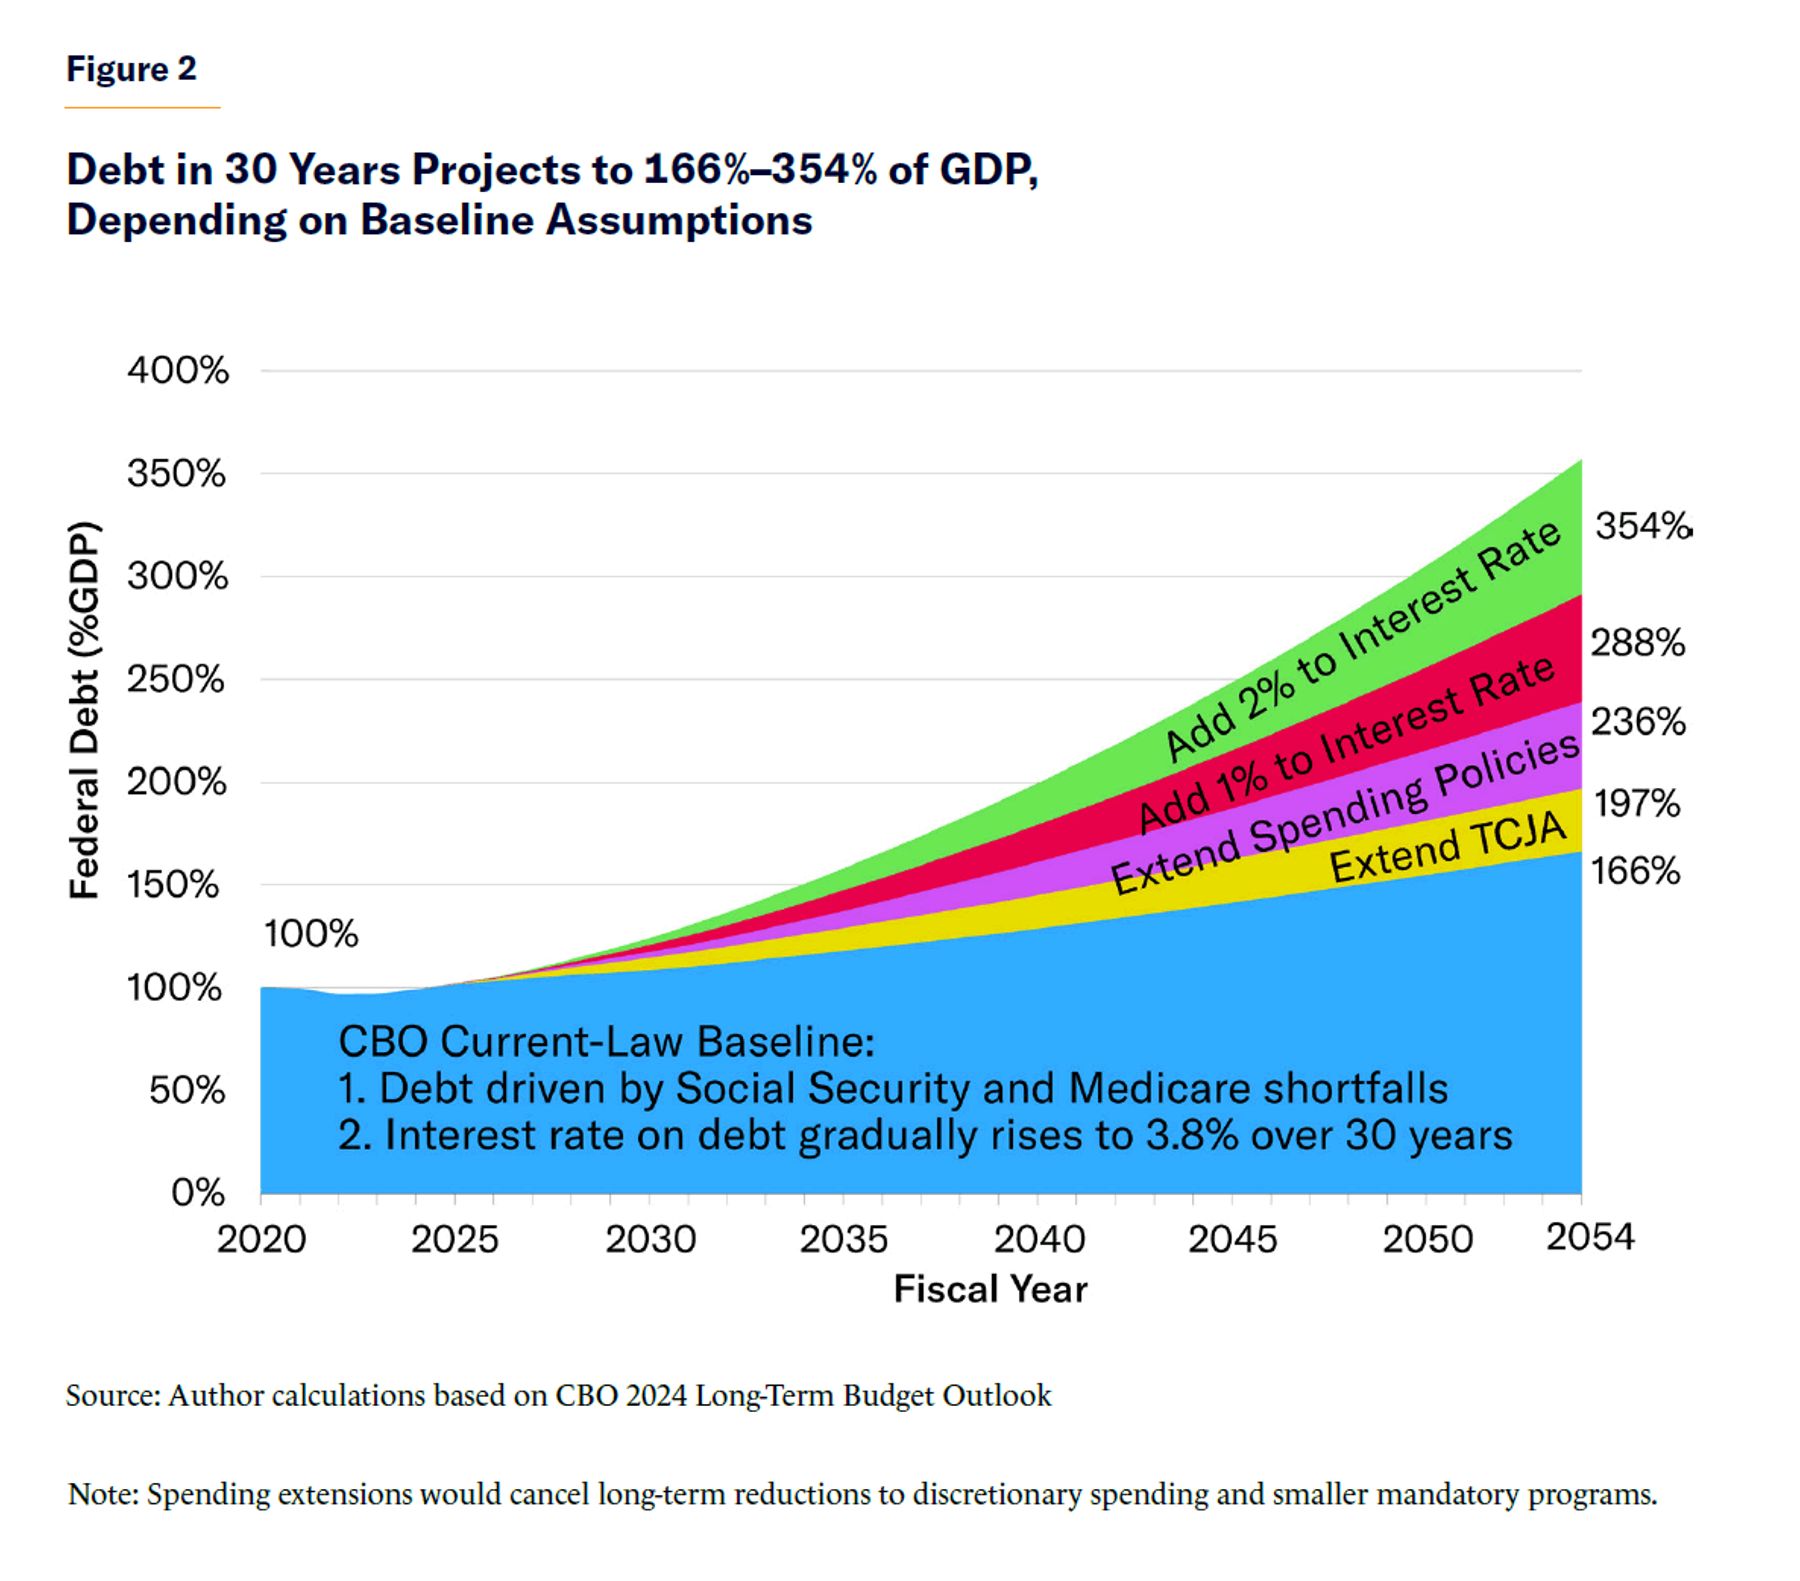
From the mid-1950s through 2008, the national debt held by the public averaged 35% of GDP (typically ranging between 25% and 50%). This level of borrowing could easily be absorbed by the increasingly global financial markets, and it resulted in interest costs averaging 2% of GDP (roughly 10% of a typical federal budget). Since 2008, the great recession and the beginning of the baby-boomer retirements have nearly tripled the debt, to 100% of GDP.[4] If current policies continue, the debt is projected to reach an unprecedented 236% of GDP within 30 years.[5] Interest would become the largest federal expenditure and consume a majority of federal taxes.
Even these escalating debt estimates accept CBO’s rosy assumption that the interest rate paid on the federal debt gradually rises to 3.8% over three decades. Yet the 10-year Treasury bond (which often approximates the average rate paid on the federal debt) has already spent the first half of 2024 at 4%–5%. While the Federal Reserve is expected to reduce interest rates within the next year, both history and economic fundamentals suggest that the rate will not return to the abnormally low federal funds rates that prevailed between 2008 and 2021. Over time, interest rates are more likely to rise because of a less-accommodating Federal Reserve, retiring baby boomers moving from savers to spenders, a lessening of the global savings glut, and the economic consensus that a steeply growing federal debt will push up interest rates.[6]
Each percentage point that interest rates exceed the 3.8% baseline estimate would saddle Washington with an additional $35–$45 trillion in interest costs over three decades—nearly the cost of adding another defense department (again, that is for each percentage point). If the average rate on the federal debt rises to 5% or 6%, the federal debt could exceed 300% of GDP within three decades (Figure 2). At that point, interest on the debt would likely consume nearly all federal taxes. Higher interest rates would also affect borrowing for housing, cars, student loans, and business loans, risking a significant economic slowdown. Unlike Greece’s, the U.S. debt would be too large to be easily absorbed by the global economy.
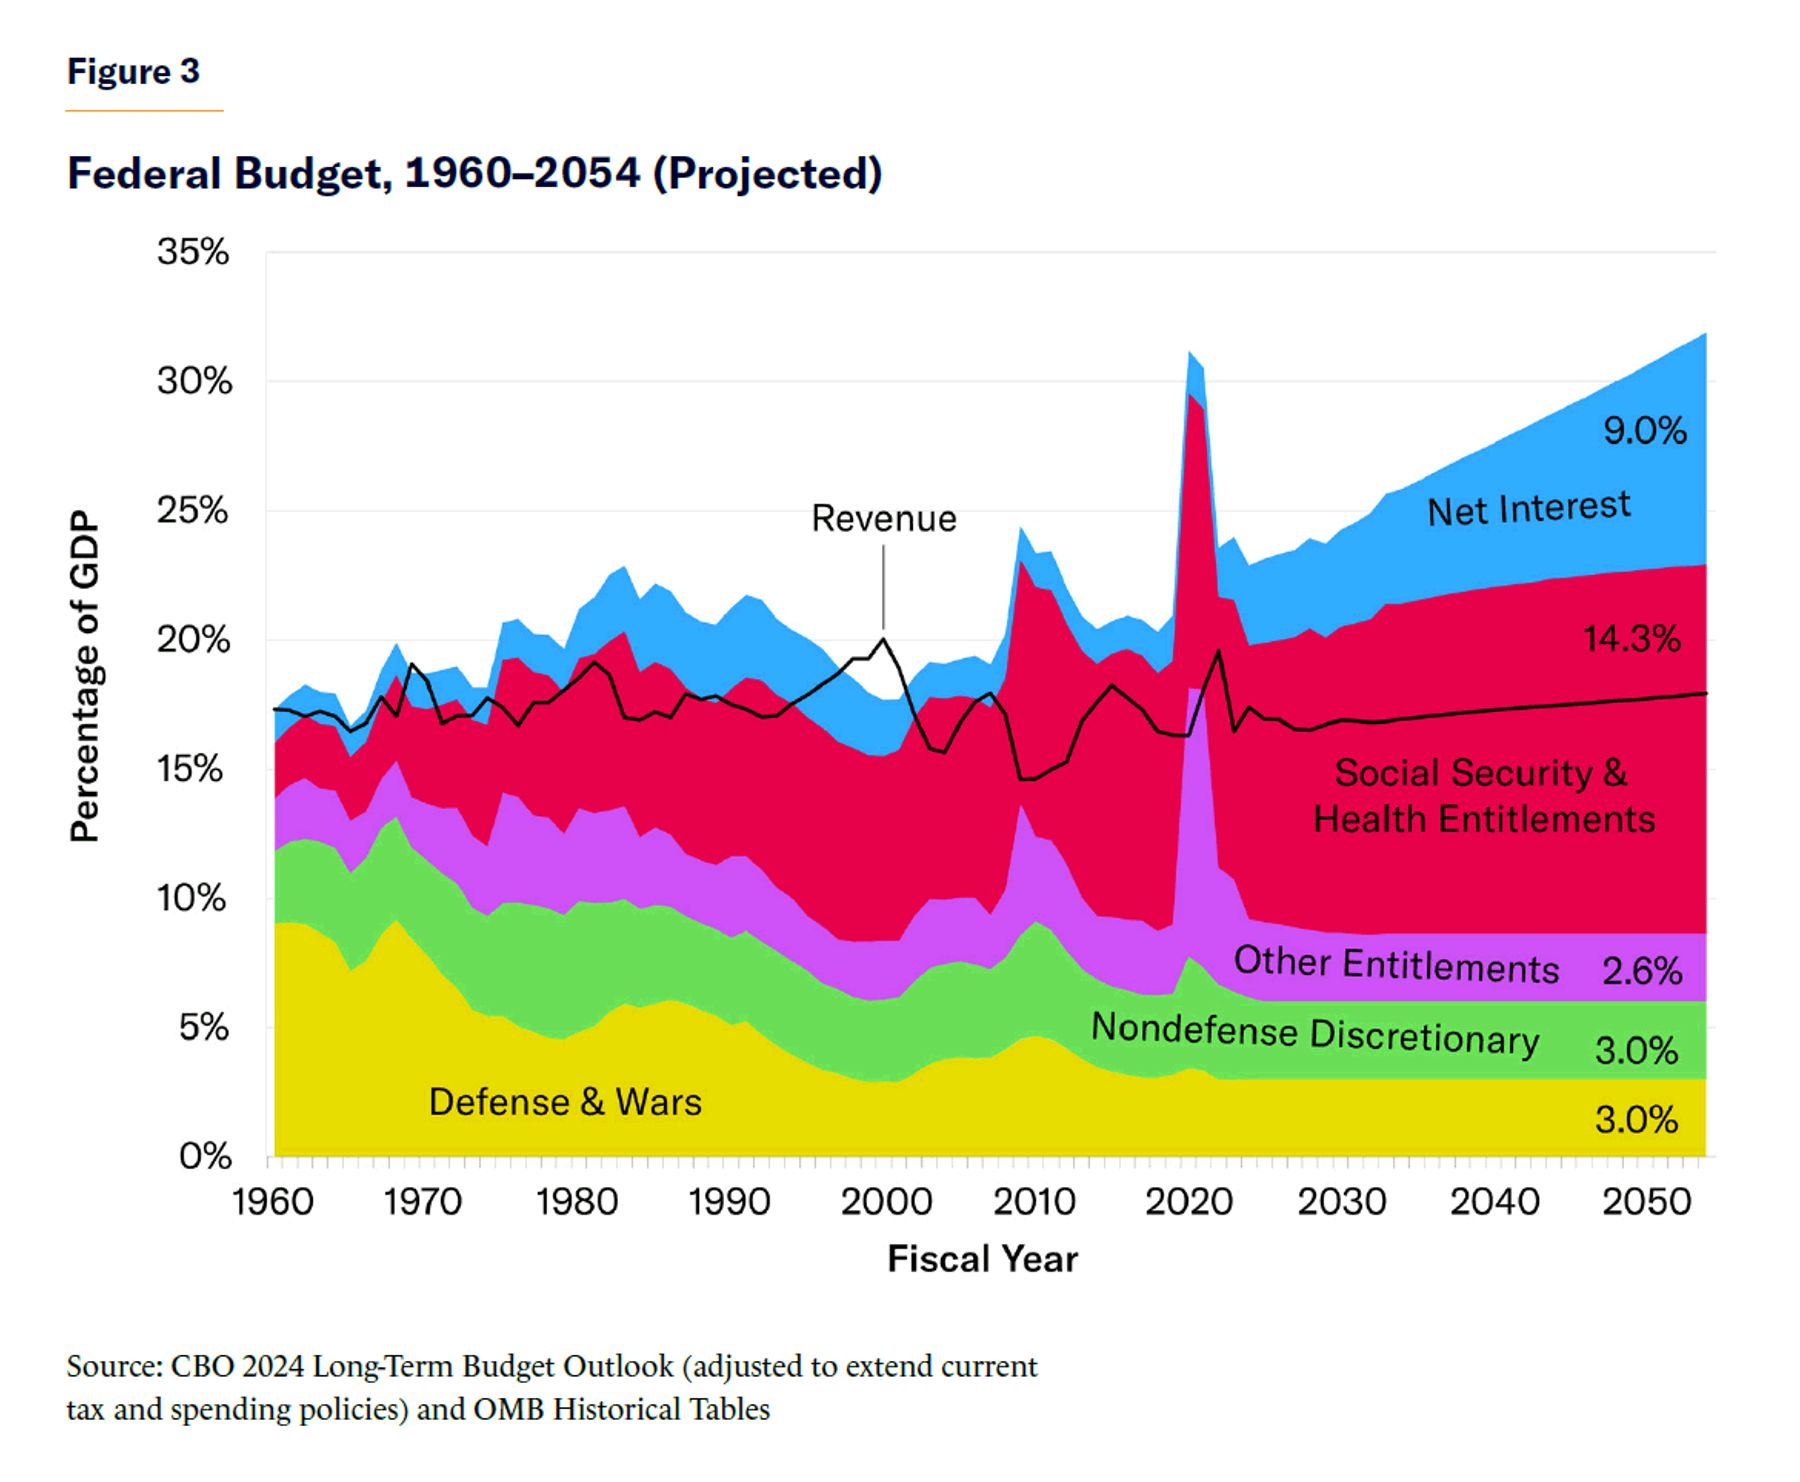
This is not a problem caused by falling tax revenues. Even as tax rates greatly fluctuated, federal revenues have averaged 17.4% of GDP since 1960, and are projected by CBO over the next three decades to grow to 18.8% of GDP (or 17.9% if the 2017 tax cuts are renewed). On the spending side, both discretionary spending and outlays for smaller mandatory programs are projected to fall as a share of the economy over time.
Instead, the entire increase in long-term debt will come from surging Social Security, Medicare, and other government health-care spending (Figure 3). According to CBO, these costs have risen from 7% to10% of GDP since 2000 and are projected to reach 14.3% of GDP by 2054—or 20.6% of GDP when the interest cost of Social Security and Medicare’s annual deficits are included. By 2054, CBO data project the Social Security and Medicare systems to run an annual combined deficit of 11.3% of GDP—and the rest of the budget to run a 2.8% of GDP surplus.[7]
Why Social Security and Medicare Face a $124 Trillion Cash Shortfall
It is a popular myth that Social Security and Medicare are fully paid for and cannot contribute to budget deficits. In reality, Medicare Parts B and D benefits (physician and drug benefits, respectively) are not pre-funded by payroll taxes at all and represent a federal handout no different from any other income support program (senior premiums finance only one-quarter of their cost). The “trust-fund” programs of Social Security and Medicare Part A are entitled to run annual deficits in proportion to their prior-year program surpluses, while receiving annual general revenue subsidies in the form of interest payments on their bonds (and occasional bailouts of payroll-tax holidays). Moreover, CBO projections assume that Social Security and Medicare Part A benefits will continue to be deficit-financed even after their trust-fund balances reach zero in the next decade.
The costs are soaring, as well. Between 2008 and 2030, 74 million Americans born between 1946 and 1964—on average, 10,000 per day—will retire and receive Social Security and Medicare benefits. Of this group, those collecting early retirement at age 62 and living to age 84 will spend one-third of their adult life receiving federal retirement benefits.[8] The combination of more retiring baby boomers and longer life spans will expand Social Security and Medicare caseloads far beyond what current taxpayers can afford under current benefit formulas. In 1960, five workers paid the taxes to support each retiree (and, of course, Medicare did not exist). The ratio of workers to retirees has now fallen below 3–1, and is on its way to 2–1 by the 2030s. When today’s teenagers are adults, each married couple will basically be responsible for the Social Security and health care of their very own retiree.
These demographic challenges are worsened by rising health-care costs and repeated benefit expansions enacted by lawmakers. Today’s typical retiring couple has paid $214,000 into Medicare and will receive $635,000 in benefits (in net present value), partly because Medicare’s physician and drug benefits are not pre-funded with payroll taxes and are only partially funded by retiree premiums.[9] Most Social Security recipients also come out ahead. Thus, most seniors’ benefits greatly exceed their lifetime contributions to the Social Security and Medicare systems. By 2030, 74 million baby boomers will have joined a retirement benefit system that runs a substantial per-person deficit.
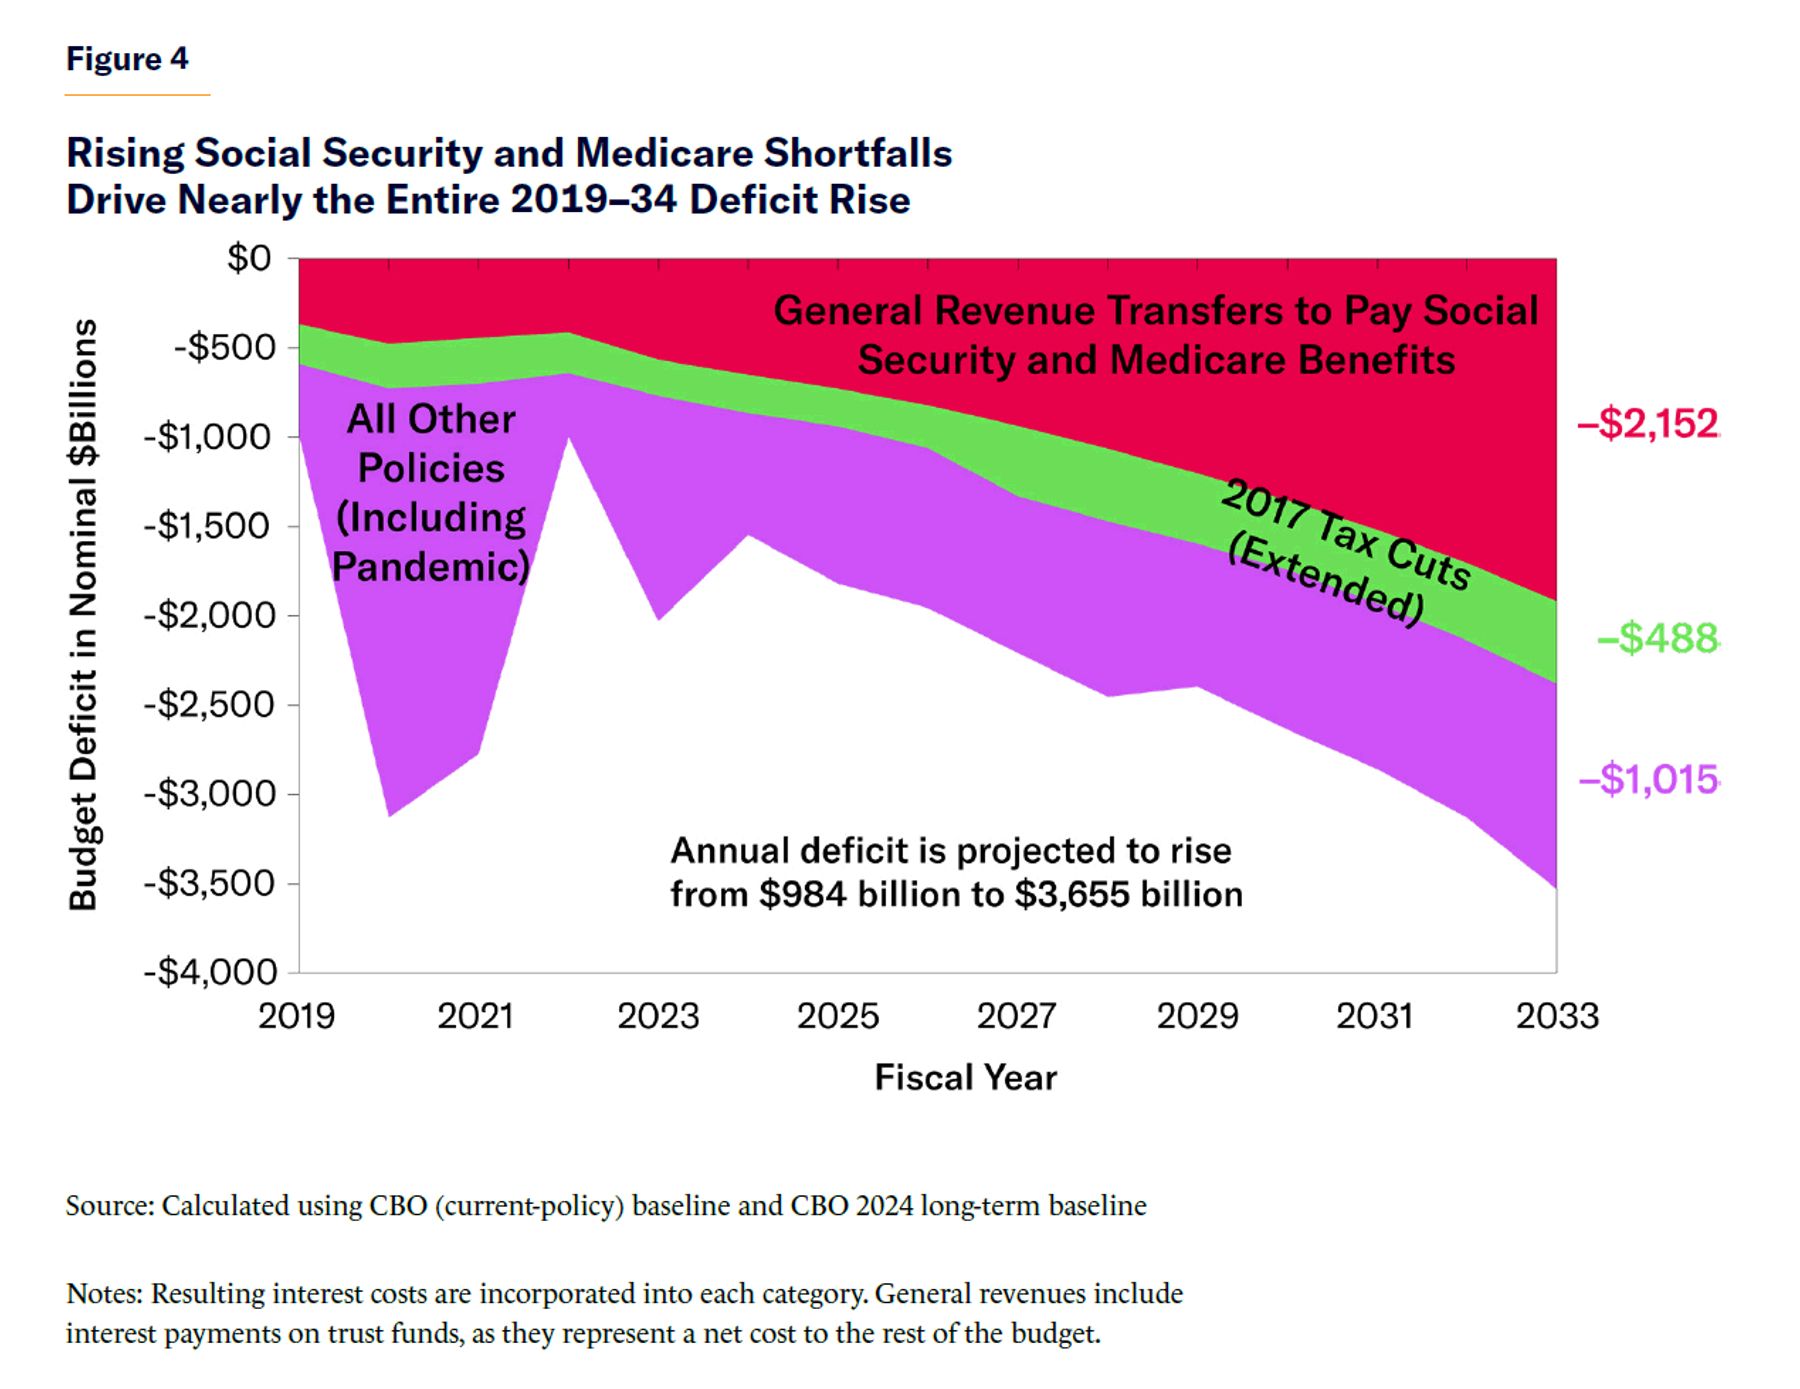
This year, Social Security and Medicare will collect $1,701 billion in payroll taxes and dedicated revenues and pay $2,349 billion in benefits. Add in $21 billion in resulting interest costs from this borrowing, and Social Security and Medicare will contribute $651 billion to the 2024 budget deficit. As Social Security and Medicare costs mount, these annual shortfalls will leap to $2.2 trillion a decade from now (Figure 4).[10] This will drive the vast majority of the growth of the budget deficit.
The long-term figures are even more dire. CBO data project that, between 2024 and 2054, Medicare is projected to collect $28 trillion in dedicated revenues (such as payroll taxes) and spend $77 trillion in benefits. This shortfall will, in turn, add $38 trillion in interest costs, bringing Medicare’s total budgetary shortfall to $87 trillion. During that same period, Social Security will collect $74 trillion and spend $94 trillion, combining with $17 trillion in resulting interest costs for a total shortfall of $37 trillion (Figure 5).[11] (To adjust these 30-year totals for inflation, trim by one-third.) Rather than adequately self-finance through payroll taxes and premiums, these two programs are set to add $124 trillion to the national debt over three decades. The rest of the federal budget is roughly balanced over the next 30 years, depending on the fate of the 2017 tax cuts and discretionary spending.
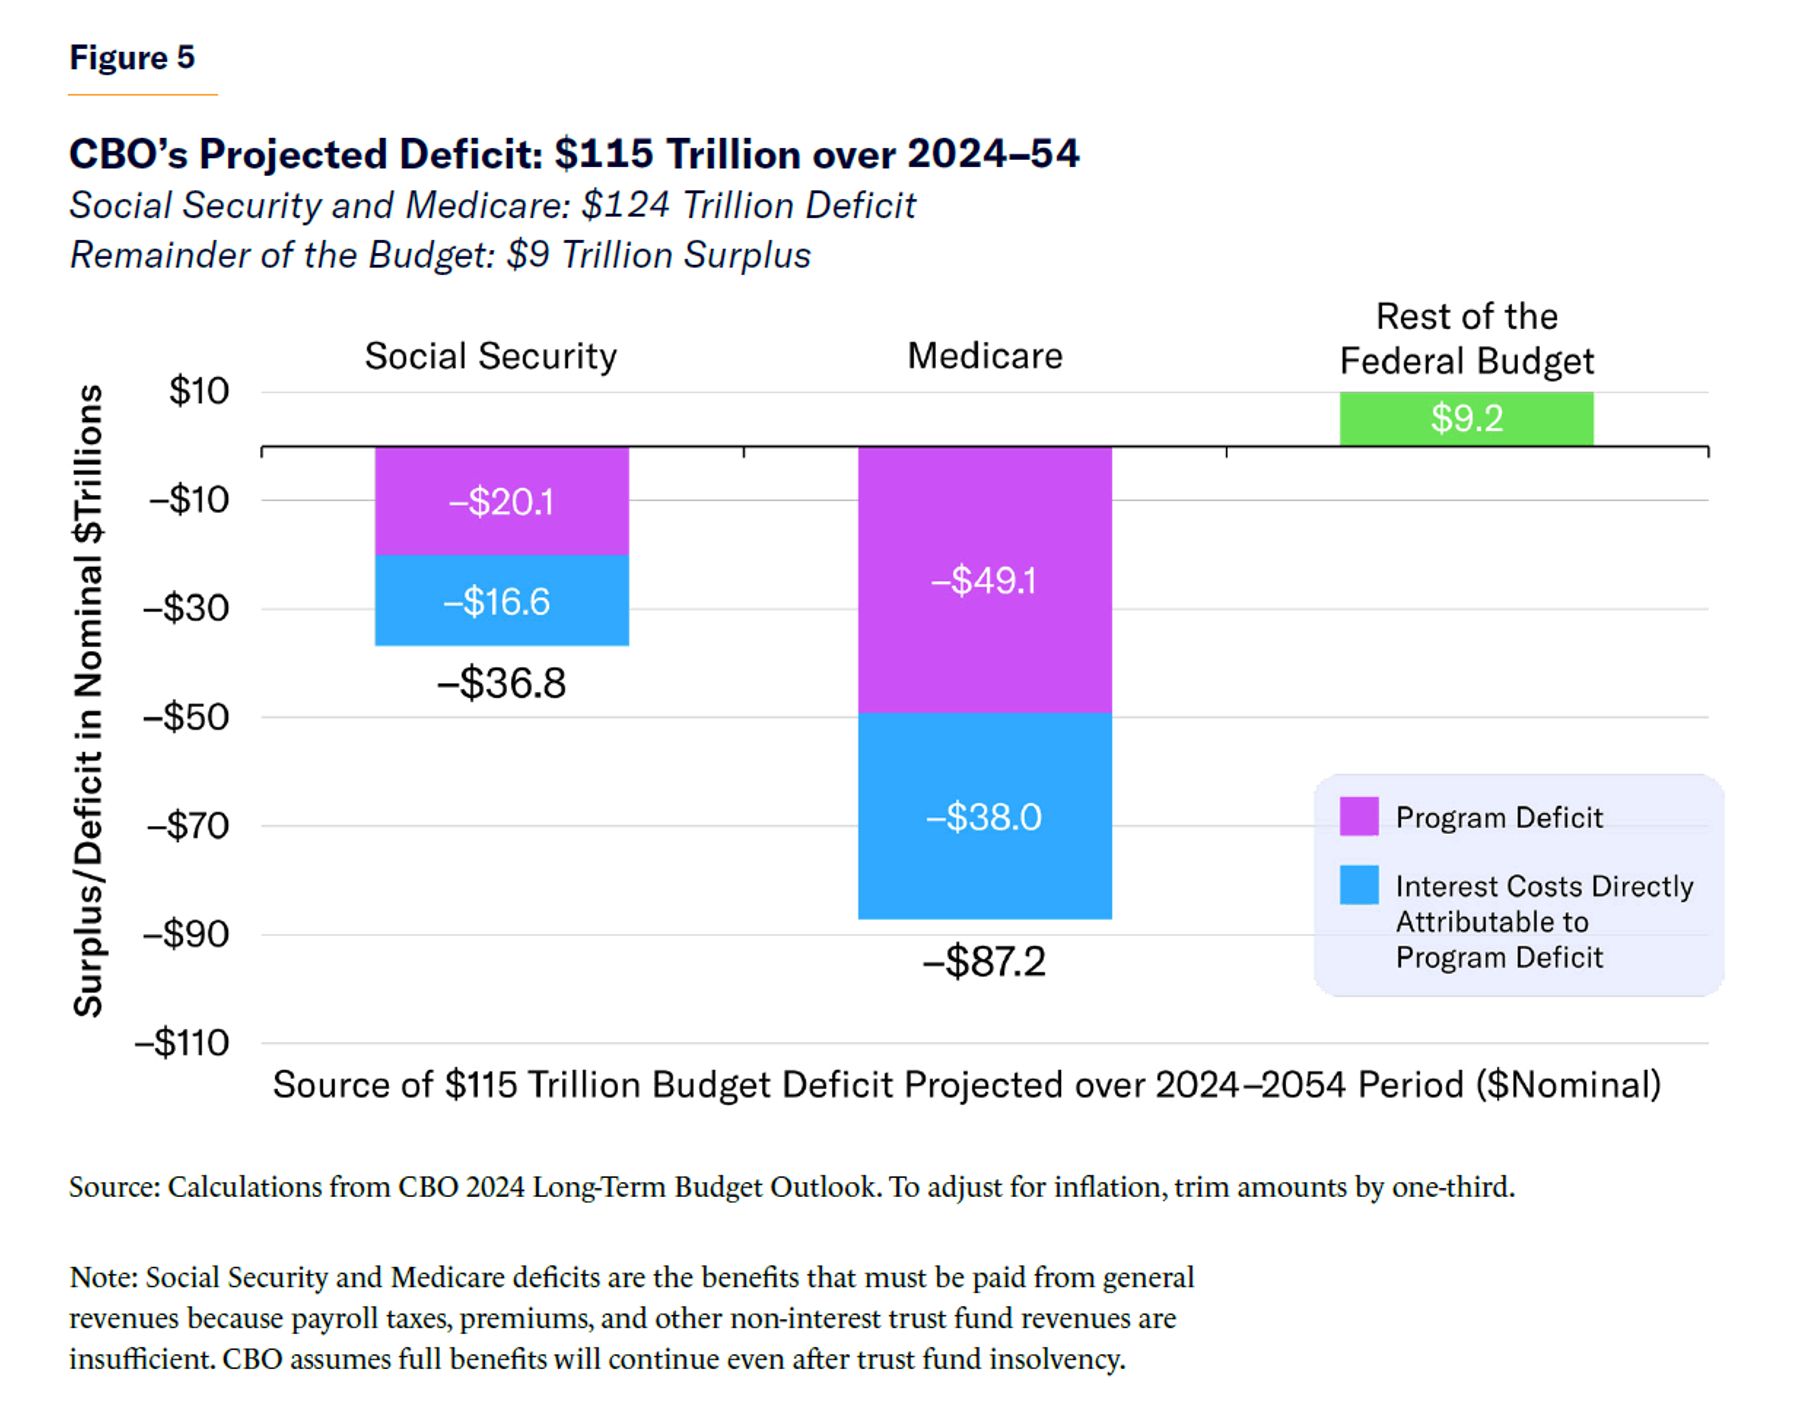
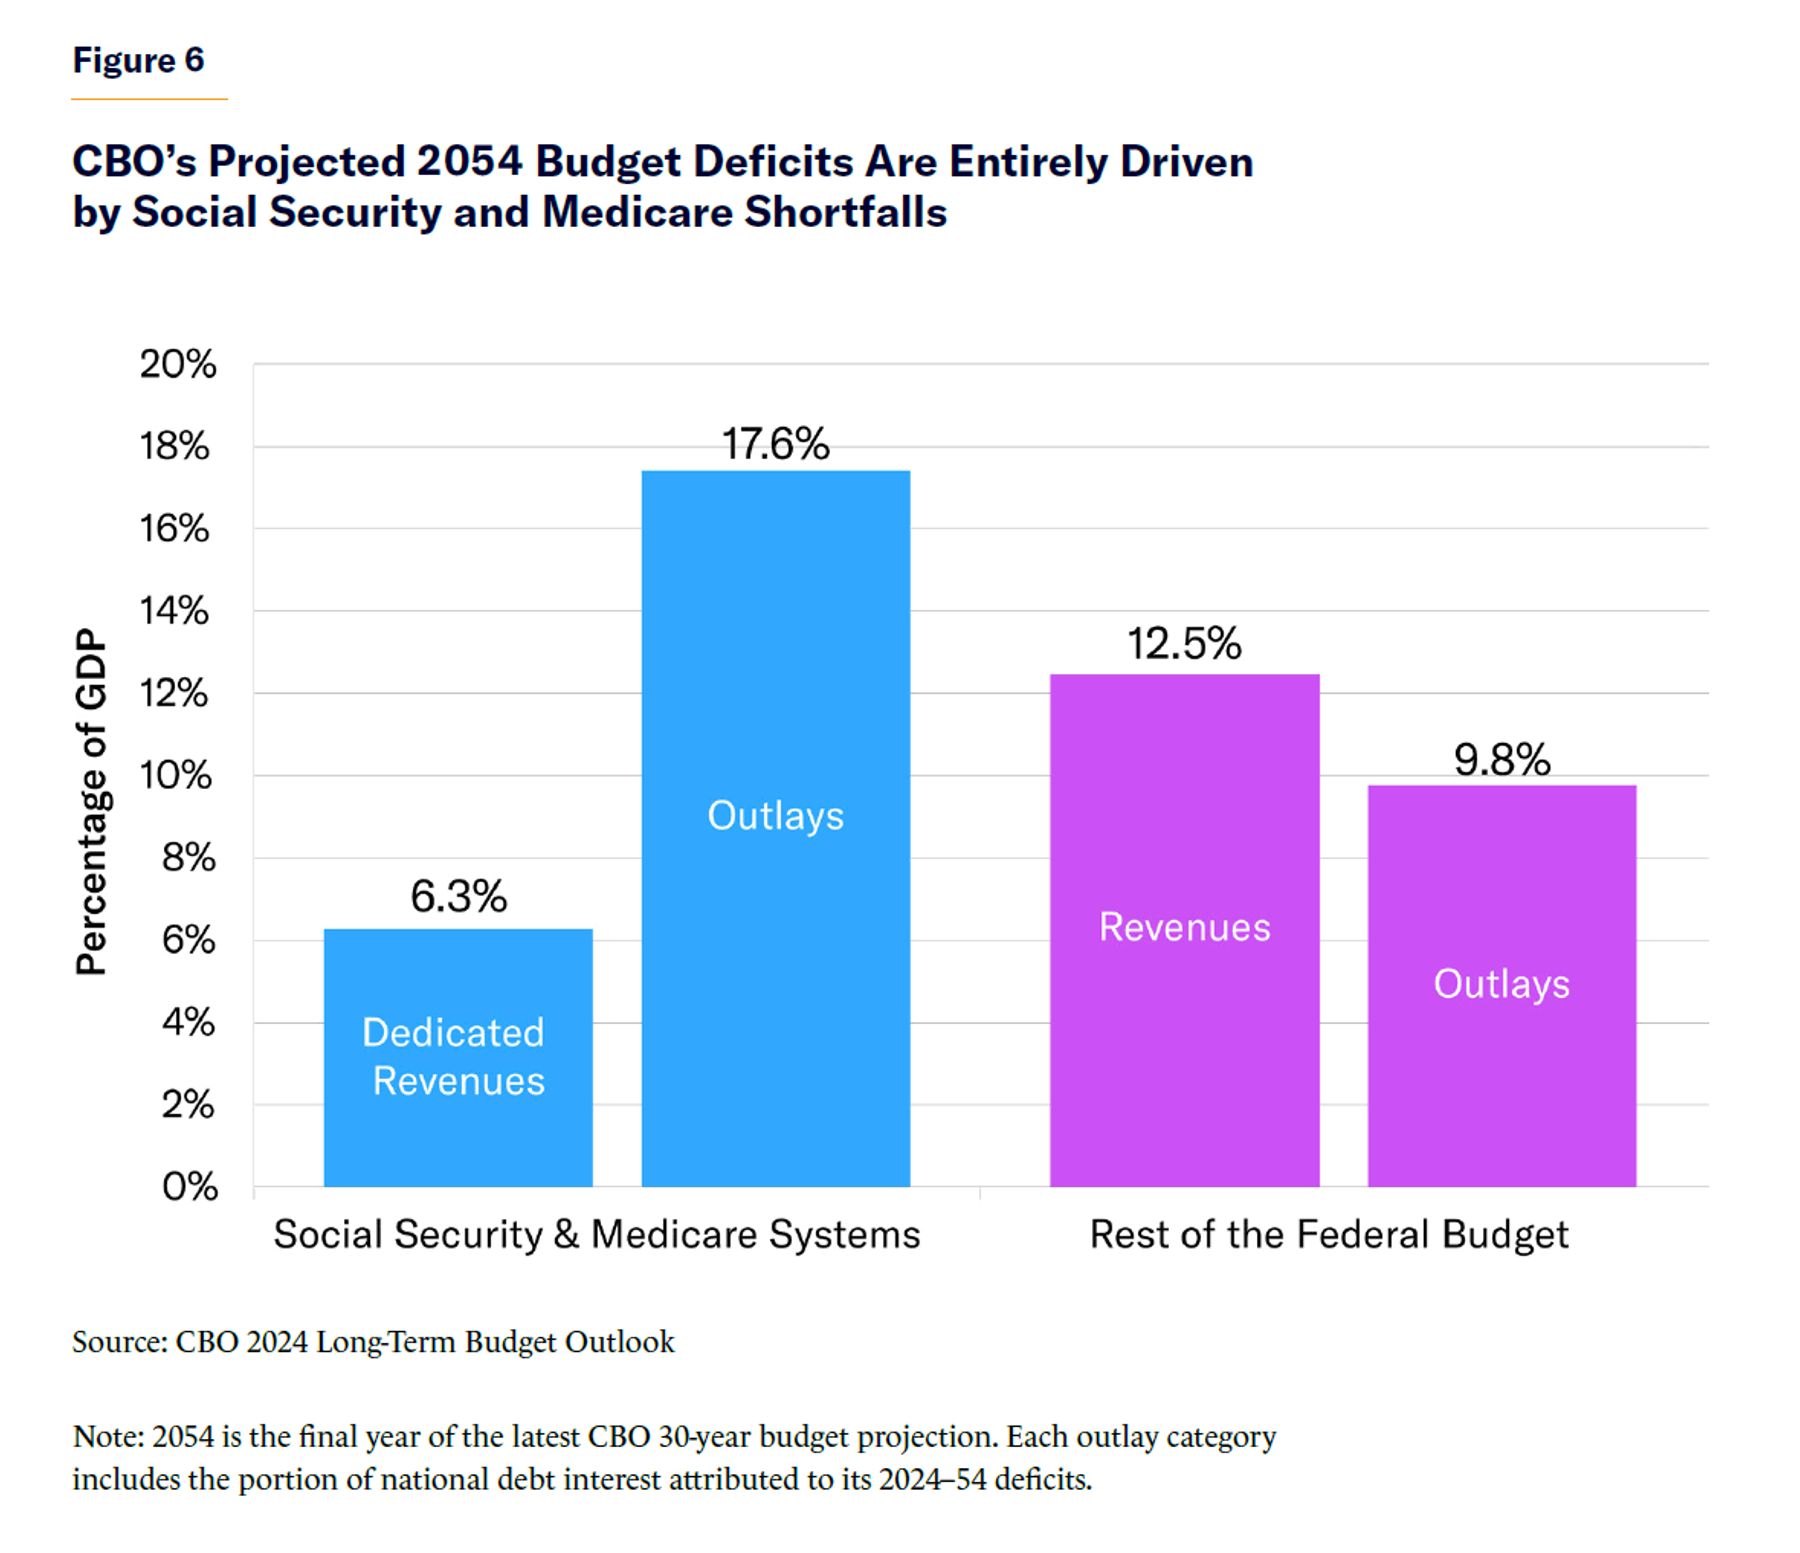
Figure 6 expresses the same projections in a different manner. By 2054 Social Security and Medicare will collect 6.3% of GDP in dedicated revenues and spend 11.3% of GDP in benefits—plus 6.3% of GDP in interest costs resulting from these two programs’ deficits. Allowing two programs to run a budget deficit of 11.3% of GDP is unsustainable. There is no way for other tax increases or spending cuts to finance that gap.
Most Seniors Are Not Poor
The Social Security and Medicare debate often brings opposition to reform based on the myths that: 1) most seniors are poor; and 2) seniors are simply getting back the money they paid into Social Security and Medicare. The first myth of widespread senior poverty is a holdover from the 1930s, when Social Security was created. Today, senior citizens are the wealthiest age group of Americans in history.[12] Millions of retiree households continue to earn incomes greater than $100,000 even after retirement, driven by (nonhousing) net worths in the millions.[13] Senior household incomes have grown 60% faster than inflation since 1980, compared with 15% for the average worker.[14] In fact, because most retirees are wealthier than the taxpayers financing their benefits, Social Security today largely redistributes income upward, not downward. These effects are further magnified by the fact that most seniors no longer face mortgage or child-raising expenses. Of course, many seniors still struggle (which can be affordably addressed by hiking the minimum benefit). Nevertheless, seniors have the lowest poverty rate of any age group.[15]
The relative wealth of seniors should influence the conversation of the second myth that seniors are merely getting back what they paid in. A middle-earning couple turning 65 years old next year will have paid $997,000 over their lifetime into Social Security and Medicare yet receive $1,466,000 in benefits (all adjusted into present value). Lower-earners as well as one-earner couples will come out even further ahead. Moreover, Social Security and Medicare automatically become more generous for each generation (even after adjusting for inflation), partly because of benefit formulas that provide subsequent generations with much higher initial benefits. A middle-earning married couple retiring in 2050 will receive Social Security benefits that are more than double the benefits of those who retire in 2000 (again, these figures are adjusted for present value).[16]
So a key question for policymakers is whether it makes sense to raise taxes on working families by a staggering $69 trillion over three decades[17]—in the largest intergenerational wealth transfer in world history—to ensure that even millionaire seniors can continue to receive Social Security and Medicare benefits far exceeding their lifetime contributions to those systems (this figure reflects the program shortfalls excluding interest costs that would be averted).
Time Is Running Out for Reform
A common argument against addressing Social Security and Medicare is that “we’ve been hearing these same fake warnings for decades and nothing has happened.” This view misinterprets the warnings. Between 1999 and 2023, the year in which the Social Security trust fund was projected by the system’s trustees to reach insolvency has moved up—not back—from 2036 to just 2033.[18] This period corresponds to the point at which virtually all 74 million baby boomers will have retired into Social Security and Medicare, and rising health-care costs will have deepened Medicare’s shortfalls. The aggressive case for reform in the 1990s and early 2000s was driven not by an impending budget crisis but rather a hope that Social Security and Medicare reforms could be gradually phased in while the baby boomers were still in their peak earning years. That opportunity was missed, and now the Social Security trust fund is in deficit and heading toward insolvency on a similar schedule as was warned 25 years ago. Medicare’s annual shortfalls (most of which are not limited by a trust fund) are accelerating as well.
Thus, responsible reforms cannot wait any longer. Every year, 4 million more baby boomers retire into Social Security and Medicare, and within six years nearly all 74 million will be retired. As baby boomers move into their seventies and eighties, they will be unable to absorb any significant reforms to these programs—leaving the massive taxpayer costs politically irreversible. Surging interest costs are mostly irreversible, too, because of the rising debt that will have accumulated (and will continue to accumulate if Social Security and Medicare cannot be reformed) and because the rising interest rates in this situation cannot simply be reversed, either (unless the Federal Reserve unwisely commits to monetizing much of the debt). In fact, if interest rates are driven upward by financial markets losing faith in the federal government’s long-term ability to manage its debt, the resulting risk premium might remain baked into interest rates for several years or even decades. Thus, every year of delay dramatically raises the cost of reform.
Nor is it any longer sustainable to grandfather out of reform everyone over the age of 50. That window closed in the 2000s, when the trillions in unfunded costs were still 20 years away. Now, such a policy would grandfather out the 74 million baby boomers whose costs are driving the shortfalls, as well as most of Generation X. It would gradually phase in reforms beginning in the 2040s and thus leave in place nearly the entire $124 trillion Social Security and Medicare shortfall that is projected over the next three decades. Decades of denial and procrastination by lawmakers (and voters) mean that Social Security and Medicare reform is no longer just about future generations. More than 10,000 baby boomers are retiring every day, trillion-dollar deficits are here, the trust funds are approaching insolvency, and reform can no longer wait for future generations.
How a Debt Crisis Might Play Out
The national debt’s share of the economy cannot rise forever. At a certain point, even large global savings markets will be stretched, and investor confidence in the U.S.’s ability to finance its debt will evaporate. Additionally, interest costs will consume an increasing share of tax revenues, creating pressure for unpopular tax increases and spending cuts.
It is unclear from whom Washington will borrow as much as $175 trillion (assuming that current tax cuts and spending programs are renewed) over 30 years to cover its projected deficits. China and Japan each hold roughly $1 trillion in U.S. debt and have neither the capacity nor the interest to cover more than a tiny fraction of impending American borrowing.[19] Other countries limit their Treasury holdings, and the Federal Reserve has been trying to shrink its $5 trillion holdings of Treasury debt.[20] That leaves the U.S. financial markets—insurance companies, investors, pension funds, and state and local governments—to cover perhaps $150 trillion in projected Washington borrowing. The impending debt surge has barely begun, and yet a 2023 Wall Street Journal headline had already declared: “Wall Street Isn’t Sure It Can Handle All of Washington’s Bonds.”[21]
Initially, Washington’s insatiable borrowing demands will push up interest rates (which will, in turn, further widen budget deficits). But at a certain point, the financial markets might be unable to supply Congress’s lending demands at plausible interest rates. Even before that point, investors might simply lose confidence in Washington’s long-term finances, and shift their investments away from Treasury holdings. Ultimately, Washington cannot borrow what investors will not lend and a vicious cycle of rising debt and interest rates increasingly appears to be the most likely outcome.
A debt crisis will not likely come in a single cataclysmic crash that brings chaos and depression. Instead, persistent deficits of 8%–10% of GDP might bring a series of financial “mini-panics” of rising interest rates and economic stagnation that force Washington to rein in budget deficits. The most likely scenario involves Congress initially targeting lower-hanging fruit such as taxing the rich, trimming defense, and cutting programs such as foreign aid. When these savings prove insufficient to close such large and swelling deficits, lawmakers might reform other tax breaks, as well as spending on antipoverty and social programs. Eventually, they will discover that Social Security and Medicare shortfalls approaching 10% of GDP cannot remain completely protected by eviscerating the rest of the budget and taxing the rich at revenue-maximizing rates. With all savings alternatives tapped out, the only remaining option will be to go where the money is: Social Security, Medicare, and middle-class taxes. If most baby boomers are too old to absorb benefit changes, financing the projected budget deficits might require payroll tax increases as high as 10% combined with a value-added tax exceeding 10%. The result will be a massive debt, sluggish economy, high interest rates, and European-sized taxes—without the accompanying social benefits enjoyed by working European families.
No one can predict whether the financial markets will force reforms in 5, 15, or 25 years.[22] However, the math always wins, and no economy can finance structural budget deficits of 8%–10% of GDP (and eventually higher) forever. On the one hand, the U.S. will have some leeway due to its reputation as a safe harbor for investment and status as the world’s reserve currency. On the other hand, absorbing a debt of nearly 200% of the U.S. economy would be much more expensive for the global markets than absorbing, say, 200% of a smaller GDP like that of Greece.
There is another potential danger. Rather than allow rising interest rates on the debt to force even larger tax hikes and spending cuts, Congress or the executive branch could simply require that the Federal Reserve maintain low interest rates and purchase much of the debt to reduce interest costs. A version of this approach—known as fiscal dominance—previously occurred during World War II and contributed to substantial inflation and economic instability when the White House and Treasury refused to free the Federal Reserve until several years after the war.[23] Such a response to future deficit projections would surely bring substantial inflation and economic instability.
Lest these fiscal warnings appear excessively alarmist, the sober-minded economists at the University of Pennsylvania’s Penn-Wharton Budget Model recently attempted to analyze the long-term fiscal outlook of the United States.
Their study explains that leading economic models used by economists and by Congress “effectively crash when trying to project future macroeconomic variables under current fiscal policy. The reason is that current fiscal policy is not sustainable” (italics added).[24] In fact, the Penn-Wharton economists note that the current fiscal trajectory is so dangerously untenable that economic modelers are forced to add in an assumption that Washington aggressively raises taxes and/or slashes spending. They simply cannot model a functioning long-term economy at the baseline-projected debt levels.
II. The Mirage of “Easy” Solutions
Standing in the way of making the changes to be outlined in this budget plan—or other plausible proposals to avert a debt crisis—are a series of false claims that the problem is easily solved.
Economic Panaceas
Steep economic growth. Political candidates routinely promise to address deficits by producing economic growth rates of 4% and even 5%—more than double the projected levels—while citing the fast economic growth in the decades following World War II. The first problem with this promise is that the economic growth of the 1950s–1970s was primarily driven by the large labor-force expansions of women and then baby boomers. However, the size of the labor force is projected to grow by just 0.1% annually over the next 50 years as the baby boomers retire, birth rates slow, and immigration rates dip.[25]
That leaves productivity to drive nearly all economic growth. CBO projects that total factor productivity growth will average 1.1% annually for the next three decades—roughly matching the last three decades, which included a late-1990s technology boom.[26] If productivity somehow grows by 1.6% annually—nearly 50% faster than CBO’s 1.1% long-term annual projection—it would shave approximately 44% of GDP off the projected debt growth within three decades.[27] The debt would still continue growing to unsustainable levels, but each given debt level would occur a decade later than under baseline productivity growth. In other words, economic growth helps but is no panacea.
One limitation is that faster productivity growth pushes up interest rates on the federal debt and drives up costs for Social Security (benefits rise with wages) and Medicare (health-care consumption rises with income). Thus, the Social Security trustees have noted that a 50% hike in real wage growth would delay the system’s trust-fund insolvency by merely one year.[28]
Much can be done to increase real economic growth rates above CBO’s long-term 1.7% annual projections. In particular, lawmakers should aim to grow the labor-force participation rate; should continue to refine the tax code to encourage work, savings, and investment; and should improve policies in the areas of trade, energy, job training, education, and health care. However, a refusal to address surging spending and deficits would still undermine economic growth by raising interest rates, decreasing business investment, and ultimately forcing up taxes. Lawmakers should aspire to faster growth but not simply assume it—especially if entitlement costs keep growing.
Inflate the debt away. Advocates of Modern Monetary Theory (MMT)—a fringe theory aggressively promoted on X (formerly Twitter), primarily by individuals with no formal economics training—assert that escalating debt is not a serious concern because the federal government can print its own money. Cutting through its blizzard of unnecessarily dense jargon and tautologies, MMT would have the Federal Reserve essentially pay for current and future debt by printing money.[29]
Of course, expanding the money supply enough to pay down a $28 trillion federal debt and finance $69 trillion in (noninterest) Social Security and Medicare obligations over three decades would surely bring hyper-inflation. This hyper-inflation would also dramatically expand future federal spending liabilities by: 1) raising Social Security and Medicare benefits that are tied to price levels; and 2) raising interest rates on any future federal debt.
Low interest rates. CBO’s long-term budget projections—which show a federal debt surging past 165% of GDP within three decades under its rosiest scenario (or 236% of GDP under a more realistic scenario under current policies)—already assume that Washington’s average interest rate never even exceeds 3.8%. This rate is not only below the levels of the 1990s (6.9%) and 2000s (4.8%); it is also below the Treasury 10-year bond yield, which in late 2023 approached 5%. Furthermore, the economic-policy-community consensus is that such a large increase in federal debt would raise interest rates. For each percentage point that interest rates rise, Washington must pay an additional $35–$45 trillion in interest costs over 30 years.[30] In other words, CBO debt projections are far more likely to underestimate than to overstate future interest rates.
Immigration. Smart immigration policy might, on net, marginally improve the federal budget picture and the economy. But it is not a cure-all. High-skill immigrants send higher tax revenues during their working careers, but their eventual retirement into Social Security and Medicare would add new liabilities to the system. Low-skill immigrants generally increase costs to the federal government (and especially to state and local governments)—at least, in the first or second generation—because the resulting education, infrastructure, and social spending exceeds the added tax revenues.
Conservative Fantasies
Pro-growth tax policy. Economic growth is obviously important to deficit reduction—and tax legislation that depresses savings and investment must be avoided. Nevertheless, the historical record clearly shows that the vast majority of tax cuts do not increase tax revenues—especially by enough to keep pace with federal programs growing 6% annually.
Eliminating welfare and lower-priority spending. Over the past 30 years, congressional GOP deficit-reduction plans have typically imposed nearly all the first decade’s cuts on antipoverty programs (Medicaid, Affordable Care Act subsidies, SNAP, and others) as well as nondefense discretionary spending, such as education, veterans’ health, homeland security, medical research, foreign aid, and infrastructure. This pot of spending—7% of GDP and declining—would have to be nearly entirely eliminated to balance the budget a decade from now. Such drastic cuts will never be passed by any Congress, as their advocates on Capitol Hill and in top think tanks surely know. While there are any number of failed and unnecessary programs in need of major reform, proposals to eviscerate these entire categories of spending while letting Social Security and Medicare off the hook are a politically delusional distraction.
Impossibly tight spending caps. Spending caps are a vital tool to enforce realistic spending targets. But absent any achievable underlying programmatic reforms to meet those targets, they are an empty gimmick. Nevertheless, many conservative budget blueprints simply divide the federal budget into five to eight spending categories and then assume unprecedented cuts in targeted categories, with no underlying policy proposals to achieve those targets. The 2011 Budget Control Act has shown that Congress will cancel overly tight caps rather than force politically suicidal cuts.[31] Budget process reforms can lay the groundwork for subsequent spending cuts, but the spending cuts themselves still must be specific, realistic, and passable.
Devolution to state governments. There is a strong policy case for allowing states to have more control over poverty relief, education, infrastructure, economic development, and law-enforcement spending.[32] However, counting the federal savings from devolution as the centerpiece of a deficit-reduction strategy is disingenuous because it simply shifts the deficits and taxes to the state level (minus modest efficiency gains that might come from better state fiscal management). The purpose of deficit reduction is to limit government borrowing and tax increases (and to limit economic damage), not merely to change the address where the taxes are sent.
Liberal Fantasies
“Just tax the rich.” Liberal advocates often vastly overstate the degree to which upper-income tax increases can finance the ever-expanding government. In the first place, the U.S. already has the most progressive tax code in the OECD—even adjusting for differences in income inequality. And setting aside the moral questions that would be raised by the government seizing the vast majority of any family’s income, basic math shows that large tax increases on high-income Americans cannot close most of the long-term budget deficit.
Even if Washington taxes away every dollar of income earned over the $1 million threshold (and everyone affected kept working anyway), that additional 3.8% of GDP collected would not even balance the long-term budget.[33] Seizing every dollar of wealth from America’s billionaires—every home, car, business, and investment—would fund the federal government one time for nine months.[34]
In a 2023 report, “The Limits of Taxing the Rich,” I modeled the maximum potential tax revenues that can be raised from taxing the rich.[35] Specifically, the report modeled a scenario in which individual, corporate, investment, and estate tax rates were each raised to their revenue-maximizing levels. Additionally, relevant individual and corporate tax preferences were drastically scaled back, and the IRS was given nearly unlimited resources to combat tax evasion.
Such a tax package would hit wealthy families and corporations with some of the highest income, investment, corporate, and estate tax burdens in the developed world, dwarfing those of much of Europe. Yet the total revenue raised would be 2.1% of GDP (or $7 trillion over the decade) before accounting for the macroeconomic losses that would likely reduce new revenues to somewhere 1.0%–1.5% of GDP (or $3.5 trillion–$5 trillion over the next decade). The reality is that layering higher rates on top of each other would reduce work, savings, and investment; encourage income shifting to minimize tax burdens; and induce tax evasion. Setting tax rates at their revenue-maximizing levels means that—by definition—the economic damage has swelled large enough to completely offset any additional revenue gains. Layering multiple revenue-maximizing tax policies on top of each other would induce behavioral and macroeconomic responses that would pare back 10%–50% of the static revenue gain, according to consensus economic analysis. The likely 1.0% and 1.5% of GDP in new tax revenues from these policies would not come close to eliminating annual budget deficits that are projected at 8% of GDP within a decade, and 14% of GDP within three decades, under current policies. Additionally, the significant reduction in investment and business expansions would reduce wages, slow job growth, and lower overall economic growth.
The point is not that taxes on the wealthy should not rise. Everything must be on the table, and this report proposes significant tax increases for businesses and high-earning families. Rather, the point is that such policies must be economically and mathematically realistic. There are simply not enough millionaires to finance a progressive utopia. The top-earning 5% of families and pass-through businesses currently account for 32% of all income. That means that 68% of this tax base comes from those outside the top 5%. Furthermore, that top 5% already pays 42% of all federal taxes, including 62% of all federal income taxes, which leaves less room for additional taxes.[36] So while some upper-income tax increases are possible, the idea that the U.S. can close a $69 trillion noninterest shortfall for Social Security and Medicare—and even pay for additional spending proposals on the liberal agenda—solely by sticking it to the rich is a fantasy that finds no support in budget math.
Europe has already figured this out. The U.S. already taxes the rich—measured by both tax rates and tax revenues—at levels roughly equal to the OECD average. Yes, the other 38 OECD nations collect tax revenues that, on average, exceed the U.S. by 7.5% of GDP (at all levels of government). However, nearly this entire difference results from the other 38 OECD nations hitting their middle class with value-added taxes (VATs) that raise an average of 7.2% of GDP. And while the progressive avatars of Finland, Norway, and Sweden exceed U.S. tax revenues by 16% of GDP, that gap virtually disappears after accounting for the 14.5% of GDP in higher payroll and VAT revenues that broadly hit the Nordic middle class. Europe finances its progressive spending levels on the backs of the middle class, not the wealthy.[37]
An inescapable reality gets lost in this country’s intractable budget debates: if the U.S. wants to spend like Europe, it must also tax like Europe. This means, in addition to federal and state income taxes, a broad-based VAT set at an exorbitant rate. Lawmakers who pledge to stabilize the debt without touching government spending would need new tax revenues equivalent to a VAT that rises to 22% by 2030 and 36% by 2054.[38] Alternatively, lawmakers could gradually nearly double the payroll tax from 15.3% to 29.6%.
We likely need a combination of large income, payroll, capital-gains, corporate, and value-added tax increases to eventually raise 5% of GDP and stabilize the debt without touching Social Security, Medicare, Medicaid, antipoverty, and social spending (Table 1). While it is easy to say that major spending decreases are a nonstarter, the all-tax alternative is even less plausible. Remember that, during 2021–22, a Democratic White House and Congress never even seriously considered raising taxes on the rich, other than a modest corporate minimum tax (after all, wealthy people vote and donate to Democrats, too). A Bernie Sanders-style soak-the-rich tax package is not plausible, economically or politically.
Table 1
Many Popular Tax Options Raise Little Revenue
*Tax increase significantly includes low-income families
Note: Revenue estimates do not account for: 1) revenue losses to negative economic effects; and 2) interactions between policies. Many policies duplicate and cannot be combined.
Deep defense cuts. Since the 1980s, the Pentagon budget has fallen from 6% to 3% of GDP—not far above Europe’s target of 2%. Cutting U.S. defense spending to the levels pledged by European members of NATO would save 1% of GDP, or less than one-fifth of the Social Security and Medicare noninterest shortfall by the 2040s and 2050s. And Europe’s target level is possible only because its leaders can count on protection from a larger superpower—a luxury that the U.S. would not enjoy. A healthy portion of the American higher defense budget comes from spending well above $100,000 per troop in compensation (salary, pension, housing, health care, and other benefits),[39] which lawmakers are not eager to cut. Some long-term budget savings are possible (and CBO’s long-term baseline projections show defense spending declining as a share of GDP), though it should be noted that no elected Democrats have backed up their rhetoric with any specific blueprint to dramatically slash defense spending,[40] and an emboldened Russia and China are as likely to induce U.S. defense spending expansions.
Medicare-for-All. When confronted with rising Medicare and Medicaid costs driving federal deficits, a popular response on the left is to propose single-payer health care (often dubbed “Medicare-for-All.”) The theory here is that a fully socialized health plan would drastically slash costs to families and the federal budget.[41]
The first obvious problem is that there is no evidence that single-payer health care could reduce American health-care expenditures. Nations such as the United Kingdom nationalized health care when it was a small portion of the economy, and then contained costs by building a modest health infrastructure over several decades. No country first built a massive, sprawling health system that consumes nearly 20% of the economy—with large and roomy hospitals, widespread expensive technologies, and an extensive drug-research sector—and then decided to save money by severely reducing payments below the cost to run this extensive system.
In fact—despite empty promises that single-payer health care can bring a streamlined payment system that squeezes dramatic efficiency savings out of excess profits, salaries, and administrative bloat—no such provider payment system has ever been designed or proposed in the United States. The leading congressional proposals by Senator Sanders and Representative Pramila Jayapal simply assign regulators to figure out such a system. Yet health-care economists on the left and the right are quite skeptical that over $6 trillion in scheduled health spending can be squeezed over the next decade without driving health providers out of business. Even then, those savings would then be consumed by the $6 trillion cost of expanding health care access to all populations, ensuring access to more treatments, and scaling back patient cost-sharing. Thus, the most likely scenario is that total national health expenditures remain roughly unchanged under Medicare-for-All.
Thus, a single-payer system would simply shift $32 trillion in private health expenditures scheduled over the next decade (premiums, copays, deductibles, out-of-pocket expenses) over to the federal government. Yet, just as no one has designed a new provider payment system, no progressive economists or lawmakers have been able to design a $32 trillion tax to replace this private health spending. In fact, Vermont lawmakers had to repeal their own statewide single-payer health law in 2014, when the state failed to come up with a tax large enough to replace all private health spending. The Committee for a Responsible Federal Budget has calculated that financing a generous, Sanders-style Medicare-for-All system would require choosing between a new 32% payroll tax, 25% income surtax, 42% value-added tax (VAT), $12,000 per-capita premium for those currently not on government plans, or more than doubling all individual and corporate income-tax rates.[42] Hardest hit would be the 79 million Americans currently on Medicaid, who would continue receiving (mostly) free health care but now be subject to staggeringly large and broad “single-payer” taxes. It turns out that “free” health care is quite expensive.
Most absurdly, none of these reforms would actually reduce Medicare’s $49 trillion (noninterest) shortfall. Even if lawmakers successfully raised taxes by $32 trillion over the decade to nationalize the $32 trillion in private health costs, this would almost exclusively reform health-care finances for families under age 65. Health care is already “nationalized” for senior citizens, with low payment rates, and that system still faces a $49 trillion (noninterest) shortfall over three decades. Expanding the Medicare system to a younger population will not somehow close the shortfalls for the older population. Perhaps lawmakers should figure out how to pay for the current Medicare system before pledging $32 trillion per decade to expand it to younger people.[43]
Cross-Partisan Fantasies
Social Security trust fund to the rescue. Some suggest that redeeming the $3 trillion in assets held by the Social Security trust fund will shield taxpayers from the cost of Social Security’s deficits. In the first place, this $3 trillion accounts for a small fraction of the system’s $37 trillion cash deficit over 30 years. More important, the trust fund contains no economic resources with which to pay benefits; it consists of a pile of IOUs in a filing cabinet in Parkersburg, West Virginia. This $3 trillion in Social Security assets reflects an equal $3 trillion liability for the Treasury (i.e., the taxpayers) that must repay the bonds with interest over the next decade. In that sense, the Social Security trust fund does not save taxpayers a dime; all future Social Security benefits will be financed by concurrent taxes and borrowing.
Long-term budget projections are just theory. Americans otherwise inclined to be skeptical of 30-year projections should nevertheless take these seriously. Future inflation or interest rates are indeed anyone’s guess, but the 74 million baby boomers retiring into Social Security and Medicare are an actuarial and demographic reality. These present and future retirees exist, and their payment formulas have already been set into law (complete with mailings from the Social Security Administration listing future benefits). Furthermore, any future uncertainties are an argument for caution and prudence.
There is no hurry. Some assert that lawmakers can wait 10–15 years to address this challenge. Unfortunately, every year of delay raises the eventual cost of a budget fix because: 1) on average, 4 million more baby boomers retire into Social Security and Medicare every year, and lawmakers have generally avoided reducing benefits for those already receiving them; 2) benefit levels will rise further above an affordable level; and 3) the larger national debt locks in permanently higher interest costs. The blueprint in this report assumes that most reforms are implemented in 2026—which means that stabilizing the debt at 100% of GDP requires the sum of annual tax increases and (noninterest) spending cuts that rise to 5% of GDP by 2054. The amount of future tax increases and spending cuts (and economic damage) expands greatly the longer reform is delayed.[44]
Let the kids deal with the problem. The final argument against reform asserts that Social Security and Medicare benefits represent an unbreakable, unamendable promise to the elderly, consequences be damned. In reality, retirement benefits have been repeatedly expanded far beyond what current retirees were promised while they were working. For example, President George W. Bush and Congress decided in 2003 that current taxpayers would pay 75% of the prescription drug costs of the current typical senior. This benefit was never “earned” through payroll taxes. And today’s teenagers never signed up for this budget-busting deal. Nor did any generation agree to double their income taxes in order to transfer $100 trillion to the older generation.
III. A Bipartisan Plan to Stabilize the Long-Term Federal Budget
A realistic path to averting the country’s future debt crisis will require lawmakers to reject gimmicks, slogans, and empty budget targets in favor of plausible changes to the current arc of federal spending and taxes—specific changes whose effects on the federal budget can be scored by CBO methodology. And because deficit-reduction policies are never popular, major reforms need to be enacted on a bipartisan basis, much like the 1983 Social Security reforms. Any attempt to pass these major changes on a party-line vote would undermine their public legitimacy, would be politically suicidal, and would likely be repealed when the opposition party returns to power.
The path put forward in this report is meant to achieve the following objectives:
- Long-term fiscal sustainability. Moving to a fully balanced budget is not possible anytime soon. However, stabilizing the national debt around the current level of 100% of GDP would likely stabilize the cost of interest on the national debt and the debt’s effect on the economy. This means annual budget deficits stabilizing near 3.5% of GDP. Sustainability also means that both spending and tax revenues stabilize as a percentage of GDP rather than continue to rise in tandem. Finally, long-term sustainability means that showy reforms, such as across-the-board discretionary spending cuts, are less important than subtle entitlement reforms that produce larger savings over time.
This standard differs from the long-standing practice of measuring Social Security and Medicare finances against a general target of 75-year solvency. Blueprints showing such a target are often achieved by decades of program surpluses followed by decades of crushing deficits. History has shown that those initial surpluses get spent on other federal priorities, leaving no resources to finance the large deficits in the latter half of the period. Furthermore, as Social Security’s past four decades have shown, this intergenerational trust fund accounting requires that additional interest payments be transferred into the Social Security and Medicare systems—which are funded out of general revenues and thus increase budget deficits. Instead, basic intergenerational equity rejects having one generation run surpluses to balance another generation’s deficits. - Achieve most savings from major mandatory programs. There are three reasons for this objective:
First, it’s the only solution that addresses the underlying problem. Mandatory spending is the primary factor driving the debt upward. CBO’s long-term baseline shows that 100% of the long-term increase in annual budget deficits as a share of the economy comes from the rising cost of Social Security, Medicare, and other health entitlements, as well as the resulting interest on the debt. Remaining federal spending is projected by CBO to continue falling as a share of the economy. Tax revenues are projected to rise above average levels. It is not sustainable to chase ever-rising entitlement costs with ever-rising tax rates, or to eviscerate all other federal programs.
The second reason is generational equity. Drowning younger workers in ever-rising taxes is no more moral than drowning them in debt, particularly when the entire additional tax burden will finance the largest intergenerational wealth transfer in world history. Retirees are typically wealthier than working-age men and women; and over the years, Social Security and Medicare benefits have been enacted that far exceed retirees’ lifetime contributions to the programs. Rather than passing this burden on to their kids, they have a responsibility to pare back their benefits to affordable levels.
The third reason is economic. The level of tax increases that would be necessary to keep pace with escalating entitlement spending—including gradually moving to a 29.6% payroll tax rate or a 36% VAT—would retard economic growth. Across other countries, the most successful fiscal consolidations—such as in Finland and the U.K. in the late 1990s—have averaged 85% spending restraint and 15% new taxes.[45] - Specific and plausible changes only. Most other long-term budget proposals show larger and more immediate budget savings than this blueprint. Unfortunately, those savings usually rely on some combination of:
- Overly optimistic economic growth assumptions;
- The immediate implementation of extraordinarily complicated and controversial reforms to major programs that in reality would take several years to draft, pass, implement, and phase in;
- Aggressive spending-cut or tax-increase targets (or unrealistically tight spending caps) that lack specific policy reforms to meet them;
- Combining various tax increase proposals that collectively result in unrealistically high tax burdens for certain groups, or that generally duplicate or contradict one another.
Additionally, many long-term budget proposals are based on liberal or conservative fantasies such as taxing the rich at impossibly high rates or eliminating most welfare and domestic discretionary spending. This blueprint attempts to thread the needle of effective policy and the political reality that any major, lasting deal must be bipartisan.
This budget blueprint works within the current structure of government, rather than proposing complete rewrites of major programs or the tax code. It divides reforms into four tiers and seeks maximum savings in a given tier before moving to the next:
- Tier 1: Squeeze out inefficiencies from the major health programs driving spending upward (as close to a free lunch as is available).
- Tier 2: Trim Social Security and Medicare benefits primarily for upper-income retirees (who can most afford the changes).
- Tier 3: Trim other federal programs to the extent feasible on a bipartisan basis.
- Tier 4: Close the remaining gap with new taxes in the least damaging manner possible.
The blueprint also provides that: the lowest-income 40% of seniors are largely protected from Social Security and Medicare cuts (beyond raising the Social Security eligibility age); spending cuts to antipoverty programs are largely avoided; parity between discretionary defense and nondefense spending is maintained; Washington’s structural budget deficits are not passed on to the nation’s governors; tax increases are kept within reasonable limits; policy changes are phased in gradually, mostly beginning in 2026; and economic growth is assumed to be no faster than in CBO’s long-term projection.
The first step toward scoring a long-term budget is a credible 30-year baseline. Regarding this blueprint’s baseline:
- It begins with CBO’s March 2024 “Long-Term Budget Outlook,” which projects the 2024–54 baseline based on current law.[46]
- Next, CBO’s current-law baseline is converted to a current-policy baseline by assuming that expiring tax cuts and spending policies are made permanent, for reasons explained below.
- Projections of future spending on discretionary programs (which has ranged between 6% and 9% of GDP for several decades) are adjusted to never fall below 6.0% of GDP. By contrast, CBO is required by Congress to instead rely on a simple mathematical formula that gradually drives the baseline level down to 4.9% of GDP over three decades.
- Similarly, this current-policy baseline assumes that smaller mandatory program budgets level off at their CBO-projected 2034 percentage of GDP (which is the final year of CBO’s more detailed 10-year baseline) rather than continue declining indefinitely as a percentage of GDP in the CBO current-law baseline. Such permanent declines are better classified as a legislative choice rather than the default.
The permanent extensions of recent policy changes do not necessarily reflect this author’s preferences but are based on the idea that the starting baseline should assume the continuation of current policies rather than the (highly unlikely) implementation of major changes down the road. Furthermore, even CBO’s current-law baseline already makes an enormous current-policy exception: it assumes, per lawmakers’ instructions, that Social Security and Medicare benefits will continue to be paid in full even after the trust funds of both programs are exhausted. A true current-law baseline would show that these benefits would be reduced at that point.
Under an updated, current-policy baseline, the 2024–54 period shows that:
- Federal tax revenues would rise from 17.4% to 17.9% of GDP.
- Federal spending would jump from 22.8% to 31.4% of GDP.
- Budget deficits would therefore rise from 5.4% to 13.4% of GDP.
- The national debt held by the public would jump from 99% to 236% of GDP.
- Absent fiscal consolidation, interest on the national debt would rise from 3.0% to 8.7% of GDP over this period.
Stabilizing the national debt at 100% of GDP would require tax-and-spending reforms producing net savings against the baseline that gradually rise to 5% of GDP annually by 2054:
- This blueprint eventually produces slightly larger savings and splits that year’s savings at 4.4% of GDP in spending cuts and 2.9% of GDP in tax increases. This is because many of the spending savings that are needed to minimize debt growth over the next two decades eventually produce larger savings thereafter, creating a virtuous circle of lower interest costs.
- The 4.4% of GDP in spending “cuts” can more accurately be described as the cancellation of the large spending surge scheduled in the baseline. Total spending would remain around 22% of GDP over the three decades.
- Over three decades, the noninterest breakdown is 52% spending cuts and 48% tax increases. The spending savings are initially small because most programmatic spending reforms (such as reductions in growth rates) take many years to ramp up their savings—requiring tax hikes to produce most of the required early savings. Those annual spending savings finally surpass the tax increases in 2037, and by the end of the 30-year window are producing 60% of all annual noninterest savings.
- Those reforms would not only directly save 7.3% of GDP annually by 2054; they would also shave 5.9% of GDP off the projected interest spending by that year, as a result of a smaller than projected national debt. Total deficit reduction is 13.2% of GDP by that point.
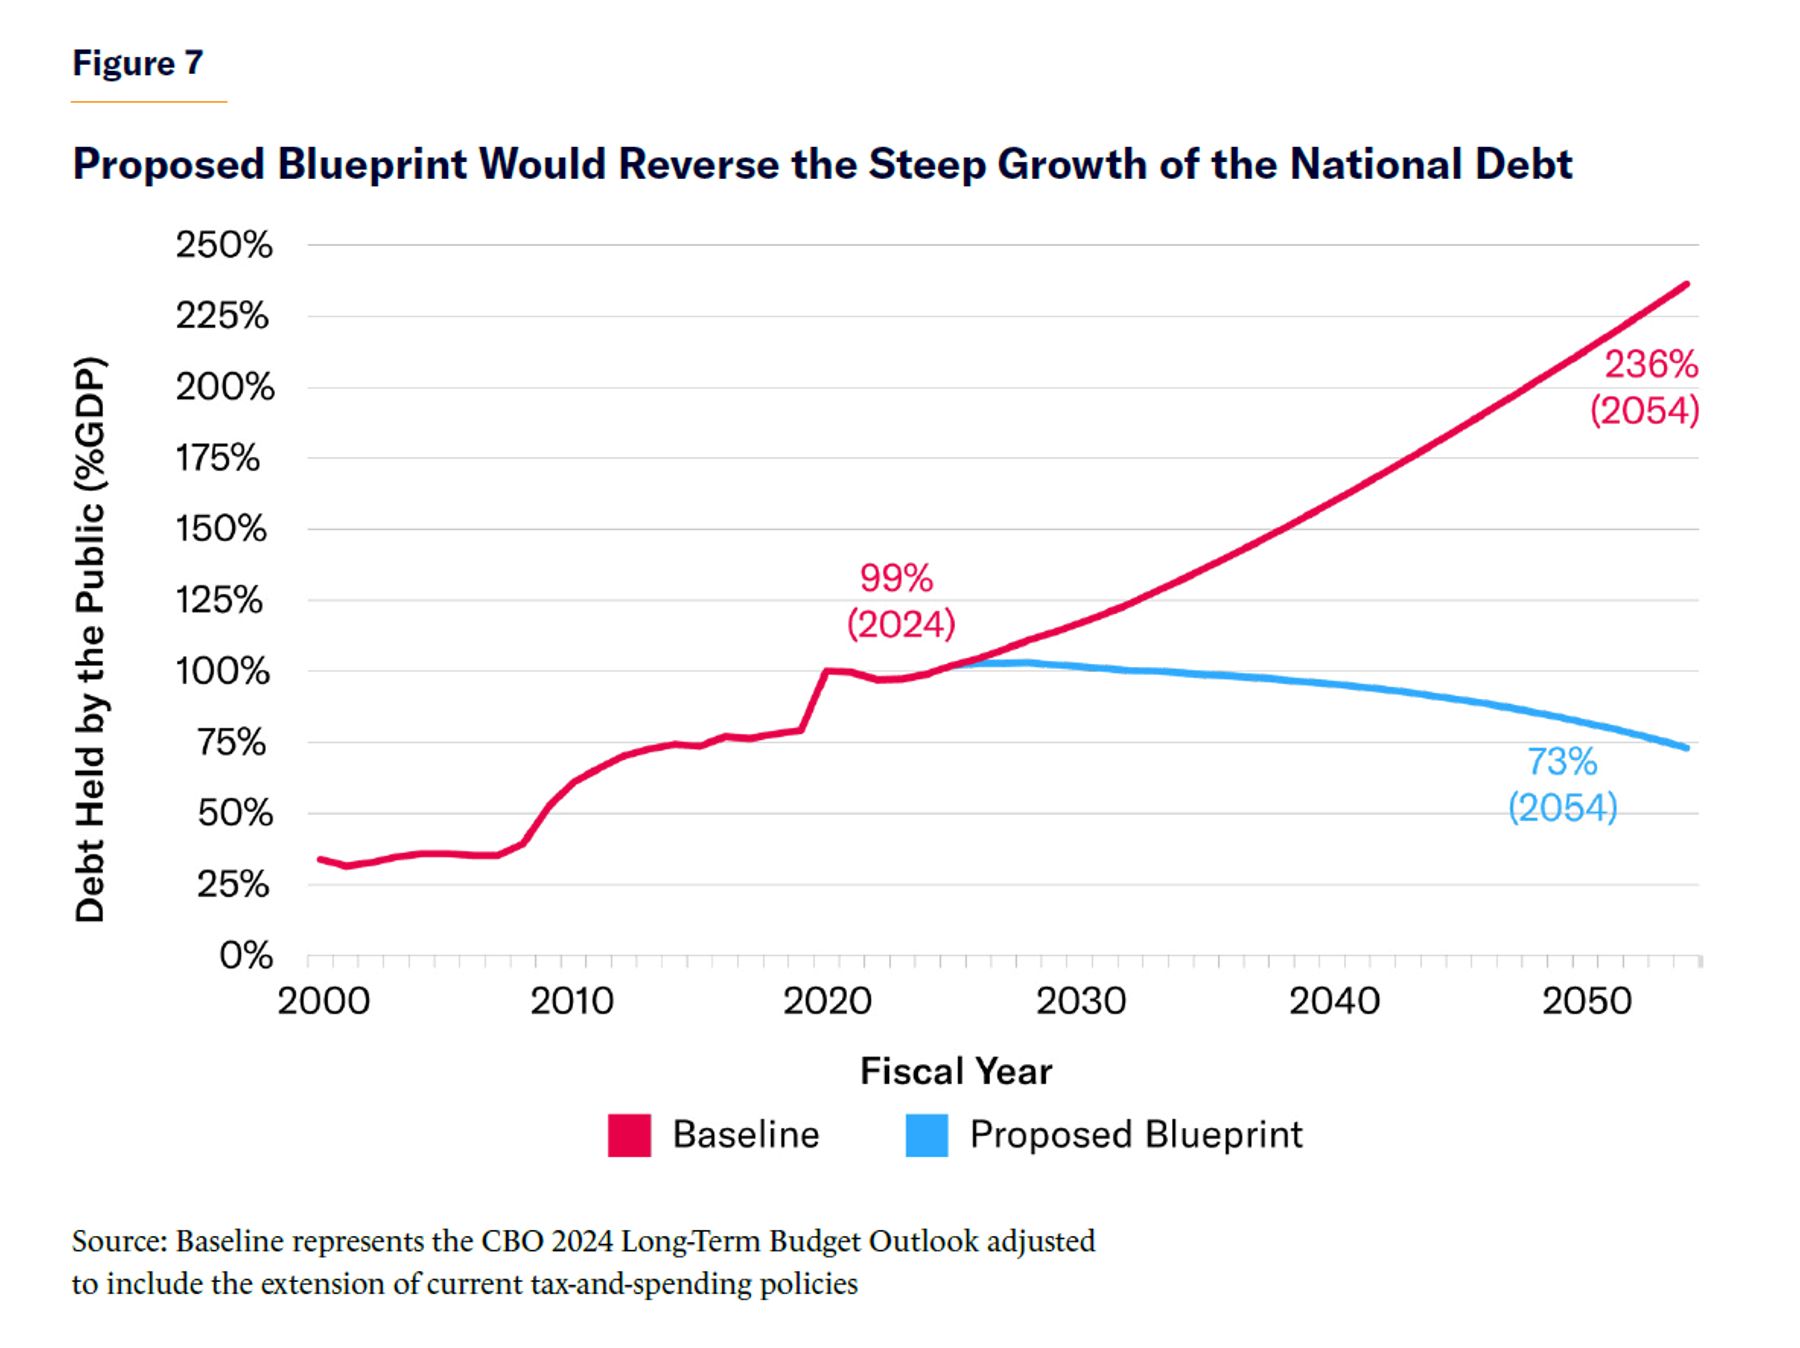
- The blueprint results in eventually matching spending at 21.0% of GDP, with taxes at 20.8% of GDP. Annual deficits fall to 0.2% of GDP, eventually reducing the national debt to 73% of GDP (Figure 7). The latter reduction in the debt ratio to 73% results from the cumulative spending savings ramping up and eventually reducing annual debt interest costs.
Getting from Here to There: Spending
Stabilizing the ratio of debt-to-GDP requires annual tax-and-spending savings (not including interest savings on the national debt) that gradually rise to 5% of GDP by 2054. These reforms are summarized in Table 2 and explained below:
Social Security benefits (1.4% of GDP trimmed from 2054 baseline).[47] CBO projects Social Security to continue collecting 4.5% of GDP in payroll taxes and dedicated revenues. Yet its spending level is projected to rise from 5.0% to 5.9% of GDP over the next decade, and then level off. Instead, this blueprint would gradually phase in reforms that allow spending to peak at 5.6% of GDP and then gradually fall to 4.5% of GDP over three decades—eventually matching the revenues and ensuring a self-financing system. Social Security’s projected 30-year shortfall would fall from $20 trillion (excluding interest) to $8 trillion. Because the currently projected Social Security funding gap far exceeds the shortfalls that induced the 1983 reforms, this new round of reforms must be significantly more bold.[48]
The proposed Social Security reforms do not raise the payroll-tax rate or wage cap because new upper-income taxes are needed to shore up Medicare’s large funding gap and other interest costs (as described in later sections). Instead, this proposal generally protects the bottom-earning 40% of seniors from significant benefit cuts while reducing the growth of benefits for higher-earning retirees. The result is a flatter benefit level across incomes.
Table 2
How the Proposed Blueprint Stabilizes the National Debt
| Current-Policy Baseline (% of GDP) | Blueprint (% of GDP) | 2024–54 Annual Growth | ||||||
| 2014 | 2024 | 2034 | 2054 | 2034 | 2054 | Baseline | Blueprint | |
| Revenue | 17.6 | 17.4 | 16.9 | 17.9 | 19.3 | 20.8 | 3.9% | 4.4% |
| Outlays | 20.4 | 22.8 | 25.6 | 31.4 | 22.5 | 21.0 | 4.9% | 3.5% |
| Mandatory Programs | 12.2 | 13.6 | 15.2 | 16.7 | 13.5 | 12.8 | 4.5% | 3.5% |
| Social Security | 4.9 | 5.2 | 5.9 | 5.9 | 5.6 | 4.5 | 4.2% | 3.3% |
| Medicare | 2.9 | 3.0 | 4.2 | 5.4 | 3.3 | 3.9 | 5.8% | 4.7% |
| Medicaid | 1.8 | 2.0 | 2.2 | 2.5 | 1.8 | 2.0 | 4.6% | 3.8% |
| ACA and CHIP | 0.1 | 0.4 | 0.3 | 0.3 | 0.3 | 0.3 | 3.0% | 3.0% |
| Vulnerable Populations (non-health)** |
1.8 | 1.4 | 1.1 | 1.1 | 1.0 | 0.8 | 2.7% | 1.8% |
| Veterans' Income Benefits | 0.5 | 0.7 | 0.9 | 0.9 | 0.9 | 0.9 | 4.7% | 4.5% |
| Federal and Military Retirement | 0.6 | 0.4 | 0.4 | 0.4 | 0.4 | 0.3 | 3.5% | 2.7% |
| Other Programs | -0.2 | 0.8 | 0.4 | 0.3 | 0.3 | 0.2 | 0.8% | -1.1% |
| Offsetting Receipts | -0.3 | -0.2 | -0.2 | -0.2 | -0.2 | -0.1 | 2.7% | 2.0% |
| Discretionary Programs | 6.9 | 6.2 | 6.0 | 6.0 | 5.6 | 5.5 | 3.7% | 3.3% |
| Defense | 3.5 | 3.0 | 3.0 | 3.0 | 2.8 | 2.7 | 3.7% | 3.3% |
| Non-Defense | 3.4 | 3.2 | 3.0 | 3.0 | 2.8 | 2.7 | 3.7% | 3.3% |
| Net Interest | 1.3 | 3.0 | 4.4 | 8.7 | 3.4 | 2.8 | 7.5% | 3.5% |
| Surplus/Deficit | -2.8 | -5.4 | -8.7 | -13.4 | -3.2 | -0.2 | ||
| Debt Held by the Public | 74 | 99 | 131 | 236 | 99 | 73 | ||
| Memorandum | ||||||||
| Federal Program Spending | 19.1 | 19.8 | 21.2 | 22.7 | 19.1 | 18.3 | 4.2% | 3.5% |
Current-policy baseline reflects the CBO’s 2024 Long-Term Budget Outlook adjusted to extend current tax and spending policies
**Spending on “vulnerable populations”: includes (non-health) antipoverty, unemployment, and family service programs
Source: Author calculations; most new policies would be phased in beginning in 2026.
First, the blueprint raises both the early and normal eligibility ages (currently 62 and rising to 67, respectively) by three months per year, beginning in 2030, until they reach 64 and 69 in 2037. It is simply not affordable for individuals to spend one-third of their adult life collecting Social Security benefits. The eligibility age has been rising gradually since the 1983 Social Security reforms, and that must continue for a while longer. However, to assist workers with delayed retirement, the blueprint would eliminate: 1) the Social Security payroll tax at age 62;[49] and 2) the retirement earnings test, which temporarily reduces the earned benefits for seniors who claim benefits before the full retirement age.[50]
Next, beginning in 2026, initial Social Security benefits would be calculated using price-indexing rather than wage-indexing. As background, Social Security calculates each worker’s initial benefits by inflation-adjusting decades of his/her prior earnings into current dollars, and then applying a percentage-payment rate to that amount. However, that initial inflation-adjusting is done by adjusting lifetime earnings for the historical growth of economy-wide wages rather than prices. Because wages typically grow faster than prices, this results in an over-adjustment for past inflation, which, in turn, means a higher initial benefit than otherwise (once this initial benefit is set, it grows annually by price inflation). This glitch explains why—even among workers with identical real wages—each generation of retirees will automatically receive higher inflation-adjusted benefits than the last. This blueprint would calculate the initial benefits of new retirees using price-indexing rather than wage-indexing.[51]
However, to protect lower-income retirees from this reduction in the initial benefits, Social Security would guarantee a minimum benefit of 125% of the federal poverty line.[52] This would ensure protection from poverty for every Social Security–eligible senior with a full work history.
Additional reforms also beginning in 2026 would:
- Grow annual Social Security benefits by the more accurate chained CPI, once a base benefit is established
- Cancel Social Security’s annual cost-of-living adjustment (COLA) for seniors whose income in the previous year exceeded $100,000 (single) and $200,000 (married), and adjust that threshold annually for inflation
- Gradually increase the number of work years used to calculate benefits for retirees and survivors (but not for disabled workers) from 35 to 38
- Reform the non-working spousal benefit, which is poorly targeted and designed[53]
- Slightly expand the work history requirements for participation in the Social Security Disability Insurance system[54]
The first effect of these reforms is to significantly flatten Social Security benefits, shrinking the benefit gap between high- and low-earners. This would return Social Security to its original social-insurance purpose of poverty protection, rather than distributing many of its largest benefits to high-earners. The other effect is to ensure that average benefit levels grow roughly by price inflation over the long-term (slightly faster for low-earners, slightly lower for high-earners), ensuring parity across generations as well as long-term fiscal sustainability.
Medicare benefits (1.5% of GDP trimmed from 2054 baseline). Medicare is projected to continue collecting between 1.6% and 1.8% of GDP in payroll taxes and related revenues. However, outlays (net of premiums) are projected to soar from 3.0% to 5.4% of GDP over the next few decades. The resulting deficit of 3.7% of GDP plus interest makes Medicare the single largest driver of long-term budget deficits.
This blueprint’s recommendations would: 1) limit 2054 Medicare’s spending to 3.9% of GDP; and 2) raise Medicare revenues to 2.1% of GDP through a 1% increase in the Medicare payroll tax (which is described in the tax section). By reducing spending by 1.5% of GDP and adding 0.35% of GDP in payroll-tax revenues, Medicare’s projected 2054 shortfall would fall in half, from 3.6% to 1.8% of GDP. While the remaining shortfall is still substantial, these recommendations likely represent the ceiling of plausible in-system reform savings in the absence of an unanticipated change in the health economy.[55]
The first place to seek savings is by making Medicare more efficient. The largest efficiencies would come from implementing a premium support system for Medicare Parts A and B, much like the original Medicare Part D (the prescription-drug program), which cost far less than had been originally projected. Instead of the traditional Medicare system’s one-size-fits-all model (which is slightly improved by the Medicare Advantage option), premium support creates a health-care market where insurers must compete for retirees. This model has proved, in the case of Medicare Part D, to empower seniors, encourage innovation, and reduce premium growth. As applied to Medicare overall, this budget proposal’s federal premium support payment would equal the average bid of all competing plans, all of which would be required to offer benefits at least actuarily equivalent to the current system. CBO estimates that premiums paid by retirees would fall by 7%, and the federal Medicare savings for affected beneficiaries would total 8%, by the fifth year.[56] In short, premium support means more choices for seniors, no reduction in benefits, and substantial cost savings both for seniors and the federal government.
In the past, premium support proposals were criticized for tying the payment level to a variable such as inflation or economic growth that might not keep up with the rising cost of health plans—or tying the payment level to one of the lowest-bid plans, thus making it likely that seniors would pay more out-of-pocket for a typical plan. By contrast, the premium support proposal in this report is more generously set at the average local bid. No matter how much health-care costs rise, the premium support payment would remain tied to the cost of the average plan.[57]
Medicare can achieve additional savings by modestly tweaking other payment policies and curtailing spending such as graduate medical education (GME) subsidies[58] and curtailing Medicare’s reimbursements to providers for failures to collect senior out-of-pocket costs (“bad debt”).[59] Overall, efficiency savings could rise to 9% of projected program costs by 2054.[60] The average annual growth rates of Medicare Parts A and B (per-capita) would fall from the current 4.8% projection down to 4.4% (and would decline significantly by the end of the 30-year period).[61]
Once Medicare has maximized its efficiency savings, the next step is to rebalance the responsibility for funding Medicare Parts B and D. Currently, more than 90% of seniors are charged premiums that cover no more than 26% of the cost of their coverage. Taxpayers fund the rest. The federal subsidies for Medicare Parts B and D were not “earned” with earlier payroll taxes—which contribute only to Medicare Part A.
The blueprint gradually raises total senior premiums to cover 50% of Medicare Part B costs—which matches the original program design[62]—and 30% of Medicare Part D costs. The monthly premiums would rise on a sliding scale, based on current, post-retirement income. Retirees whose income is at or below the 40th percentile would see no premium hikes. However, the Part B monthly premium would increase between the 41st and 80th income percentile, until it reaches 95% of the cost of the insurance plans. The Part D monthly premium would gradually rise for those above the 40th percentile until it reaches 85% of the cost.
These higher premiums will be more affordable because they are partially offset by efficiency gains from the premium support mechanism that should lower total Medicare Part B costs. Once fully phased in, total Medicare premiums would rise by approximately 3% of aggregate senior income relative to the baseline. The “group impacts” section later in this report breaks down the cost per retired family across incomes.
This blueprint leaves the Medicare eligibility age at 65. CBO estimates that raising the Medicare eligibility age would provide only limited federal budget savings.[63] The small savings are not worth the upheaval.
Altogether, these policies would reduce Medicare’s (noninterest) shortfall projected over 30 years from $49.1 trillion to $25.7 trillion, as follows:
- Premium support would save $5.1 trillion over 30 years and 0.46% of GDP by 2054[64]
- Hiking Part B premiums would save $10.4 trillion over 30 years and 0.85% of GDP by 2054
- Hiking Part D premiums would save $1.3 trillion over 30 years and 0.10% of GDP by 2054
- GME and “bad debt” reform would save $1.2 trillion over 30 years and 0.11% of GDP by 2054
- On the revenue side, raising the Medicare payroll tax would collect $5.5 trillion over 30 years and 0.35% of GDP by 2054 (this figure is excluded from the 1.5% of GDP listed above and is counted in the tax section below).
These reforms likely maximize Medicare’s conceivable budget saving, given the expanding retiree population and the persistence of even modest health inflation. Not much more can be saved from income-relating Medicare premiums without severely burdening the bottom 40% of earners.[65] For those who consider these efficiency savings timid, saving another 0.5%–1.0% of GDP on efficiencies would require savings of 20%–30% below the 2054 spending projections—a worthy goal that is too bold to be assumed.[66]
Medicaid (0.5% of GDP trimmed from 2054 baseline). Recent eligibility expansions and natural caseload increases have raised federal Medicaid spending from 1.13% to over 2.0% of GDP since 2007—and spending is projected to reach 2.5% of GDP within 30 years. Achievable reforms can maintain Medicaid spending at 2.0% of GDP while improving the program.[67]
Congress should first address the 90% long-term federal reimbursement rate for the newly eligible population of nondisabled, working-age adults with higher incomes that was implemented as part of the Affordable Care Act (ACA) in 2014. States should continue to be allowed to include these newly added adults in their Medicaid programs; but no rational explanation exists for Washington subsidizing nondisabled, higher-earning, working-age adults on Medicaid with a much higher reimbursement rate than children, the elderly, and the disabled. Congress should repeal this higher reimbursement rate.
This blueprint would cap Washington’s per-capita Medicaid payments to states, beginning in 2026. The current system irrationally reimburses a preset percentage of state Medicaid costs, which means that the more a state spends, the larger its federal subsidy. The current system also restricts state innovation in health care, such as health savings accounts (HSAs). Per-capita caps would provide an incentive and the added flexibility for states to devise innovative coverage for low-income residents. States developing successful approaches will certainly be copied by other states.
In keeping with the principle that deficit reduction should not simply dump the federal budget deficit onto states, the per-capita caps would be significantly looser than those proposed by Senate Republicans in their 2017 proposal. They proposed limiting the annual growth rate of the per-capita caps to the CPI-U (Consumer Price Index for All Urban Consumers, currently projected at 2.3%) when fully phased in. By contrast, this blueprint would allow the caps to grow by 3.5% annually for children and adults and 4.0% annually for the elderly and disabled (a weighted average of 3.8%). This is not too far below the estimated 4.6% annual growth in per-capita Medicaid spending assumed in CBO’s long-term budget baseline. Innovative governors should be able to stay under these more generous caps without raising state taxes or deeply limiting eligibility.
Overall, under this blueprint, federal Medicaid spending would quickly dip from 2.0% to 1.7% of GDP because of resetting the payment rates for the ACA expansion population, before gradually rising back to 2.0% over three decades. Still, federal Medicaid spending is likely to grow somewhat faster than the economy after the initial ACA reset because the annual growth of proposed per-capita spending (3.8%) plus the Medicaid population (0.3%) will slightly exceed the 3.8% projected annual growth of the nominal GDP that is projected by CBO in its 30-year baseline. While the federal government could save another 0.5% of GDP off the projected 2054 total by capping annual growth at 2.7% for all populations, it is unlikely that governors could bring per-capita cost growth down near CPI. Thus, governors would strongly resist such tight federal caps, and the added federal savings would most likely translate into state tax increases, anyway.
Health exchanges and CHIP (no changes). No cost changes. Health spending on ACA subsidies and the Children’s Health Insurance Program (CHIP) are projected to remain around 0.4% of GDP during 2024–54 because of rising per-capita health costs. While the ACA subsidy system has many flaws, any reforms or replacement would likely involve a similar level of spending (and ACA’s Medicaid expansion is addressed in the previous section). As far as the national debt–GDP ratio is concerned, even somehow cutting the cost of ACA and CHIP by 25% would save just 0.1% of GDP.
Other mandatory programs (0.45% of GDP trimmed from 2054 baseline). The remaining mandatory programs are projected by CBO to dip from 3.0% to 2.5% over the next decade as more temporary pandemic costs expire, after which this report’s baseline freezes the spending at 2.5% of GDP.[68] The reform proposals would gradually shave 0.45% off this spending over three decades, until it reaches 2.05% of GDP.
The full 0.45% of GDP in savings is achieved by limiting post-2034 spending growth to the inflation rate plus population growth (roughly 2.6% annually), rather than allowing it to grow with the nominal GDP at a 3.6% annual rate. However, this blueprint increases spending in two other areas:
- Ensuring that post-2034 veterans’ income benefits grow at the aforementioned 3.6% annual rate with the economy, rather than merely the 2.6% inflation plus population rate
- Renewing the Inflation Reduction Act’s added IRS enforcement funding after its scheduled 2031 expiration (which produces significant tax revenues).
Those two expansions are offset by:
- Consolidating student loan and income-driven repayment programs
- Extending the current mandatory spending sequester beyond 2031
- Raising premiums for the Pension Benefit Guaranty Corporation (PBGC)
- Reforming farm commodity, crop insurance, and conservation subsidies[69]
- Switching annual inflation adjustments to the more accurate chained CPI[70]
Conservative blueprints often claim that much greater savings can be achieved from this spending category. However, it is unclear where the plausible savings would come from. The largest portion of this category is the 1.3% of GDP spent on vulnerable populations. This includes SNAP (food stamps), the Earned Income Tax Credit (EITC), Supplemental Security Income (SSI), unemployment benefits, child nutrition programs, child tax credit outlays, adoption assistance, Temporary Assistance for Needy Families (TANF), child-care assistance, and similar programs. Even the most aggressive SNAP work requirements would save perhaps 0.1% of GDP, and recent legislative history shows that EITC and child tax credit will more likely be expanded rather than pared back. True enough, a more effective welfare system would devolve much of its spending to states; but shifting the address where taxes are mailed should not count as a major deficit reduction or savings to taxpayers. This proposal’s plan to limit this spending growth to inflation plus population growth beyond the 2025–34 CBO baseline would gradually save 0.2% of GDP between 2034 and 2054 without reducing eligibility or benefits. Limiting federal overpayments to beneficiaries can also provide budget savings of an indeterminate amount.
Nearly half of all “other mandatory” spending consists of veterans compensation and its toxic exposure fund (0.75% of GDP and rising), military pensions (0.2% of GDP), and federal employee pensions (0.25% of GDP). Recent wars and the aging of the population will increase these costs. Congress understandably will not rein in benefits for veterans’ and military personnel, and even reforms of the federal employees’ pension system would likely be phased in slowly. After staying on CBO’s baseline through 2034, the blueprint assumes that subsequent veterans’ income benefits grow with the economy, and civilian and military retirement benefits grow with inflation and population.
The remaining small sliver of mandatory program spending includes farm subsidies and student loans (which are each pared back above) as well as several other federal insurance and loan programs. This category of spending could also achieve significant offsets by privatizing or terminating lower-priority programs and selling excess federal land and assets. These savings could finance stronger growth in veterans’ benefits or an expanded EITC.
Discretionary programs (0.55% of GDP trimmed from 2054 baseline). Like “other mandatory spending,” discretionary spending is often a magnet for unrealistic budget-cutting proposals. Liberals often overestimate plausible defense cuts, while conservatives go overboard on unspecified nondefense cuts.[71]
Discretionary spending is currently 6.2% of GDP, and this report’s baseline freezes it as 6.0% of GDP moving forward (unlike the CBO current-law baseline, which is required to assume drastic long-term reductions in this spending as a share of GDP). This blueprint would allow this spending to gradually decline to 5.45% of GDP over three decades—the lowest level since this spending category was first defined in the early 1960s. This would be accomplished by allowing the spending from the 2021 Infrastructure Investment and Jobs Act to expire on schedule in 2026, and then capping all remaining appropriations growth at 3.5% annually. This blueprint also proposes to maintain parity between defense and nondefense spending levels—as a bipartisan compromise and an acknowledgment that neither category can be reduced as deeply as partisans on either side wish.
It is fashionable in some quarters to criticize America’s “outlier” defense budget and advocate spending closer to the 2% of GDP targeted by major European allies. However, the U.S. has already moved substantially in that direction. After topping 9% of GDP during the Vietnam War, defense spending averaged 6% under President Reagan, before the end of the Cold War dropped defense spending to 2.9%. The wars in Iraq and Afghanistan briefly pushed defense spending as high as 4.7% of GDP; yet it has since fallen back to 2.9%. Because this blueprint caps annual defense spending growth at 3.5%—which is slower than the projected 3.8% nominal growth of the economy—defense spending would gradually fall to 2.7% of GDP (the lowest level since the 1930s). The Pentagon should be able to absorb a gradually lower percentage of GDP as long as annual spending can keep up with the cost of equipment and compensation. Deeper cuts would face bipartisan opposition from defense experts and from lawmakers who do not wish to surrender America’s status as a military superpower or slash troop compensation levels.
Nondefense discretionary spending is currently 3.3% of GDP on the lower end of the 3%–4% range that has prevailed for 40 years. The proposed 3.5% annual growth rate would nonetheless gradually bring spending down to 2.7% of GDP (the lowest level since the category’s creation) because the economy is projected to grow slightly faster than these appropriations.
Conservative blueprints have sought to eventually decrease nondefense discretionary spending from today’s 3.3% down to below 2% of GDP. In reality, neither party would likely consider drastic cuts to veterans’ health care—by far, this category’s largest expenditure—as well as highways and infrastructure, K–12 education, homeland security, and the National Institutes of Health. Whatever the merits of targeting the National Endowment for the Arts, public broadcasting, and congressional salaries, they are of vanishingly small budgetary consequence—about 0.005% of GDP. Many nondefense discretionary programs are candidates for devolution to states; yet those savings should not count as a major deficit reduction if they simply result in additional state taxes or deficits.
To be sure, permanently capping the growth of discretionary spending growth at 3.0% rather than 3.5% could save an additional 0.7% of GDP annually by 2054. However, that would leave little room for the steeply rising cost of veterans’ health care (which has averaged 10% annual growth since 2018). It would also push national security spending even further below levels deemed plausible, and also push domestic discretionary spending down to a share of economy that has not been seen in nearly a century. Tight discretionary caps are feasible for perhaps a decade, but it is unlikely that Americans will put all other major government initiatives on hold for 30 years, solely to maximize Social Security and Medicare benefits.
Getting from here to there: Taxes (2.9% of GDP raised from 2054 baseline). Relative to a current-policy baseline, the spending reforms in this blueprint would produce budget savings that gradually grow to 4.7% of GDP annually by 2054. To reach the blueprint’s overall target of more than 5% of GDP in noninterest savings, the rest must come from new taxes. Additional taxes are also necessary to reduce the debt ratio below 100% of GDP, or to provide budgetary space for unanticipated emergencies.
Tax revenues have averaged 17.4% of GDP since the 1960s. A current-policy baseline already assumes that revenues will gradually rise from the current 17.5% to 17.9% of GDP over three decades. This blueprint would gradually raise an additional 2.9% of GDP in taxes to reach 20.8% by 2054. The taxes can be grouped as follows:
- Primarily businesses and upper-income families (1.3% of GDP in 2054)
- Raise top income tax bracket from 37% to 39.6% (0.11% of GDP)
- Cap value of itemized tax deductions at 15% of amount deducted (0.21%)
- Impose a modest carbon tax with the cost rebated to all but top-earning 25% of households (0.09%)
- Repeal Tax Cuts and Jobs Act’s (TCJA) 20% pass-through business deduction (0.40%)
- Repeal step-up basis on inherited capital gains (0.07%)
- Repeal energy credits in the Inflation Reduction Act (IRA) (0.18%)
- Extend IRA’s funding for IRS tax enforcement beyond 2031 (0.07%)
- Other small tax reforms (0.17%)
- Broader tax increases (1.6% of GDP)
- Cap tax exclusion for employer-provided health care at 50% of the average premium (1.09%)Raise Medicare payroll tax rate by 1 percentage point (split between employer and employee) (0.40%)Raise gas tax by 15 cents per gallon and index for inflation (0.08%)
- New tax relief (no cost)
- End Social Security payroll tax at age 62 (zero net cost)[72]
It must be emphasized that this blueprint is based on a current-policy baseline that automatically incorporates an extension of the 2017 tax cuts. This is because, conceptually, a baseline should present a long-term budget projection of the default option of continuing today’s tax and spending policies. Once a baseline begins assuming changes to tax and spending policies along the way, it ceases to present a clear default scenario against which to measure changes from today’s policies.[73] Thus, the report’s recommendation that Congress not renew TCJA’s 20% pass-through tax deduction or its reduced 37% top tax rate are scored as new tax increases relative to current policies.
Generally, this blueprint aims to include “tax the rich” policies that do not dramatically increase marginal tax rates. The top marginal tax rate on wages already approaches 50% when combining the 37% federal income-tax rate, 2.9% Medicare payroll tax, 0.9% additional Medicare tax, and state tax rates exceeding 10% in California and New York (where many of these high earners reside). This blueprint adds 3.6% to the top combined tax rate by raising the top income-tax bracket by 2.6% and hiking the Medicare payroll tax by another 1%. It does not eliminate the Social Security tax cap of $168,600 in wages because imposing that 12.4% Social Security payroll tax would push the top marginal tax rates into the mid-60s for many top-earners. That might exceed the revenue-maximizing tax rate because it would significantly reduce incentives to work, save, and invest among high-earners and pass-through business owners who have the flexibility to cut work hours, limit business expansions, and shift compensation out of wages and into lower-taxed benefits or investments. This would not only bring broader economic harm, it would also limit the amount of new tax revenues raised.
Instead, this blueprint focuses its “tax the rich” policies more on aggressively cracking down on tax preferences, tax evasion, and loopholes to avoid capital gains taxes. It also replaces the IRA’s new clean energy tax credits (which are already well over-budget) with a carbon tax.
Within broader tax increases, capping the employer health care tax exclusion is both sound tax policy and sound health policy. Many economists agree that the employer health exclusion encourages businesses to overspend on health benefits and downplay cost-containment, while disproportionately benefitting upper-income employees who would otherwise pay higher tax rates on that compensation. It also penalizes families that buy their own health insurance and do not get a tax break. Capping the exclusion will contribute to broader efficiency savings in health care. It will also raise revenue not only from businesses paying the tax on generous health plans, but also from families receiving more of their compensation in the form of (taxable) wages—which still might result in higher take-home pay.
Raising the 2.9% Medicare payroll-tax rate by 1 percentage point is necessary because Medicare faces a 30-year cash shortfall of $49 trillion ($87 trillion including interest costs) that cannot be addressed on the spending side alone. A tax-rate increase of 1 percentage point is also minimally disruptive to families and the economy. Given Medicare’s massive shortfalls, its modest 2.9% payroll tax (split between employee and employer) is surely insufficient.
Those who would prefer that all new taxes come from upper-income taxpayers should note that these taxpayers would already bear nearly the entire cost of 3% of GDP in Social Security and Medicare reforms—as well as 1.3% of GDP in new taxes and most of the cost of scaling back the employer health exclusion. The bottom half of earners would see only a 1% payroll tax hike (which will help finance their own Medicare benefits) and a small gas-tax increase (a user fee needed to close the shortfalls in the highway program)—plus the benefits of no Social Security payroll taxes beginning at age 62. Given the principle that everyone should contribute to closing these shortfalls, low-earners are overwhelmingly shielded from new costs.
Sticking to the Blueprint
Congress must ensure a budget process that aligns with any “grand deal” reforms and enforces budget discipline. To that end, Congress and the president should enact legislation capping the size of the federal debt at the current level of 100% of potential GDP (or slightly higher during a transition period when reforms are phased in). Measuring the debt against potential GDP (which adjusts for booms and recessions) would prevent painful consolidations whenever the economy slips into recession. Congress could require a supermajority vote to pass any bill that would push the projected long-term debt over the cap. Debt overages driven by automatic spending and tax policies could trigger automatic spending-and-tax changes (unless Congress enacts alternative savings reforms). Even supermajority-approved overages could require savings to return the debt gradually to its 100%-of-GDP target.[74]
A potential danger arises from the political reality that major entitlement reforms will be highly controversial while producing small short-term savings. This might tempt Congress to meet near-term debt targets by replacing entitlement reforms with other less-controversial savings. Yet Social Security, Medicare, and Medicaid reforms must remain on schedule for their savings to significantly ramp up and provide most of the deficit reduction in the 2030s, 2040s, and 2050s.
To that end, every five years, lawmakers should be required to ensure that Social Security, Medicare, Medicaid, and tax revenues each remain on their original 30-year path and to enact further reforms for any category whose savings are not materializing.[75] Failure to return any veering categories to their preset path would trigger automatic reforms to the given category.
Group Impacts
Seniors. Well-off retirees will shoulder most of the costs of bringing Social Security and Medicare finances to a sustainable level. As described earlier, the wealthiest half of seniors often have incomes and net worths (even excluding illiquid home equity) that exceed those of young workers, while typically not having mortgage or child-raising expenses.
Table 3 shows the costs of Social Security and Medicare reforms at various retirement income levels in the future. Incomes include Social Security benefits and retirement distributions, and all figures are adjusted for inflation.[76] For Social Security, figures assume that the individuals turn 65 in the listed year.
- Seniors with household incomes below the 40th percentile come out largely unchanged in Social Security (although the eligibility age rises) and also come out roughly equal in Medicare.
- Senior households in the 41st–60th income percentile—with an average household income of $92,000 in 2035—would face approximately $2,700 less than currently estimated in annual Social Security benefits and $2,800 in higher Medicare premiums.[77] This 6%-of-income cost would rise to roughly 10% by 2054.
- Senior households in the 61st–80th income percentile—with an inflation-adjusted average household income of $137,000 in 2035—would face approximately $4,200 less than currently estimated in annual Social Security benefits and $7,300 in Medicare changes, totaling 8% of their income (and rising to 12% by 2054). This burden would not be easy, although the retirement income of this group would well exceed the income of many families that would otherwise be taxed to finance their benefits.
- Retiree households in the 81st–90th income percentile—with average household incomes of $257,000 by 2035—would experience a decline in their projected Social Security benefits of $5,700 and a rise in Medicare premiums of $15,000. This would average 8% of their income in 2035, rising to 11% by 2054.
- The highest-earning 10% of retiree households—with average household incomes of $478,000 by 2035—would experience a decline in their projected Social Security benefits of $7,400 and a rise in Medicare premiums of $5,700. This would average 3% of their income in 2035, rising to 5% by 2054. This figure is dampened by the fact that these households already pay as much as 85% of their Medicare Part B and D plan costs, which leaves less room to raise their premiums higher even if those premiums were set at 100% of the cost of coverage (this proposal raises their Part B premium to 95% of the cost of coverage).
As stated earlier, these figures might overstate the effect of the Social Security cuts because they are measured against a baseline in which future retirees would receive much higher benefits than current retirees, even adjusting for inflation. Under the proposed reforms, the average inflation-adjusted benefit level would remain roughly frozen after 2026. Below-average earners would continue to see benefits rising slightly faster than inflation, while high-earning retirees would see their benefits slightly trail the inflation rate. These effects would result in a more uniform, flat Social Security benefit across the income distribution.
Table 3
Impact of the Blueprint’s Social Security and Medicare Proposals on Retiree Income
| Post-Retirement Income Group | |||||||
| 2035 | 1–20% | 21–40% | 41–60% | 61–80% | 81–90% | 91–100% | All |
| Baseline Income | $29,225 | $56,035 | $91,933 | $137,112 | $257,290 | $477,825 | $132,389 |
| Reform Effects | -$2 | -$480 | -$5,496 | -$11,489 | -$20,816 | -$13,124 | -$6,567 |
| Social Security | $0 | -$478 | -$2,655 | -$4,220 | -$5,680 | -$7,384 | -$2,777 |
| Medicare | -$2 | -$2 | -$2,842 | -$7,269 | -$15,137 | -$5,741 | -$3,790 |
| New Income | $29,223 | $55,556 | $86,437 | $125,623 | $236,474 | $464,701 | $125,822 |
| 2035 Effects (% Income) | 0.0% | -0.9% | -6.0% | -8.4% | -8.1% | -2.7% | -5.0% |
| Post-Retirement Income Group | |||||||
| 2054 | 1–20% | 21–40% | 41–60% | 61–80% | 81–90% | 91–100% | All |
| Baseline Income | $39,318 | $89,559 | $146,933 | $219,140 | $411,216 | $763,686 | $204,452 |
| Reform Effects | $98 | -$1,650 | -$14,244 | -$27,219 | -$45,367 | -$36,314 | -$16,250 |
| Social Security | $0 | -$1,762 | -$9,787 | -$15,557 | -$20,940 | -$27,222 | -$10,237 |
| Medicare | $98 | $112 | -$4,456 | -$11,663 | -$24,427 | -$9,092 | -$6,013 |
| New Income | $39,415 | $87,909 | $132,689 | $191,920 | $365,849 | $727,372 | $188,202 |
| 2054 Effects (% Income) | 0.2% | -1.8% | -9.7% | -12.4% | -11.0% | -4.8% | -7.9% |
Source: Author’s calculations, based on CBO data
Note: All figures in constant (2024) dollars. Baseline income by quintile estimated based on CBO income data. Figures assumes Social Security benefits roughly align with post-retirement income quintile. Calculations should be considered approximations based on limited available data.
To a degree, the costs of the blueprint’s changes to retirees (both current and future) could be mitigated by expanding 401(k) contribution limits and by further encouraging auto-enrollment and contribution auto-escalation of employer retirement accounts. This report also proposes eliminating Social Security payroll taxes for workers at age 62, in order to encourage seniors who wish to stay in the workforce and to essentially subsidize employers who hire them.
Working-age adults. To improve generational equity, this blueprint largely shields working families from what would otherwise be the largest intergenerational wealth transfer in world history. Yet most working adult earners would still receive their entire 2017 tax cuts extended and would be hit with only a 1% payroll-tax hike, a gradual capping of the tax exclusion for employer-provided health-insurance premiums, a modest gas-tax increase, and social programs growing at a slightly slower pace than the economy. Compared with the alternative of gradually imposing a 36% VAT or 29.6% payroll-tax rate—which would cost economic growth as well as direct taxes—this blueprint provides a much more affordable outcome for working families.
Poor families. This blueprint resists the common conservative tactic of assuming large and unrealistic cuts in antipoverty spending. From the perspective of good public policy, significant antipoverty reforms are needed to encourage work and opportunity. From the perspective of the federal budget, most realistic reform proposals do not provide significant savings, especially up front. For that reason, and despite large reductions elsewhere, this blueprint largely protects antipoverty spending from budget cuts. Health-care spending on Medicaid, CHIP, and ACA exchanges would remain at 2.4% of GDP. Other means-tested entitlement programs would grow with the CBO baseline for the next decade, and with inflation and population growth thereafter. Programs such as housing assistance, which are funded in annual appropriations, would see an average growth rate of 3.5%. Low-income seniors would be largely protected from Social Security and Medicare savings. Total antipoverty spending as a share of the economy would remain at roughly pre-pandemic levels and above all earlier levels. Given the size of the fiscal consolidation proposed in this blueprint, it is fair to say that the safety net is well protected.
State and local governments. Deficit reduction should not simply mean shifting taxes and debt onto state and local governments. This blueprint proposes Medicaid per-capita caps at levels that governors should be able to absorb within their existing budgets. It also assumes that most grant programs to state and local governments will grow by the inflation rate or even faster. Many state and local governments have their own unsustainable pension costs to tackle, and this blueprint avoids overburdening them with significant new costs.
IV. In Defense of the Plan
Answering Conservative Critics
At first glance, many conservatives will dismiss the proposals in this report as overly timid. Specifically, raising taxes by 2.9% of GDP rather than aggressively lowering antipoverty and nondefense discretionary spending might be considered a weak-kneed surrender to big government.
Instead, it is an acknowledgment of political reality. State governors will not accept or absorb Medicaid caps that grow no faster than the inflation rate. ACA will not likely be replaced with nothing, as proved in 2017. The 1.3% of GDP spent on non-health antipoverty entitlements—which includes conservative-supported policies like the refundable EITC and child credit, as well as generally untouchable programs like child nutrition and SSI—can gradually decline as a share of the economy, but they will not be eliminated or even halved in any foreseeable political future. Other mandatory and nondefense discretionary spending (already proposed to grow slightly slower than the economy, dipping from 5.0% to 4.0% of GDP over three decades) is dominated by veterans’ income and health benefits, military and federal pensions, unemployment benefits, highways and infrastructure, the National Institutes of Health, homeland security, disaster relief, and K–12 funding. They are here to stay.
Simply put, this blueprint’s 4.4% of GDP figure represents the likely outer bounds of plausible long-term spending cuts relative to the 2054 baseline. And because those spending savings take decades to ramp up (with taxes doing more of the heavy lifting in the meantime), a “tax-free” debt-stabilization scenario would require an additional 1.8% of GDP in spending savings during the first two decades without the typical time to ramp up. The voting public would not accept an immediate 1.8% of GDP evisceration of the safety net and domestic spending just to keep tax increases completely off the table.
This blueprint reduces 2054 federal program spending by 1.5% of GDP from 2024 levels, despite 74 million Americans retiring into Social Security and Medicare, swelling health-care costs, and rising interest rates on the national debt. It is easy to come up with a “conservative dream budget” that would show greater spending savings. But even a hypothetical Republican congressional supermajority would find it politically suicidal to fully overhaul Social Security and Medicare without Democratic buy-in. The political model should be the bipartisan 1983 Social Security reforms, not the 2010 ACA.
Conservatives are in an especially perilous position. Delay likely guarantees that an eventual budget deal will be increasingly tax-heavy. As we have mentioned several times, each year, 4 million more baby boomers retire, while Social Security and Medicare benefits automatically increase—essentially closing the window on reforming those programs. Additionally, delays bring permanently higher interest costs on the growing national debt. Together, these two developments mean that the savings needed to stabilize the budget will continue escalating at exactly the time when baby-boomer retirements and rising benefits make Social Security and Medicare more difficult to reform.
Consequently, if lawmakers wait another five to 10 years, they will likely have missed the window on entitlement reform; and tax increases, including a VAT of 10%–15%, will become overwhelmingly likely to avoid a debt spiral. This VAT would probably be enacted at a low 1%–2% rate, but—like the income tax a century earlier—would quickly grow into a massive federal cash machine to finance continued government expansions.
It is no longer possible to stabilize the national debt with revenues at 17%–18% of GDP because the adjoining long-term spending requirement of 20%–21% of GDP (in order to cap deficits at 3.5% of GDP and thus keep the debt at 100% of GDP) is no longer plausible, at least until a significant reduction in the debt ratio reduces net interest costs. The required spending cuts to Social Security, Medicare, defense, veterans, and safety-net programs would grow impossibly brutal over time, and voters would never accept extra-deep benefit cuts to shield millionaires and corporations from having to contribute any new taxes to close this fiscal gap. Conservatives can either: 1) concede 2% of GDP in limited taxes now, as part of a grand deal with fundamental spending reform; or 2) wait 10 years and end up with little to no spending savings and a European-size VAT.
Answering Liberal Critics
Many liberals will also dismiss this proposal at first glance. Medicare premium support, significant income-relating of Social Security and Medicare benefits, and state Medicaid per-capita caps might be considered nonstarters—especially when paired with “only” 2.9% of GDP in tax increases that are not limited to “millionaires.”
However, the mathematical reality is that taxing the rich cannot achieve the (eventually) 5% of GDP in noninterest savings needed to keep the long-term debt from exceeding 100% of GDP. Even doubling the 35% and 37% income-tax brackets to 70% and 74% (or closer to 90%, including existing state and payroll taxes) would raise at most 1.5% of GDP before accounting for losses to behavioral responses. Alternatively, eliminating the wage cap on Social Security taxes (a 12.4% tax rate increase) would raise 0.9% of GDP (also before accounting for behavioral responses) and start far below the $400,000 income threshold. Restoring the developed world’s highest corporate-tax rate would raise, at most, 0.6% of GDP. Senator Bernie Sanders’s proposed 77% estate-tax rate and (likely unconstitutional) 8% wealth tax—far exceeding the rates that Europe abandoned as unworkable—would together raise 0.7% of GDP. Proposals popular on the left to significantly raise taxes on capital gains, banks, hedge funds, multinational corporations, and oil and gas companies would barely register in the long-run accounting. The unforgiving budget math shows that heading off a debt crisis mostly through taxes must require a huge burden on the middle class.
Furthermore, it is unclear why progressives would want to set all corporate and upper-income tax rates at their revenue-maximizing levels—dwarfing even Europe’s most punitive tax-the-rich policies—just so that (often) wealthy baby boomers can receive Social Security and Medicare benefits far exceeding their lifetime contributions to the system. This would leave little to no room to tax the rich to pay for traditional progressive priorities such as climate-change mitigation, free college, student loan forgiveness, health care coverage expansions, K–12 education, infrastructure, child care, family leave, safety net, and housing. At least when Europeans pay exorbitant taxes, they directly receive concurrent health, education, and safety-net benefits. They are not redistributing the bulk of their backbreaking taxes to seniors who are often wealthier than them.
Overall, raising taxes by 2.9% of GDP will bring revenues above 20% of GDP on a sustained basis for the first time in U.S. history.[78] Working Americans would be included in the modest 1% payroll-tax hike and 15-cent-per-gallon gas tax. But upper-income Americans—already absorbing the vast majority of the 3% of GDP in Social Security and Medicare spending reforms—would also face their highest tax burden in American history.[79]
Within the spending side, the blueprint already assumes that defense spending eventually falls to 2.7% of GDP for the first time since the 1930s. Spending on low-income families and discretionary social spending is largely shielded from the budget ax. Medicare-for-All is not a workable solution: even if Congress somehow came up with a $30 trillion tax to finance the $30 trillion takeover of the private health economy (10-year figures),[80] that would primarily affect individuals younger than 65 with private health insurance. It would not significantly alter the existing “old age” Medicare program or its projected $49 trillion noninterest shortfall.
The only remaining options are dramatic middle-class tax increases or reform of the Social Security and Medicare systems driving the deficits. For liberals who believe that “the rich” should pay their “fair share,” trimming their large Social Security benefits and Medicare subsidies accomplishes the same redistribution as raising upper-income taxes, but without the economic damage. Furthermore, paring back their benefits avoids the intergenerational redistribution of burying today’s workers in taxes to finance baby-boomer benefits. Within a decade, the wealthiest half of seniors—in other words, the wealthiest members of the wealthiest age group—are scheduled to collect nearly $500 billion in annual Medicare Part B and D subsidies that were never earned with payroll taxes. Paring back those upper-income subsidies would free up significant resources for higher priorities.
The Medicare-premium support policy proposed here is generously set at the level of funding of the average-bid plan, rather than the more common second-lowest bid proposals. The premium support concept itself has achieved bipartisan support through the 1999 National Bipartisan Commission on the Future of Medicare (Breaux-Thomas) and the Bipartisan Policy Center’s 2010 Debt Reduction Task Force (Domenici-Rivlin)—and has much in common with ACA’s health exchanges.[81] The Medicaid per-capita caps are much looser than the 2017 Senate Republican proposal and would not likely force politically unacceptable cuts. ACA and antipoverty spending benefits are maintained; discretionary spending would continue to see parity between the defense and nondefense sides.
If progressives do not reform Social Security and Medicare before even more baby boomers retire and costs escalate further, their own social spending priorities will eventually be dramatically squeezed—and taxes will be raised substantially on working families, not just the wealthy—all to redistribute income upward to a wealthier generation.
Conclusion
For decades, economists and policy experts warned that a budgetary and economic tsunami would come when the 74 million baby boomers retire into Social Security and Medicare. Nevertheless, a parade of presidents and Congresses did nothing to avert the crisis. To the contrary, both parties added a new Medicare drug entitlement in 2003, after which the Affordable Care Act further expanded federal health obligations for Medicaid and new subsidized health-insurance exchanges.
Today, a large majority of all baby boomers have already retired, and nearly all the rest will retire by 2030. Annual budget deficits have already exceeded $2 trillion[82] even during peace and prosperity, and are likely to surpass $3 trillion within a decade. Overall, the Social Security and Medicare systems face an unfathomable $124 trillion cash deficit over 30 years.
Without reform, runaway deficits all but guarantee a debt crisis that will profoundly damage the country’s economic and social order. There is still time to avoid that crisis, but it will require the nation’s fractious political leaders to leave their respective comfort zones and compromise.
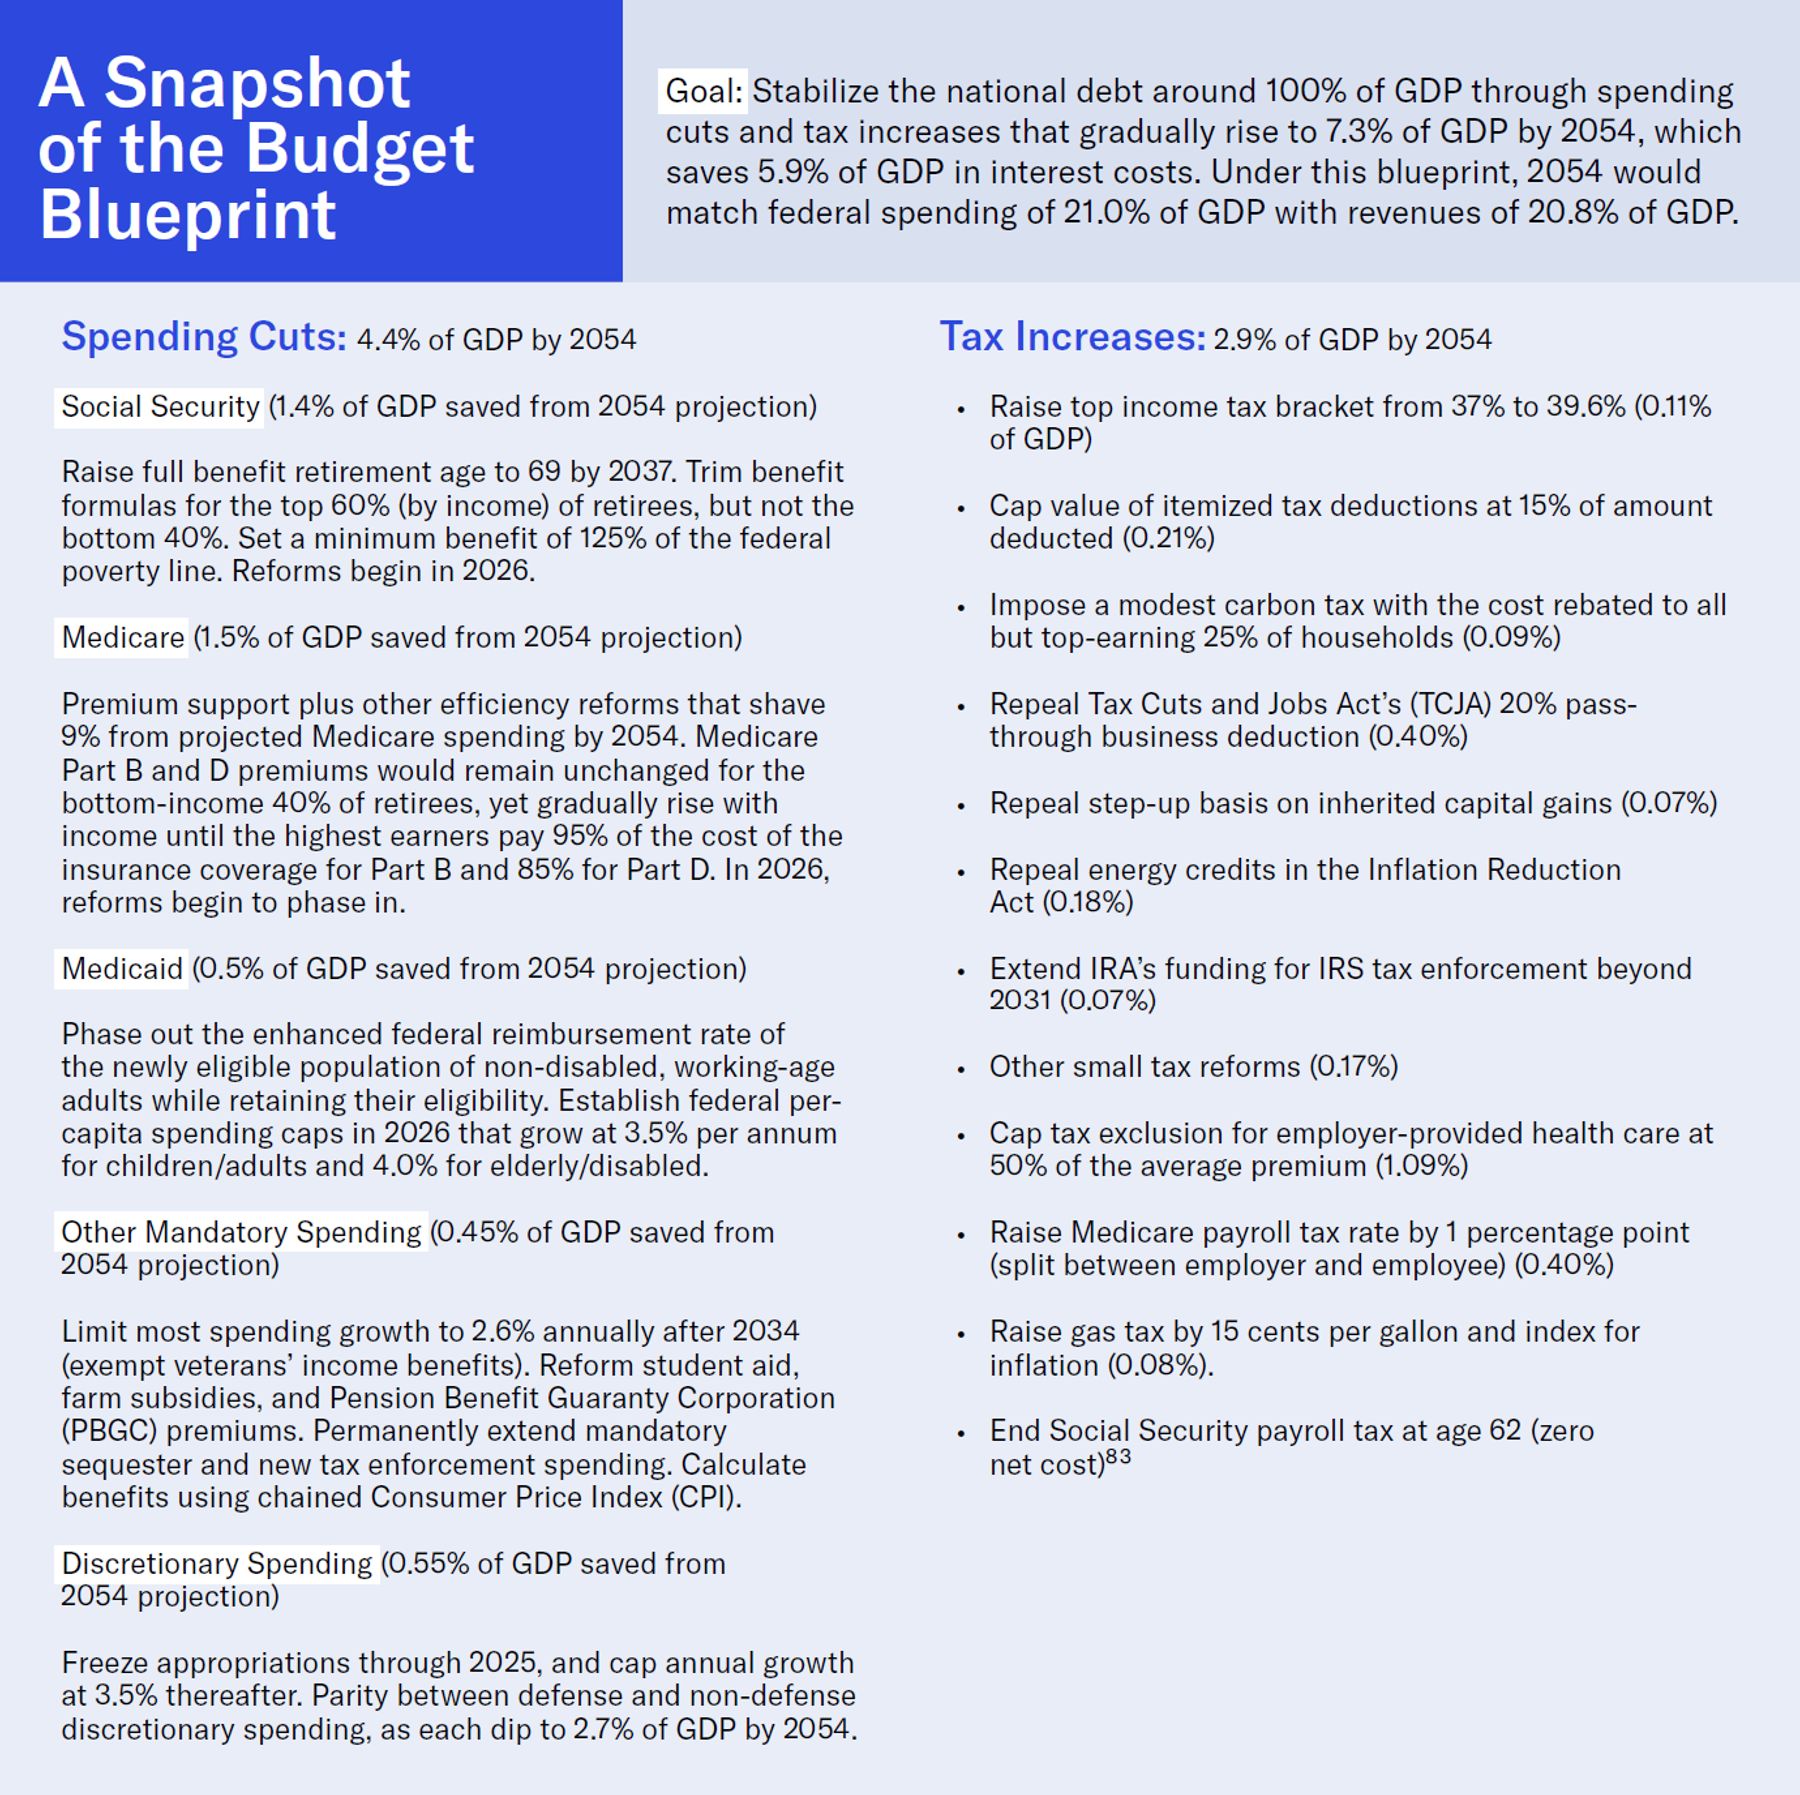
About the Author
Brian Riedl is a senior fellow at the Manhattan Institute, focusing on budget, tax, and economic policy. Previously, he worked for six years as chief economist to Senator Rob Portman (R-OH) and as staff director of the U.S. Senate Finance Subcommittee on Fiscal Responsibility and Economic Growth. Before that, Riedl spent a decade as the Heritage Foundation’s lead research fellow on federal budget and spending policy.
He also served as a director of budget and spending policy for Marco Rubio’s 2016 presidential campaign and was the lead architect of the 10-year deficit-reduction plan for Mitt Romney’s 2012 presidential campaign.
A prolific researcher, Riedl has published nearly 600 studies and articles since 2001 on federal spending, taxes, deficits, and economic policy, and has assisted in the writing of several New York Times best-selling books. He often testifies before Congress, works directly with congressional leaders, and briefs top-tier presidential candidates on fiscal and economic policy. Additionally, Riedl is frequently sought out nationally as a popular public speaker on unsustainable federal spending and deficit trends.
Riedl’s op-eds are regularly published in the New York Times, Wall Street Journal, Washington Post, New York Post, CNN.com, Vox, The Daily Beast, The Dispatch, and other publications. His economic policy expertise is also cited hundreds of times annually by reporters and columnists in top national newspapers and magazines. Riedl regularly discusses economic policy on all major TV networks, as well as high-profile radio programs and podcasts.
Washingtonian Magazine named Riedl one of the 500 most influential policy professionals in Washington D.C.—including one of the 26 most influential within economic policy—in 2022, 2023, and 2024.
Riedl holds a bachelor’s degree in economics and political science from the University of Wisconsin and a master’s degree in public affairs from Princeton University.
Endnotes
Photo: Manuel Augusto Moreno / Moment via Getty Images
Are you interested in supporting the Manhattan Institute’s public-interest research and journalism? As a 501(c)(3) nonprofit, donations in support of MI and its scholars’ work are fully tax-deductible as provided by law (EIN #13-2912529).