What Universities (Say They) Teach: The Spread of Progressive Language in College Course Catalogs

Photo: kolderal/Moment via Getty Images
Executive Summary
Critics of the modern university system contend that these institutions have shifted their mission from the pursuit of truth to the promotion of social justice; yet systematic evidence on what universities teach is scarce. In this report, I measure curricular language directly, applying two fixed keyword lists to the titles and descriptions of 7.3 million course-year records from 111 universities between 2000 and 2025. One list covers progressive themes such as race, gender, identity, equity, and social justice; the other covers the authors, texts, and traditions of the Western canon. The share of courses using progressive language more than doubles, from 4.8% to 10.8%, while the Western-canon share drifts from 4.8% to 4.4%. Scaling by catalog length sharpens the contrast: progressive words per 100 catalog words rise by 118%, and canon words fall by 23%. The progressive course share rises in every broad academic area and more than triples in professional schools. The increase persists among universities observed throughout the period. Universities differ widely, and the differences survive adjustment for catalog length and field composition.
Introduction
On January 15, 1987, Jesse Jackson joined a Stanford campus march over the university’s Western Culture course requirement. Demonstrators chanted “Hey hey, ho ho, Western culture’s got to go!”[1] In March 1988, the Faculty Senate approved reforms that replaced Western Culture with Cultures, Ideas and Values, broadening the curriculum’s treatment of minority perspectives and questions of race, class, and gender.[2] The episode drew national attention, but little is known about how curricula have changed since.
Since then, researchers have learned much more about who teaches than about what is taught. Studies based on party registration and self-reported ideology find a pronounced and increasing leftward tilt among university faculty, especially in the humanities and social sciences.[3] Whether those preferences shape what universities teach is much less clear, because evidence on course content is scarce and rarely comparable across institutions or over time.[4] This report measures that content directly, using the language of university course catalogs.[5]
Such evidence matters for at least two reasons. First, incentives in higher education depend on information. Applicants and parents know little about what universities teach. Without reliable comparisons, universities may face little pressure to improve their curricula. Consistent and verifiable measures of curricular content give families a basis for choice and give universities a reason to answer for what they offer. Second, curricular transparency supports public trust. Universities receive large public subsidies and depend on public confidence; a curriculum widely perceived as politicized erodes that confidence.[6] Greater transparency can help assess the extent of teaching politicization and guide reforms that rebuild public trust.
Variation over time in curriculum content is not a sign of degradation or politicization. Curricula should evolve as new knowledge and changing social concerns create new subjects of study. But universities should make these changes slowly and deliberately, preserving the best that human beings have thought and written while resisting intellectual or political fashion.
The real concern arises when predetermined moral or political ends displace open inquiry—the danger that social scientists have described as a shift in the university’s purpose from truth-seeking to social justice.[7] Catalog language cannot establish that this shift has occurred, but it can show whether the curriculum’s public description is moving in that direction.
To investigate this possibility, I match course titles and descriptions against two fixed keyword lists. The progressive list covers race, gender, identity, equity, social justice, colonialism, and related subjects; the Western-canon list covers authors, texts, and traditions in Western intellectual and literary history. I classify a course as progressive or Western-canon if its title or description contains at least one valid match from the corresponding list. A course may match either list, both, or neither.
Progressive language has spread across course catalogs, while references to the Western canon have become less prominent. The analysis covers 7.3 million course-year records from 111 universities between 2000 and 2025. Over that period, the progressive course share more than doubles, from 4.8% to 10.8%, while the canon share decreases (Figure 8). Progressive language also becomes more frequent per catalog word, while canon language becomes less frequent (Figure 9). The progressive increase extends across every broad academic area and persists among universities observed throughout the period. Social sciences has the highest progressive share, professional schools show the fastest proportional growth, and STEM’s share doubles.
Universities also differ widely in their progressive course shares. Among the 92 universities observed in 2025, the middle half have progressive course shares of 6.2%–17.1%.
The analysis is descriptive and makes no causal claims about why curricular language changes. Catalogs can reveal courses’ stated aims and intellectual frameworks, but they do not establish how those courses are taught.
Keyword matching is a blunt approach, but it captures the clearest cases of politicization: instructors stating their political commitments directly in the course description. For example, a Stanford School of Medicine course states that it draws on “critical race theory, liberatory consciousness, and equity pedagogy.” Less explicit, and perhaps more insidious, forms of politicization may leave no trace in course descriptions. Two courses on the history of capitalism may have nearly identical catalog entries, yet one may assign only capitalism’s critics while the other presents competing perspectives. Political commitments can therefore shape teaching well beyond their catalog descriptions. In this sense, I regard the estimates as a lower bound on curricular politicization.
The paper begins with the data and measurement rules, turns to Stanford University as a case study, and then widens to the university sample. The Appendix checks whether the trend changes when I use different groups of universities or weight them differently.
Data
The data come from university course catalogs, the annual publications in which universities list the courses they offer. For each course, I retain the university, catalog year, title, description, and the school or academic field. The analysis uses the title and description. A catalog year is labeled by the calendar year in which the academic year begins, so 2025 denotes the 2025–26 catalog.
I collected catalogs for 132 universities between 2000 and 2025. Of these, 111 had official, machine-readable catalogs for at least two years and form the primary sample. They contribute 1,548 university-year observations and 7,311,630 course-year observations. The sample is therefore not a random draw from American higher education. It is tilted toward selective private institutions and toward institutions that archive their catalogs. Of the 111 universities in the primary sample, 44 are public and 67 are private; 17 of the private institutions are liberal arts colleges. The Appendix lists every university with its years of coverage.
Cross-sectional comparisons use the 92 included universities observed in 2025. I also check each university’s latest available catalog. Of those 111 observations, 104 come from 2024 or 2025. Table 1 summarizes the coverage.
Two processing steps precede classification. First, I collapse duplicate records and identifiable cross-listings so that a course counts once per year rather than once per department code. Within a catalog year, I treat records with the same subject code and course number as duplicates. Records that share a course number and title across subject codes, or that the catalog explicitly declares equivalent, are cross-listings. Cross-listing is more common in some fields than in others, so counting each listing separately would overstate those fields’ shares of course offerings. Second, a fixed table maps each department, subject, or school code to one of five areas: humanities, social sciences, STEM, professional schools, or a residual “other.” Professional covers law, business, education, public policy, and similar schools. The Stanford case study reports medical sciences separately, giving six areas including “other.”
Catalog coverage varies substantially across universities. The 111 universities contribute 2–26 catalog years, with a median of 13 and an interquartile range of 7–19. Only 20 universities are observed in 2000, against 92 in 2025, so the pooled series uses catalogs from a small group of universities with long catalog archives in its early years. For each year, I combine the available catalogs and give every course equal weight. The universities included change over time, and those with larger catalogs count more. The Appendix repeats the main comparison using three alternatives: a balanced panel of 16 universities observed every year; equal university weights; and university fixed effects.
Catalog scope also varies. Eight of the 111 catalogs cover a constituent unit rather than a whole university, among them the University of Chicago College, Columbia College, Johns Hopkins Homewood Arts and Sciences and Engineering, Emory College, and UC Santa Barbara Letters & Science. Results for those catalogs describe the named unit. The university-level audit files preserve coverage, description length, and latest-catalog signal shares.
Catalog writing conventions pose a separate problem. Some institutions publish full paragraphs, while others offer a sentence or nothing at all. In each university’s latest catalog, I calculate the average course-description length. These university averages range from 0 to 252 words; the median is 57, and the middle half lie between 43 and 86. One university, UMass Amherst, publishes titles without descriptions in its latest catalog, so its signals use title text alone. More text creates more chances for a match. I therefore report description length, scale keyword counts by the number of catalog words, and repeat the analysis among catalogs with similar description practices. A short entry with no match provides limited evidence about the course’s content.
TABLE 1
Catalog Collection, Primary Sample, and Distribution of Catalog-Year Coverage, 2000–2025
| Measure | Number | Share |
| Catalog collection | ||
| Universities with catalog data | 132 | |
| University-year observations | 1,569 | |
| Course-year observations | 7,413,113 | |
| Primary sample: At least two catalog years | ||
| Universities | 111 | 84.1% of collected |
| University-year observations | 1,548 | 53.6% of possible |
| Course-year observations | 7,311,630 | 98.6% of collected |
| Universities observed in 2000 | 20 | 18.0% |
| Universities observed in 2025 | 92 | 82.9% |
| Composition of the primary sample | ||
| Public universities | 44 | 39.6% |
| Private universities | 67 | 60.4% |
| Private universities of which are liberal arts colleges | 17 | 15.3% |
| Catalogs covering a constituent unit | 8 | 7.2% |
| Catalog years per included university | ||
| 2–5 years | 17 | 15.3% |
| 6–10 years | 26 | 23.4% |
| 11–20 years | 42 | 37.8% |
| 21–26 years | 26 | 23.4% |
| Median (interquartile range) | 13 (7–19) | |
| Description words per course, latest catalog | ||
| Median (interquartile range) | 57 (43–86) | |
| Universities with no descriptions | 1 | 0.9% |
Measuring Curricular Language
I classify course titles and descriptions using two fixed keyword lists. The progressive list contains 102 words and phrases covering race, gender, identity, diversity, equity, social justice, colonialism, oppression, and related subjects. The Western-canon list has 82 references to traditions, periods, authors, and texts in Western intellectual and literary history. Each list yields its own yes-or-no classification. A course may match one list, both, or neither. Tables 2 and 3 reproduce both lists in full.
The canon list is deliberately broad in historical scope. It begins with classical antiquity, biblical and medieval thought, the Renaissance, and the Enlightenment, and continues through nineteenth- and twentieth-century literature, philosophy, political thought, sociology, and psychoanalysis. Marx, Foucault, Beauvoir, and Fanon consequently appear beside Burke, Tocqueville, Hayek, and Orwell. The table categories organize the presentation; they do not affect matching.
TABLE 2
Progressive Keyword List
| Category | Words and Phrases |
| Race & Racism | race*, racial, racism, racist, anti-racist, antiracist, critical race, systemic racism, racial justice, white supremacy, white privilege, structural racism, institutional racism, ethnic studies |
| Equity & Social Justice | equity*, equitable*, social justice, restorative justice, reproductive justice, environmental justice, human rights, social inequality, gender inequality, racial inequality, economic inequality, income inequality, inequality*, inequalities*, discrimination*, segregation* |
| Diversity & Inclusion | inclusion*, inclusive*, inclusivity, belonging*, underrepresented, diversity and inclusion, “diversity, equity,” racial diversity, ethnic diversity, gender diversity |
| Gender & Sexuality | gender*, gendered, queer, lgbtq, transgender, non-binary, nonbinary, feminist, feminism, sexuality studies, patriarchy, patriarchal, sexism, sexist, misogyny, misogynistic, gender identity, heteronormativity, heteronormative, heterosexism, cisgender, cisgender, women’s studies, women and gender, gender studies |
| Colonialism & Postcolonialism | decolonial, decolonize, decolonization, postcolonial, settler colonialism, neocolonial, colonialism, colonial, colonization, colonisation, imperialism, anti-colonial, anticolonial |
| Intersectionality & Oppression | identity politics, intersectional, intersectionality, privilege*, privileged, oppression, oppressed, marginalized, marginalization*, ableism, ableist, disability studies, disability justice, immigration*, immigrant*, immigrants* |
| Indigenous Studies | indigenous, native peoples, native american studies, tribal sovereignty |
| Bias & Cultural Competence | implicit bias, microaggression, cultural competence, allyship |
* Term with a fixed, term-specific context rule; terms found solely inside web addresses are excluded. Matching ignores capitalization.
TABLE 3
Western-Canon Keyword List
| Category | Words and Phrases |
| Tradition framing | western civilization, western tradition, western thought, great books, liberal arts tradition, western canon |
| Period and classical markers | ancient Greece, ancient Rome, Greek philosophy, Roman law, classical antiquity, Greco-Roman, Renaissance*, Enlightenment, medieval philosophy, Reformation, classics*, classical* |
| Antiquity | Plato, Aristotle, Homer*, Virgil, Cicero, Socrates, Iliad, Odyssey, Aeneid |
| Biblical through Renaissance | Bible, biblical, Augustine, Aquinas, Dante, Divine Comedy, Canterbury Tales, Machiavelli, Shakespeare, Milton |
| Early modern and Enlightenment | Hobbes, Descartes, Locke, Montesquieu, Kant, Leviathan, Federalist*, Cervantes, Montaigne, Spinoza, Rousseau*, Hume*, Adam Smith, Edmund Burke, Mary Wollstonecraft |
| Nineteenth century | Hegel, Tocqueville, Austen, Dickens, George Eliot, John Stuart Mill, Marx*, Nietzsche, Kierkegaard, Darwin*, Dostoevsky, Dostoyevsky, Tolstoy, Douglass |
| Twentieth century | Max Weber, Durkheim, Freud, James Joyce, Kafka*, Woolf, T. S. Eliot, Orwell, Wittgenstein, Heidegger, Arendt, Beauvoir, Foucault*, Hayek*, Rawls, Fanon |
Note: The list contains 82 words and phrases.
* Term with fixed, term-specific context rules; web-address-only occurrences are excluded for every term. Dostoevsky and Dostoyevsky are spelling alternatives for the same author.
For each course-year, I merge the title and description into a single text field. I match whole words and listed phrases without regard to capitalization. I standardize common punctuation and spacing variants and match listed transliterations explicitly. One valid term is enough to classify a course.
Literal matching inevitably creates some false positives. After recording literal matches, I apply the same context rules to every catalog to exclude matches with clearly unrelated meanings, such as “private equity,” “triangle inequality,” “price discrimination,” “space race,” and “classical mechanics.” The progressive list omits the bare words “diverse” and “diversity” but retains explicit phrases such as “diversity and inclusion” and “racial diversity.”
I also audited canon matches for false positives. I excluded uses of “classical” or “classics” in technical contexts, such as classical physics or regression; generic references to established works; and references to non-Western traditions, such as Indian classical music.
TABLE 4
Examples of Classification from Public Stanford Catalogs
| Signal | Course and Catalog Excerpt | Matched Words or Phrases |
| Progressive only, engineering | CEE 145E, Equitable Infrastructure Solutions (2025–26) “The engineer of tomorrow must understand the inequities in the system and the policies that produced them…. This course will introduce students to the prominent theories of equity and environmental justice with a focus on implementation for infrastructure.” | equitable; equity; environmental justice; marginalized |
| Progressive only, medicine | MED 269A, Health Equity and Social Justice: SC Core Foundations Course (2025–26) “This course will draw heavily from a number of theoretical frameworks, including critical race theory, liberatory consciousness, and equity pedagogy, amongst others to realize the Equity First model.” | social justice; equity; critical race; oppression |
| Progressive only, law | LAW 240T, Discussion (1L): Race, Technology, and Law (2025–26) “To what extent is technology perhaps no less bi-ased and racist than the underlying society in which it exists?” | race; racial justice; racist; racism; discrimination; inequalities |
| Canon only | COMPLIT 238A, Dante’s Inferno (2023–24) “Intensive reading of Dante’s Inferno (the first canticle of his three canticle poem The Divine Comedy).” | Dante; Divine Comedy |
| Both | CLASSICS 133, Socrates and Social Justice (2021–22) “In this class, we examine whether Socrates is a model for social justice.” | Socrates; social justice |
| Neither | MATH 51, Linear Algebra, Multivariable Calculus, and Modern Applications (2024–25) “This course provides unified coverage of linear algebra and multivariable differential calculus, and the free course e-text connects the material to many fields.” | none |
| Removed false positive | ACCT 340, Alphanomics: Informational Arbitrage in Equity Markets (2024–25) “This is an advanced elective course on the economics of active investing in public equity markets, with a focus on analyzing financial statement data.” | equity (literal match, removed by the financial-equity rule) |
Table 4 shows the rule in practice. The first three rows are drawn from engineering, medicine, and law; each course is classified by the words in its description. The Socrates course retains one match from each list. References to listed authors count whether courses praise, criticize, or simply discuss them. The accounting course matches “equity” literally, and the financial-equity rule removes the match, so the course is classified as neither.
Stanford as a Case Study
Progressive and Canonical Signals over Time
I begin the analysis with Stanford, which provides one of the most complete time series in the sample as well as enrollment data.
As illustrated in Figure 1, Stanford’s progressive share climbs from 5.1% in the 2001–02 catalog to 12.4% in 2025–26. The Western-canon series begins at 3.6% and ends at 3.5%, with no clear trend.
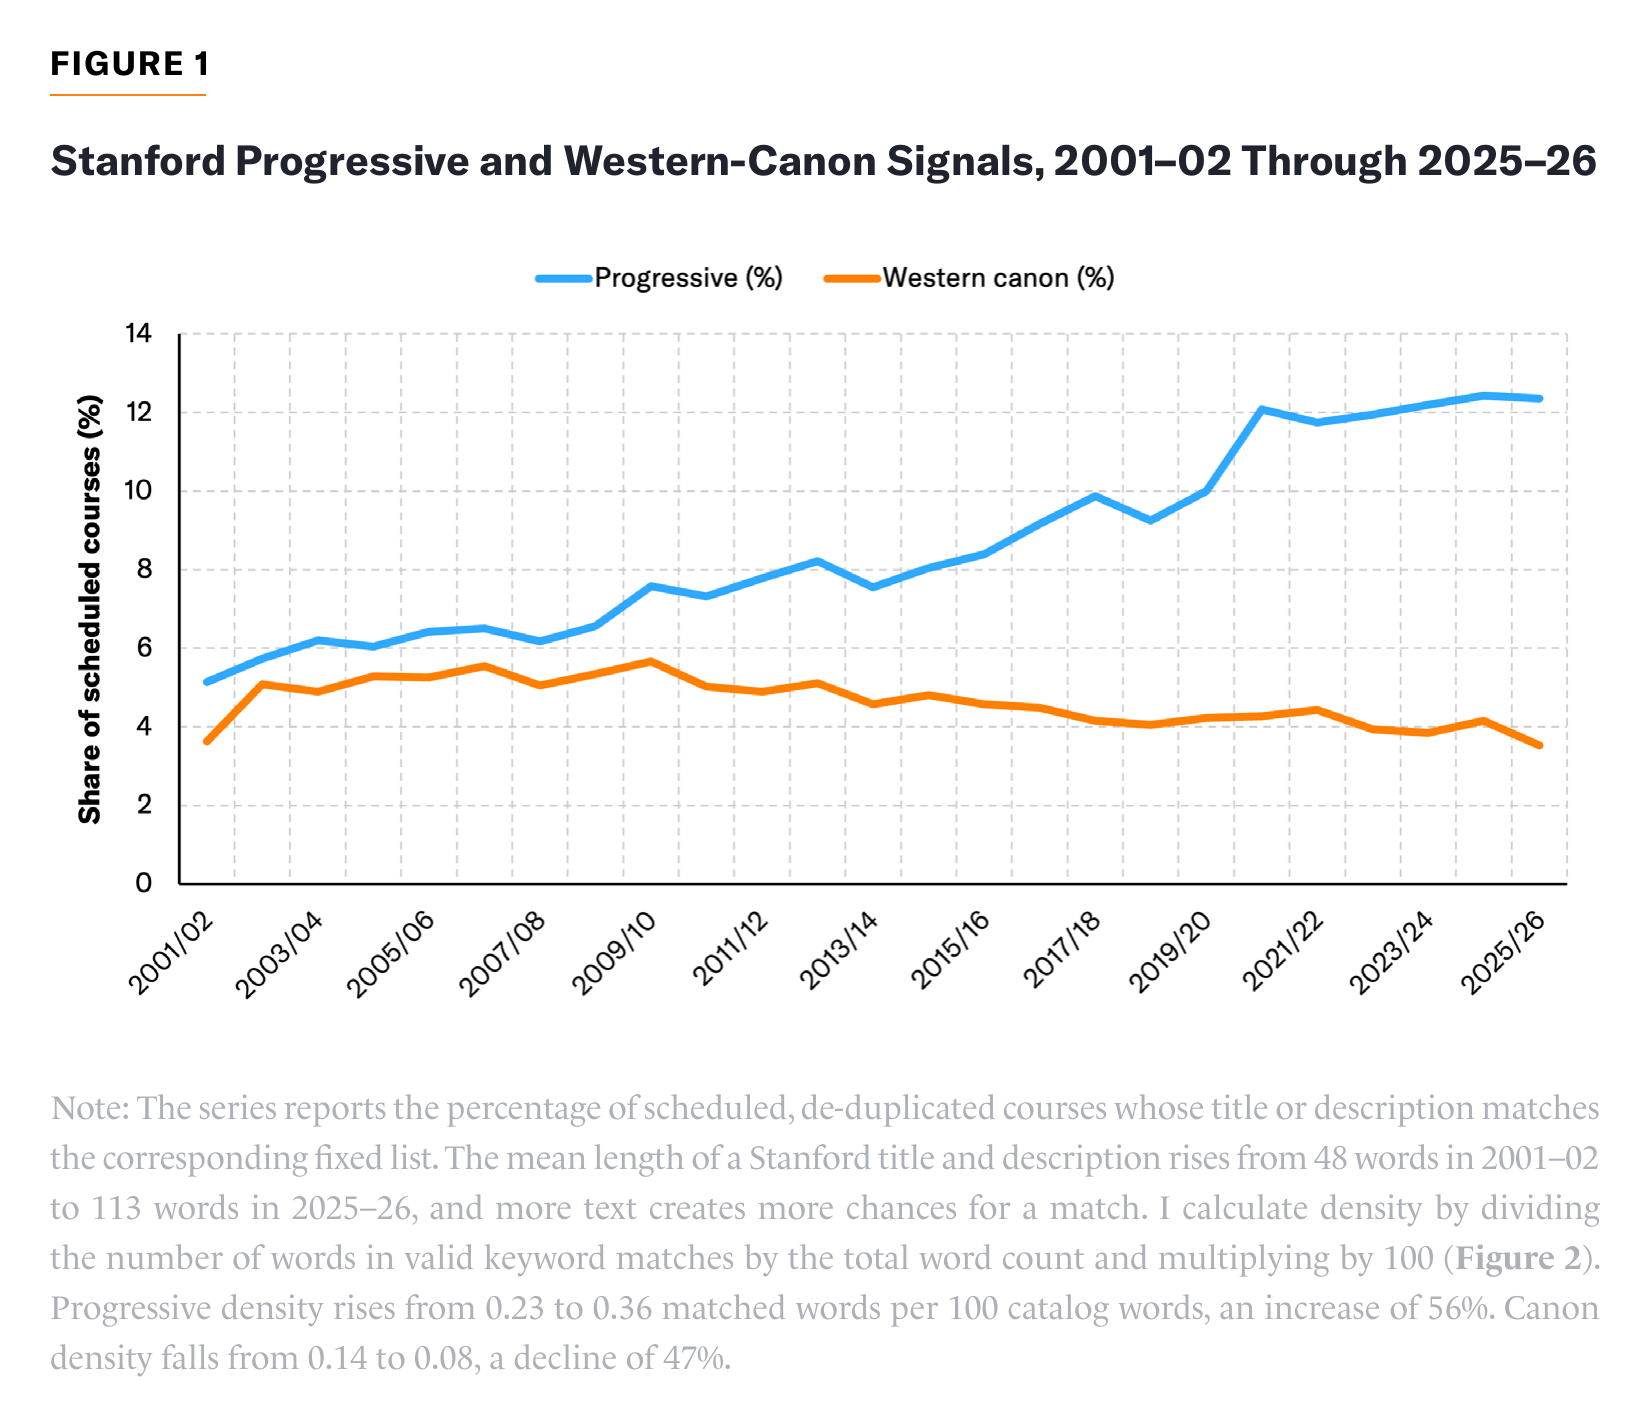
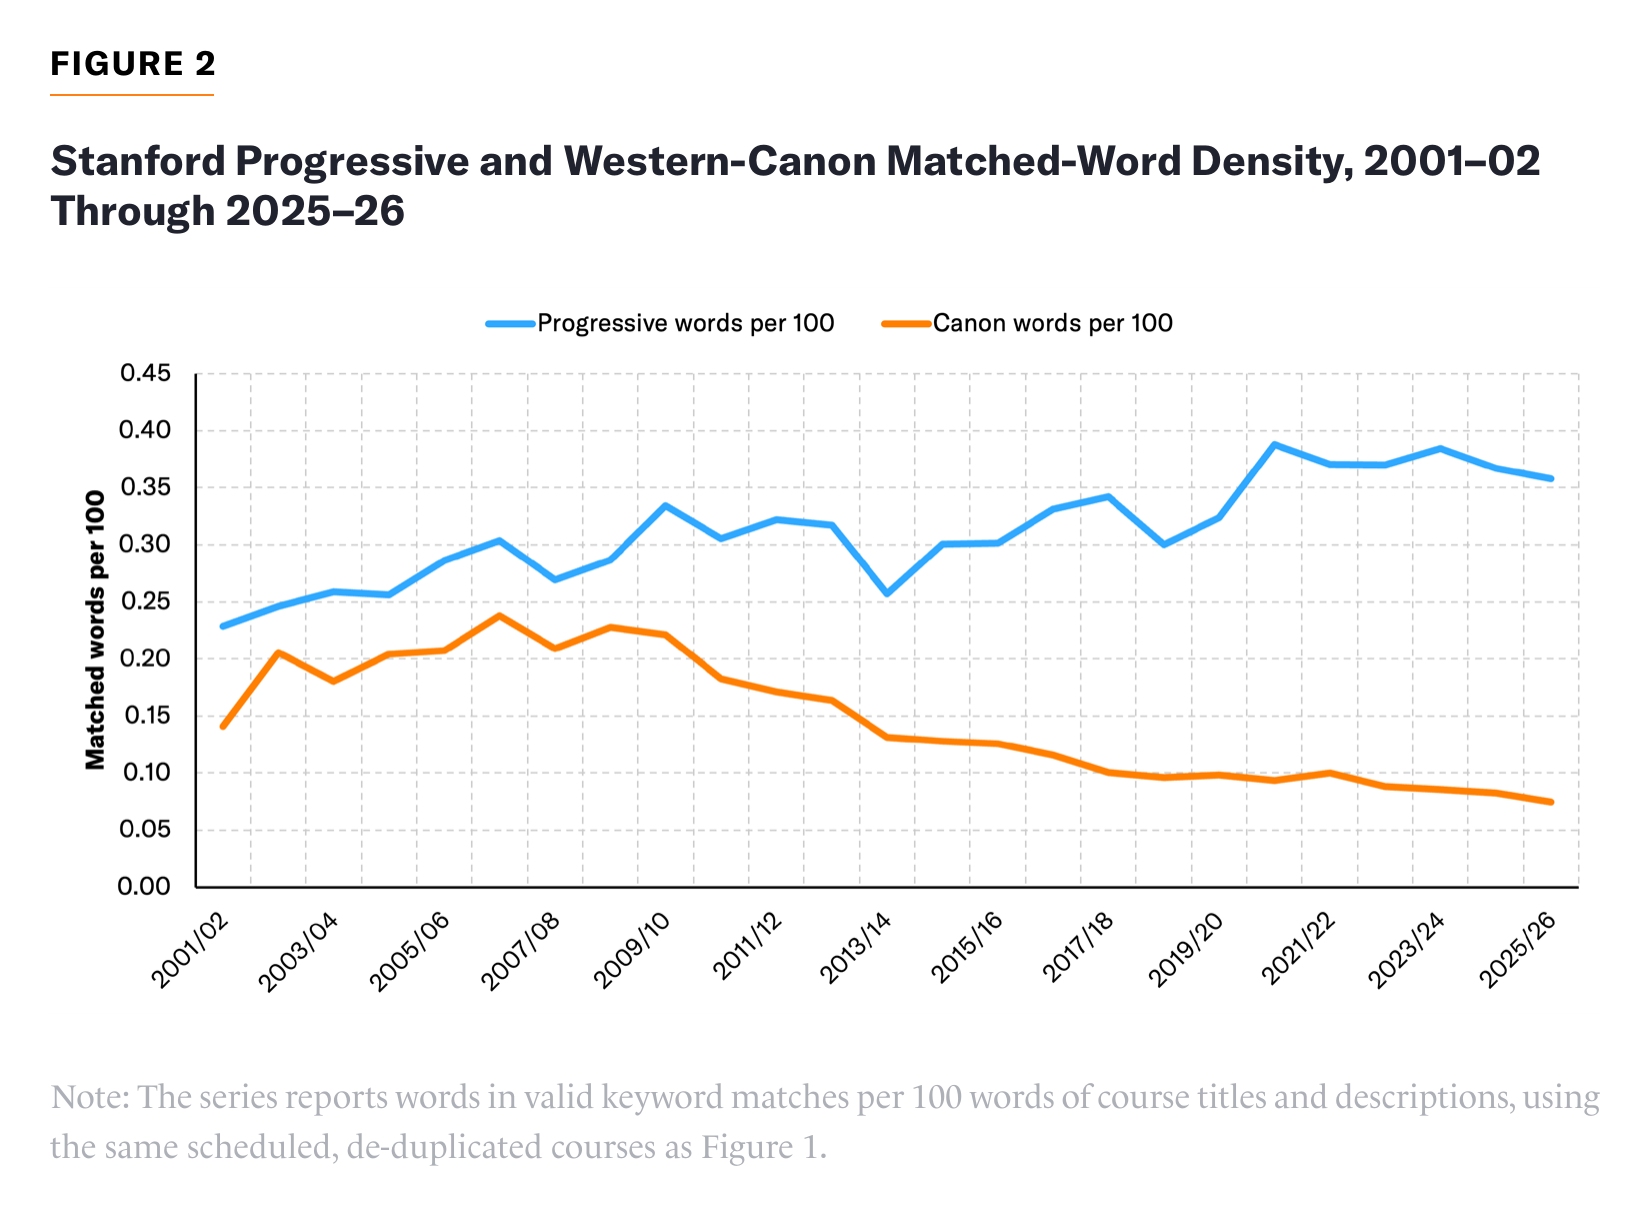
Progressive course shares and keyword density both rise: progressive vocabulary becomes more common across courses and within catalog text. I would need further analysis to determine how much of the increase reflects longer descriptions and how much reflects more frequent use of progressive terms. The canon course share is flat while canon density falls by nearly half. Canon references have held their place in the count of courses but not in the growing volume of catalog text. Later in this report, I will record the same density comparison for the pooled university sample.
Enrollment-Weighted Results
A small seminar and a large lecture count equally in the course shares, even though they enroll very different numbers of students. An increase in the share of courses with progressive language therefore need not produce a comparable increase in the share of registrations. I use Stanford’s enrollment data to calculate the share of all course registrations in courses whose titles or descriptions match each keyword list.
Both lines in each panel of Figure 3 use the same scheduled, de-duplicated courses with public enrollment counts. Those counts are available for 92.2% of Stanford course-years, and coverage never drops below 91.3% in any year. A course with no enrolled students still counts among the courses offered, but adds nothing to the total registrations.
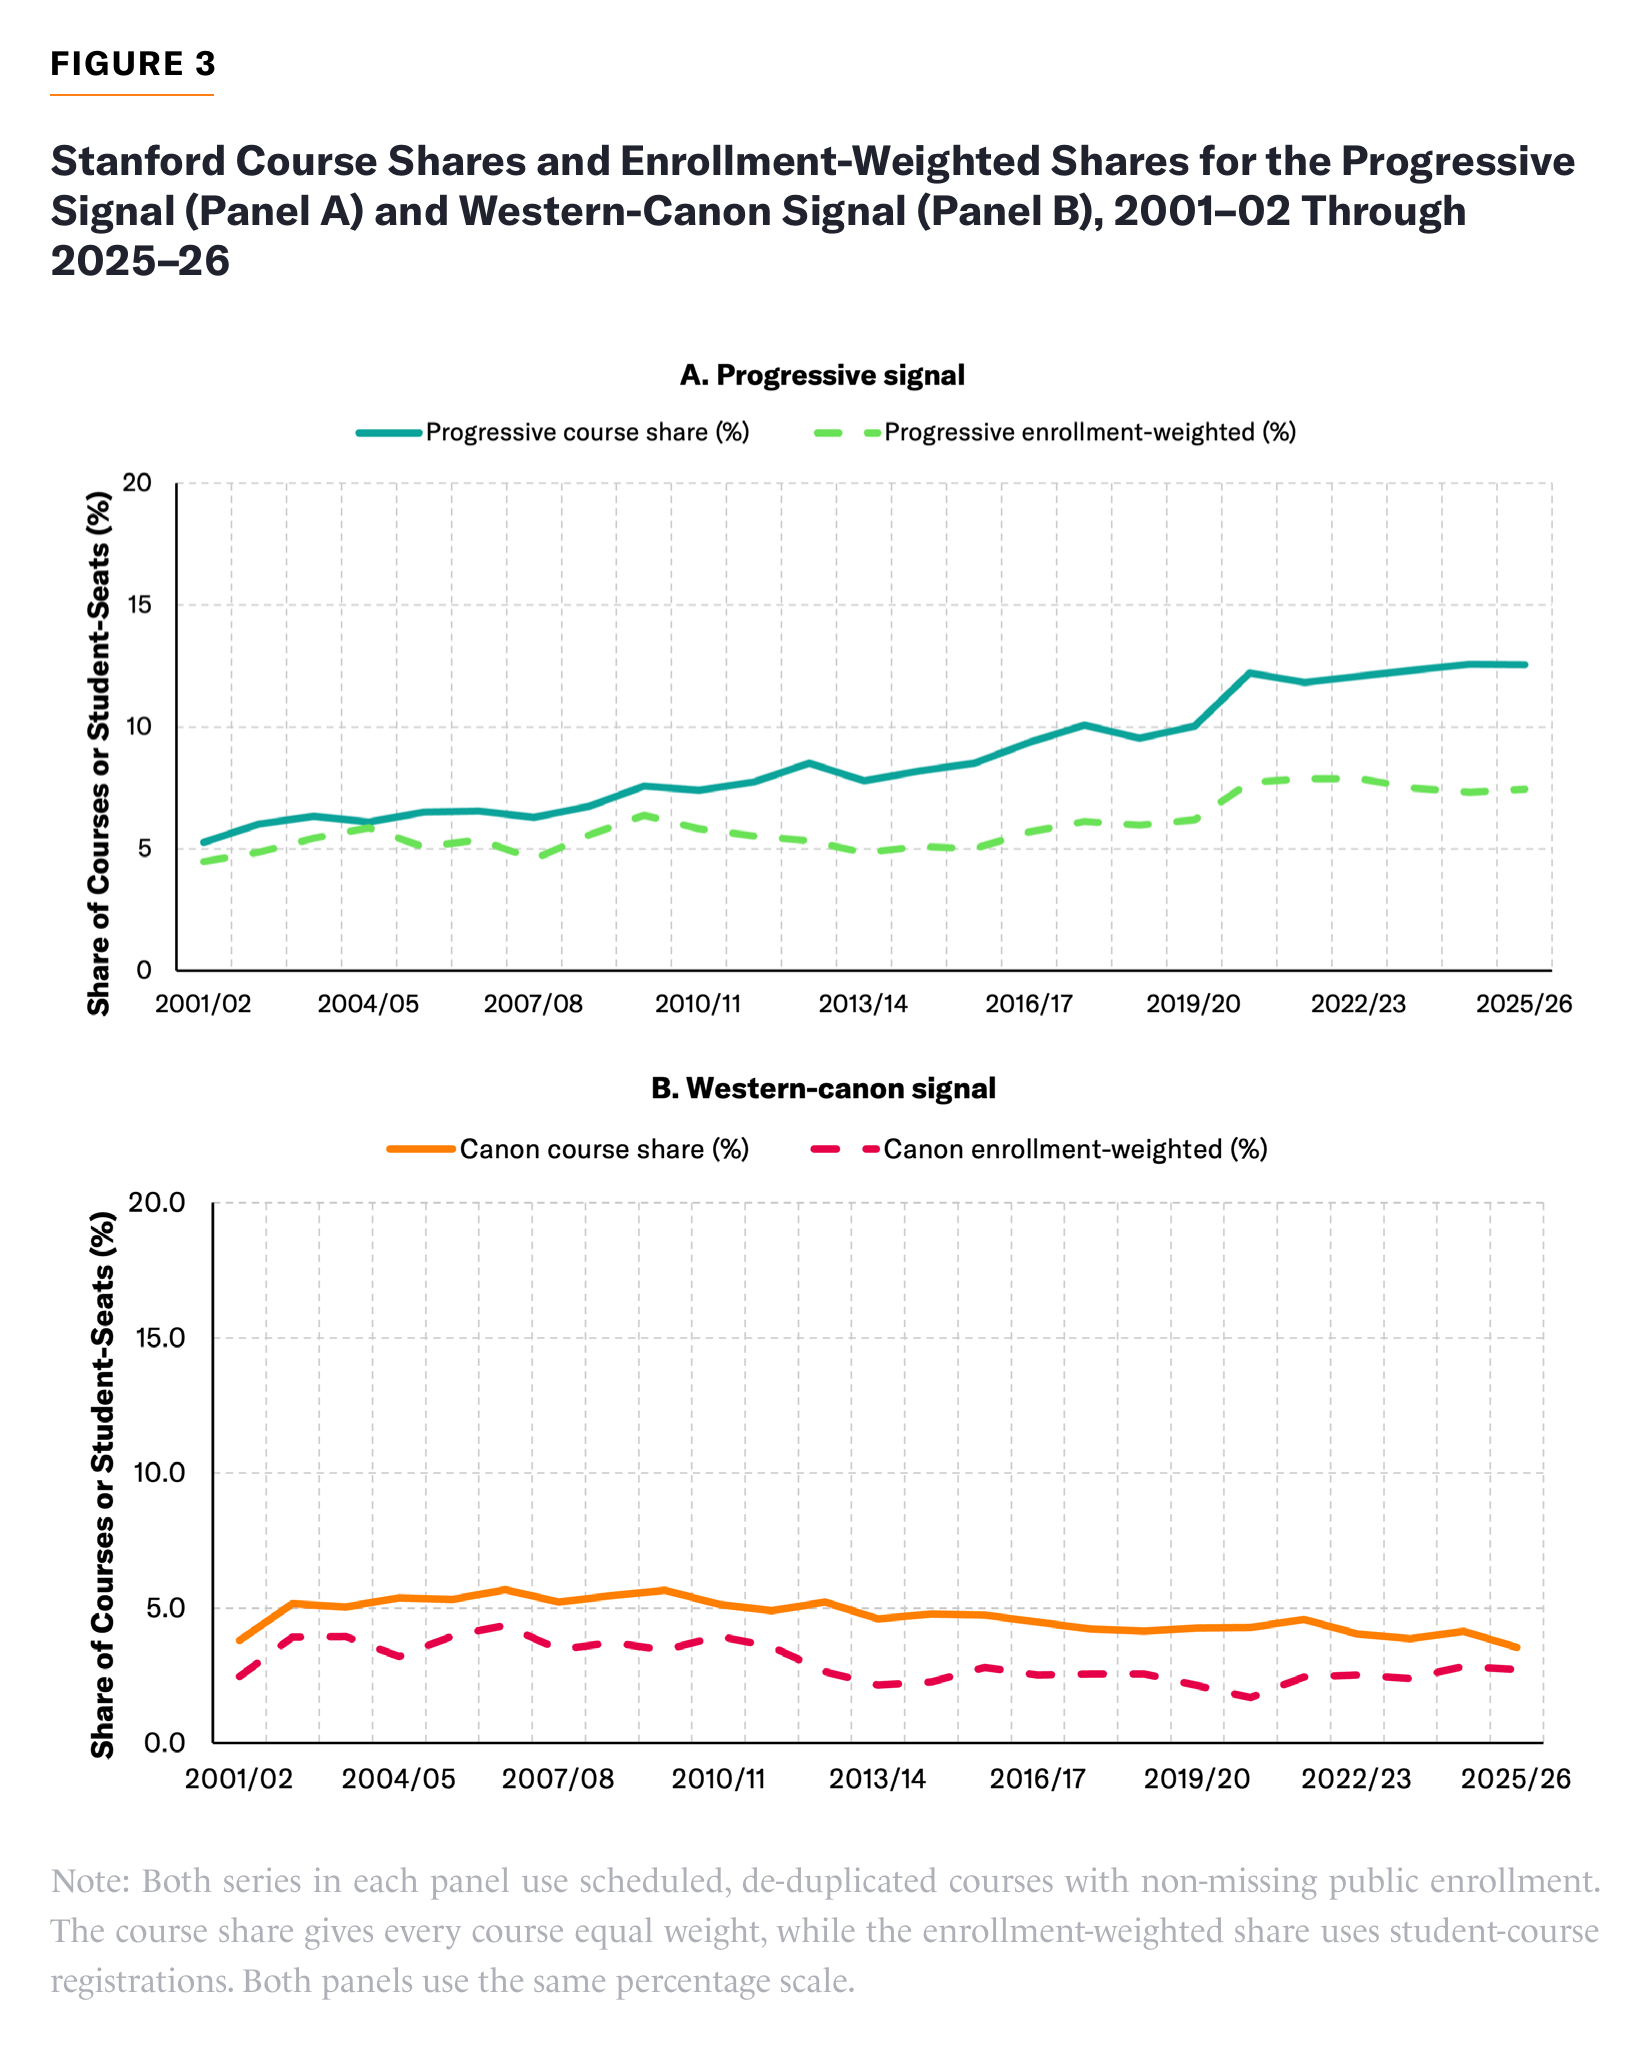
Both ways of counting show a progressive increase. In the common enrollment sample, the course share rises from 5.3% to 12.6%, and the enrollment-weighted share rises from 4.5% to 7.4%. The share of registrations in matching courses grows by two-thirds, more slowly than their share of course offerings. The gap widens over time. The enrollment-weighted share trails the course share by 0.8 percentage points in 2001–02 and 5.1 points in 2025–26. It has fallen from its 2022–23 peak of 7.9%, while the course share has continued to rise. Matching progressive courses are smaller on average than other courses in the same observed sample.
For the canon signal, the course share moves from 3.8% to 3.6% and the enrollment-weighted share moves from 2.5% to 2.7%. Both canon series are flat, so weighting does not create the gap between the progressive and canon trends.
Progressive Themes over Time
The overall trend combines changes in race, gender, social justice, and other themes, each of which may follow a different path. Figure 4 follows the four largest themes at the end of Stanford’s series, using the same courses and years as Figure 1. A course enters a theme if its title or description contains a valid term from the corresponding row of Table 2. A course can match several themes, so adding these percentages would count some courses more than once.
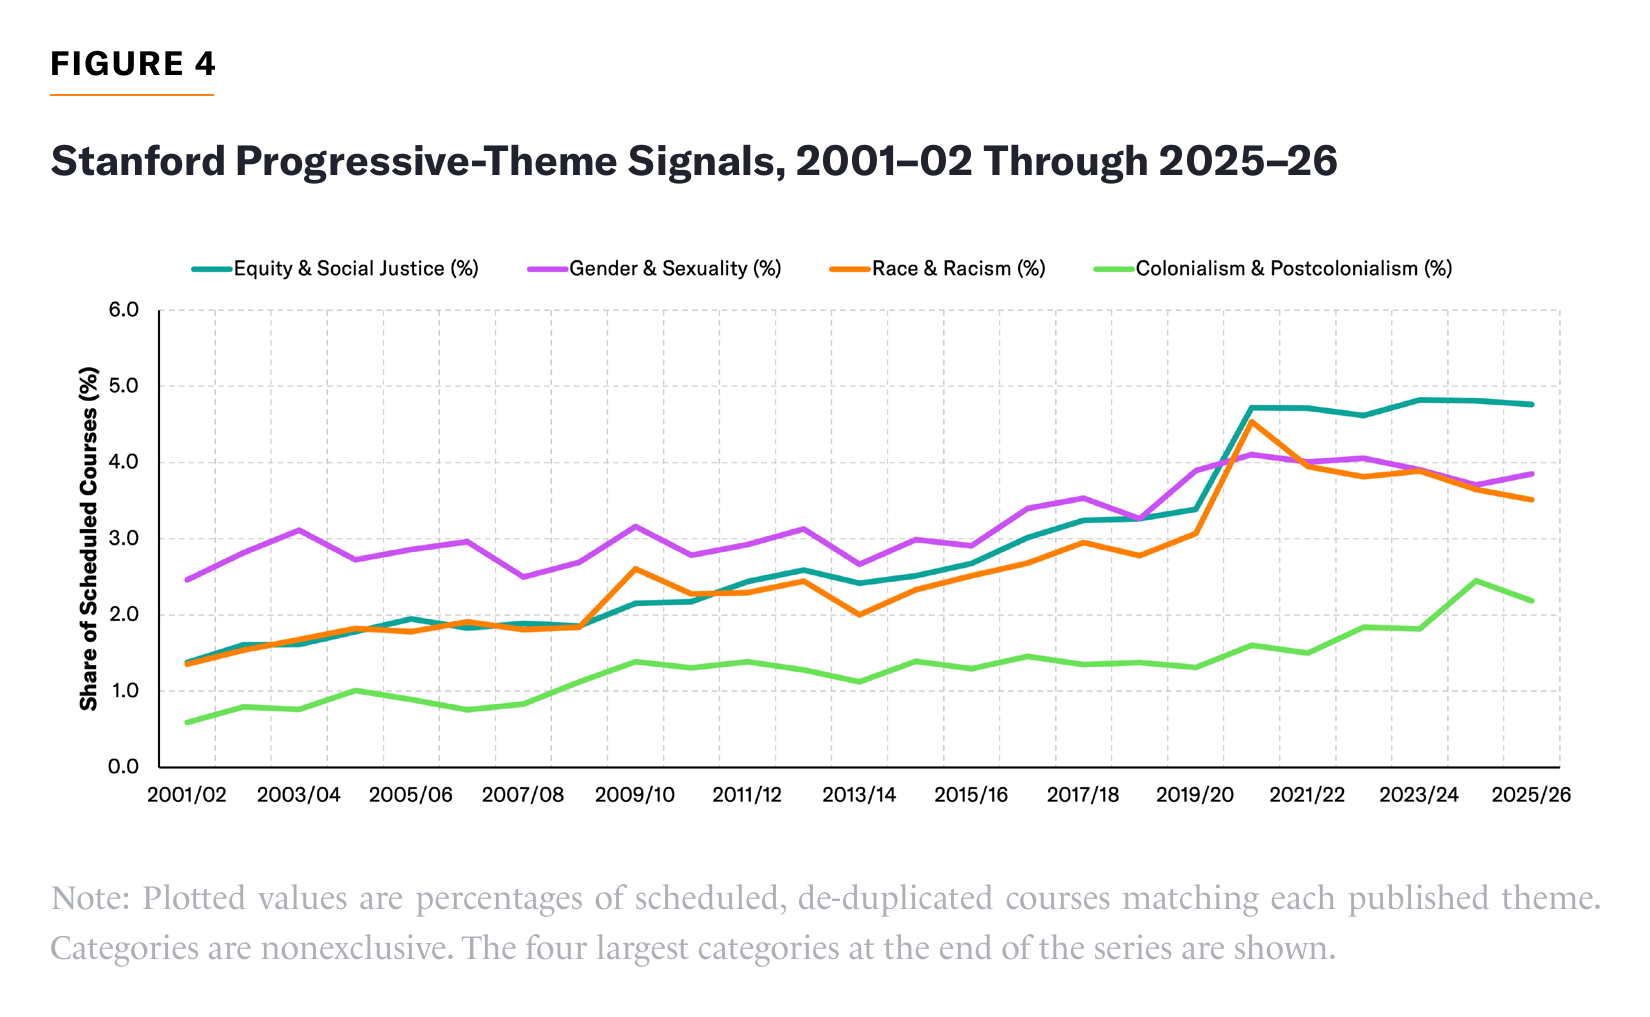
The expansion of progressive language at Stanford spans all four themes shown in Figure 4. The equity and social-justice theme records the largest gain, rising from 1.4% of courses in 2001–02 to 4.8% in 2025–26. The race and racism, gender and sexuality, and colonialism and postcolonialism themes also become more common over the period.
The relative prominence of these themes also changes. The gender and sexuality theme is the most common at the outset, but the equity and social-justice theme leads by the end. Race-related language peaks in 2020–21 and subsequently recedes, while the equity and social-justice theme remains close to its peak. The change in the leading theme therefore persists beyond the temporary surge in race-related language, indicating a sustained shift in the vocabulary used to describe Stanford’s curriculum.[8]
Results by Academic Area
Stanford’s overall trend could arise because fields themselves change or because the catalog shifts toward fields where progressive language was already more common. Figure 5 shows the five named academic areas separately and omits the residual “other” category. Fixed academic-group and subject-code rules assign each course to one area. Each line shows the share of scheduled, de-duplicated courses in an area and year that match the corresponding keyword list. The figure uses course counts and the same 25 years as the main Stanford series.
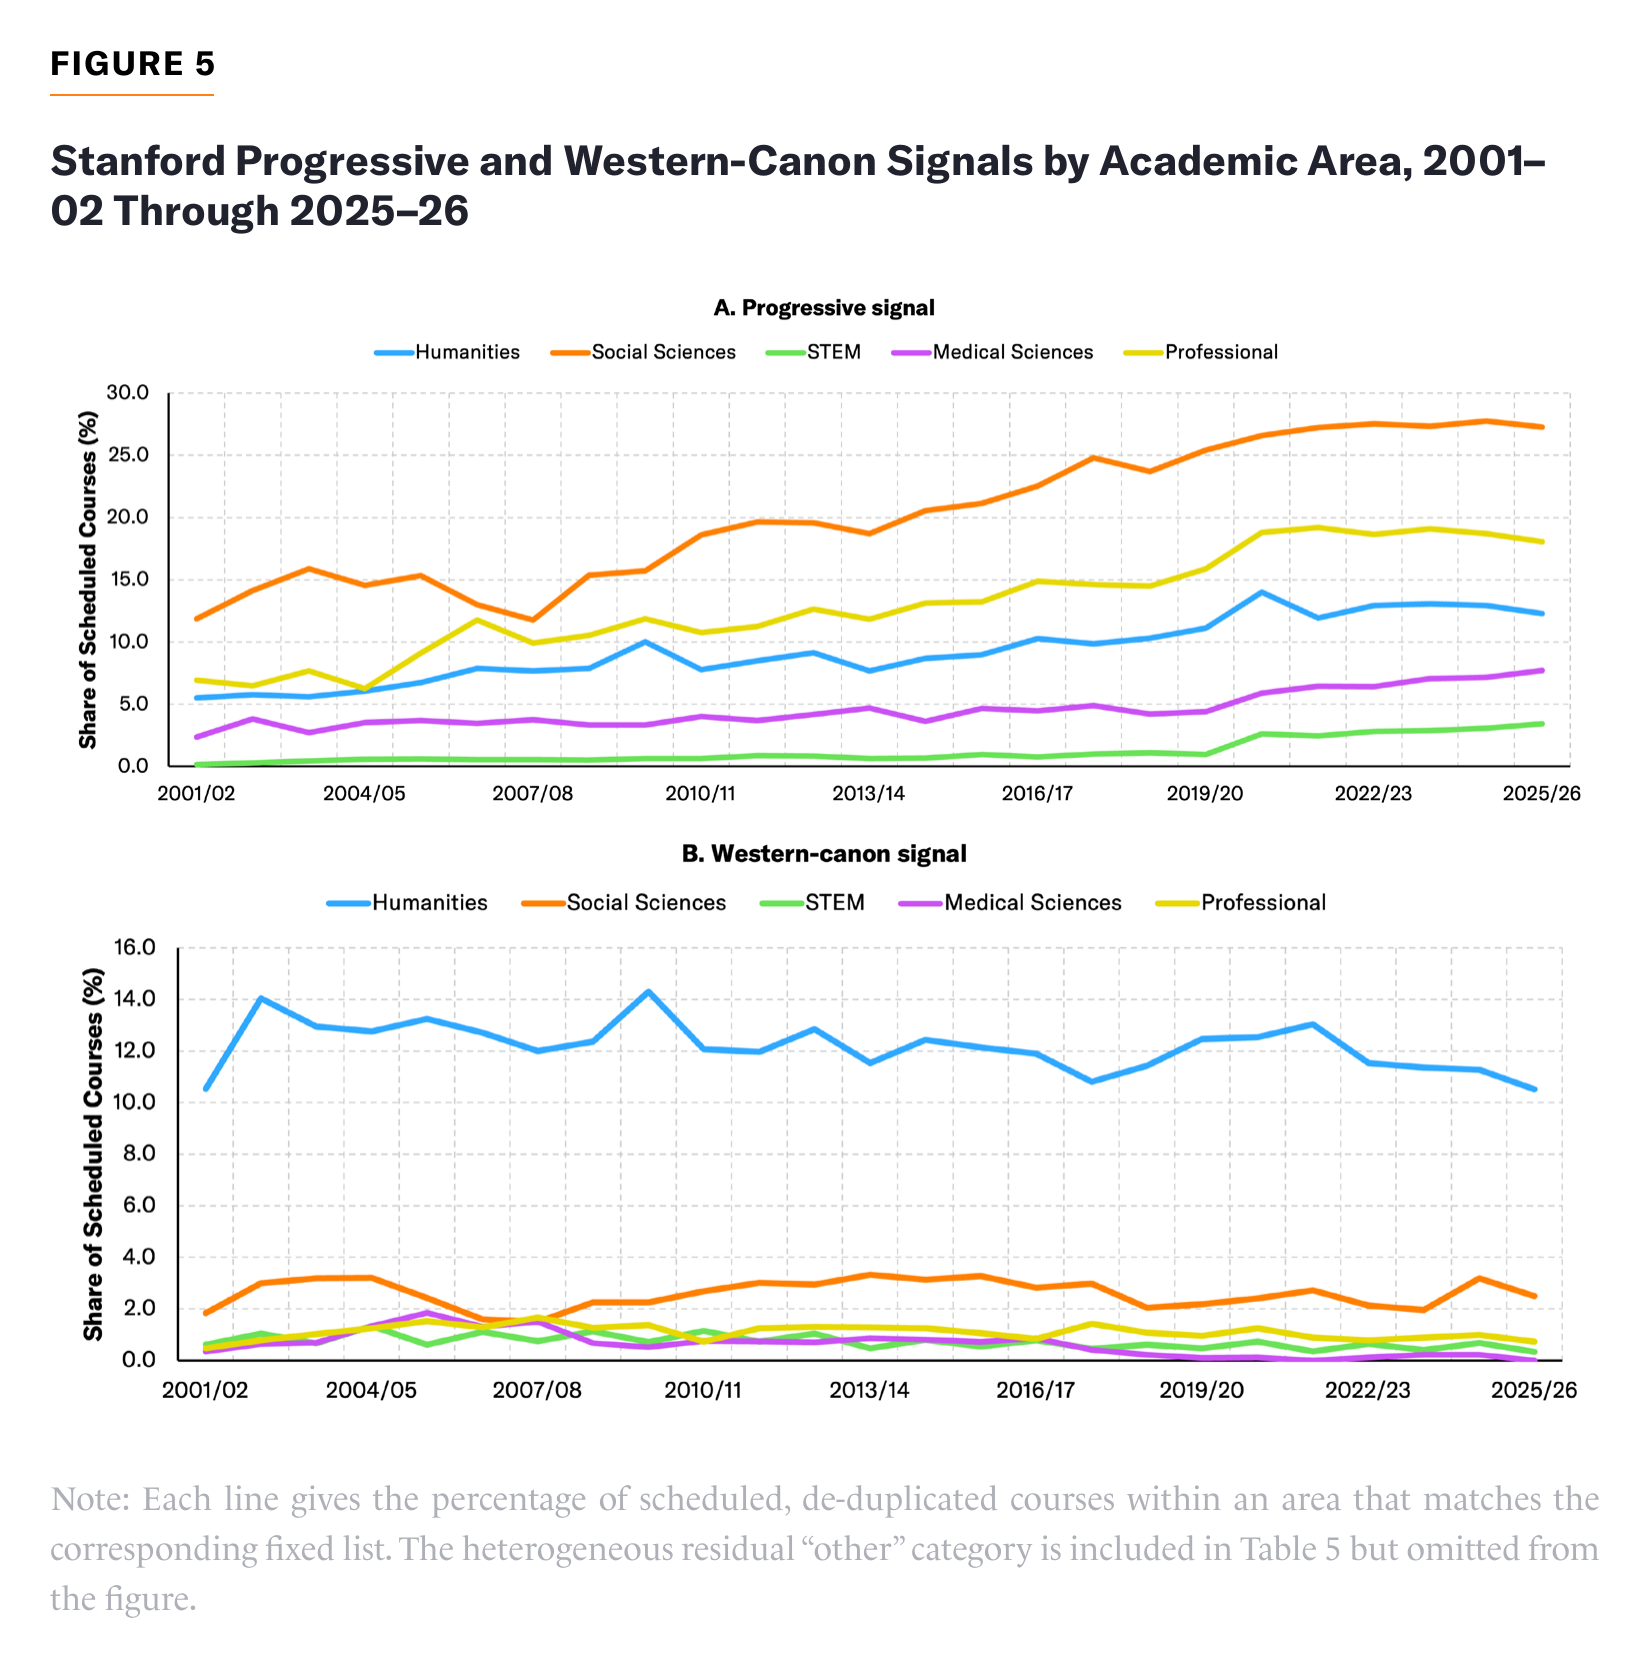
Every named area shows a progressive increase. Between the first and last pooled three-year periods, the progressive course share in social sciences rises from 14.0% to 27.5%, the largest gain and highest ending level (Table 5). The share in professional schools rises from 7.0% to 18.6%. Both areas have higher progressive shares than humanities, where the share rises from 5.6% to 12.8%.
The progressive course share rises from 3.0% to 7.3% in medical sciences and from 0.3% to 3.1% in STEM. In both areas, growth accelerates around 2020, following a long period of comparatively slow increase.
The Western-canon course share is highest in humanities: 12.5% in the first pooled three-year period and 11.1% in the last. Every other named area has a canon course share at or below 2.7% in both periods, with no absolute change larger than 0.4 percentage points. The small within-field movements account for the overall stability.
TABLE 5
Stanford Signal Shares by Academic Area in the Early and Late Periods
| Progressive(%) | Western Canon (%) | ||||||
| Early | Late | Change | Early | Late | Change | Course-years | |
| Overall | 5.7 | 12.3 | +6.6 | 4.5 | 3.8 | -0.7 | 149,337 |
| Humanities | 5.6 | 12.8 | +7.1 | 12.5 | 11.1 | -1.5 | 43,535 |
| Social sciences | 14.0 | 27.5 | +13.4 | 2.7 | 2.6 | -0.1 | 20,509 |
| STEM | 0.3 | 3.1 | +2.8 | 0.8 | 0.5 | -0.3 | 40,635 |
| Medical sciences | 3.0 | 7.3 | +4.3 | 0.6 | 0.1 | -0.4 | 13,957 |
| Professional | 7.0 | 18.6 | +11.6 | 0.7 | 0.9 | +0.1 | 16,731 |
| Other | 8.0 | 14.3 | +6.2 | 1.8 | 3.6 | +1.7 | 13,970 |
Note: Early pools 2001–02 through 2003–04. Late pools 2023–24 through 2025–26. Change is measured in percentage points. Course-years reports each area’s observations across the full 25-year sample.
Holding the distribution of courses across academic areas fixed produces a similar increase in the progressive share. The rise comes from increases within areas; changes in the distribution slightly dampen it.
Law, Education, Business, and Public Policy
Professional schools train lawyers, teachers, managers, and policymakers. At Stanford, academic-group and subject codes divide the nonmedical professional category into law, education, business, and public policy. The four programs account for all 16,731 nonmedical professional course-years in the Stanford sample. Medicine remains under medical sciences. Figure 6 uses the same de-duplicated courses and progressive list as the main Stanford series.
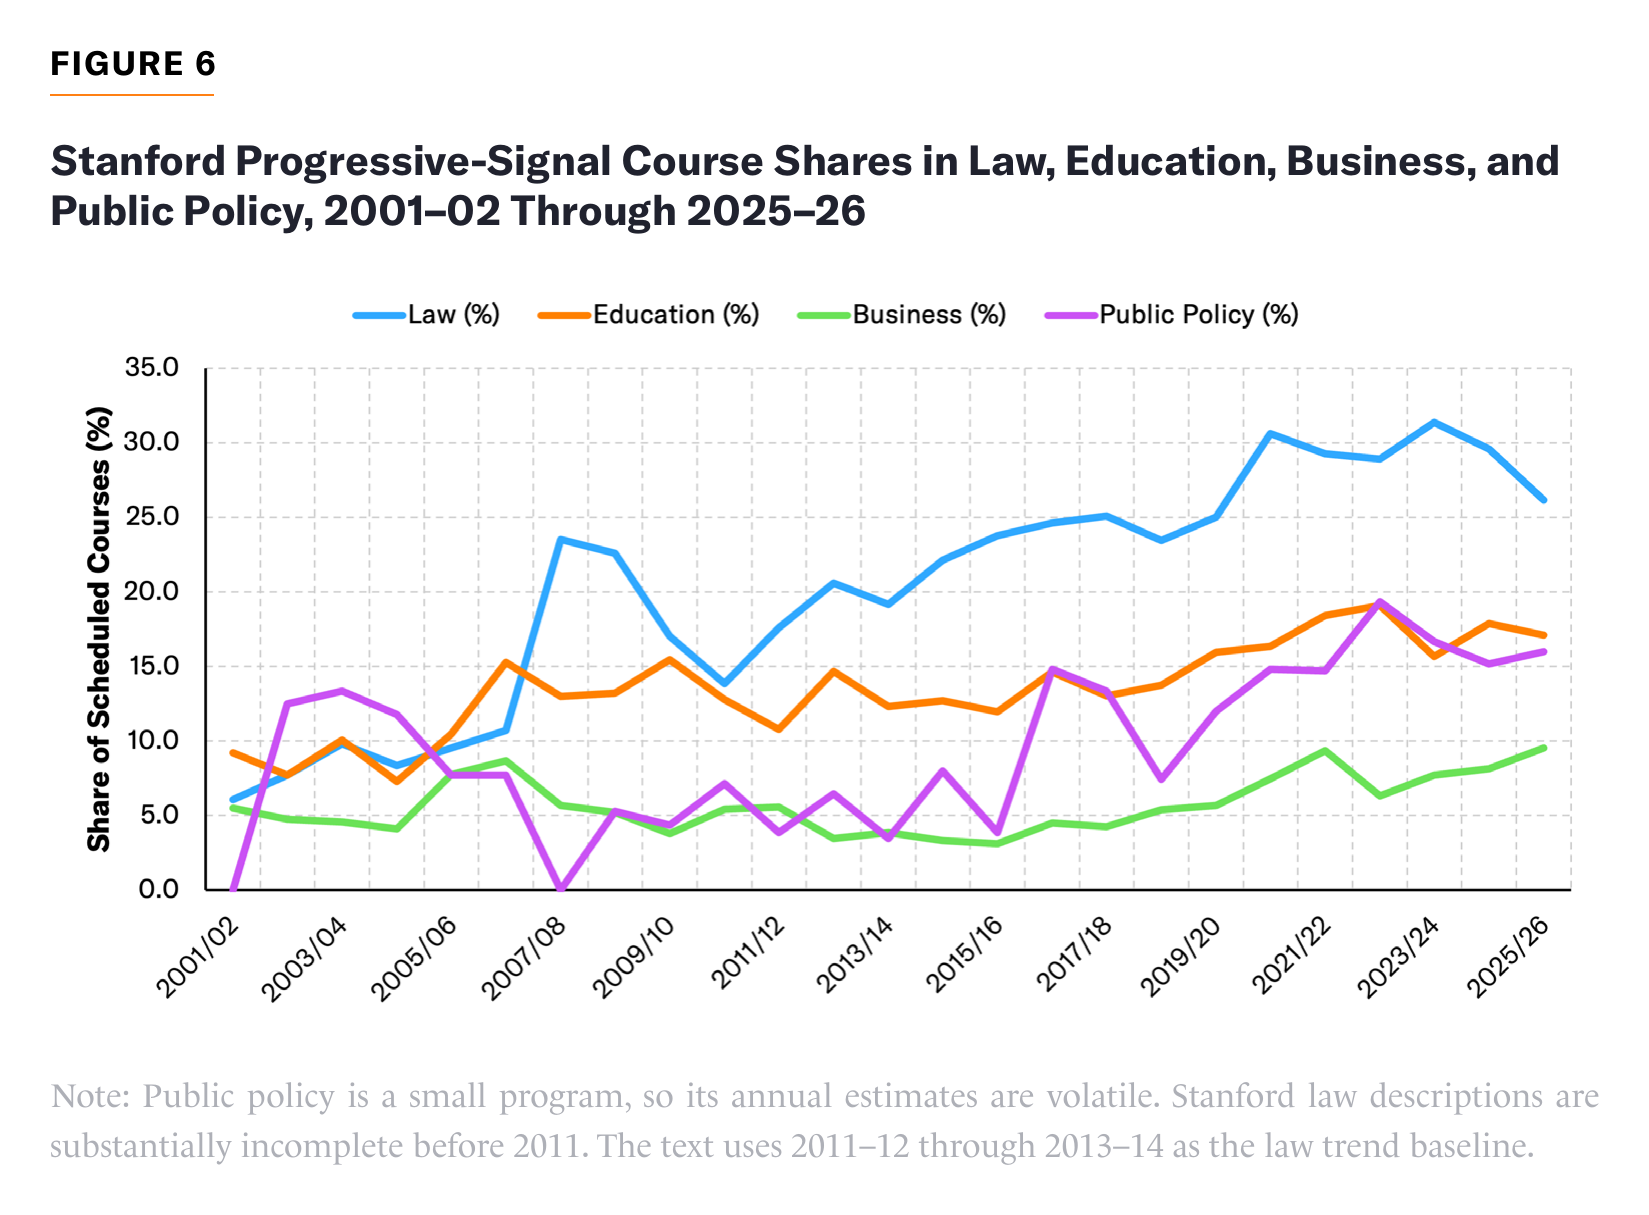
Progressive language has expanded markedly across Stanford’s professional programs. The combined share of courses with progressive language nearly triples, from 7.0% in the first three catalogs to 18.6% in the last three. All four programs record increases over their comparison periods.
Among these four programs, law has the highest progressive course share, followed by education. In the latest catalog, more than one-quarter of law courses match the progressive list, compared with roughly one-sixth of education courses. Law’s progressive course share rises from 19.1% in 2013–14 to 28.9% in 2025–26, an increase of about half. Education’s share nearly doubles over the full period. Business and public policy also end the period above their initial levels, although their latest course shares remain below those of law and education.
Examples from the 2025–26 catalog show how these themes enter both theoretical study and practical professional training. LAW 7016, Critical Race Theory, examines the premise that “race and law are mutually constitutive” and law’s role in maintaining racial hierarchy, alongside internal and external critiques of the framework. EDUC 246G, Elementary Teaching Seminar: Assessment for Learning and Equity, includes “equity, democracy, and social justice in the context of teaching and learning” among its topics in teacher preparation.[9]
TABLE 6
Stanford Professional-Program Signals and Enrollment-Weighted Shares, 2025–26
| Progressive (%) | Western Canon (%) | ||||||
| Course | Enr.-wtd. | Course | Enr.-wtd. | Courses | Enr. observed (%) | Observed registrations | |
| Law | 26.1 | 14.7 | 1.5 | 1.0 | 329 | 89.1 | 6,496 |
| Education | 17.1 | 15.4 | 0.0 | 0.0 | 193 | 92.7 | 2,773 |
| Business | 9.5 | 6.0 | 0.0 | 0.0 | 284 | 89.1 | 13,129 |
| Public policy | 16.0 | 16.2 | 4.0 | 4.5 | 25 | 92.0 | 494 |
| Combined | 18.1 | 9.8 | 0.7 | 0.4 | 831 | 90.0 | 22,892 |
Note: Course is the share of all scheduled, de-duplicated courses. “Enr.-wtd.” is the share of observed student-course registrations. “Enr. Observed” gives the percentage of courses with observed enrollment.
Courses with progressive language account for about 15% of registrations in both law and education (Table 6). This is close to education’s share of matching courses but substantially below law’s, so the difference between the programs narrows when I account for enrollment. Canon language remains uncommon across all four professional programs.
STEM and Medicine
STEM and medicine underpin technological progress, economic development, and public health. Politicization in these fields may therefore have especially serious consequences for society and warrants particular scrutiny.
As expected, references to the Western canon are rare in technical and clinical courses, so I focus on changes in progressive language. I compare medical sciences with four STEM groups: engineering and computing; natural sciences; mathematics and statistics; and earth and sustainability (Figure 7).
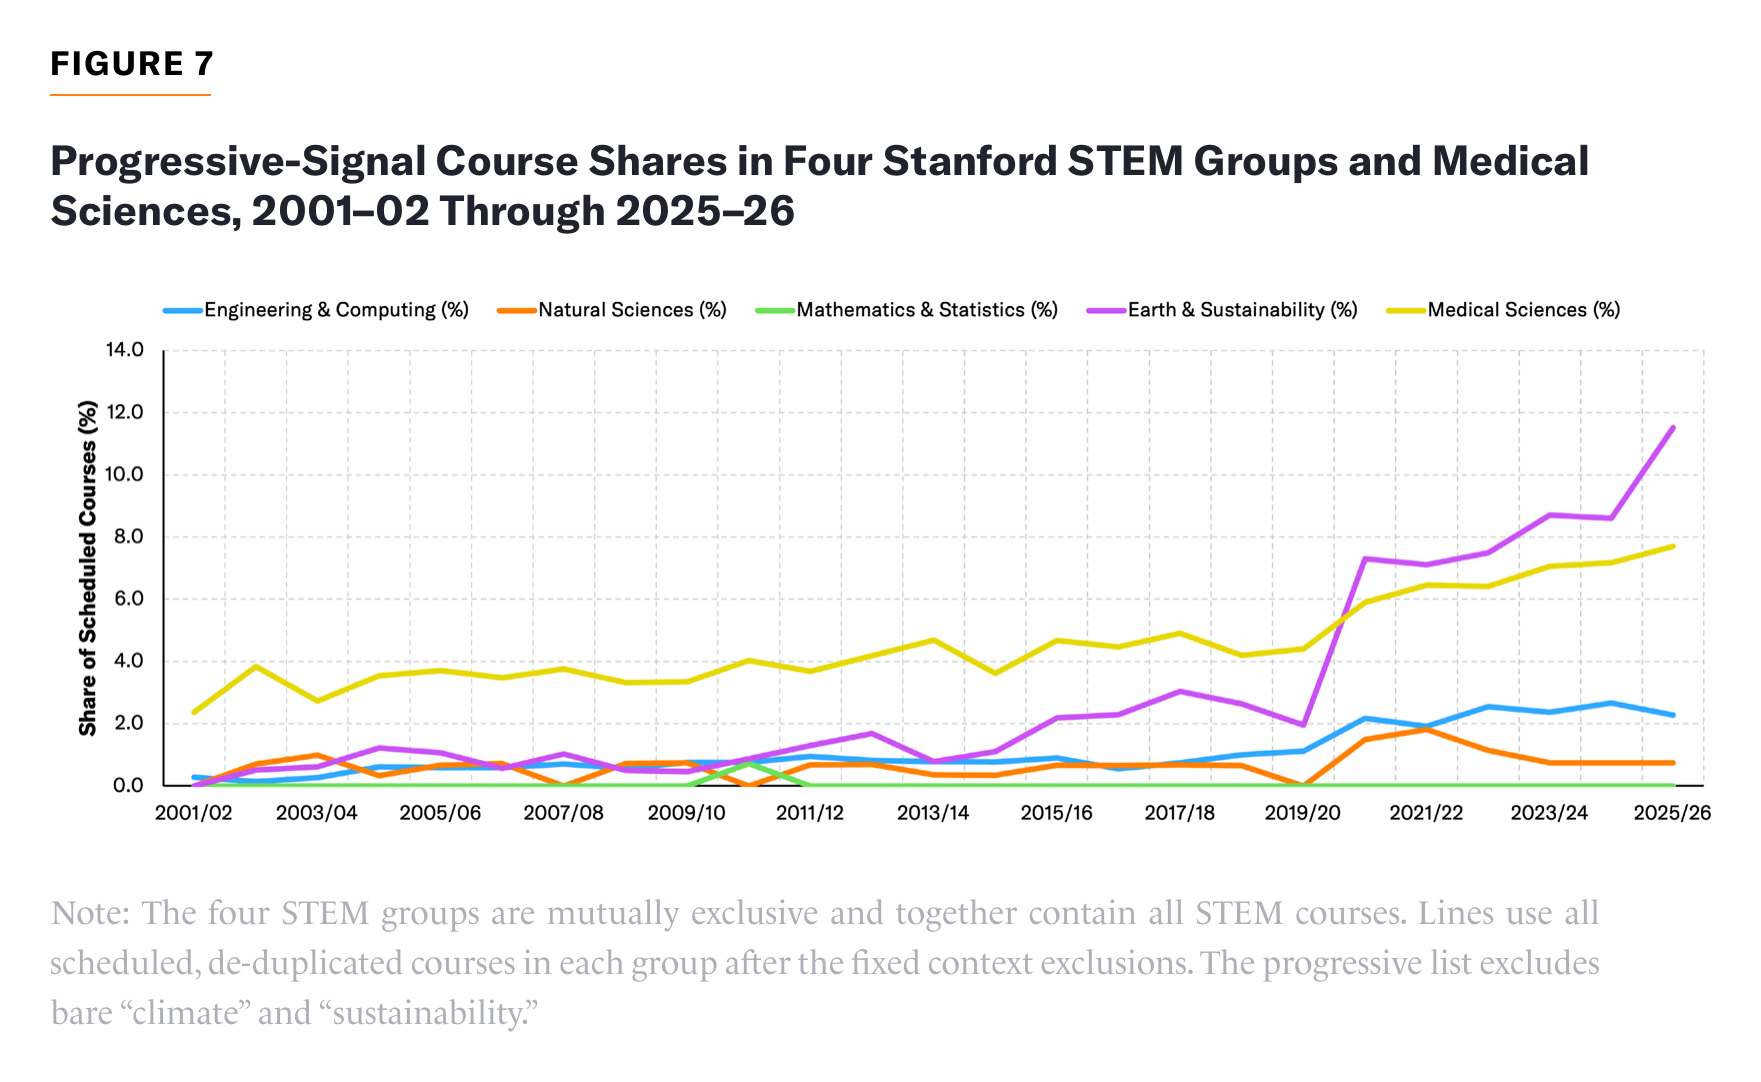
In medical sciences, the progressive course share jumps in 2020–21 and then grows more rapidly than before. It rises from 4.4% in 2019–20 to 5.9% in 2020–21 and reaches 7.7% in 2025–26 (Table 7). More growth occurs in these final six years than in the preceding 18.
The 2025–26 catalog illustrates how these themes enter medical training. MED 269B, Health Equity and Social Justice—SC Core Skills Course, teaches tools for social-justice and health-equity work and aims to help students “cultivate their own change agent identity.” CHPR 232, Social and Structural Determinants of Health: Achieving Health Equity, examines structural racism among the determinants of health and seeks to develop students’ “critical consciousness” to inform interventions promoting health equity.[10]
Earth and sustainability also shows a large increase, from 0.4% in the first three catalogs to 9.7% in the last three. This trend overlaps with the planning and expansion of Stanford’s sustainability school. Stanford announced plans for the school in May 2020. John and Ann Doerr’s $1.1 billion gift was announced in May 2022. The school opened that September, incorporating the former School of Earth, Energy & Environmental Sciences and other existing units.[11]
The initial jump in the progressive share, from 2.0% in 2019–20 to 7.3% in 2020–21, occurs during the planning period and predates the announced Doerr gift. Growth continues after the school’s launch. Because the category combines predecessor programs with newer sustainability offerings, its trend may reflect changes in the mix of courses as well as changes in their language. The data do not establish that the gift caused the increase.
Two matching courses in the 2025–26 catalog connect environmental questions to theories of power and social justice. EBS 325, Foundations of Political Ecology, introduces political ecology and feminist political ecology, examining how “gendered power relations intersect with race, class, and place.” EARTHSYS 120, Environmental Justice in California, studies environmental-justice movements and the challenges facing African American, indigenous, Latinx, and AAPI communities, and introduces degrowth and municipalism as approaches to environmental justice.[12]
Among the other STEM groups, growth is concentrated in engineering and computing, where the progressive share rises from 0.2% to 2.4%. The progressive course share in natural sciences is nearly flat, moving from 0.6% to 0.7%, and mathematics and statistics has no matching course in either window. Removing earth and sustainability leaves a STEM increase from 0.3% to 1.9%.
TABLE 7
STEM and Medical Sciences Progressive-Signal Shares at Stanford, 2025–26
| Area | Course (%) | Enr.-wtd. (%) | Courses | Enr. observed (%) | Observed registrations |
| STEM | 3.4 | 1.0 | 1,772 | 91.9 | 77,577 |
| Medical sciences | 7.7 | 5.5 | 896 | 91.5 | 17,690 |
Note: Course is the share of all scheduled, de-duplicated courses. Enr.-wtd. is the share of observed student-course registrations. Enr. observed gives the percentage of courses with observed enrollment.
Results from the University Sample
I began with Stanford because its catalog and enrollment data are unusually rich and complete. I have also worked there since 2011; it is the university I know and care about most. Yet Stanford may not be representative of the broader sample. Understanding how much universities differ is also important in its own right. The politicization of one university is less of a concern when students and families have many alternatives. Our interpretation also depends on whether politicization is a systemic phenomenon spanning many universities or is confined to a few institutions. This section therefore examines both common trends and variation across universities, applying the same measurement rules to the 111 institutions in the primary sample.
Pooled Progressive and Canonical Signals over Time
Across the university sample, the progressive course share more than doubles between 2000 and 2025 while the canon share barely moves (Figure 8). The pooled series gives every de-duplicated course available in a year equal weight. The sample grows from 71,294 course-years in 2000 to 484,479 in 2025. Because the set of universities changes by year, I also report estimates that hold composition fixed.
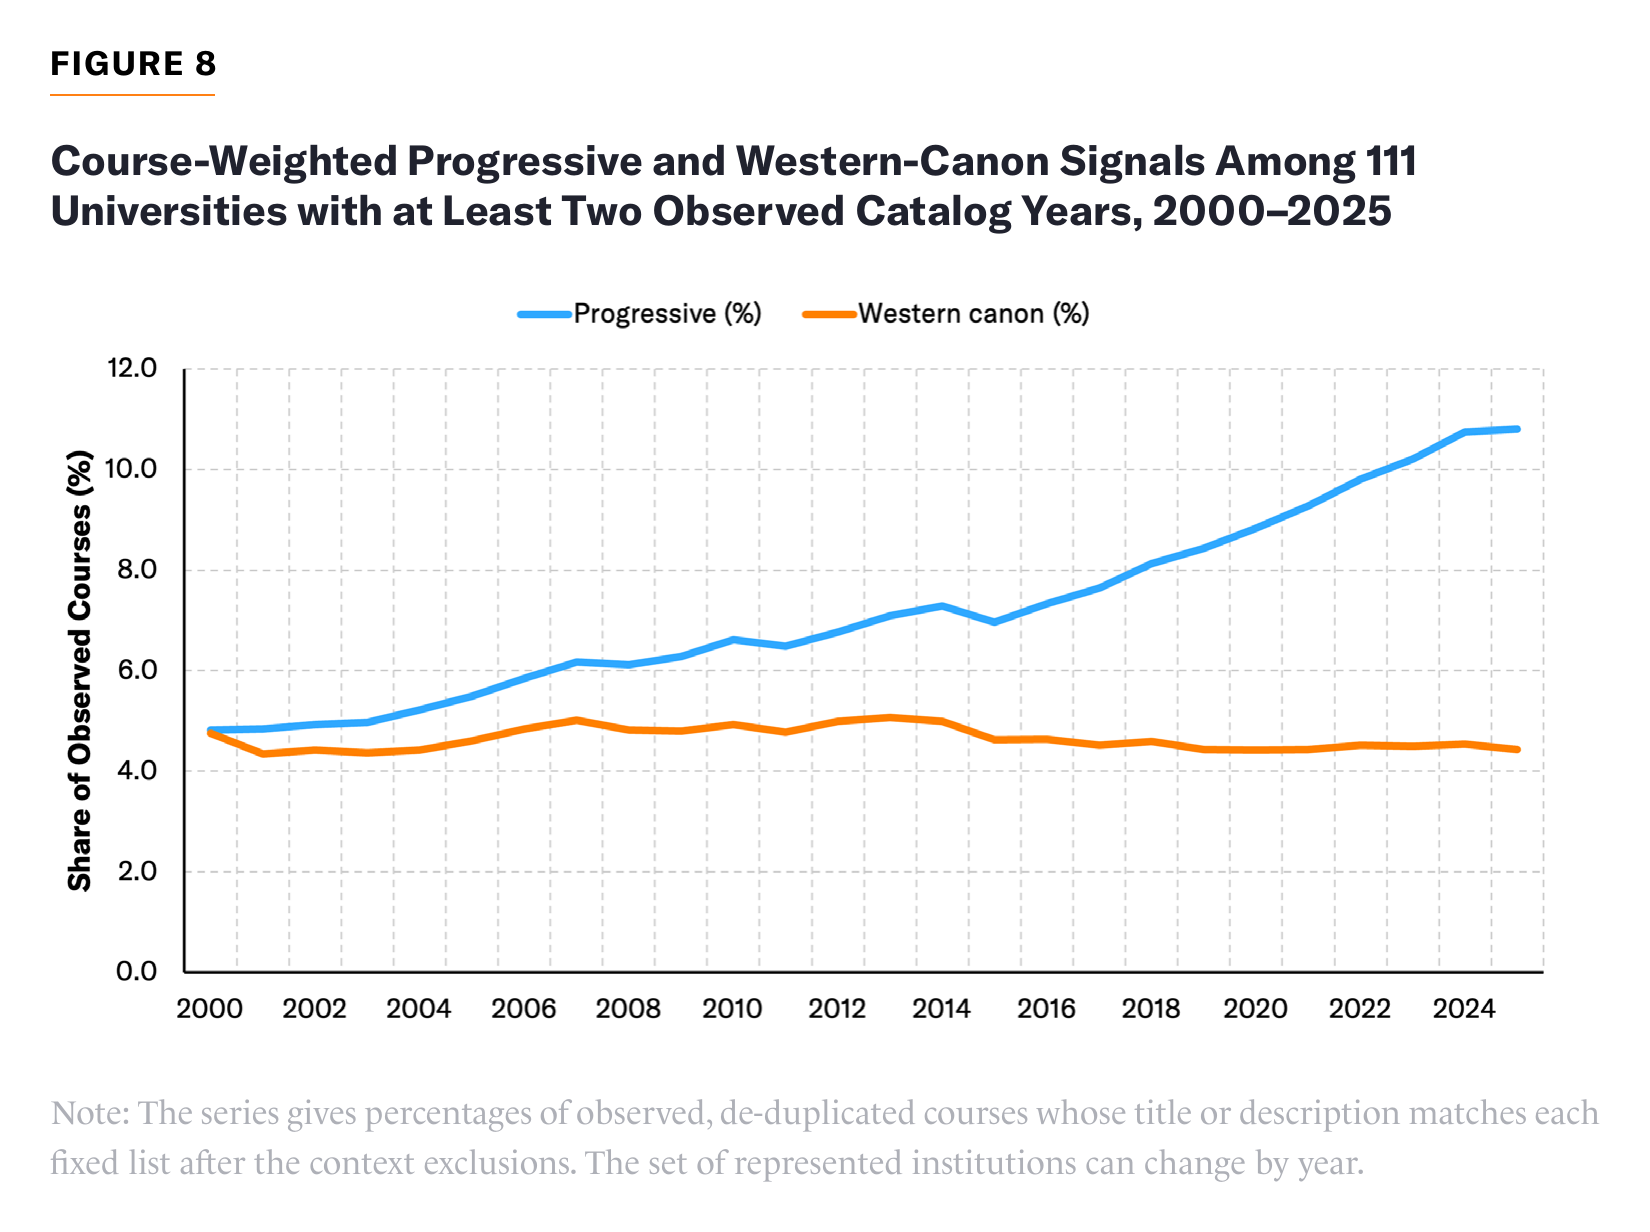
From 2000 to 2025, the progressive course share increases from 4.82% to 10.80%, while the canon share moves from 4.75% to 4.43%. The progressive increase unfolds over most of the 25-year period and continues after 2015 and 2020.[13] Canon incidence rises modestly through 2013 before declining, ending slightly below its initial level. The growing separation between the two series therefore reflects chiefly the expansion of progressive language in course catalogs.
The trend survives adjustment for description length. Across the sample, the mean length of a title and description rises from 49 words in 2000 to 66 words in 2025, so part of any course-share increase could reflect longer text. To test this, I use the same density measure as at Stanford. Progressive density rises from 0.230 to 0.501 per 100 catalog words, an increase of 118%, and its rise is as steady as the rise in the course share. Canon density holds near 0.19 to 0.20 through 2014 and then falls to 0.148 by 2025, a decline of 23% (Figure 9). As at Stanford, the canon course share is flat while canon references lose ground in the growing volume of catalog text.
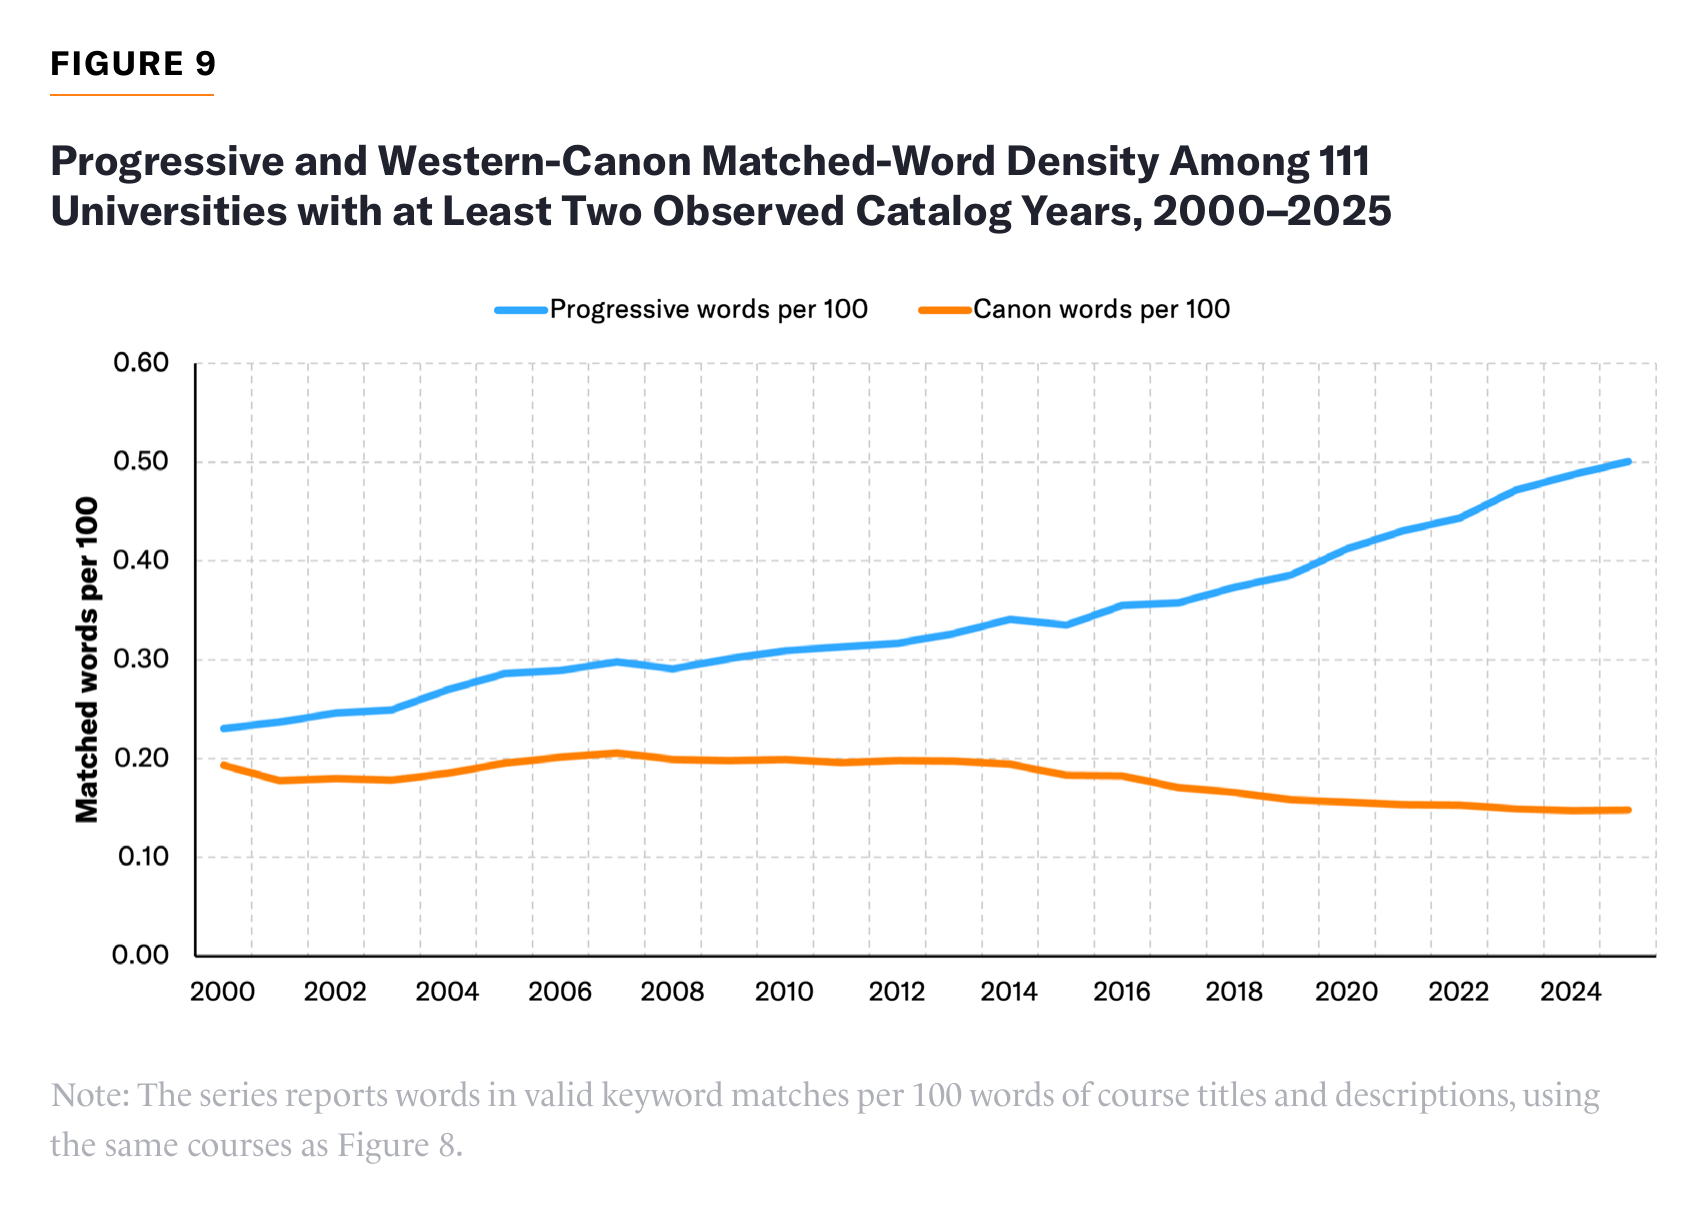
Table 8 compares the pooled series with a balanced panel, an endpoint-matched sample, and a series with equal university weights. The 16 universities observed in all 26 years, the 17 observed at both endpoints, and the equal-university-weight series all show progressive increases of 6.8 points or more. The progressive increase persists when university membership is held fixed or universities receive equal weight. Canon shows a small decline under every specification. Equal weighting raises both levels because small liberal arts catalogs are rich in both vocabularies.
TABLE 8
Progressive and Western-Canon Course Shares in 2000 and 2025 Under Alternative Sample and Weighting Specifications
| Progressive | Western Canon | ||||||
| Universities | 2000 | 2025 | Change | 2000 | 2025 | Change | |
| Pooled, course-weighted | 20 to 92 | 4.82 | 10.80 | +5.98 | 4.75 | 4.43 | -0.32 |
| Balanced panel | 16 | 4.66 | 11.53 | +6.88 | 4.57 | 4.23 | -0.34 |
| Observed at both endpoints | 17 | 4.82 | 11.64 | +6.82 | 4.82 | 4.40 | -0.42 |
| Equal university weights | 20 to 92 | 5.36 | 12.59 | +7.23 | 6.14 | 5.40 | -0.74 |
Note: Entries are percentages of courses, and changes are in percentage points.
Selected Longitudinal Comparisons
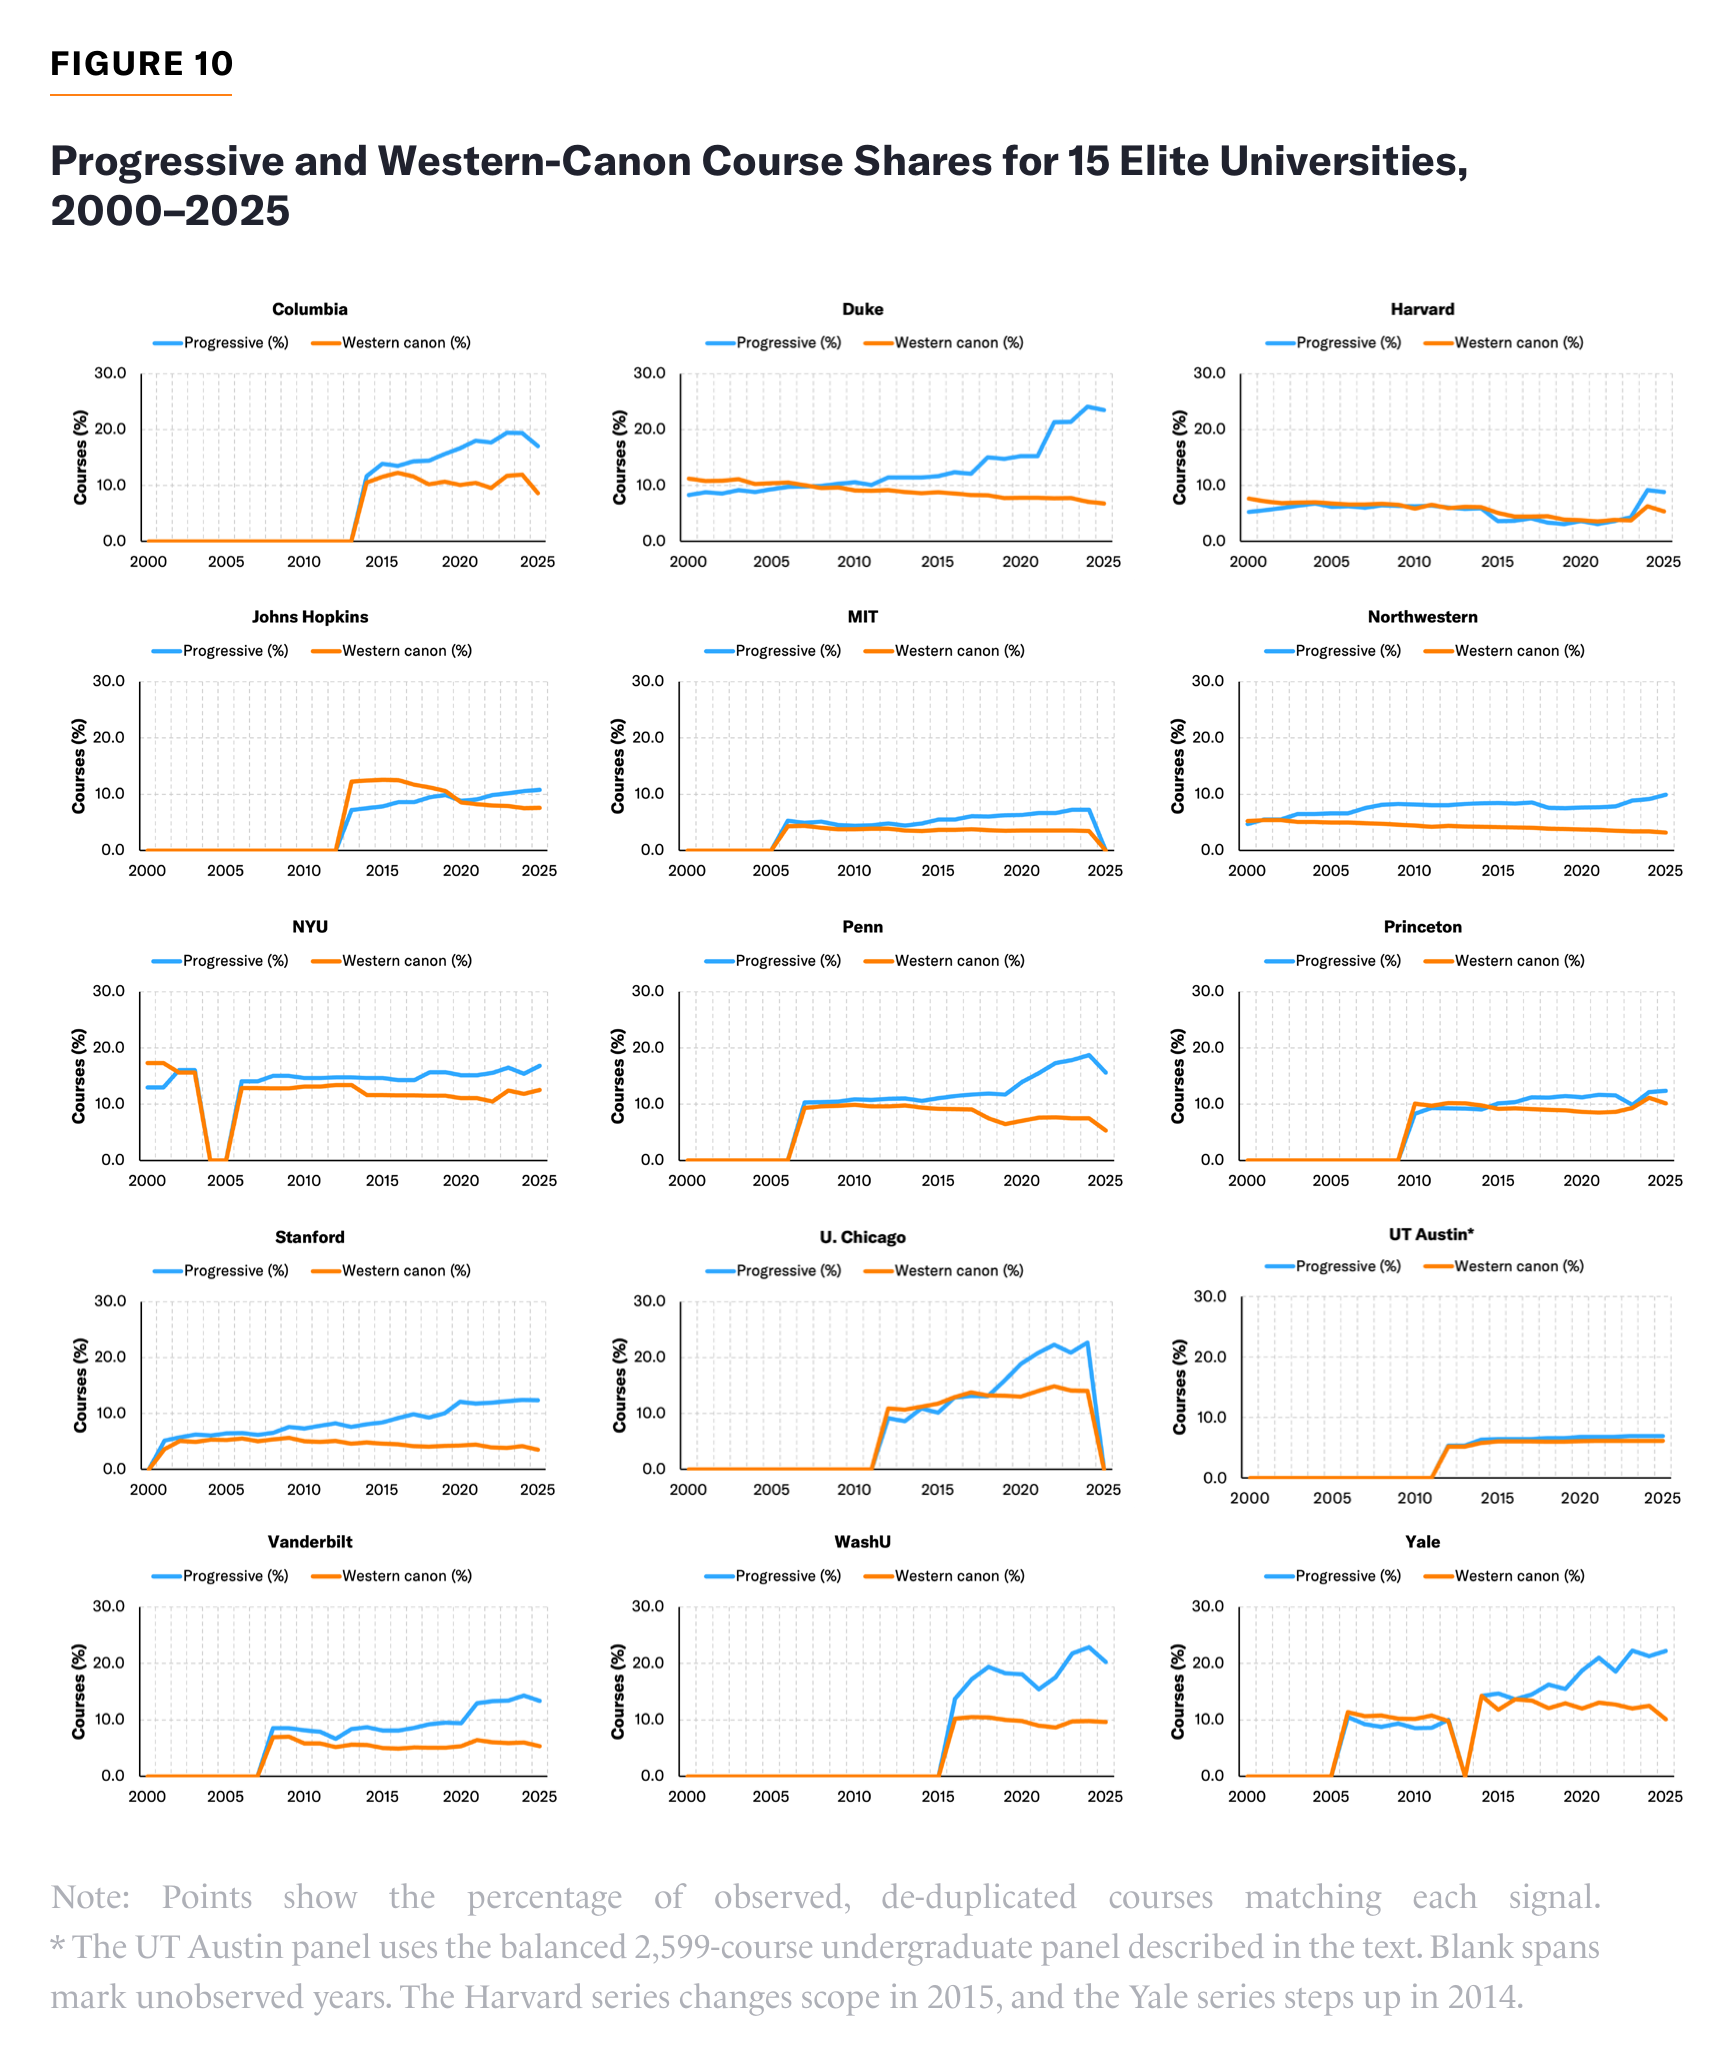
The pooled series describes the sample as a whole and hides the differences among institutions. I examine this variation among 15 large elite American universities. These institutions deserve separate attention. They educate a small share of students but train a disproportionate share of the faculty, judges, executives, and officials who shape the rest of higher education and public life. Figure 10 follows the 15 on common axes. The panels illustrate differences in the level and timing of the trends across selected institutions; they do not provide a representative estimate for American higher education.
The UT Austin panel follows the same 2,599 undergraduate course identifiers in every catalog year from 2012–13 through 2025–26.[14] It therefore measures changes among continuously listed courses, excluding courses that enter or leave the catalog.
The progressive course share ends above its starting level in every panel, but the timing of the increase differs across universities. At Stanford, the share rises through much of the 2000s and 2010s. Northwestern, by comparison, remains near 8% from the late 2000s through 2022 before climbing again. These paths illustrate how the sustained rise in the pooled series can combine gradual growth at some institutions with long plateaus and later increases at others. Canon shares are generally stable or declining across the selected universities.
Differences Across Universities
Variation across universities matters because politicization is less consequential when students and families have meaningful alternatives. Universities with similar political orientations might nevertheless use very different catalog language. Liberal arts colleges, research universities, and technical institutions offer different mixes of subjects and degree programs. Their catalogs also differ in scope and detail, ranging from titles alone to extensive descriptions and sometimes covering only a constituent college. Subject matter and disclosure conventions can therefore generate large gaps in keyword shares even when comparable courses are taught in the same way.
To make the catalogs more comparable, I count matched words per 100 catalog words and compare institution types separately. For catalogs with descriptions for most courses, I also give broad academic fields the same weights. The question is how much variation remains after these adjustments. Identifying differences in politicization more directly would require comparing courses in the same subjects and at the same level, using syllabi and reading lists to assess how competing perspectives are presented.
The 2025 cross-section covers all 92 universities observed that year. Table 9 reports course shares and word densities, giving each university equal weight.
TABLE 9
Distribution of Language Signals Across 92 University Catalogs, 2025
| Measure | Min | P10 | P25 | Median | P75 | P90 | Max |
| Progressive share | 1.5 | 3.7 | 6.2 | 10.3 | 17.1 | 26.9 | 38.5 |
| Western-canon share | 0.8 | 1.7 | 2.5 | 4.2 | 7.7 | 10.8 | 16.3 |
| Progressive density | 0.07 | 0.17 | 0.32 | 0.47 | 0.69 | 0.86 | 1.28 |
| Western-canon density | 0.02 | 0.07 | 0.09 | 0.15 | 0.22 | 0.27 | 0.44 |
Note: Shares are percentages of courses. Densities count words in valid keyword matches per 100 words of course titles and descriptions. Some catalogs cover constituent units.
“P” = percentile.
Catalog language varies widely across universities: the middle half of progressive course shares ranges from 6.2% to 17.1%. The progressive and canon shares are strongly positively correlated, at 0.87. Institutions with more of one vocabulary tend to have more of the other, so the two signals cannot be read as opposing ends of a single ideological scale. Both shares can be elevated by a greater concentration of humanities courses or more detailed descriptions, and the two lists differ in how often they match a course.
Raw course shares differ markedly by institution type. Table 10 splits the universities into liberal arts colleges, private research universities, and public universities. The median progressive share is 26.6% at the liberal arts colleges, 10.8% at the private research universities, and 7.6% at the public universities, and the canon medians fall in the same order. Seven of the eight highest progressive shares belong to liberal arts colleges, with Dartmouth the eighth. The eight lowest belong to engineering-heavy or technical institutions such as Georgia Tech, Auburn, Texas Tech, and Rensselaer Polytechnic Institute (RPI).
TABLE 10
Medians by Institution Type Across 92 Universities, 2025
| Course Share (%) | Words per 100 | Desc. Words | Courses | ||||
| Universities | Prog. | Canon | Prog. | Canon | |||
| Liberal arts colleges | 16 | 26.6 | 10.2 | 0.73 | 0.23 | 109 | 1,874 |
| Private research universities | 41 | 10.8 | 5.3 | 0.41 | 0.17 | 66 | 3,597 |
| Public universities | 35 | 7.6 | 2.4 | 0.42 | 0.09 | 43 | 7,051 |
Note: Course shares are percentages of courses. The “Words per 100” columns report words in valid keyword matches per 100 words of course titles and descriptions. “Desc. Words” is the mean number of description words per course, and “Courses” is the number of de-duplicated courses in the catalog.
Measuring progressive language per catalog word nearly eliminates the gap between private research and public universities, while liberal arts colleges remain above both groups. The private research and public medians are 0.41 and 0.42 matched words per 100 catalog words, respectively, compared with 0.73 at liberal arts colleges. The higher raw progressive course share at private research universities is therefore sensitive to catalog-writing practices: their descriptions are generally longer, creating more opportunities for a match. The liberal arts difference persists after scaling by text length, although differences in subject mix may still contribute to it.[15]
Substantial variation remains after measuring valid matched words per 100 catalog words and giving the four academic areas equal weight. In a restricted comparison of 57 universities, the 25th and 75th percentiles of standardized progressive density are 0.38 and 0.61 matched words per 100 catalog words.[16]
Results by Academic Area
The comparisons across universities show that keyword shares depend partly on subject mix and catalog-writing practices. I now examine trends within broad academic areas to distinguish increases within fields from shifts in the mix of fields, although the composition of subjects within each area can still change. This comparison also shows whether the rise in progressive language extends beyond humanities and social sciences to professional, scientific, and technical fields. Figure 11 and Table 11 trace both language signals across five nonoverlapping areas.
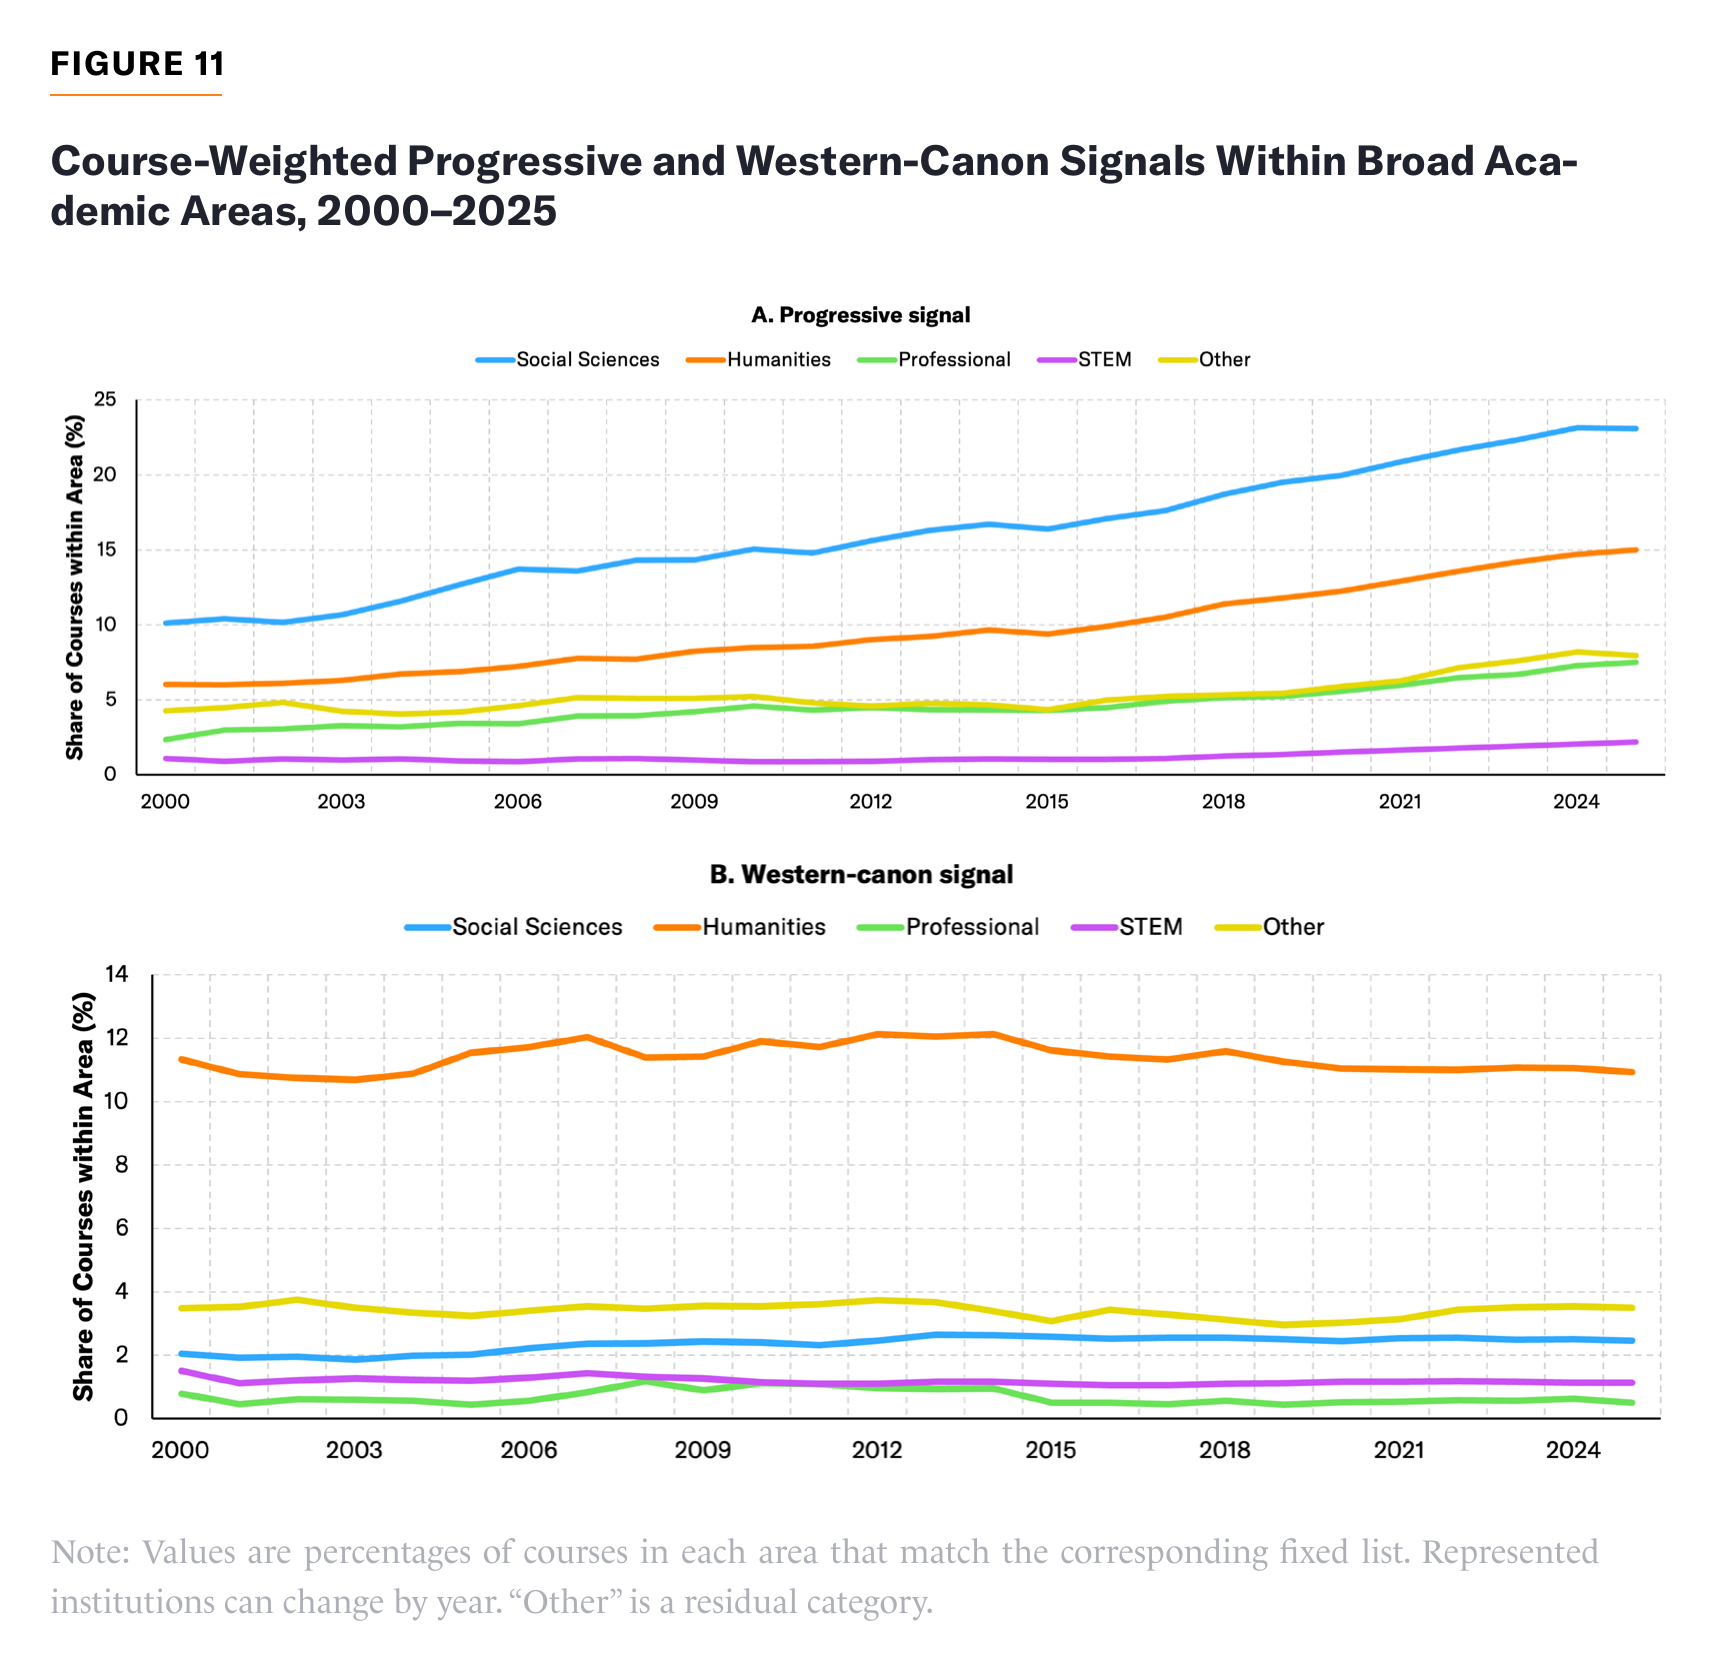
TABLE 11
Language Signals by Academic Area, 2000 and 2025
| Progressive | Western Canon | 2025 Sample | ||||||
| 2000 | 2025 | Change (%) | 2000 | 2025 | Change (%) | Universities | Courses | |
| Social sciences | 10.10 | 23.09 | +128.6 | 2.04 | 2.46 | +20.8 | 90 | 79,040 |
| Humanities | 6.02 | 15.00 | +149.0 | 11.33 | 10.93 | -3.5 | 91 | 134,691 |
| Professional | 2.35 | 7.50 | +218.8 | 0.78 | 0.50 | -35.9 | 87 | 53,887 |
| STEM | 1.08 | 2.18 | +101.7 | 1.50 | 1.12 | -25.2 | 92 | 128,175 |
| Other | 4.26 | 7.96 | +86.8 | 3.48 | 3.50 | +0.5 | 91 | 88,686 |
Note: Levels are percentages of courses within an area. Change is the relative percent change from 2000 to 2025. Universities and Courses give the number of universities and de-duplicated courses contributing to the area in 2025.
Social sciences has the highest progressive course share throughout the period, reaching 23.1% in 2025, compared with 7.5% in professional schools. Professional schools show the fastest proportional growth, with their share more than tripling since 2000. Progressive language increases in every broad academic area, including STEM. Because the increase occurs within every area, the aggregate expansion cannot be explained solely by a shift toward fields where progressive language was already common.
Progressive words per 100 catalog words more than double in social sciences, humanities, professional schools, and STEM, with social sciences remaining highest. Longer descriptions alone therefore cannot explain the increase in matching courses.
Western-canon language remains concentrated in humanities, where it appears in about 11% of courses at both endpoints. This relative stability contrasts with the broad expansion of progressive language. The canon share in professional schools falls by more than a third, but the decline amounts to only 0.28 percentage points from a starting share below 1%. Canon references were already uncommon in these programs.
In the balanced sample of 16 universities observed every year from 2000 to 2025, progressive course shares more than double in social sciences, humanities, and STEM and more than triple in professional schools. These within-field increases persist in a fixed set of universities, so changes in coverage alone cannot explain them.
Conclusion
The modern university was designed to produce and transmit knowledge, and that purpose is itself the university’s contribution to society. Social scientist Jonathan Haidt argues that many universities now treat social justice as an end in itself.[17] In his view, universities cannot pursue both social justice and truth-seeking: inquiry ends when political goals determine its conclusions.
This report asks whether the shift that Haidt describes is reflected in course catalogs, which capture what universities say they teach. Using fixed keyword lists applied to 7.3 million course-year records from 111 universities, I measure how much of the curriculum is described in the vocabulary of progressive politics, and how much still refers to the Western intellectual tradition that the modern university was built to preserve.
The share of courses containing progressive language more than doubles, from 4.8% in 2000 to 10.8% in 2025. Progressive words per 100 catalog words rise by 118%, so the increase also appears after scaling by text length. The expansion is general rather than confined to a few departments or campuses. It appears in every broad academic area and, among the 15 elite universities followed individually, in every panel of Figure 10. Social sciences has the highest progressive course share, at 23.1% in 2025, but professional schools show the fastest growth, more than tripling their share. At Stanford, over 25% of law courses now match the progressive list, as do 7.7% of courses in medical sciences and nearly 10% of those in earth and sustainability. Even STEM, where such language was almost absent in 2000, has seen its share double.
In contrast, the Western-canon course share drifts from 4.8% to 4.4%, while canon references per catalog word fall by 23% and canon density at Stanford falls by nearly half. The canon has not been expelled from the catalog, but it occupies a shrinking corner of a growing text.
The method has several limitations. Canon references need not signal canonical teaching: an author may be assigned only to be quickly dismissed, and courses that engage the tradition seriously may describe themselves in other words. Progressive vocabulary need not signal political bias: a course on income inequality or immigration can be scrupulously balanced, and the measure records stated attention, not slant. Courses can also be thoroughly political without using any of the listed terms. Some scholarly research shows that even when catalog language is neutral, reading lists on contested questions rarely span the scholarly debate.[18] Catalog text records stated attention to these subjects but is an uncertain guide to what happens in the classroom.
Are these magnitudes large? At Stanford, 12.4% of the 2025–26 catalog matches the progressive list. That is almost as many courses as the entire social sciences division, which accounts for 14.3% of the catalog. Whether that figure should alarm anyone depends on what lies behind the language. If only 1%–2% of all courses in Stanford’s catalog treat their subject as settled moral doctrine rather than open inquiry, the university retains ample room for self-correction. If a large fraction does, activism would occupy a substantial share of the curriculum. Such activism could influence hiring, promotion, classroom discussions, and institutional responses. It could also crowd out scholarship by making the environment less curious and less demanding.
From my qualitative reading of the catalogs and the examples referenced in this report, I believe that an excessive share of university courses explicitly aim to cultivate an activist mindset, a “change agent identity” or a “critical consciousness.”
But more research and transparency are needed to draw definitive conclusions. Universities should publish course descriptions, syllabi, reading lists, and course-level enrollment counts in consistent formats and preserve archives for comparisons over time. Disclosure would enable families to compare course offerings, syllabi, and assigned readings, and allow institutions to compete on curricular content. Students could find programs that fit them; researchers, journalists, and trustees could assess curricular change independently using published evidence. Above all, universities that receive public funding owe this information to the public that pays for them. Public confidence in higher education has fallen sharply over the past decade.[19] A university confident in its curriculum has nothing to lose from letting others see it.
About the Author
Iván Marinovic is the Jonsson Family Professor of Accounting at Stanford Graduate School of Business. Before joining Stanford GSB, he taught microeconomics in the business department of Universidad de los Andes, Chile. Marinovic’s research focuses on applications of economics of information in accounting and finance. He holds a B.A. in economics and an M.A. in financial economics from the Catholic University of Chile. Marinovic also holds a master’s degree in economic theory from the Toulouse School of Economics and a PhD in accounting, information, and management from the Kellogg School of Management.
Acknowledgments
The author wishes to thank John Cochrane, Jon Levin, James Hamilton, Juan Santiago, Jeff Zwiebel, Richard Saller, John Etchemendy, Richard Lowery, Kevin Wallsten, Robert VerBruggen, and Judge Glock.
Appendix
Robustness of the Cross-University Trend
I keep each university-year’s audited set of courses fixed unless a check explicitly restricts it. I vary the universities included and the weights they receive, while keeping the classification rules unchanged. These checks describe patterns in catalog language.
Panel Imbalance and Institutional Weighting
Figure A1 compares the pooled series with three alternatives: series that weight universities equally; series that retain only the 16 universities observed every year; or series that adjust for university fixed effects. The fixed-effects model uses university-year shares with year and university indicators. The model weights each university-year by its observed course count and clusters standard errors by university. I set the fixed-effects series’ 2000 value equal to the pooled value in order to show changes from a common baseline.
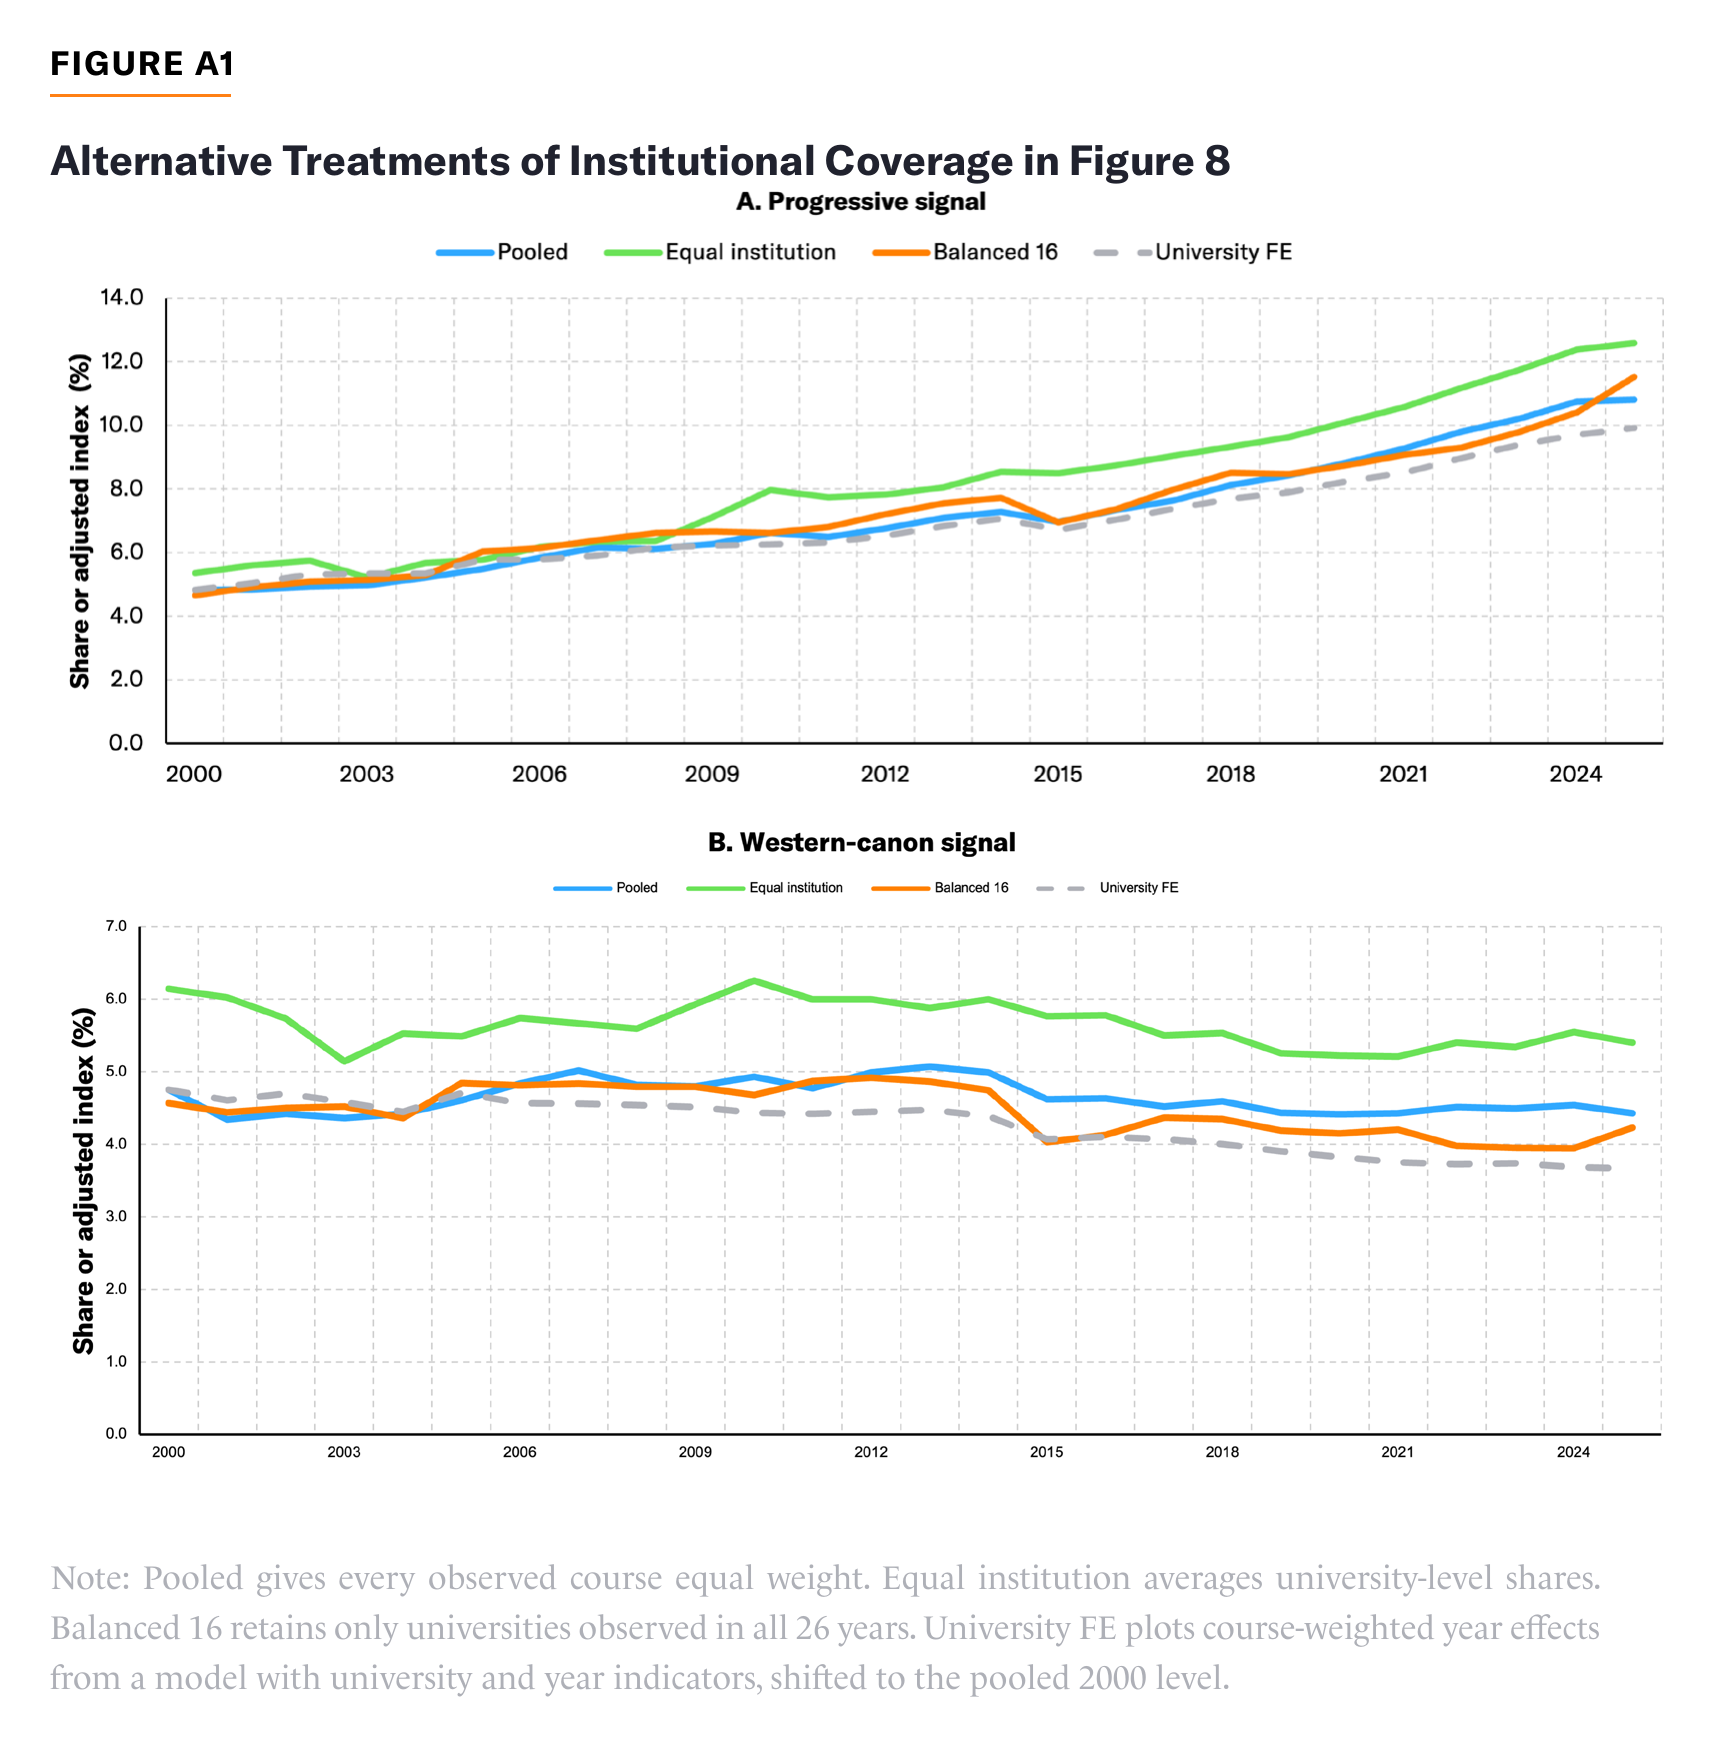
All endpoint estimates show a progressive increase and a canon decline (Table A1). The pooled, balanced, endpoint-matched, and equal-weight rows repeat Table 8 in the text. Restricting the sample to universities observed for at least 10 years yields a 5.44-percentage-point increase in the progressive course share. Course-weighted fixed effects yield 5.10 points, with a university-clustered 95% confidence interval from 3.85 to 6.35. The corresponding canon estimate is -1.08 points, with an interval from -1.67 to -0.50. Equal-weight fixed-effects estimates are +5.58 points for the progressive share and -1.28 points for the canon share.
TABLE A1
Endpoint Changes Under Alternative Panel and Weighting Specifications
| Specification | Eligible | N 2000 | N 2025 | Progressive | Canon |
| Course-weighted pooled | 111 | 20 | 92 | +5.98 | -0.32 |
| Equal institution weight | 111 | 20 | 92 | +7.23 | -0.74 |
| Balanced 2000–2025 | 16 | 16 | 16 | +6.88 | -0.34 |
| Endpoint-matched | 17 | 17 | 17 | +6.82 | -0.42 |
| At least 10 years | 75 | 18 | 65 | +5.44 | -0.41 |
| University fixed effects, course-weighted | 111 | 20 | 92 | +5.10 | -1.08 |
| University fixed effects, equal weight | 111 | 20 | 92 | +5.58 | -1.28 |
Note: Eligible gives the number of universities meeting each sample rule. N and N and give the numbers observed in those years. Fixed-effects rows report the 2025 year effect relative to 2000. All changes use percentage points.
Dropping each of the 16 institutions in turn gives progressive increases between 5.40 and 7.21 points. Canon changes run from -1.09 to -0.50. The progressive increase and canon decline in Figure 8 persist when I change institutional coverage, change the weighting, or omit any one continuously observed university.
Universities in the Primary Sample
Tables A2 and A3 list the 111 universities in the primary sample with their catalog coverage and latest-catalog description length. The 21 one-year universities in the collection are omitted. Manifests accompanying the code record the location, format, and parsing status of every catalog year for every university, including the omitted ones.
TABLE A2
Universities in the Primary Sample
| University | Yrs | First | Latest | Words | University | Yrs | First | Latest | Words |
| American | 10 | 2016 | 2025 | 62 | Furman | 4 | 2022 | 2025 | 56 |
| Amherst | 11 | 2015 | 2025 | 163 | George Washington | 11 | 2014 | 2024 | 36 |
| Arizona State | 6 | 2000 | 2005 | 47 | Georgetown | 4 | 2000 | 2004 | 156 |
| Auburn | 13 | 2013 | 2025 | 33 | Georgia Tech | 10 | 2016 | 2025 | 21 |
| Barnard | 15 | 2010 | 2025 | 117 | Grinnell | 2 | 2024 | 2025 | 85 |
| Baylor | 24 | 2002 | 2025 | 39 | Hamilton | 6 | 2020 | 2025 | 69 |
| Berkeley | 26 | 2000 | 2025 | 53 | Harvard | 26 | 2000 | 2025 | 78 |
| Boston College | 26 | 2000 | 2025 | 89 | Haverford | 7 | 2018 | 2025 | 86 |
| Boston University | 7 | 2010 | 2024 | 81 | Houston | 14 | 2012 | 2025 | 42 |
| Bowdoin | 6 | 2019 | 2024 | 122 | Howard | 3 | 2022 | 2025 | 28 |
| Brandeis | 8 | 2010 | 2017 | 56 | Johns Hopkins^ | 13 | 2013 | 2025 | 99 |
| Brown | 16 | 2010 | 2025 | 86 | Lehigh | 13 | 2013 | 2025 | 47 |
| Caltech | 26 | 2000 | 2025 | 74 | LSU | 14 | 2012 | 2025 | 31 |
| Carnegie Mellon | 26 | 2000 | 2025 | 252 | Macalester | 17 | 2009 | 2025 | 89 |
| Case Western | 9 | 2017 | 2025 | 98 | Marquette | 3 | 2023 | 2025 | 47 |
| Claremont McKenna | 4 | 2022 | 2025 | 69 | Maryland– College Park | 2 | 2024 | 2025 | 57 |
| Colgate | 4 | 2022 | 2025 | 109 | Miami | 11 | 2015 | 2025 | 51 |
| Colorado Boulder | 26 | 2000 | 2025 | 70 | Michigan (LSA, Engr.)^ | 21 | 2003 | 2025 | 39 |
| Columbia^ | 12 | 2014 | 2025 | 87 | Michigan State | 21 | 2001 | 2021 | 43 |
| Cornell | 26 | 2000 | 2025 | 85 | Middlebury | 10 | 2016 | 2025 | 109 |
| Dartmouth | 22 | 2004 | 2025 | 100 | Minnesota | 14 | 2012 | 2025 | 63 |
| Davidson | 4 | 2022 | 2025 | 115 | MIT | 19 | 2006 | 2024 | 61 |
| Drexel | 4 | 2022 | 2025 | 40 | NC State | 13 | 2011 | 2025 | 48 |
| Duke | 26 | 2000 | 2025 | 64 | New Jersey Institute of Technology | 10 | 2016 | 2025 | 57 |
| Emory^ | 13 | 2007 | 2025 | 43 | Northeastern | 8 | 2017 | 2025 | 57 |
| Florida | 13 | 2006 | 2025 | 32 | Northwestern^ | 26 | 2000 | 2025 | 34 |
| Florida State | 22 | 2002 | 2025 | 31 | Notre Dame | 26 | 2000 | 2025 | 130 |
| Fordham | 8 | 2018 | 2025 | 89 | NYU^ | 24 | 2000 | 2025 | 87 |
^Catalog that covers a constituent college, school, or selected divisions rather than a whole university
TABLE A3
Universities in the Primary Sample, cont.
| University | Yrs | First | Latest | Words | University | Yrs | First | Latest | Words |
| Ohio State | 26 | 2000 | 2025 | 50 | UC San Diego | 19 | 2007 | 2025 | 54 |
| Penn | 19 | 2007 | 2025 | 109 | UC Santa Barbara^ | 11 | 2010 | 2020 | 55 |
| Penn State | 8 | 2018 | 2025 | 118 | UC Santa Cruz | 7 | 2019 | 2025 | 46 |
| Pepperdine | 7 | 2019 | 2025 | 50 | UCLA | 26 | 2000 | 2025 | 39 |
| Princeton | 16 | 2010 | 2025 | 65 | UConn | 26 | 2000 | 2025 | 46 |
| Purdue | 18 | 2008 | 2025 | 50 | University of Illinois Urbana-Champaign | 5 | 2020 | 2024 | 56 |
| Rice | 22 | 2004 | 2025 | 62 | UMass Amherst | 14 | 2012 | 2025 | 0 |
| Rochester | 16 | 2010 | 2025 | 78 | UNC–Chapel Hill | 18 | 2008 | 2025 | 38 |
| Rensselaer Polytechnic Institute | 19 | 2007 | 2025 | 69 | USC | 17 | 2000 | 2016 | 20 |
| Rutgers-Camden | 18 | 2003 | 2024 | 55 | UT Austin | 6 | 2020 | 2025 | 50 |
| Rutgers–New Brunswick | 3 | 2020 | 2025 | 55 | UT Knoxville | 17 | 2009 | 2025 | 45 |
| Rutgers-Newark | 19 | 2003 | 2024 | 56 | UVA | 21 | 2005 | 2025 | 45 |
| Santa Clara | 9 | 2017 | 2025 | 62 | Vanderbilt | 18 | 2008 | 2025 | 45 |
| SMU | 9 | 2017 | 2025 | 43 | Vassar | 2 | 2024 | 2025 | 127 |
| Stanford | 25 | 2001 | 2025 | 108 | Villanova | 18 | 2001 | 2025 | 66 |
| Stevens | 4 | 2021 | 2024 | 72 | Virginia Tech | 6 | 2016 | 2021 | 40 |
| Stony Brook | 15 | 2010 | 2024 | 75 | Wake Forest | 22 | 2004 | 2025 | 35 |
| Swarthmore | 2 | 2024 | 2025 | 119 | Washington | 26 | 2000 | 2025 | 34 |
| Texas A&M | 16 | 2009 | 2024 | 48 | Washington and Lee | 17 | 2009 | 2025 | 73 |
| Texas Tech | 10 | 2016 | 2025 | 26 | WashU | 10 | 2016 | 2025 | 100 |
| Tufts | 13 | 2013 | 2025 | 65 | Wesleyan | 5 | 2021 | 2025 | 136 |
| Tulane | 7 | 2019 | 2025 | 55 | William & Mary | 14 | 2012 | 2025 | 70 |
| U. Chicago^ | 13 | 2012 | 2024 | 163 | Williams | 17 | 2009 | 2025 | 175 |
| U. Iowa | 10 | 2016 | 2025 | 38 | Wisconsin-Madison | 15 | 2011 | 2025 | 38 |
| UC Davis | 26 | 2000 | 2025 | 26 | WPI | 5 | 2021 | 2025 | 94 |
| UC Irvine | 26 | 2000 | 2025 | 33 | Yale | 19 | 2006 | 2025 | 108 |
| UC Merced | 13 | 2013 | 2025 | 43 | Yeshiva | 6 | 2014 | 2024 | 36 |
| UC Riverside | 7 | 2019 | 2025 | 65 |
Endnotes
Are you interested in supporting the Manhattan Institute’s public-interest research and journalism? As a 501(c)(3) nonprofit, donations in support of MI and its scholars’ work are fully tax-deductible as provided by law (EIN #13-2912529).