Was the U.S. Prepared for the 2026 FIFA World Cup? A Readiness Analysis

Photo by Sarah Stier - FIFA/FIFA via Getty Images
Executive Summary
The 2026 World Cup spans 39 days, 48 teams, and 104 matches—the largest and longest in World Cup history.[1] It is hosted for the first time in 16 cities across three countries: the U.S., Canada, and Mexico. While the event’s responsibility is shared among three hosting countries, most of the matches are played in cities within the U.S. (11), with 3 in Mexico and 2 in Canada.[2] Millions of fans are crossing borders and states over six weeks. FIFA officials boast of “104 Super Bowls in one month,” and organizers expect six to 10 million visitors to North America.[3] This unprecedented scale makes readiness far more important than stadium planning. For the U.S., it implicates border processing, international diplomacy, airline and ground travel throughput, city operations and transit, cyber and communications resilience, public safety, and federal/state/local/international coordination.
The large scale—combined with the geographic dispersion of venues and an anticipated influx of millions of international visitors—transforms the event from a sports competition into a large-scale test of national infrastructure, border administration, public safety, and intergovernmental coordination. Compared with previous hosts, the U.S. entered the tournament with immense baseline capacity. The U.S. possesses deeper financial resources, a larger existing aviation network, extensive law-enforcement capabilities, and numerous stadiums already capable of hosting major events. In fact, the U.S. is the only recent host that has not invested large amounts of resources into infrastructure, due to existing facilities. Yet these strengths coexist with systemic vulnerabilities. The U.S. must manage the tournament across dozens of jurisdictions and thousands of miles, relying on aging infrastructure, federal and state governance that is often fragmented, and immigration policies that can create barriers for fans from key soccer markets.
This report argues that the U.S. will almost certainly host the tournament successfully in a narrow operational sense—the matches will be played, stadiums will function, and basic security will be maintained. However, success in a broader strategic sense remains uncertain and to be tested. The most consequential constraints are not stadium readiness but the performance of several interdependent systems: immigration and visas, transportation networks, security coordination, and lodging capacity. If these systems fail to scale effectively for the massive tourism intake, the visitor experience could deteriorate, public resources could be strained, and avoidable vulnerabilities could emerge during the tournament.
Key Takeaways
The U.S. is likely to stage the 2026 FIFA World Cup successfully in the narrowest sense: matches will be played, stadiums will open, and basic public safety will be maintained. The harder question is whether the U.S. can deliver a World Cup that feels reliable, affordable, secure, and welcoming across 11 U.S. host metros, three national governments, and a travel geography much larger than any single-city Olympics or compact World Cup. The central finding of this report is that the country’s core vulnerabilities sit outside the stadiums. They sit in the interfaces between systems: visa appointments and border processing, airport reliability and domestic connections, stadium last-mile transport, local policing and federal security support, cyber resilience, and lodging affordability.
KEY POINTS:
- The stadiums are not the main problem. The U.S. begins with an unusually strong physical-venue base compared with many previous hosts. The risk is that airports, roads, transit connections, utility systems, crowd-control perimeters, and public agencies will be asked to operate as one integrated system even though they are normally governed separately.
- Immigration is the most visible bottleneck. Most visitors will enter through low-friction channels such as the Visa Waiver Program, but a strategically important share of fans from Latin America, Africa, Asia, and other football-intensive markets will rely on B-1/B-2 visitor visas. Long or volatile appointment waits at specific consular posts could exclude eligible fans, create diplomatic friction, and make the U.S. appear less welcoming, precisely when it is trying to project openness.
- Transportation risk is less about total capacity than about peak reliability. The U.S. aviation system is large, but the tournament will add international arrivals, domestic repositioning trips, weather-sensitive summer travel, and fixed match deadlines on top of an already-busy system. At the local level, several stadiums depend heavily on shuttles, parking, rideshare, or event-day rail service rather than simple high-capacity urban transit.
- Security readiness must cover ordinary disorder, not only terrorism. The most likely operational failures are crowd surges, gate-crashing attempts, fan-zone disorder, heat-related emergencies, cyber disruptions, and localized crime exposure. Even a full stadium with substantial law-enforcement presence and an experienced venue are not enough if intelligence, perimeter design, and crowd-flow assumptions fail.
- Lodging is an affordability and geography problem. Large hotel markets can still produce acute price spikes and unusable supply if rooms are far from stadiums or poorly connected by late-night transit. Short-term rental restrictions protect housing stock but also limit surge elasticity in several host cities.
Introduction
The 2026 World Cup breaks all records. It is the first men’s tournament with 48 teams and 104 games—40 more than Qatar 2022 and double the 52 games of the 1994 U.S. Cup[4]—stretched over 39 days. The Fédération Internationale de Football Association’s (FIFA) own president has called it “the biggest sporting event in the history of the world.”[5] No host has ever had to welcome so many matches across such geography. By comparison, the 1994 World Cup was 24 teams, with 52 matches in nine U.S. venues;[6] Germany 2006 spanned 12 venues in one country; Brazil 2014 was 12 cities in one country.
In practical terms, this means that entry and visas become border-security issues on a new scale, and transportation becomes cross-continental. Even routine travel tasks like airport screening will see surges far beyond typical summer peaks: host-nation Qatar saw a 30% increase in arrivals in 2022, even reopening a dormant airport in order to cope.[7] In 2026, U.S., Canadian, and Mexican airports must absorb a sustained spike for six weeks—essentially adding more than a midsummer Olympics’ worth of tourists on top of normal traffic.[8] Similarly, fans will face more intercity travel than in any past World Cup. For one instance, a Scottish fan’s itinerary might include flights from Boston to Miami, while airfares in mid-2026 are already 65% higher than 2025,[9] or train/bus transfers across states. This highlights a structural issue of movement, where dozens of flights and thousands of highway miles must operate smoothly, often on tight turnarounds between game days.
The security and public-safety demands are also extreme. The tournament will be a magnet for hooliganism, disinformation campaigns, and even terrorism. U.S. law-enforcement and intelligence agencies must collaborate not only across 11 cities and two national borders but with Mexican and Canadian counterparts. Cohosting requires aligning planning security and policies through three countries—a challenge for everyone from the Department of Homeland Security (DHS) and U.S. Customs and Border Protection (CBP) to local police and the Federal Emergency Management Agency (FEMA).[10]
Infrastructure and technology need to keep pace with scale. Many stadiums and transit hubs in the U.S. are several decades old. Several major projects—such as Los Angeles’s airport Automated People Mover and airport expansions currently under way or about to finish construction—all have to align without delays, while funding gaps continue to persist.[11] Even cybersecurity is an issue; state and local officials have warned that “this summer’s FIFA World Cup is at risk of being struck by a catastrophic event” if federal coordination and funding lag.[12] The sheer size of the 2026 event—three countries, 16 cities, 104 matches, millions of visitors—means that readiness is an all-hands, all-systems affair beyond any past U.S. sports event.
U.S. Hosting Capabilities
The U.S. host profile has strengths and weaknesses relative to previous World Cups. On the plus side, the U.S. has richer infrastructure and security resources than many hosts. It has dozens of large modern stadiums that can easily adapt to World Cup needs. For example, the Super Bowl routinely seats about 100,000 fans. Similarly, it has extensive highway networks and a high-tech border-security apparatus that is unmatched across previous editions. No host has had as many existing resources or as much transportation capacity to bear on a tournament. The U.S. also has deep federal law-enforcement agencies like the Federal Bureau of Investigation (FBI), U.S. Immigration and Customs Enforcement (ICE), DHS, and FEMA and local police forces to face any crime surges or security concerns experienced in previous editions. In principle, these capacities give the U.S. a slight advantage over Brazil 2014 or South Africa 2010, whose infrastructure was relatively limited, or Qatar 2022, which had to build most infrastructure from the ground to host the tournament.[13]
However, 2026 exacerbates the country’s structural challenges. Unlike a centralized Olympic host or even a single-nation World Cup, games will be geographically dispersed. A fan could land in Atlanta, catch a match, and two days later travel by air to Seattle for another match. While previous editions have had similar challenges, they have been on a much smaller scale. In fact, such long-haul domestic itineraries are unprecedented for modern World Cup editions. The U.S. transportation system was not originally designed or appropriately redesigned for such fan mobility. Hence, long-haul flights may be the only option, and airfares are projected to spike to face the upcoming demand.[14] This contrasts sharply with Germany 2006 and Japan/Korea 2002, where trains or short flights sufficed and distances were shorter. And although mega-events like the Olympics span weeks, they typically concentrate in one metro region with an “Olympic village.” In 2026, there is no single staging ground; instead, 11 U.S. metropolises must each manage its local crowds.
The Difference in Governance
In the U.S. federalist system, hundreds of agencies and governments share responsibility, which means that state and city governments will rely on their own budgets and first responders. Many host cities report “dedicated untold local resources” and worry about funding shortfalls.[15] By contrast, smaller hosts like South Africa or authoritarian countries like Qatar or Russia can mobilize a single chain of command without red tape.
Cohosting adds another layer not previously experienced: the federal governments of the U.S., Mexico, and Canada must align visa and security protocols that normally differ sharply. A fan who could be admitted to Canada because of visa agreements might not be able to enter the United States. For example, in 2018 Russia allowed any fan with a tournament “Fan ID” to enter visa-free;[16] in 2022 Qatar gave visa waivers via the Hayya card.[17] The U.S., however, still requires visitor visas for many of the world’s soccer fans, such as many African and Asian countries that must navigate multiyear consular backlogs.[18] The U.S.’s stricter visa regime is a significant friction unique to the American context, if we assume that the goal was to allow every fan who wanted to come to indeed visit. The depth of capacity in the U.S. comes with a hidden fragmentation because there is no single coordinator, and many localized systems that must interoperate have not previously done so on this scale.
Comparing the American experience with specific past tournaments highlights key contrasts (Table 1). Brazil 2014 expanded its fan visa waivers for the Cup and built new airports but still saw protests over high spending for the tournament. This is expected because many policymakers and economists see the World Cup as a sunk cost, where increased spending in stadiums and enhanced infrastructure to accommodate a higher demand will not be used after the tournament ends. Similarly, Russia 2018 spanned across one large country with federal funding. Qatar 2022 was the opposite: it was hosted on a tiny area and needed massive new infrastructure; a unified government handled every logistical challenge (Qatar even provided free public transit for the event). One exception is Germany 2006: due to its efficient rail network, it was able to mobilize fans in a relatively compact geography. The U.S. 1994 Cup operated on a smaller scale and was less globalized. Even then, it set attendance records, at 3.6 million total fans.[19]
By contrast, most previous U.S. mega-events have been far smaller.[20] The Super Bowl draws about 130 million TV viewers for a single game with one host city—a huge media event, but local stress is brief. Even a U.S.-hosted Olympics, like Los Angeles 1984 (or the upcoming Los Angeles 2028 Summer Olympics), focuses on one specific region. The World Cup’s multicity, multi-week format is thus one of a kind for the United States. It cannot simply import a Super Bowl or an Olympics playbook. Instead, it must contend with multinational diplomacy, where fans will complain to embassies about visas or safety, intercity transit networks, and staggered security plans in dozens of jurisdictions—challenges only hinted at by previous events. And all on top of current and usual usage, which already spikes during the summer.
TABLE 1
Size of the U.S. World Cup Compared with Other Mega-Events
| Event | Category | Geog. | Start Date | End Date | Duration (days) | Competition Units | Unit Type | Host Cities | Venues | Partici-pants | Partic-ipant Type | In-Person Attend./ Tickets | Avg. Attend. per Day | Avg. Attend. per Unit | U.S. World Cup Attend. = 1.0x |
| 2026 FIFA World Cup (United States share) | Football mega-event | U.S. | 6/12/26 | 7/19/26 | 38 | 78 | Matches | 11 | 11 | 48 | Teams in tournament field | 4,875,000 | 128,289 | 62,500 | 1.0x |
| 2026 FIFA World Cup (entire tournament) | Football mega-event | U.S./ Canada/ Mexico | 6/11/26 | 7/19/26 | 39 | 104 | Matches | 16 | 16 | 48 | Teams | 6,500,000 | 166,667 | 62,500 | 1.3x |
| Paris 2024 Olympic Games | Olympics | France | 7/24/24 | 8/11/24 | 19 | 754 | Competition sessions | 35 | 10,500 | Athletes | 9,500,000 | 500,000 | 12,599 | 1.9x | |
| LA28 Olympic Games | Olympics | U.S. | 7/14/28 | 7/30/28 | 17 | 800 | Competition events (800+) | 40 | 15,000 | Athletes (15,000+) | 0 | 0 | 0.0x | ||
| 1994 FIFA World Cup (USA) | Football mega-event | U.S. | 6/17/94 | 7/17/94 | 31 | 52 | Matches | 9 | 9 | 3,587,538 | 115,727 | 68,991 | 0.7x | ||
| 2025 FIFA Club World Cup (USA) | Football mega-event | U.S. | 6/14/25 | 7/13/25 | 30 | 63 | Matches | 11 | 12 | 32 | Clubs | 2,500,000 | 83,333 | 39,683 | 0.5x |
| Super Bowl LX | Single-site mega-event | U.S. | 2/8/26 | 2/8/26 | 1 | 1 | Game | 1 | 1 | 2 | Teams | 70,823 | 70,823 | 70,823 | 0.0x |
High Stakes: Reputation, Diplomacy, Finance, Politics
The stakes of hosting are enormous. Internationally, the U.S. is under a global spotlight. A smooth, festive World Cup could burnish America’s image as a welcoming host and an ally—which it might need, considering the recent developments on immigration and international affairs. Conversely, visible failures—visa nightmares, transit meltdowns, and security incidents—would quickly become propaganda fodder and sore points in diplomatic relations. Getting the World Cup right projects soft power and can boost future tourism; getting it wrong could deter foreign travel or anger partner countries.
Diplomatically, the U.S. must worry especially about fans from emerging and non-Western markets. If passionate fans from Africa, Asia, or Latin America are delayed at U.S. consulates or turned away for visa technicalities, it will not go unnoticed by their governments. In past Cups, visa issues have even caused political tensions, like the mass asylum claims after Brazil 2014.[21] Avoiding such flashpoints is crucial, as is preparing the U.S. immigration system not to be used as a gateway for overstays and refugee claims. Hosting under its own flag also means that the U.S. embassy network and border agencies will be judged. Critically, FIFA itself will be monitoring guest lists and perceptions; any misstep could trigger international criticism.
The fiscal and budgetary stakes are also high. Congress has allocated substantial aid for World Cup preparations: for example, FEMA created a $625 million “World Cup Grant Program” to fund security, cyber, and training.[22] However, jurisdictions have reported that these funds have not yet been distributed. States and cities are investing their own funds as well, such as Massachusetts’s $7.8 million investment in security costs for Foxborough’s Gillette Stadium. Because of the recent government shutdown and related funding cuts in recent homeland-security grant programs, localities may feel strapped and anxious. Even the smallest host city, Kansas City, is expecting more than 650,000 visitors.[23] Any major incident or shortfall could trigger financial aftershocks.
On the political front, the timing magnifies pressure. The U.S. hosts the Cup in an election year, 2026 midterms, and amid other major events, the U.S. Open, the 250th birthday of the U.S. and the Declaration of Independence, the 400th anniversary of New York City, and political conventions that typically occur in the summer. Hence, governors, mayors, and federal politicians will want to claim credit for success or distance themselves from failure. Local officials have already publicly pleaded for federal support and deadlines in House hearings,[24] signaling that this will be a contentious issue. In a crowded domestic news cycle, the World Cup will battle for attention with elections, legislative battles on immigration or funding, and even other sporting events such as the NBA finals. A negative World Cup headline could become a huge political liability.
The Immigration Bottleneck
The U.S.’s core immigration risk for the 2026 FIFA World Cup is not that large numbers of fans will be legally inadmissible; it is that a comparatively small but atmospherically and symbolically important slice of supporters will be practically unable to come because the U.S. visitor-visa pipeline is still friction-prone where demand is most concentrated: appointment scarcity and volatility at specific consular posts, uneven staffing and throughput across the global network, and limited policy flexibility for moving applicants around the system.
With the tournament spanning June 11 to July 19, 2026, and expanded to 48 teams and 104 matches across 16 host cities, the demand is both larger and more time-bound than previous tournaments—conditions that amplify queue problems even when the U.S. can admit (and has historically admitted) millions of visitors overall.[25]
Two structural facts frame the analysis (Table 2). First, much of the inbound fan base will face little formal immigration friction because they will be visa-exempt: Canadian citizens generally do not require a nonimmigrant visa for most tourist travel to the U.S., and Visa Waiver Program (VWP) nationals can travel for up to 90 days for business/ tourism purposes if they meet requirements and obtain an Electronic System for Travel Authorization (ESTA). ESTA is relatively quick to obtain (which, in most cases, is even approved immediately) and inexpensive, costing $40.27.[26] Second, the tournament’s “supporter core”—fans from football-intense countries in Latin America, parts of Africa, and segments of Asia—overlaps meaningfully with countries that require B-1/B-2 visitor visas and, in some cases, face long wait times or high refusal rates. That overlap is where readiness is most fragile and where mitigation before kickoff is still possible.[27]
TABLE 2
Countries That Have Qualified for the World Cup with Visa Requirements
| Country | Visa Requirement | No. of World Cup Qualifications (incl. 2026) |
| Algeria | B-1/B-2 | 5 |
| Argentina | B-1/B-2 | 19 |
| Australia | ESTA | 7 |
| Austria | ESTA | 8 |
| Belgium | ESTA | 15 |
| Brazil | B-1/B-2 | 23 |
| Canada | Other | 3 |
| Cape Verde | B-1/B-2 | 1 |
| Colombia | B-1/B-2 | 7 |
| Costa Rica | B-1/B-2 | 6 |
| Croatia | ESTA | 7 |
| Curaçao | B-1/B-2 | 1 |
| Ecuador | B-1/B-2 | 5 |
| Egypt | B-1/B-2 | 4 |
| England | ESTA | 17 |
| France | ESTA | 17 |
| Germany | ESTA | 21 |
| Ghana | B-1/B-2 | 5 |
| Iran | B-1/B-2 | 7 |
| Ivory Coast | B-1/B-2 | 4 |
| Japan | ESTA | 8 |
| Jordan | B-1/B-2 | 1 |
| Mexico | B-1/B-2 | 18 |
| Morocco | B-1/B-2 | 7 |
| Netherlands | ESTA | 12 |
| New Zealand | ESTA | 3 |
| Norway | ESTA | 4 |
| Panama | B-1/B-2 | 2 |
| Paraguay | B-1/B-2 | 9 |
| Portugal | ESTA | 9 |
| Qatar | B-1/B-2 | 2 |
| Saudi Arabia | B-1/B-2 | 7 |
| Scotland | ESTA | 9 |
| Senegal | B-1/B-2 | 4 |
| South Africa | B-1/B-2 | 4 |
| South Korea | ESTA | 12 |
| Spain | ESTA | 17 |
| Switzerland | ESTA | 13 |
| Tunisia | B-1/B-2 | 7 |
| Uruguay | B-1/B-2 | 15 |
| Uzbekistan | B-1/B-2 | 1 |
| Legend | ||
| ESTA | Visa Waiver – no visa required to enter the US | |
| B-1/B-2 | Standard tourist/business visa required | |
| Other | Special entry category (e.g. Canada – eTA system) | |
The U.S. State Department’s consular system is enormous: in FY2024, it processed about 14.25 million nonimmigrant visa (NIV) applications and issued about 10.97 million NIVs, with B-1/B-2 (combined) accounting for 9.0 million applications and 6.5 million issuances. To address this, the U.S. has introduced a World Cup–linked mitigation tool—FIFA PASS (priority visa interview appointments for ticket holders)—but, at the time of writing, publicly available information does not yet demonstrate that it can resolve the problem “at scale” in the most constrained posts, nor does it address key structural constraints, as, for example, how many interview slots posts can actually add.[28]
Who Faces Visa Friction
A useful way to map the immigration entrance is to distinguish between fans who are largely insulated from consular bottlenecks and fans for whom the bottleneck is binding even if they are legally eligible to enter.
Visa-exempt or low-friction categories. Canadian citizens traveling for ordinary tourism generally do not need a nonimmigrant visa, though Canadian permanent residents do require a visa, as they are noncitizens and thus have other applicable immigration enforcement conditions into the United States. For ticket demand purposes, this matters in two directions: Canada is a major potential source of cross-border spectators, but some Canada-based travelers (permanent residents) will still be in the visa-requiring pool.[29] VWP nationals—covering many major European football nations and other high-income partners—can travel without a visa for up to 90 days for business/tourism if they meet program requirements and obtain ESTA. The publicly listed VWP participants include, among many others, Germany, France, Spain, the United Kingdom, Japan, South Korea, and Australia—countries that tend to be well represented among international ticket purchasers at recent tournaments (Table 3).[30]
TABLE 3
Top Soccer Nations and Visa Hurdles
| Country | Visitors to U.S. (2025) | U.S. Visa Requirement | Average Visa Wait Time | Refusal Rate |
| Netherlands | 572,389 | Visa Free (ESTA) | 0–72 hours | < 3% |
| Spain | 910,525 | Visa Free (ESTA) | 0–72 hours | < 3% |
| UK | 4,058,124 | Visa Free (ESTA) | 0–72 hours | < 3% |
| France | 1,589,676 | Visa Free (ESTA) | 0–72 hours | < 3% |
| Japan | 1,967,298 | Visa Free (ESTA) | 0–72 hours | < 3% |
| South Korea | 1,647,142 | Visa Free (ESTA) | 0–72 hours | < 3% |
| Germany | 1,770,112 | Visa Free (ESTA) | 0–72 hours | < 3% |
| Morocco | 40,359 | Visa Required (B-1/B-2) | 2–3 months | 14.45% |
| Mexico | 17,980,030 | Visa Required (B-1/B-2) | 4–10 months | 13.87% |
| Colombia | 1,119,998 | Visa Required (B-1/B-2) | 10–14 months | 24.70% |
| Brazil | 1,916,565 | Visa Required (B-1/B-2) | 1–3 months | 15.48% |
| Argentina | 789,942 | Visa Required (B-1/B-2) | 2–3 months | 8.90% |
However, even “visa-free” travel can contain small pockets of friction. VWP has exclusion rules for certain travelers—for example, rules based on travel to specific countries or certain dual-national situations, meaning that a subset of VWP-country nationals may still need a visa.[31] And ESTA itself is not an admission guarantee: CBP states that an approved ESTA “does not determine admissibility” and that CBP officers determine admissibility at the port of entry.[32] These issues are real but likely second-order, compared with B-visa appointment constraints.
The B-1/B-2 required slice that drives the bottleneck risk. The most consequential visa-friction category for 2026 is fans who must obtain (or renew) a B-1/B-2 visitor visa and whose demand is concentrated in posts with long or volatile wait times (Table 4). This is the category where the U.S. can—and is willing to—admit millions and is compatible with tens (or hundreds) of thousands of high-intent supporters who struggle to come.
TABLE 4
B-1/B-2 Visa Issuances by Country
| Country | FY 2019 B-1/B-2 issuances | FY 2024 B-1/B-2 issuances | Change 2019-2024 | FY 2025 B-1/B-2 issuances | Change 2019-2025 | Change 2024-2025 |
| Brazil | 559,019 | 1,114,612 | 555,593 | 875,516 | 316,497 | –239,096 |
| Colombia | 191,545 | 437,463 | 245,918 | 550,267 | 358,722 | 112,804 |
| Argentina | 212,011 | 272,762 | 60,751 | 267,601 | 55,590 | –5,161 |
| Ecuador | 171,952 | 228,250 | 56,298 | 181,166 | 9,214 | –47,084 |
| Egypt | 54,255 | 66,620 | 12,365 | 36,256 | –17,999 | –30,364 |
| Saudi Arabia | 58,802 | 54,151 | –4,651 | 48,273 | –10,529 | –5,878 |
| South Africa | 46,540 | 45,638 | –902 | 33,531 | –13,009 | –12,107 |
| Morocco | 14,764 | 30,677 | 15,913 | 25,708 | 10,944 | –4,969 |
| Panama | 29,731 | 28,584 | –1,147 | 46,374 | 16,643 | 17,790 |
| Uruguay | 21,960 | 28,100 | 6,140 | 21,691 | –269 | –6,409 |
| Jordan | 22,188 | 28,068 | 5,880 | 19,922 | –2,266 | –8,146 |
| Ghana | 16,098 | 21,937 | 5,839 | 14,596 | –1,502 | –7,341 |
| Algeria | 13,528 | 19,732 | 6,204 | 16,750 | 3,222 | –2,982 |
| Mexico | 12,814 | 18,310 | 5,496 | 16,965 | 4,151 | –1,345 |
| Paraguay | 10,759 | 12,793 | 2,034 | 11,617 | 858 | –1,176 |
| Iran | 1,015 | 12,473 | 11,458 | 6,837 | 5,822 | –5,636 |
| Cote d'Ivoire | 6,157 | 7,752 | 1,595 | 6,712 | 555 | –1,040 |
| Uzbekistan | 6,060 | 7,752 | 1,692 | 8,132 | 2,072 | 380 |
| Haiti | 19,915 | 6,747 | –13,168 | 5,257 | -14,658 | –1,490 |
| Tunisia | 5,642 | 6,653 | 1,011 | 10,299 | 4,657 | 3,646 |
| Qatar | 5,446 | 6,148 | 702 | 1,888 | –3,558 | –4,260 |
| Senegal | 5,438 | 5,369 | –69 | 4,261 | –1,177 | –1,108 |
| Cabo Verde | 1,527 | 3,537 | 2,010 | 2,768 | 1,241 | –769 |
Source: FY2025 totals are aggregated from the U.S. Department of State monthly nationality-by-visa-class Excel files for October 2024 through September 2025
Evidence from previous World Cups suggests that the overlap is not hypothetical. For Russia 2018, FIFA reported that international demand accounted for 54% of ticket allocations and listed top foreign ticket allocation countries: the U.S., Brazil, Colombia, Germany, Mexico, Argentina, Peru, China, Australia, and England, among others. Several of those recurring fan markets, such as Brazil, Colombia, Mexico, Argentina, Peru, and China, are not VWP participants and thus generally require B visas for travel to the United States.[33] For Qatar 2022, FIFA’s reported top ticket purchasers included Qatar, the U.S., England, Saudi Arabia, Mexico, the UAE, France, Argentina, Brazil, and Germany—again combining VWP and non-VWP markets.[34]
Diaspora-driven demand can be larger than ticket-by-country data imply. The geographical location of ticket purchasers is an imperfect proxy for visa demand because some tickets purchased by U.S. residents, including diaspora communities, can still generate visa demand if relatives or friends travel to join them. This matters most for countries with large U.S.-based communities and strong football cultures—especially in Latin America—because the supporter travel signal may not be fully captured by initial ticket allocation or purchaser-residence statistics. Planning based solely on FIFA ticket-residence data risks underestimating visa needs in a handful of posts.[35]
How Binding Is the Consular Bottleneck?
Scale is not the problem; concentrated throughput is. In FY2024, the State Department’s worldwide NIV workload shows B-1/B-2 as the dominant category. There are about 8.995 million B-1/B-2 applications out of roughly 14.246 million total NIV applications (~63%) and about 6.498 million B-1/B-2 issuances out of roughly 10.970 million total NIV issuances (~59%).
Put differently, the U.S. already runs a huge global visitor visa factory. A World Cup demand surge of even a few hundred thousand additional applications would look modest in percentage terms. However, percentage framing can be misleading because the constraint is the number of interview slots in a handful of oversubscribed posts, during a narrow pre-tournament window.
Why “next available appointment” and “average wait time” tell different stories. The State Department’s Global Visa Wait Times dashboard distinguishes between “next available appointment” and “average wait time” for B-1/B-2 interviews. The department notes that the “next available appointment” reflects the soonest interview date, while the “average wait time” is based on actual wait times experienced by applicants in the previous month. It also flags that “average wait time” is displayed only for B visas at posts where the next available appointment exceeds three months.[36]
This distinction matters in at least three ways:
- A post can show a short “next available” while the “average wait time” remains high—consistent with a system where some new slots open intermittently, but the backlog experienced by most applicants remains long. Mexico City, for example, showed an average B-1/B-2 wait of 6.5 months but a next available appointment of 2.5 months in February 2026.[37]
- The reverse can also happen. Ciudad Juárez, Mexico, showed an average of five months but “next available” of 14.5 months—suggesting that the future queue had worsened even if last month’s completed cohort waited less time.[38]
- Fans who made decisions in the World Cup year (late 2025–spring 2026), especially first-time travelers, may have interpreted “next available” as a reliable planning signal; yet the State Department cautions that wait times are “estimates” that “var[y] from week to week based on workload and staffing” and do not guarantee that an applicant will be interviewed on a specific day.[39]
Administrative processing and post-interview uncertainty compound the time risk. Even if an applicant obtains an interview, the timeline for a finalized visa can be uncertain for cases requiring additional checks. The State Department explicitly warns that cases may be “required to undergo additional administrative processing” and that processing time varies based on individual circumstances; it even advises waiting “at least 180 days” before inquiring about a case under administrative processing.[40] For a tournament where many fans need to finalize flights and lodging months in advance, post-interview uncertainty is itself a deterrent—even when the applicant is ultimately issued a visa.
Many fans could be left out of the immigration process if they do not process their visas quickly enough. In an online Table 5, and also illustrated in Figure 1, I assume two estimates for immigration to the U.S. for the World Cup: a conservative estimate of 12%; and a higher estimate of 24%. I assume these estimates believing that, on the conservative end, immigration would look similar to the previous year. This is because the World Cup takes place for approximately 12% of the year. Therefore, it overlaps with approximately 12% of immigration in a year. On the higher end of 24% of a year’s immigration in time, I assume that the World Cup would drive immigration up for two reasons: the event occurs during the summer, which usually experiences higher amounts of immigration; and the World Cup event will drive immigration up because of its popularity. Finally, I assume three scenarios in which 25%, 50%, or 75% of visitors will need a new B-1/B-2 visa to enter the U.S., accounting for renewals as well as first-time applicants.
TABLE 5
“Fans Left Out” Model
| Base scenario stress test | |||||||||||||||||
| Country | 2025 Annual Visitors | WC Share Assumption | Potential WC Visitors | New Visa Share Assumption | Estimated New Visa Demand | FY2024 B1/B2 Issued | Avg Monthly Issuance | 1-Month Capacity | 3-Month Capacity | 6-Month Capacity | Months of Throughput Needed | Demand/ 1-Month Capacity | Demand/ 3-Month Capacity | Demand/ 6-Month Capacity | Risk Tier | ||
| Brazil | 1,916,565.0 | 10.0% | 191,656.5 | 50.0% | 95,828.3 | 1,636,389.0 | 136,365.8 | 136,365.8 | 409,097.3 | 818,194.5 | 0.7x | 70.3% | 23.4% | 11.7% | Lower | ||
| Argentina | 789,942.0 | 10.0% | 78,994.2 | 50.0% | 39,497.1 | 195,321.0 | 16,276.8 | 16,276.8 | 48,830.3 | 97,660.5 | 2.4x | 242.7% | 80.9% | 40.4% | High | ||
| Colombia | 1,119,998.0 | 10.0% | 111,999.8 | 50.0% | 55,999.9 | 442,291.0 | 36,857.6 | 36,857.6 | 110,572.8 | 221,145.5 | 1.5x | 151.9% | 50.6% | 25.3% | Moderate | ||
| Ecuador | 458,799.0 | 10.0% | 45,879.9 | 50.0% | 22,940.0 | 89,332.0 | 7,444.3 | 7,444.3 | 22,333.0 | 44,666.0 | 3.1x | 308.2% | 102.7% | 51.4% | High | ||
| Paraguay | 29,625.0 | 10.0% | 2,962.5 | 50.0% | 1,481.3 | 12,721.0 | 1,060.1 | 1,060.1 | 3,180.3 | 6,360.5 | 1.4x | 139.7% | 46.6% | 23.3% | Moderate | ||
| Uruguay | 67,995.0 | 10.0% | 6,799.5 | 50.0% | 3,399.8 | 24,870.0 | 2,072.5 | 2,072.5 | 6,217.5 | 12,435.0 | 1.6x | 164.0% | 54.7% | 27.3% | Moderate | ||
| Morocco | 40,359.0 | 10.0% | 4,035.9 | 50.0% | 2,018.0 | 33,509.0 | 2,792.4 | 2,792.4 | 8,377.3 | 16,754.5 | 0.7x | 72.3% | 24.1% | 12.0% | Lower | ||
| Egypt | 68,908.0 | 10.0% | 6,890.8 | 50.0% | 3,445.4 | 58,547.0 | 4,878.9 | 4,878.9 | 14,636.8 | 29,273.5 | 0.7x | 70.6% | 23.5% | 11.8% | Lower | ||
| Ghana | 40,045.0 | 10.0% | 4,004.5 | 50.0% | 2,002.3 | 21,904.0 | 1,825.3 | 1,825.3 | 5,476.0 | 10,952.0 | 1.1x | 109.7% | 36.6% | 18.3% | Moderate | ||
| Senegal | 8,956.0 | 10.0% | 895.6 | 50.0% | 447.8 | 8,128.0 | 677.3 | 677.3 | 2,032.0 | 4,064.0 | 0.7x | 66.1% | 22.0% | 11.0% | Lower | ||
| Algeria | 19,364.0 | 10.0% | 1,936.4 | 50.0% | 968.2 | 6,311.0 | 525.9 | 525.9 | 1,577.8 | 3,155.5 | 1.8x | 184.1% | 61.4% | 30.7% | Moderate | ||
| Tunisia | 13,671.0 | 10.0% | 1,367.1 | 50.0% | 683.6 | 4,632.0 | 386.0 | 386.0 | 1,158.0 | 2,316.0 | 1.8x | 177.1% | 59.0% | 29.5% | Moderate | ||
| Ivory Coast | - | 10.0% | - | 50.0% | - | - | - | - | - | - | - | - | - | - | - | ||
| South Africa | 108,707.0 | 10.0% | 10,870.7 | 50.0% | 5,435.4 | 49,087.0 | 4,090.6 | 4,090.6 | 12,271.8 | 24,543.5 | 1.3x | 132.9% | 44.3% | 22.1% | Moderate | ||
| Jordan | 30,720.0 | 10.0% | 3,072.0 | 50.0% | 1,536.0 | 15,444.0 | 1,287.0 | 1,287.0 | 3,861.0 | 7,722.0 | 1.2x | 119.3% | 39.8% | 19.9% | Moderate | ||
| Uzbekistan | 10,369.0 | 10.0% | 1,036.9 | 50.0% | 518.5 | 9,593.0 | 799.4 | 799.4 | 2,398.3 | 4,796.5 | 0.6x | 64.9% | 21.6% | 10.8% | Lower | ||
| Panama | 181,524.0 | 10.0% | 18,152.4 | 50.0% | 9,076.2 | 47,851.0 | 3,987.6 | 3,987.6 | 11,962.8 | 23,925.5 | 2.3x | 227.6% | 75.9% | 37.9% | High | ||
| Costa Rica | 382,382.0 | 10.0% | 38,238.2 | 50.0% | 19,119.1 | 38,982.0 | 3,248.5 | 3,248.5 | 9,745.5 | 19,491.0 | 5.9x | 588.6% | 196.2% | 98.1% | High | ||
| Curacao | 12,607.0 | 10.0% | 1,260.7 | 50.0% | 630.4 | 1,428.0 | 119.0 | 119.0 | 357.0 | 714.0 | 5.3x | 529.7% | 176.6% | 88.3% | High | ||
| Total / average | 5300536 | 10.0% | 530053.6 | 50.0% | 265026.8 | 2696340 | 224695 | 224695 | 674085 | 1348170 | — | ||||||
Source: Visitors, FY2024 NIV.
The model is designed as a visa-capacity stress test, not as a precise forecast of World Cup attendance or a literal estimate of how many fans will be unable to travel. Its purpose is to estimate whether a World Cup–driven increase in visitor demand from selected countries could place meaningful pressure on existing U.S. B-1/B-2 visa issuance patterns. The model focuses on countries whose nationals generally require a B-1/B-2 visa for short-term travel to the U.S. and compares plausible event-related demand against recent historical issuance levels.
The model begins with each country’s 2025 annual visitor volume to the U.S., drawn from the I-94 Arrivals Program. This annual travel base is used as a proxy for the size of the underlying traveler population with demonstrated demand for U.S. travel. Because there is no single authoritative estimate of how many travelers from each country would seek to visit the U.S. specifically for the World Cup, the model applies a scenario-based assumption for the share of annual visitors who may be World Cup–driven. Rather than selecting one fixed estimate, the analysis uses three scenarios: 5%, 10%, and 15% of annual visitors. These values should be read as illustrative demand cases, ranging from a lower-bound to a higher-pressure scenario.
The next step is to distinguish between travelers who could attend the World Cup in principle and those who would likely need a new B-1/B-2 visa issuance to do so. Not every potential visitor would require a new visa appointment: some travelers may already hold a valid multiyear visa, some may qualify under different circumstances, and some may not need to apply anew before the tournament. To address this uncertainty, the model applies a second assumption: the share of potential World Cup visitors likely to need a new visa issuance. This assumption is varied at 25%, 50%, and 75%. Multiplying the World Cup visitor estimate by this share produces the model’s key demand variable: estimated new visa demand.
That estimated demand is then compared with a baseline measure of recent consular output. The model uses FY2024 B-1/B-2 visa issuances by country as the historical reference point and converts annual visa issuances into an average monthly throughput by dividing by 12 (months). This monthly average is not treated as a direct measure of spare capacity, nor does it imply that consulates can automatically absorb equivalent additional demand. Instead, it functions as a transparent benchmark for recent observed processing scale. To make the analysis more realistic, the model compares estimated new visa demand not only with a one-month issuance baseline but also with three- and six-month baseline windows. This reflects the fact that World Cup–related applicants would likely apply over a period of months rather than all at once.
The output is therefore framed in terms of capacity pressure, not certainty of exclusion. The most important indicators are estimated new visa demand, demand as a share of one-month and three-month baseline capacity, and the months of FY2024 throughput needed to absorb the modeled demand. These measures show whether a country’s modeled World Cup–related visa demand would be modest relative to recent issuance patterns or whether it would amount to several months of normal throughput.
The model also assigns countries to broad risk tiers based on the relationship between estimated new visa demand and three-month baseline capacity. These tiers are intended to identify where additional planning may be warranted, not to predict exact operational outcomes. Countries with large absolute demand and high demand-to-capacity ratios may present the greatest need for advance staffing, interview capacity expansion, scheduling flexibility, or other surge measures. By contrast, countries with high ratios but very small absolute numbers may be analytically interesting without representing the same operational importance.
Several limitations should be kept in mind. First, annual arrivals are an imperfect proxy for World Cup travel propensity. Event-driven demand depends on factors such as team qualification, airfare, fan culture, income, and match location, none of which are modeled directly here. Second, historical visa issuances are not the same thing as available future capacity; consular operations can change, and the government may adopt surge measures before the tournament. Third, the analysis does not directly observe the share of likely attendees who already possess valid visas. That is why the model presents several assumptions rather than a single point estimate. Finally, the analysis does not attempt to estimate refusal rates, wait-time dynamics, or country-specific renewal policies, all of which could affect realized outcomes.
For these reasons, the model should be read as an illustrative planning tool. Its value lies in identifying where World Cup–related travel demand could plausibly be large relative to recent visa issuance patterns, thereby highlighting where proactive consular planning may be most important. Properly interpreted, it does not claim to forecast exact fan numbers or exact shortfalls.
General expedited-appointment policy is not designed for mass event tourism. The State Department’s general guidance on expedited appointments emphasizes urgent, unforeseen travel and explicitly states that expedited consideration is not available for last-minute tourism.[41] This is one reason World Cup–specific mechanisms matter: absent from a bespoke system, many genuine fans would be routed into a standard expedite framework that is not built to handle event-driven surges at scale.
Policy and operational constraints narrowed in late 2025. Three late-2025 policy choices, while defensible for integrity and workload management, have the side effect of making the World Cup bottleneck more binding unless offset by staffing or targeted capacity.
First, the department’s September 18, 2025, interview-waiver update (effective October 1, 2025) narrowed interview waivers. According to the update, “all nonimmigrant visa applicants … will generally require an in-person interview” except specified categories, including (notably) B-1/B-2 renewals only within 12 months of prior visa expiration and subject to additional eligibility criteria.[42] This helps returning travelers renew without consuming interview slots—a positive—but does little for first-time fans and can increase interview load compared with broader waiver policies.
Second, in December 2025, the State Department publicly advised that applicants “should” schedule interviews in their country of nationality or residence and warned that those applying outside their home country “may have more difficulty” obtaining an appointment and “should expect to wait significantly longer.”[43] This guidance reduces “visa shopping” across borders to find faster appointments. For a time-bound mega-event, that constraint shifts pressure back onto already-overloaded posts—precisely where many high-demand supporter markets sit.
A third late-2025/early-2026 constraint is the new visa-bond regime for certain B-1/B-2 travelers. In an August 5, 2025, temporary final rule, effective August 20, 2025, through August 5, 2026, the department launched a 12-month “Visa Bond Pilot Program” under which consular officers may require covered B-1/B-2 applicants to post a bond of up to $15,000 as a condition of visa issuance. The program applies to nationals of countries that the department identifies based on high B-1/B-2 overstay rates, deficient screening and vetting information, or citizenship-by-investment concerns. By March 18, 2026, the Department of State’s public guidance had listed a broad set of covered countries and specified that affected applicants, if otherwise eligible, may be required to post a bond of $5,000, $10,000, or $15,000; submit Form I-352; and comply with additional travel conditions. Those conditions include the use of designated ports of entry only—currently commercial airports, including preclearance locations—with no use of land, sea, charter, or general-aviation entry points. A bond does not guarantee visa issuance, and even when ultimately refundable upon compliant departure, it introduces a major up-front liquidity hurdle and another layer of administrative friction for exactly the kind of short-notice, price-sensitive, first-time travelers a World Cup draws.
Among countries currently qualified for the 2026 World Cup, five—Algeria, Cabo Verde, Côte d’Ivoire, Senegal, and Tunisia—are presently on the State Department’s visa-bond list; for applicants from those countries, the bond is not fixed by nationality but set case-by-case at $5,000, $10,000, or $15,000.
Priority Consulates and Chokepoints
A credible readiness assessment has to name posts—not just countries—and use objective indicators such as wait time, volatility, and refusal risk. The February 2026 global wait-time data already point to a handful of posts where the timeline is misaligned with the tournament calendar.
A first-cut post priority list based on “time to kickoff” math. As of mid-February 2026, any post with a “next available” B-1/B-2 appointment beyond roughly four months is, on its face, beyond the planning horizon for fans who have not already begun the process. Examples include:
- Bogotá (Colombia): 10 months average; 11.5 months next available.[44]
- Lima (Peru): 7.5 months average; 8 months next available.[45]
- Santo Domingo (Dominican Republic): 5.5 months average; 16 months next available.[46]
- San José (Costa Rica): 5 months average; 13 months next available.[47]
- Guadalajara (Mexico): 8.5 months average; 7.5 months next available.[48]
- Ciudad Juárez (Mexico): 5 months average; 14.5 months next available.[49]
- Dhaka (Bangladesh): 7.5 months average; 8.5 months next available.[50]
- Dubai (UAE): 1.5 months average; 12 months next available.[51]
Not all these markets are top supporter exporters, but the list illustrates the governing logic: the U.S. risk of a bottleneck is not a nationwide inability to process B visas; it is a small set of posts where the clock has already outrun the queue.[52]
Why Latin America and the Caribbean dominate the risk picture. Latin America is likely to be the most consequential region for visa friction for three reasons: FIFA’s top ticket purchaser lists for recent World Cups repeatedly include Mexico, Brazil, Argentina, and other Latin markets.[53] Mexico, Brazil, Argentina, Colombia, Peru, and many Caribbean countries are not Visa Waiver Program (VWP) participants and thus generally rely on B-1/B-2 for tourist travel to the United States;[54] and within Mexico alone, wait-time conditions vary sharply by post, and some of the largest consulates show multi-month, or longer, backlogs.[55]
Even where appointments exist, high refusal rates can function as an additional access barrier because fans cannot plan with confidence until a visa is issued, even though most fans are required to have purchased a ticket before the appointment. The State Department’s adjusted refusal-rate tables for B visas show wide cross-national variation. In FY2025, for example, Mexico’s adjusted B-visa refusal rate is listed at 21.36%; Colombia, 32.84%; Dominican Republic, 36.40%; Nigeria, 57.00%; Ghana, 64.34%; Senegal, 73.96%; and Cameroon, 60.55%.[56] State’s methodology materials emphasize that a visa refusal is a formal denial under U.S. immigration law and that refusal metrics are constructed under VWP guidelines.[57]
Recent host countries treated fan entry as an event operations problem, not solely a normal consular workload problem. Russia 2018 used the FAN ID as a functional entry facilitator. FIFA described FAN IDs as required alongside match tickets and providing visa-free entry to Russia and travel benefits.[58] Qatar 2022 used the digital Hayya card as an event-linked entry mechanism; FIFA reminded ticket holders that all local and international fans had to apply for a digital Hayya card, described as an “entry permit” to Qatar and also stadium access, which must have been accompanied with a match ticket.[59]
The U.S. did not, and realistically cannot, under current immigration law, replicate a “Fan ID equals visa” model. Its emerging approach—FIFA PASS—appears closer to queue prioritization for ticket holders than to visa facilitation. That can still be useful but also means that the U.S. has less structural slack: it must solve the problem by quickly reallocating or expanding interview capacity at the right posts.[60]
Infrastructure and Organizational Readiness
The U.S. will not fail at the 2026 World Cup because it lacks stadiums; it will fail—if it fails—because it is attempting to run a mega-event across 11 U.S. host metros using infrastructure that is “good enough” on paper but already strained in practice, while governance authority is fragmented across dozens of agencies that do not naturally operate as a single enterprise. Aggregate national capacity such as airports, hotels, emergency services, and communications can coexist with acute event-time fragility at the interfaces that make the tournament function: airport throughput, rail/bus transfer points, last-mile stadium access, pedestrian queuing and screening, and multiagency command-and-control.
The U.S. began 2026 with infrastructure advantages that many previous World Cup hosts had to build, or improvise, at great cost. FIFA’s own 2018 bid evaluation concluded that the U.S. bid benefited from existing infrastructure—stadiums, accommodation, and transport—generally meeting or exceeding requirements with smaller measures remaining (Table 6).[61] That baseline advantage is real: the tournament is spread across mature metro regions with large airports, deep hotel markets, and extensive event-management experience.
TABLE 6
U.S. Metro Regions and Stadium Capacity
| Host city | State/ Region | Current stadium name | FIFA tournament name | Stadium municipality | Attendance capacity (FIFA) | City population (2024) | Source year | Capacity ÷ population | Notes |
| Atlanta | GA | Mercedes-Benz Stadium | Atlanta Stadium | Atlanta, GA | 67,382 | 520,070 | 2024 | 13.00% | Stadium is within host city. |
| Boston | MA | Gillette Stadium | Boston Stadium | Foxborough, MA | 63,815 | 673,458 | 2024 | 9.50% | Host city is Boston; stadium is in Foxborough. |
| Dallas | TX | AT&T Stadium | Dallas Stadium | Arlington, TX | 70,122 | 1,326,087 | 2024 | 5.30% | Host city is Dallas; stadium is in Arlington. |
| Houston | TX | NRG Stadium | Houston Stadium | Houston, TX | 68,311 | 2,390,125 | 2024 | 2.90% | Stadium is within host city. |
| Kansas City | MO | GEHA Field at Arrowhead Stadium | Kansas City Stadium | Kansas City, MO | 67,513 | 516,032 | 2024 | 13.10% | Stadium is within host city. |
| Los Angeles | CA | SoFi Stadium | Los Angeles Stadium | Inglewood, CA | 69,650 | 3,878,704 | 2024 | 1.80% | Host city is Los Angeles; stadium is in Inglewood. |
| Miami | FL | Hard Rock Stadium | Miami Stadium | Miami Gardens, FL | 64,091 | 487,014 | 2024 | 13.20% | Host city is Miami; stadium is in Miami Gardens. |
| New York/ New Jersey | NY/NJ | MetLife Stadium | New York New Jersey Stadium | East Rutherford, NJ | 78,576 | 8,478,072 | 2024 | 0.90% | Host branding is regional; city population shown is New York City. |
| Philadelphia | PA | Lincoln Financial Field | Philadelphia Stadium | Philadelphia, PA | 65,827 | 1,573,916 | 2024 | 4.20% | Stadium is within host city. |
| San Francisco Bay Area | CA | Levi's Stadium | San Francisco Bay Area Stadium | Santa Clara, CA | 69,391 | 827,526 | 2024 | 8.40% | Host branding is regional; city population shown is San Francisco. |
| Seattle | WA | Lumen Field | Seattle Stadium | Seattle, WA | 65,123 | 780,995 | 2024 | 8.30% | Stadium is within host city. |
But the U.S. advantage is also easy to overstate because the tournament’s critical path runs outside stadium walls. The binding constraints are therefore not the existence of venues but whether the surrounding mobility, utilities, and operations systems can absorb synchronized surges without cascading failures.
Hard Infrastructure Is Broadly Sufficient, but “State of Good Repair” Is the Hidden Risk
The 2025 American Society of Civil Engineers (ASCE) Report Card for American Infrastructure gives the U.S. an overall grade of C, the highest it has awarded, but it grades several categories that matter directly for World Cup operations in the D range. In particular, ASCE assigns a D+ for aviation and a D for transit, while noting that some sectors suffer from unreliable or unavailable performance indicator data.[62] This is the U.S. infrastructure paradox: the system is comprehensive and functional, yet aging, unevenly modernized, and frequently operated close to its limits in peak conditions.
For mega-events, average-day capacity is a misleading comfort. London’s 2012 Olympics transport legacy report explicitly states that the sheer number of people were only part of the challenge; performance depended on immense coordination and the ability to keep a major city moving while layering extraordinary demand on top.[63] The U.S. faces a similar dynamic: even if stadiums, airports, and roads “work” in normal conditions, World Cup success depends on how reliably they work under correlated demand spikes, localized incidents, and severe weather.
Airports Are a National Capacity Strength—and a National Bottleneck Risk
Air travel is the connective tissue among dispersed host cities. The U.S. aviation system is huge, but its constraints are increasingly labor- and reliability-driven rather than runway-driven.
A central systemic risk is air-traffic control staffing. The Government Accountability Office (GAO) reports that at the end of FY2025, FAA employed 13,164 air-traffic controllers—about 6% fewer than in 2015—while total flights using the air-traffic control system increased by about 10% from FY2015 to FY2024, to 30.8 million.[64] GAO also emphasizes that hiring and training pipelines have multiyear timelines and substantial attrition, limiting how quickly staffing shortfalls can be corrected.[65] For World Cup readiness, this matters because even modest system friction such as ground stops, flow control, and weather diversions can compound across 11 metro regions—turning a manageable surge into missed connections, late arrivals, and overloaded ground transportation at precisely the wrong moments.
The policy implication is not that the U.S. lacks airports; it is that event-time performance depends on the reliability of the aviation operating systems such as controller staffing, traffic-management initiatives, passenger processing, and landside circulation, which are only partially under local host-city control. The Department of Transportation’s (DOT) public reporting infrastructure—such as the Air Travel Consumer Report and Bureau of Transportation Statistics (BTS) on-time performance data—exists, but the readiness question for 2026 is whether operational performance will be protected during peak tournament windows, and not simply documented after the fact.[66]
Germany 2006 Shows How Integration Can Unlock “Existing Capacity”
Germany’s 2006 World Cup is a useful contrast because it illustrates that the biggest gains can come from integrated operations, not new concrete. Germany used an integrated mobility policy in which match tickets functioned as local public transport travel cards (effectively bundling attendance and transit into one managed system).[67] The operational logic was straightforward: reduce car dependence, simplify wayfinding for foreign visitors, and shift demand to modes that can be scaled with frequency and staffing.
The U.S. cannot replicate Germany’s model wholesale because U.S. host cities have highly varied transit networks and fare systems. But Germany demonstrates a general principle: mega-event mobility works best when the organizing authority can convert fragmented systems into an integrated customer experience that includes ticketing, signage, operating plans, and staffing, even if physical infrastructure is largely preexisting.[68] In fact, policymakers should visualize the World Cup as a customer experience event, even for Americans, and not necessarily as an income opportunity.
Governance Fragmentation as an Infrastructure Problem
In the U.S., governance is not just a management challenge; it is an infrastructure risk because it determines whether systems can be made to behave like one system during the event. Responsibilities are inherently distributed between several stakeholders:
- FIFA governs competition requirements, venue standards, and commercial rules.
- U.S. Soccer and domestic stakeholders interface with FIFA and support U.S. participation.
- Local host committees coordinate delivery within each metro.
- Federal agencies on transportation, homeland security, border/aviation processing, and cybersecurity shape the operating environment.
- State DOTs, city transportation departments, transit agencies, airport authorities, and utilities own the assets and run the daily operations.
- Police departments, emergency-management agencies, and private contractors deliver safety/security and major-incident response.
The White House has attempted to impose organizing coherence at the federal level through the White House Task Force on the FIFA World Cup 2026, described as “dedicated to leading and coordinating federal efforts” in support of the 2025 Club World Cup and 2026 World Cup and facilitating interagency planning and execution.[69] Separately, DHS has established a World Cup–focused advisory commission, publicly described as advising the secretary of Homeland Security and the White House task force on safety and security for the 2026 World Cup.[70] These are meaningful steps but do not automatically solve the core governance problem: most operational levers remain local, and many local systems are controlled by independent authorities with their own constraints, labor agreements, and funding cycles.
Host Committees Can Coordinate—but Usually Cannot Command
A recurring risk pattern in U.S.-based mega-events is overreliance on coordination where authority is required. Local host committees are typically designed as conveners and fundraisers, not as empowered operators with formal control over transit scheduling, airport staffing, police mutual aid, or utility hardening.
For example, the FIFA World Cup 2026 New York/New Jersey Host Committee describes itself as the local organizing body responsible for delivering matches in the region and “coordinat[ing] between key city and state stakeholders and FIFA” to plan and deliver infrastructure, facilities, and services.[71] That language is realistic—and also revealing: coordination across NYC/NJ implies a complex, multi-authority environment involving several states, cities, transit agencies, and airports, where no single entity naturally holds unified operational control.
This is why governance fragmentation becomes an infrastructure problem. Even if each agency performs well, the event can still fail at the seams: inconsistent operating assumptions, incompatible communications protocols, mismatched staffing plans, or unclear escalation authority during incidents.
London 2012 Paired an Organizing Committee with a Delivery Authority
London 2012 is a valuable example because it shows how governance capacity looks when treated as a core deliverable. The Olympic Delivery Authority (ODA) was established to construct venues and infrastructure, working with delivery partners, while the broader transport system relied on coordinated effort among many entities.[72] London’s own transport legacy report notes that more than 40 organizations were responsible for various aspects of games transport—and that years of planning and joint working were foundational to success.[73]
The U.S. cannot create a London-style delivery authority across 11 metropolitan areas in months. But London underscores the key lesson for 2026: organizational execution is itself a form of infrastructure, especially when physical assets are preexisting and dispersed.
The Funding Signal Is Real—but the Governance Question Remains
In March 2026, DOT announced $100.3 million in Federal Transit Administration (FTA) funding to support public transit systems in U.S. host cities, intended to help expand transit options to meet increased demand around stadiums.[74] FTA specifies that the funding can support planning, capital, and operating expenses; is apportioned by a formula based on stadium capacity and number of matches; allows a 100% federal share; and requires transit agencies to obligate funds within one fiscal year after the close of the World Cup.[75]
This funding helps—especially for operations and surge planning—but its structure also points to an uncomfortable truth: in March 2026, with kickoff in June 2026, marginal dollars overwhelmingly translate into operational improvisation such as extra service, shuttles, staffing, and communications rather than transformative capital upgrades. Whether that improvisation succeeds depends on governance, maturity, and infrastructure readiness: who can procure and efficiently scale services quickly, coordinate multiagency operations, and enforce consistent systemwide priorities during match windows.
Project Delivery and Schedule Realism
Because the U.S. is not building new stadiums, in contrast to most previous hosts in the past three decades, infrastructure readiness hinges on whether existing assets can be operated at surge capacity safely and whether the limited set of high-impact projects near airports and key corridors will actually be complete, tested, and operational before the first match.
Within DOT, the Federal Highway Administration’s (FHWA) planning guidance asserts that by January 2026, host cities should have finalized their mobility plans for the June 11, 2026, start.[76] The question is whether those plans are backed by funded service plans, contracted surge capacity, trained staff, and executable interagency protocols—especially in cities where physical constraints force reliance on temporary operational measures.
Main Airport Interface Projects Illustrate Progress and Residual Risk
- Los Angeles (LAX). Los Angeles World Airports (LAWA), the airport authority, announced that the LAX Automated People Mover (APM) train was expected to begin service in January 2026, with construction completion scheduled for December 8, 2025, and trains arriving every two minutes during peak hours.[77] APM is designed to connect terminals with economy parking, a consolidated rental-car facility, and Metro’s LAX/Metro Transit Center (C and K lines).[78] From an operational-readiness standpoint, this is potentially one of the most important single projects in the U.S. host-city portfolio because it addresses a classic failure point: airport landside congestion. Yet LAWA’s own release acknowledges cost and schedule pressure, including additional payment and contingencies related to “a longer than anticipated construction timeline.”[79] As of this writing, APM was in the testing phase of development but not fully operational. A risk-conscious assessment should have treated January 2026 service as an objective, not a guarantee—and should have demanded contingency planning for partial openings, limited operating hours, or early reliability issues.
- New York region (JFK). The Port Authority’s New Terminal One project at JFK is described as a $9.5 billion capital commitment, “scheduled to open in phases from 2026,” with full completion in 2030.[80] Phased openings can reduce long-term risk but increase short-term operational complexity: construction staging, curb access changes, and transitional wayfinding burdens occur precisely when the region must host the World Cup final and multiple matches.[81] I.e., the New York region may be adding airport capacity and quality—but also adding temporary complexity at the exact interface where foreign visitors first encounter the U.S. host experience.
- Boston (Logan). Airport authority Massport describes ongoing modernization at Logan, including a new multilevel transportation center at Terminal E with 4,000 new parking spaces and expanded curb space for ride app and limo pickups, plus roadway improvements such as dedicated HOV lanes and additional travel lanes.[82] Massport also describes upgrades to Terminal E international arrivals: moving walkways to the Customs and Border Protection hall, expanded queue space and inspection booths, and baggage claim equipment additions intended to speed processing and reduce wait times.[83] These improvements align with World Cup conditions (international arrivals and peak curb demand), but the key Boston-area operational challenge remains that matches are in Foxborough, not in downtown Boston.[84]
- Dallas–Fort Worth (DFW). DFW and American Airlines have a major Terminal F expansion program under way, but the airport states that the original first phase is scheduled to be operational in 2027, after the World Cup.[85] That means that 2026 readiness rests on current terminals plus operational management of construction impacts. The airport is therefore not “unready,” but its World Cup posture is fundamentally operational, not capital-delivery-driven.
- Miami (MIA). Miami International Airport describes a $9 billion “Modernization in Action” capital improvement program over the next 10 years, aimed at modernizing passenger touchpoints and expanding facilities over time.[86] Its scale underscores seriousness, but its timeline means that 2026 performance will still largely depend on day-to-day operations, staffing, and landside management rather than on completed 10-year transformations.
Stadium Access Projects Are Still Mostly “Temporary Mobility”
In several host metros, core match venues are not served by high-capacity rail directly at the stadium doorstep. This problem does not guarantee failure—U.S. cities run large NFL events routinely—but it shifts readiness from infrastructure investment to operations.
Consider Los Angeles: SoFi Stadium’s own guidance emphasizes Park & Ride and requires many visitors to use alternatives if they do not have parking passes; for public transportation, it points riders to the Metro C or K Line to the LAX/Metro Transit Center station and then a shuttle to the stadium.[87] The basic mobility concept is therefore shuttle-dependent—an approach that can work but only if bus staging, dedicated lanes, dispatch control, and pedestrian queue management are engineered with the same rigor as rail operations.
For longer-horizon planning, LA Metro’s “Twenty-Eight by ’28” initiative explicitly frames the Olympics as a forcing function for accelerating projects, including “complex mega projects” requiring unprecedented acceleration.[88] That underscores a key 2026 point: many of the transformative “transit-first” ambitions are calibrated to 2028, not 2026.
Stress Scenario: Heat Waves, Power Tightness, and Cascading Mobility Impacts
The World Cup takes place in the summer, when North American grids increasingly face peak-demand stress. The North American Electric Reliability Corporation’s (NERC) 2025 Summer Reliability Assessment finds an elevated risk of supply shortfalls during wide-area heat waves and abnormal weather conditions; it warns that system operators in many parts of North America could face challenges meeting peak electricity demand, with reserve shortages possible under above-normal demand and low renewable output conditions.[89]
For World Cup operations, this is not abstract. Power disruptions hit stadium operations, airport baggage systems, rail signaling, traffic-management centers, cellular networks, and water pumping. Even short interruptions can create long delays if restart procedures are slow or if backup systems are not tested under load. The policy gap is that “grid reliability” is typically treated as a utility planning issue, not an event-readiness deliverable—yet the event-time risk is concentrated in precisely the crowded conditions where backup generation, fuel delivery, and communications redundancy must work flawlessly.
Stress Scenario: Crowd-Management Breakdown at the Stadium Perimeter
The most recent U.S. warning signal is the chaos that erupted at the 2024 Copa América final at Hard Rock Stadium. Reporting on the Miami-Dade after-action findings describes failures including lack of intelligence gathering, insufficient security perimeters, and large numbers of unticketed fans attempting to enter the stadium, contributing to chaotic scenes before the match.[90]
The July 14, 2024, Copa América final at Hard Rock Stadium drew about 65,300 spectators, essentially the venue’s listed capacity.[91] Yet kickoff was delayed by 82 minutes, after major crowd-control failures outside the stadium.
On the enforcement side, Miami-Dade Police reported 27 arrests and 55 ejections after the incident. Some later reporting on the county’s after-action review cites 26 arrests and 54 ejections, which likely reflects slightly different counting cutoffs or report versions; but either way, the order of magnitude is clear: dozens of removals and arrests at a single championship match.[92]
The staffing figures are also revealing. Reporting on the event claimed that there were more than 800 law-enforcement officers deployed, compared with 275–300 officers at a typical Miami Dolphins game.[93] That matters because the problem was not simply too few personnel; it was that the security concept itself broke down under pressure. The after-action findings point to three concrete operational failures: insufficient intelligence gathering, inadequate outer security perimeters, and large numbers of unticketed fans already on stadium grounds before the situation fully deteriorated.[94]
The relevance to 2026 is not that the World Cup will replicate Copa América; in fact, the 2024 event is likely to be used as a learning opportunity for the organization of the World Cup. The relevant point is structural: perimeter design, screening capacity, and coordinated enforcement against gate crashing are interface problems—outside the stadium bowl, between private venue operations and public law enforcement, and highly sensitive to staffing, communications, and pre-event intelligence. Cities that rely heavily on road-based access and shuttle systems (creating large exterior queuing zones and complex pick-up/drop-off patterns) are especially exposed if perimeter control is not engineered for worst-case conditions.
Security: Crime, Terrorism, Cyber, and Capacity
As the U.S. hosts the World Cup, security readiness means more than just the absence of major attacks; it means sustaining safe, orderly operations across dozens of match venues and fan events for over a month, under several overlapping pressures.[95] Success will require a layered, real-time security operation combining trained personnel, intelligence tools, and seamless interagency coordination to manage everyday crime, soft-target protection, critical-infrastructure resilience, and public confidence.[96] In practice, that means preventing large-scale terror or cyber shocks and managing routine disturbances—keeping crowds moving, venues supplied, and emergency medical services ready and ensuring that nothing cascades out of control.
Baseline Crime and Visitor Exposure
High aggregate crime rates do not automatically doom an event, but they shape how visitors experience each host city. Many U.S. host metros, such as Kansas City, Philadelphia, and Houston, start with violent crime levels well above the national average, often several hundred or even more than 1,000 incidents per 100,000 residents.[97] However, the risk to the World Cup depends on where crowds gather. Fan zones, bars, transit hubs, and stadium approaches in entertainment districts may concentrate exposure even in cities that are moderate overall. For example, Kansas City reduced homicide and shootings in 2025,[98] but its downtown bar area still saw frequent robberies. Philadelphia saw 2025 homicides plunge to historical lows (about 220 for the year);[99] yet chronic violence occurs on select blocks near its stadium. In practice, organizers will map fan travel patterns—from hotels to stadiums, airports, and fan fests—and beef up policing and surveillance there.
TABLE 7
Violent Crime Rate Comparison
| World Cup Host City | Violent Crime per 100K (2024) | Murder per 100K | Rape per 100K | Robbery per 100K | Aggravated Assault per 100K | FBI Rank (of 217) | City Population | Multiple of National Avg. | Excess Over National Avg. | World Cup Matches |
| Kansas City | 1,547.10 | 23.6 | 80.5 | 256.3 | 1,186.70 | 7 | 508,090 | 4.3x | 1,188.11 | 6 |
| Houston | 1,148.20 | 11.6 | 56.2 | 321.4 | 759 | 26 | 2,314,157 | 3.2x | 789.17 | 7 |
| Philadelphia | 908.7 | 15.8 | 65.4 | 218.7 | 608.8 | 57 | 1,573,916 | 2.5x | 549.69 | 7 |
| Atlanta | 820 | 21.5 | 28 | 100 | 670.5 | N/A | 510,823 | 2.3x | 461 | 8 |
| Seattle | 775.1 | 5.6 | 38.5 | 176.8 | 554.2 | 85 | 749,256 | 2.2x | 416.07 | 5 |
| Los Angeles | 728.5 | 8 | 44.2 | 218.5 | 457.8 | 103 | 3,898,747 | 2.0x | 369.49 | 8 |
| New York / NJ | 671 | 4.1 | 24.8 | 162.3 | 479.8 | 127 | 8,258,035 | 1.9x | 312.02 | 8 |
| Dallas | 658.2 | 12.5 | 54.8 | 180.4 | 410.5 | 132 | 1,304,379 | 1.8x | 299.19 | 9 |
| Boston | 627.9 | 5.2 | 29.5 | 115 | 478.2 | 141 | 675,647 | 1.7x | 268.87 | 7 |
| San Francisco | 596.5 | 5.4 | 32.8 | 234.6 | 323.7 | 158 | 808,988 | 1.7x | 237.5 | 6 |
| Miami | 473.3 | 9.8 | 17.2 | 159.8 | 286.5 | 243 | 449,514 | 1.3x | 114.29 | 7 |
| U.S. NATIONAL AVERAGE (2024) | 359 | 5 | 1.0x | 0 | ||||||
| SIGNIFICANCE BANDS: | ||||||||||
| ≥ 3× National Avg | CRITICALLY ELEVATED — Kansas City, Houston | |||||||||
| 2–3× National Avg | SIGNIFICANTLY ELEVATED — Philadelphia, Atlanta, Seattle, LA | |||||||||
| 1.5–2× National Avg | ABOVE AVERAGE — New York, Dallas, Boston, San Francisco | |||||||||
| 1–1.5× National Avg | MODERATELY ABOVE — Miami | |||||||||
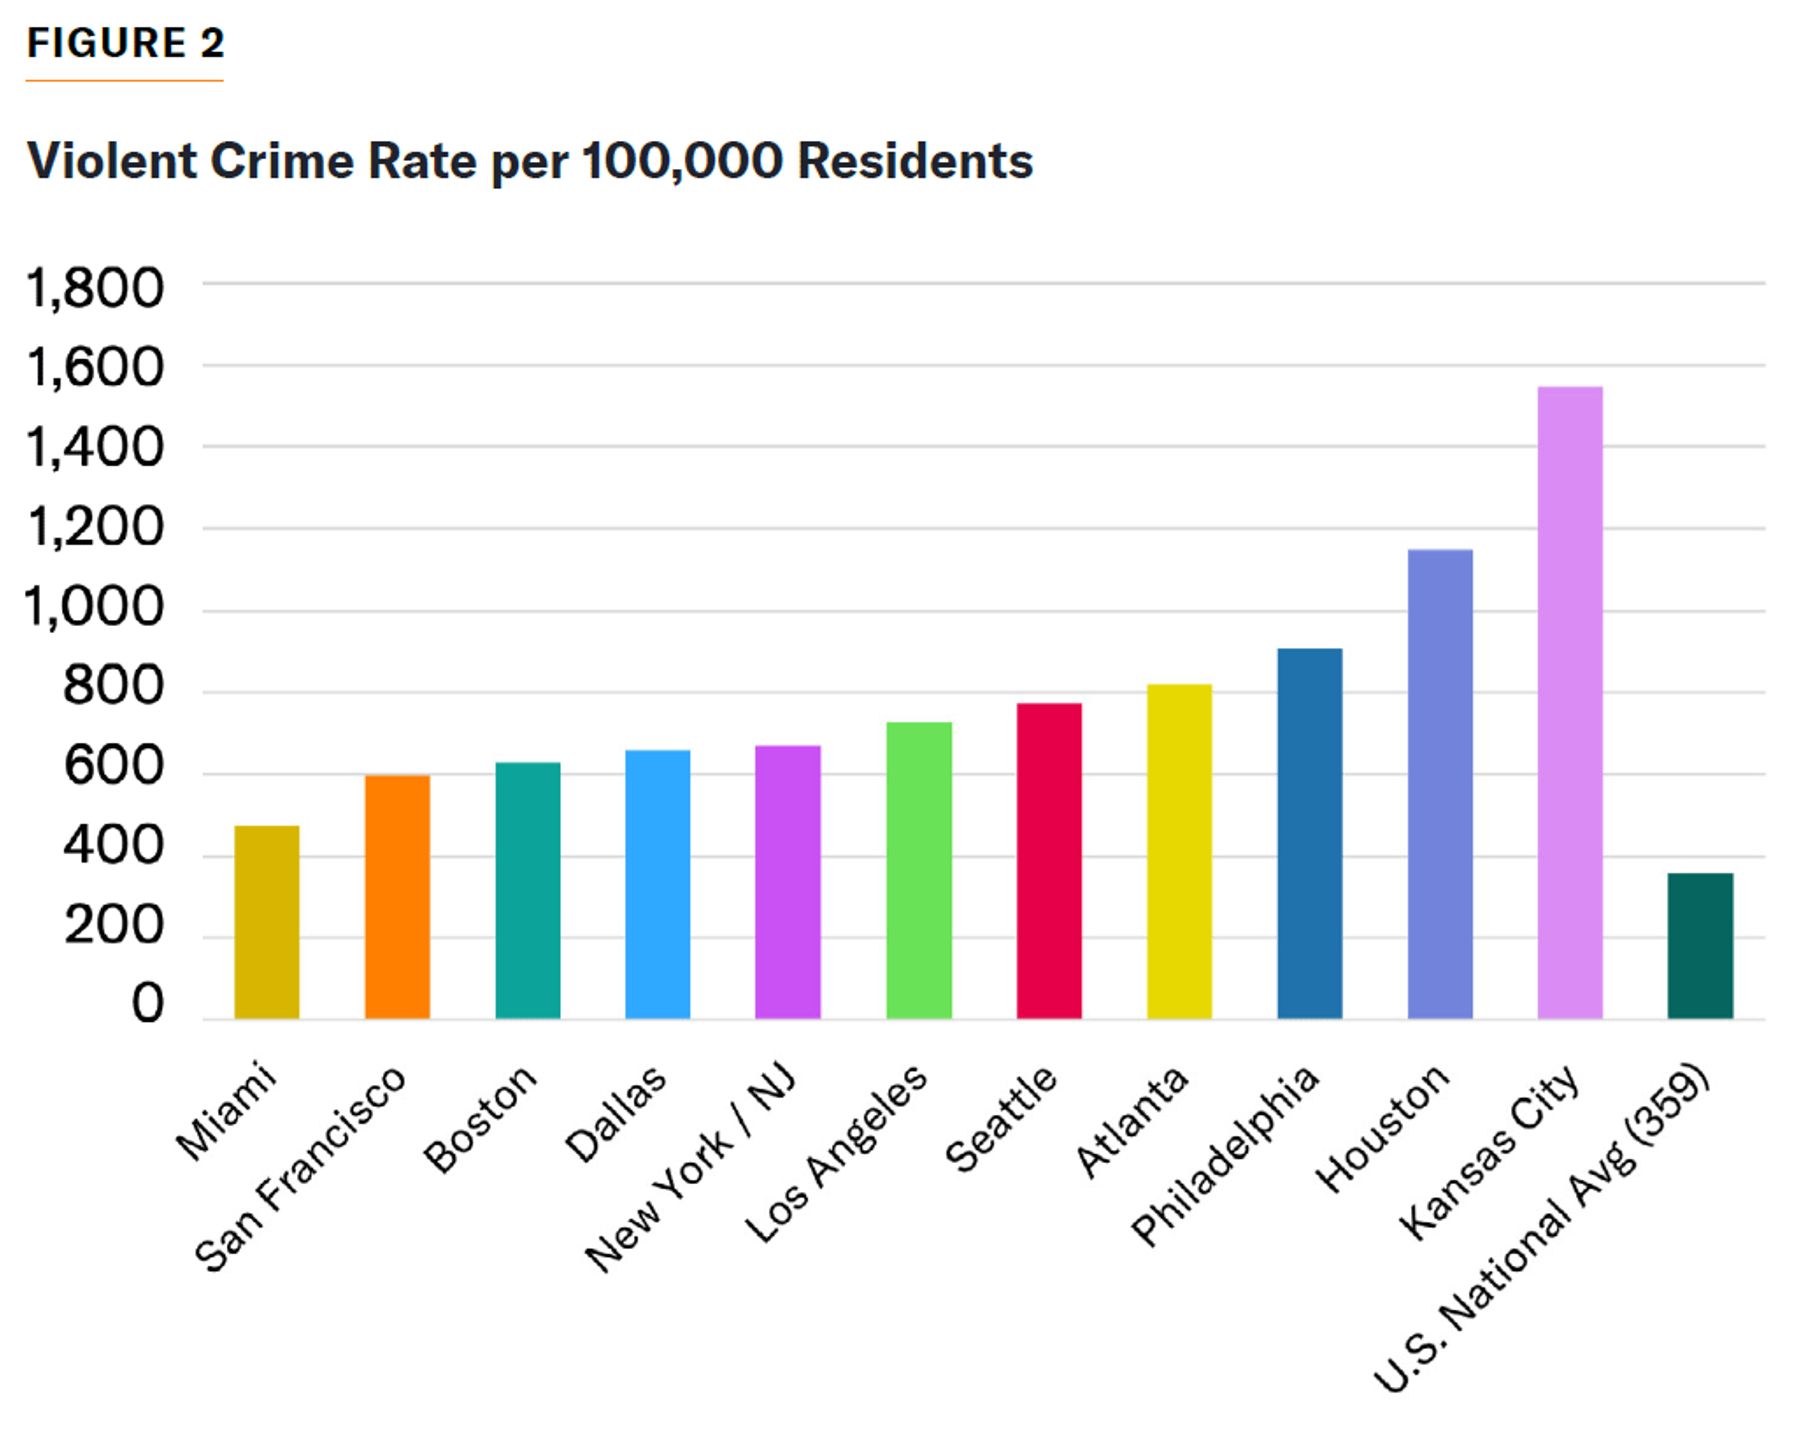
Table 7 and Figure 2 show that every U.S. World Cup host city in the dataset sits above the 2024 national violent crime average of 359 incidents per 100,000 residents, but the gap varies sharply, depending on the city. Kansas City is the clear outlier at roughly 1,547 per 100,000, followed by Houston at 1,148, and Philadelphia at 909. A second tier includes Atlanta, Seattle, Los Angeles, New York/New Jersey, and Dallas, all clustered between 650 and 820. Even the lowest-rate host city shown, Miami, is still well above the national benchmark, at 473. In policy terms, it suggests that host-city security planning cannot rely on a single national baseline: several venues are operating in urban environments with substantially higher violent crime exposure than the country as a whole.
Figure 3 shows that violent crime risk across World Cup host cities is geographically widespread but unevenly concentrated. The darkest, highest-risk locations are Kansas City, Houston, and Philadelphia, all of which stand well above the 2024 national violent crime average and form the map’s top risk tier. A middle band—including Atlanta, Seattle, and Los Angeles—still registers elevated rates, while New York/New Jersey, Dallas, Boston, and San Francisco fall into a more moderate range. Miami appears as the lowest-risk host city in the group but still remains above the national benchmark.
The broader implication is that risk is not evenly distributed across host cities, and resource allocation should reflect that variation. The highest-rate cities may require more intensive policing, emergency-response capacity, and interagency coordination, while mid-range cities may be better served by targeted deployment around transit hubs, fan zones, and stadium districts. Equally important, the statistics indicate that “host city” status alone does not predict a uniform public-safety challenge; local crime conditions differ by a factor of more than three across the venues shown. The key takeaway is that tournament security and preparedness should be tailored city by city rather than built around a national average or one-size-fits-all model.
By contrast, comparative examples show how host cities can “own” safe zones despite tougher neighborhoods. In Brazil 2014, authorities deployed an extra 10,000 riot troops across the 12 host cities to manage protests and keep the Cup on schedule.[100] In the U.S., no single police force can be bulk-mobilized so easily, but several agencies will share the load.
Terrorism and Extremist Threats
Stadiums and fan gatherings are soft targets in any large event, but the U.S. has both strengths and new challenges. On the positive side, American intelligence and counterterrorism resources among FBI, DHS, and others are far deeper than what many past hosts could muster. For instance, DHS reports emphasize active monitoring of domestic violent extremist (DVE) groups alongside foreign threats.[101] No doubt federal and local agencies will pre-position FBI hostage/rescue teams and engage in daily threat briefings, especially if foreign dignitaries or the president attend.
However, the scope of the U.S. threat landscape is broader than in many previous Cups or Olympics. Beyond classic international jihadism, the main driver of Qatar 2022 or Euro 2016 concerns, some religious-supremacist or antigovernment extremists, anarchists, and single-issue actors are looking for big-stage disruption. For example, the Russian World Cup (2018) and the Brazil Olympics (2016) saw protests, some of them directed attacks against symbols, even though no major stadium attacks occurred. In France 2016 (Euro 2016), intelligence found plots against the tournament infrastructure. By comparison, the U.S. will rely on integrated fusion analysis across agencies but must do so across 11 U.S. cities and two neighboring countries.
Importantly, success is not measured only by the absence of terrorist incidents; it is also about intercepting plots early and responding to minor attacks without panic. In January 2026, Miami conducted an exercise illustrating this approach: local, state, and federal partners simulated a “complex, coordinated attack” on a fan festival, testing evacuation plans and Incident Command System/National Incident Management System coordination.[102] Such drills help ensure that if a bomb threat or an active shooter does occur—even if it falls below the terrorism threshold—emergency services respond rapidly, without major fan or media panic.
Cyber and Infrastructure Vulnerabilities
Cyber threats loom largest offsite from stadium perimeters, yet could cripple the Cup (Figure 4). The tournament will depend on digital ticketing, live broadcasting, online fan engagement, and critical utilities (power, water, telecom) for both venues and the host cities. Cybersecurity experts warn that 2026 will be “more technology- and automation-dependent than past tournaments,” multiplying vulnerabilities.[103] For example, a hack of the transit control system could paralyze travel for fans; ransomware on a hotel chain could strand thousands of visitors without reservations; or a power grid failure could cancel matches.
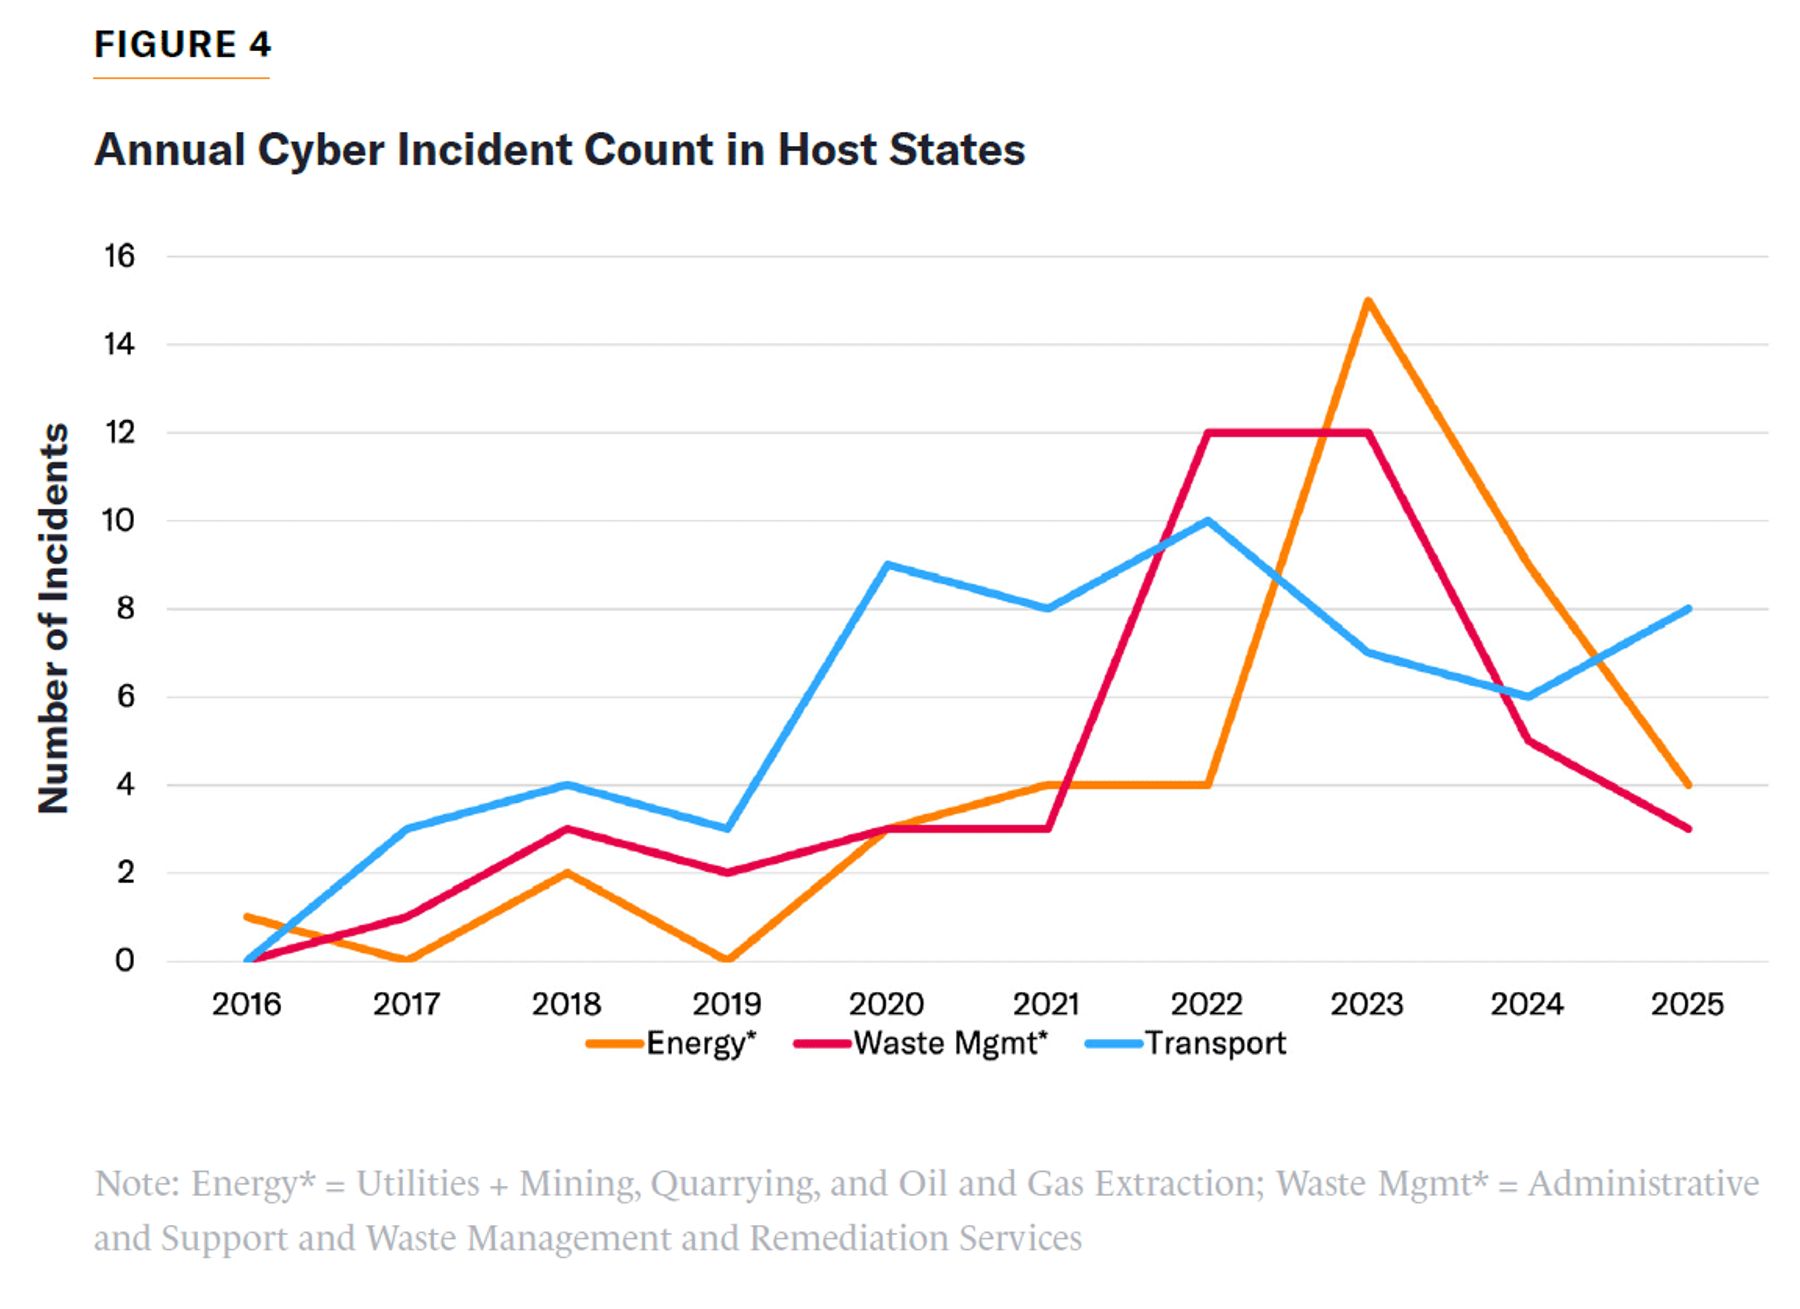
After the 2022 World Cup in Qatar, analysts found compromised network devices that could have disrupted communications and streaming.[104] Similar latent risks likely exist in U.S. host states. Yet official planning seems to treat cyber as a secondary concern. The recent U.S. DHS FEMA grants focus heavily on physical security (including counter–Unmanned Aircraft Security),[105] but public reports do not detail any parallel surge in cyber contingency planning.[106] Some small steps are visible—e.g., DHS’s Cybersecurity and Infrastructure Security Agency (CISA) is coordinating cyber advice with host cities—but the scale may still be insufficient.[107]
Importantly, cyber threats come from several sources. Organized cybercriminals and state-linked hackers will see a global spotlight event as a ripe target. Security firms note that “digital ticketing, streaming, [and] basic services such as water and power” will surely attract criminals during the Cup.[108] At the same time, the polarized U.S. political climate could spur hacktivists to disrupt the tournament for a message.[109] By way of comparison, the Paris 2024 Olympics endured more than 140 cyberattacks, though planning prevented any outages.[110] The U.S. must ensure that its travel, hospitality, and venue operators have up-to-date incident-response plans and that rapid threat information can flow to local IT teams and emergency managers.
Staffing, Funding, and Capacity
A final critical gauge is whether manpower and money match the tourist surge, not just the resident population. All 11 U.S. host cities must scale security personnel far beyond day-to-day levels for at least a month, and many agencies are starting from understaffed footing (Table 8). For example, Philadelphia reports a 19% vacancy rate in police capacity, about 1,200 empty spots out of 6,380 slots,[111] and is pouring a record $150 million into overtime to cover shortages.[112] Houston similarly has about 1,200 police vacancies; only 5,260 of 6,405 positions are filled.[113] Even Los Angeles—a city gearing up for major events—acknowledges “historically low police staffing levels,” prompting its city council to authorize additional hires, specifically citing World Cup preparation.[114] Dallas currently fields 3,200 officers but is legally bound to reach 4,000 by 2029,[115] meaning that it must add 800 more during the same period when it is trying to plan the Cup.
TABLE 8
Police Capacity vs. Crowd
| World Cup Host City | Sworn Officers (2025 Est.) | Authorized Strength | Vacancies | Vacancies Percentage | City Population | Officers per 100K Residents | Stadium Capacity | World Cup Matches | Est. Match-Day Visitors (Metro-Wide) | Officers per 100 Visitors | Metro Population |
| Seattle | 950 | 1,300 | 350 | 27% | 749,256 | 127 | 69,000 | 5 | 135,000 | 0.7 | 4,000,000 |
| Kansas City | 1,400 | 1,500 | 100 | 7% | 508,090 | 276 | 76,416 | 6 | 155,000 | 0.9 | 2,200,000 |
| Miami | 1,400 | 1,600 | 200 | 13% | 449,514 | 311 | 65,326 | 7 | 140,000 | 1 | 6,200,000 |
| Atlanta | 2,100 | 2,500 | 400 | 16% | 510,823 | 411 | 71,000 | 8 | 160,000 | 1.3 | 6,100,000 |
| SF Bay Area | 2,000 | 2,200 | 200 | 9% | 808,988 | 247 | 68,500 | 6 | 145,000 | 1.4 | 4,700,000 |
| Dallas / Arlington | 3,215 | 3,900 | 685 | 18% | 1,304,379 | 246 | 94,000 | 9 | 210,000 | 1.5 | 7,600,000 |
| Boston / Foxborough | 2,100 | 2,300 | 200 | 9% | 675,647 | 311 | 65,878 | 7 | 140,000 | 1.5 | 4,900,000 |
| Houston | 5,300 | 5,900 | 600 | 10% | 2,314,157 | 229 | 72,220 | 7 | 155,000 | 3.4 | 7,100,000 |
| Philadelphia | 6,000 | 6,400 | 400 | 6% | 1,573,916 | 381 | 69,176 | 7 | 155,000 | 3.9 | 6,200,000 |
| Los Angeles | 9,100 | 9,700 | 600 | 6% | 3,898,747 | 233 | 70,240 | 8 | 165,000 | 5.5 | 13,200,000 |
| New York / NJ | 33,800 | 35,000 | 1,200 | 3% | 8,258,035 | 409 | 82,500 | 8 | 200,000 | 16.9 | 20,100,000 |
| RATIO LEGEND (Officers per 100 Visitors): |
| < 1.0 — CRITICAL |
| 1.0–1.9 — VERY LOW |
| 2.0–3.9 — LOW |
| 4.0–7.9 — MODERATE |
| ≥ 8.0 — ADEQUATE |
These shortages become acute when thousands of visitors swamp a city. For context, DHS typically deploys hundreds of federal officers to a Super Bowl with about 73,000 spectators.[116] World Cup games will draw similar or larger single-game crowds, several times during the same month. If a city like Kansas City, which hosts six games, cannot staff at sufficient or normal levels, it will rely heavily on overtime and mutual aid. Budget-wise, Congress appropriated $625 million for the 11 host cities to cover security and fanfestival costs[117]—a critical infusion if distributed. But as of early March 2026, none of that money had been disbursed, because of a DHS funding lapse.[118] Local planners warn that losing just a few weeks more on funding would force cancellation of planned fan events.[119] This funding shortfall has direct staffing implications: as Kansas City’s deputy police chief notes, the grants were intended to pay for the extra officers needed for several games and training camps.[120]
The U.S. faces not a single extreme failure mode but a stretched security ecosystem. Many issues—high local crime in some host corridors, myriad small extremist threats, extensive cyberphysical attack surfaces, and pervasive staffing gaps—collectively shrink the margin for error. Worse, all this pressure will coincide with other major events, such as America’s 250th Independence Day events, a Philadelphia All-Star Game, several state elections,[121] and hurricane-season preparations.[122] Even a garden-variety crisis like a heatwave or traffic incident could strain city resources if police and EMS are already stretched by the Cup.
TABLE 9
Mega-Event Benchmarks
| Event | Year | Host | Total Security Personnel Deployed | Peak Daily Visitors (Est.) | Security per 100 Visitors | Key Feature | Cost (Est. USD) | Outcome |
| FIFA World Cup | 2022 | Qatar | 49,000 | 120,000 | 40.8 | Single compact host city; 13 countries contributed personnel; 15,000 CCTV cameras; facial recognition at all 8 stadiums | $2B+ | Near-zero major incidents. Strictest security of any World Cup. Autocratic control enabled comprehensive surveillance. Not replicable in open democracies. |
| FIFA World Cup | 2018 | Russia | 100,000 | 200,000 | 50 | Military + police + Federal Security Service across 11 host cities; extensive surveillance; restricted protest rights; alcohol sales limited near stadiums | $4B+ | Low crime during tournament. Heavy-handed policing suppressed hooliganism. Open-source intelligence monitoring of fan groups. |
| FIFA World Cup | 2014 | Brazil | 170,000 | 600,000 | 28.3 | Military deployed to host cities; 'pacification' of favelas; widespread street protests despite security; 12 host cities | $1.5B+ | Mixed results. Matches secure but street protests disrupted transport. Armed robbery of tourists reported. Some cities overwhelmed. |
| FIFA World Cup | 2010 | South Africa | 44,000 | 350,000 | 12.6 | South African Police Service + military; private security for fan parks; crime "ring of steel" around stadiums; 10 host cities | $1.3B | Largely successful but tourist robberies in Johannesburg persisted. Crime dropped 60–70% within secured perimeters but displaced to periphery. |
| Olympics | 2012 | London | 80,000 | 400,000 | 20 | Police + 18,500 military + 10,000 G4S private security; 40,000 perimeter fencing; missile batteries on rooftops | $1.6B | Benchmark success. G4S private security failure required last-minute military surge. Ring of steel model widely emulated. |
| Olympics | 2016 | Rio | 85,000 | 500,000 | 17 | 85,000 police + military across metro; favela pacification; Battalion of Special Police Operations special forces; integrated command centers per venue | $900M | Mostly secure but mugging/robbery of athletes and tourists. Property crime displacement to non-secured areas. |
| Olympics | 2024 | Paris | 45,000 | 350,000 | 12.9 | 30,000 police + 15,000 military (Sentinelle); Seine opening ceremony = unprecedented open-air challenge; intelligence-led deployment | $380M+ | Successful. Seine ceremony secured with snipers, drones, river barriers. Metro area well-covered. Reduced alcohol near venues. |
| Super Bowl | 2024 | Las Vegas | 8,000 | 150,000 | 5.3 | Las Vegas Metropolitan Police Department + NV Highway Patrol + FBI + Secret Service + private; strip-focused deployment; single-game event | $180M | No major incidents. But single-game event vs. 5-week WC = fundamentally different sustain challenge. |
| World Cup 2026 (Est.) | 2026 | USA (11 cities) | TBD | TBD | TBD | 11 separate jurisdictions; 64 matches over 39 days; no unified command; varying transit, crime, and staffing profiles | TBD | ESTIMATED RANGE: 2.0–5.0 security per 10K visitors without federal surge. With DHS/FBI/National Guard: potentially 8–15. Far below Qatar/Russia. |
Previous World Cups and Olympics offer cautionary tales (Table 9). In Brazil 2014, for example, unrest over costs forced security agencies to dedicate extra riot forces.[123] In Qatar 2022, cybersecurity analysts found vulnerabilities in event networks that, fortunately, were caught in time.[124] The 2024 Paris Olympics also proved that even well-funded hosts can face cyber probes. Paris received more than 140 reported attacks but succeeded because the city was well prepared.[125] The U.S. does benefit from mature intelligence services because former DHS secretary Noem stressed the need for “transparent, coordinated, and timely” action,[126] but it must adapt to managing security across 10 times as many venues as a typical Super Bowl and coordinate across three countries.
Transportation and Lodging Readiness for the 2026 World Cup
The U.S. is likely capable of hosting and transporting most of the visitors for the 2026 FIFA World Cup in the aggregate—its aviation system, metropolitan economies, and hotel stock are among the world’s largest—but aggregate capacity masks the tournament’s most consequential logistical vulnerability: the interaction between continental-scale geography and uneven, often car-dependent, local mobility. Fans will generally be able to enter the country and reach major metro areas; the harder problem is moving large, time-constrained crowds through specific airports, corridors, and stadium access points on match-day peaks, and then housing visitors at prices and locations usable by ordinary supporters rather than only affluent, flexible travelers. Can the U.S. deliver reliable trips and affordable stays at the stress points created by match schedules, weather, and last mile constraints?
National Air System Strain Before the Tournament Even Begins
U.S. aviation demand has returned to—and, in some measures, exceeded—prepandemic levels, meaning that the World Cup will layer demand onto an already-busy system rather than a slack one. Federal statistics that use TSA screening volumes show a strong rebound from the 2020 collapse, with 2024 screening levels exceeding the previous five years in that series—an indicator of a national system operating close to normal peak-season conditions.[127]
The World Cup concentrates international arrivals, domestic repositioning trips, and same-day “in-and-out” travel around fixed match times across several cities. In aviation, peak-load risk is not proportional to annual passenger totals; it is driven by delay propagation such as late aircraft and crews, weather sensitivity, and “banked” arrival/departure surges that quickly saturate gate, ramp, and runway throughput. U.S. delay data are robust enough to analyze these stresses, but even key airline-reported delay/cancellation datasets still face gaps in completeness and inconsistent “cause” coding across carriers, which can lead planners to underestimate operational fragility if they rely on optimistic classifications.[128]
The most fragile host-airport complexes are those where federal interventions already acknowledge capacity or staffing constraints during the World Cup window. Newark (EWR) stands out as a single inflection point: FAA has extended and modified an order limiting scheduled operations through October 24, 2026—explicitly covering the summer 2026 season—because of congestion and performance concerns.[129] In the same regional airspace, FAA has also extended slot-usage relief tied to staffing-related constraints at JFK and LaGuardia through October 24, 2026, again spanning the tournament period.[130] Taken together, these are not abstract warnings; they are formal acknowledgments that the core New York metro aviation system has limited surge elasticity through at least the World Cup.
Weather multiplies these stresses. Summer convective storms are a principal driver of U.S. National Airspace System disruption; FAA emphasizes that thunderstorms are frequent in summer months and require traffic-management strategies that can reduce throughput and create cascading delays.[131] Miami adds a specific seasonal risk: the Atlantic hurricane season is June 1–November 30, overlapping the tournament’s June–July schedule and increasing uncertainty for South Florida aviation and roadway operations.[132] Some of these conflicts are depicted in Tables 10 and 11.
TABLE 10
Venue Risk Matrix
| Stadium | City | State | Total U.S. Matches | Hurricane Exposure | Atlantic/Gulf Coast Venue | Nearest State Primary Date | Hosts Knockout Matches | July 4th Week Match | Overall Risk Level |
| AT&T Stadium | Dallas | TX | 9 | Gulf Coast / Tornado Alley | YES | Mar 3 (TX Primary) | YES | NO | HIGH |
| MetLife Stadium | New York/New Jersey | NJ | 8 | Atlantic Coast (low-mod) | YES | Jun 23 (NY Primary during WC) | YES (incl. FINAL) | NO | HIGH |
| SoFi Stadium | Los Angeles | CA | 8 | Minimal (Pacific) | NO | Jun 2 (CA, before WC) | YES | NO | MODERATE |
| Mercedes-Benz Stadium | Atlanta | GA | 8 | Inland SE (moderate) | YES | May 19 (GA, before WC) | YES (incl. SEMIFINAL) | NO | HIGH |
| NRG Stadium | Houston | TX | 7 | Gulf Coast (HIGH) | YES | Mar 3 (TX, before WC) | YES | YES | VERY HIGH |
| Hard Rock Stadium | Miami | FL | 7 | Atlantic/Gulf (HIGHEST) | YES | Aug 18 (FL, after WC) | YES (incl. 3RD PLACE) | NO | VERY HIGH |
| Gillette Stadium | Boston | MA | 7 | Atlantic Coast (moderate) | YES | Sep 1 (MA, after WC) | YES (incl. QUARTERFINAL) | NO | MODERATE |
| Lincoln Financial Field | Philadelphia | PA | 7 | Atlantic Coast (moderate) | YES | May 19 (PA, before WC) | YES | YES | HIGH |
| Arrowhead Stadium | Kansas City | MO | 6 | Inland (low, tornado) | NO | Aug 4 (MO, after WC) | YES (incl. QUARTERFINAL) | NO | MODERATE |
| Levi's Stadium | San Francisco | CA | 6 | Minimal (Pacific) | NO | Jun 2 (CA, before WC) | YES | NO | LOW |
| Lumen Field | Seattle | WA | 5 | Minimal (Pacific NW) | NO | Aug 4 (WA, after WC) | YES | NO | LOW |
TABLE 11
2026 FIFA World Cup: Concurrent Event Timeline
| Jun-26 | ||||||||||||||||||||
| Event Category | 11 | 12 | 13 | 14 | 15 | 16 | 17 | 18 | 19 | 20 | 21 | 22 | 23 | 24 | 25 | 26 | 27 | 28 | 29 | 30 |
| World Cup | 1 | 3 | 3 | 4 | 4 | 2 | 2 | 4 | 2 | 3 | 4 | 2 | 3 | 6 | 3 | 6 | 1 | 2 | 2 | |
| Hurricane Season | ||||||||||||||||||||
| July 4 (250th Anniversary) | ||||||||||||||||||||
| Election Primaries | AL, DC, OK | |||||||||||||||||||
| National Holidays | Flag Day | June-teeth | ||||||||||||||||||
| Jul-26 | |||||||||||||||||||
| Event Category | 1 | 2 | 3 | 4 | 5 | 6 | 7 | 8 | 9 | 10 | 11 | 12 | 13 | 14 | 15 | 16 | 17 | 18 | 19 |
| World Cup | 3 | 1 | 3 | 2 | 1 | 2 | 1 | 1 | 1 | 2 | 1 | 1 | 1 | 1 | |||||
| Hurricane Season | |||||||||||||||||||
| July 4 (250th Anniversary) | America 250 | ||||||||||||||||||
| Election Primaries | |||||||||||||||||||
| National Holidays | July 4th | ||||||||||||||||||
| Legend | |||
| Group Stage | Numbers in World Cup row = U.S. match count that day | ||
| Round of 32 | |||
| Round of 16 | |||
| Quarterfinals | |||
| Semifinals/Final | |||
| Hurricane Season Active | Entire tournament falls within Atlantic hurricane season (Jun 1–Nov 30) | ||
| July 4 (250th Anniversary) | |||
| State Primaries | State abbreviations shown on primary election dates | ||
| National Holidays | Flag Day (Jun 14), Juneteenth (Jun 19), Independence Day (Jul 4) | ||
Host-airport infrastructure investments can mitigate some risks, but the key is what will be operational by mid-2026. Los Angeles illustrates that point: LAWA’s official schedule for the LAX Automated People Mover targeted construction completion in December 2025 and service beginning in January 2026 with high peak frequency.[133] However, as mentioned above, the LAX APM is not operational but only in testing stages.[134] If delivered, that would materially improve terminal-area circulation and ground access during World Cup travel peaks. Because this project sits close to the kickoff window, any slippage would shift more burden onto already-congested curb fronts, shuttle buses, and roadways—an uncertainty that should be reflected in contingency plans rather than assumed away.
A second structural vulnerability is airport-specific throughput cliffs in poor conditions. San Francisco International (SFO) documents that it can accommodate roughly 60 arrivals per hour in fair weather, but low visibility sharply reduces arrival capacity because its parallel runways are only 750 feet apart—well below the 4,300-foot separation needed for side-by-side arrivals under current FAA safety rules—forcing single-file arrivals in low visibility.[135] SFO has implemented FAA procedures aimed at improving the use of closely spaced parallel runways during poor weather, but the existence of that work also underscores that SFO’s capacity is not stable; it is regime-dependent in ways that can collide with match-day flight banks.
World Cup mobility planning often assumes that the U.S. has many airports and therefore can absorb shocks. In reality, the relevant factor for consideration is the set of interdependent metroplexes, especially the Northeast, and a handful of hub airports where delays propagate nationwide. The U.S. risk is not a single-airport collapse; it is multiday network unreliability that raises the probability of missed matches, forced itinerary changes, and crowding surges when thousands of fans rebook onto the same alternative flights.
The Geography Problem, Again
As mentioned above, FIFA’s match schedule confirms an event spanning three countries, 16 host cities, and 104 matches, with the U.S. hosting the majority across 11 cities from June 11 to July 19, 2026.[136] In contrast to compact World Cups, many plausible fan itineraries will be long-distance by design. Even within the U.S., a realistic follow-your-team path can require repeated trips of several hundred to a few thousand miles, depending on group placement and knockout progression.
The stress point will be that domestic aviation becomes the de facto backbone for many supporters, particularly for coast-to-coast or cross-region sequences. This is not merely a matter of inconvenience; it is an exposure to high-variance travel time including delay risk, high marginal cost such as peak fare pricing, and re-accommodation risk when storms or air traffic control constraints compress capacity. Amtrak provides a partial counterweight but only in specific corridors, especially in the Northeast. The rail system is growing and has posted record ridership, yet it remains capacity-constrained and geographically uneven; Amtrak reported 34.5 million customer trips in FY2025 and explicitly noted that an aging fleet constrains capacity expansion even as demand rises.[137]
The Northeast Corridor is the most meaningful rail alternative for World Cup mobility because it links dense host markets like Boston–New York and New Jersey–Philadelphia with downtown-to-downtown service.[138] But outside that corridor, the U.S. lacks a World Cup–scale high-frequency intercity rail network. In fact, it may be unrealistic to assume that fans would take a one- or two-day trip between New York and Los Angeles if such a ride were available. That means that even if federal and local agencies deliver strong local transit at stadiums, the middle layer—city-to-city movement—will still default heavily to aviation and, to some degree, highway travel, increasing the stakes of the air system stress points described above.
Comparative international context clarifies why geography is not just a planning inconvenience but a structural determinant of risk. Qatar 2022 was explicitly the most compact edition of the modern World Cup; key plans assumed that fans could reach stadiums within about an hour of central Doha, enabling high transit utilization and same-day movement between venues.[139] Peer-reviewed evaluation of Qatar’s tournament travel-demand management found large shifts toward metro use, including a reported 73% increase in metro ridership in one study, illustrating what is feasible when distances are short and transit is the default backbone.[140]
By contrast, Russia 2018—another expansive geography case—illustrates one mitigation tool that the U.S. largely lacks: centralized, ticket-linked intercity mobility support. The Russian government issued decisions to provide free rail travel for spectators between host cities via additional special trains, tied to match tickets/vouchers, and FIFA similarly framed Fan IDs as enabling free transport benefits.[141] Germany 2006, likewise, leaned heavily on national rail as a mobility provider and reported exceptionally high event-period passenger volumes on Deutsche Bahn.[142] The U.S. is pursuing a different model: market-priced aviation and decentralized rail/bus capacity, which is viable—but it shifts the equity and reliability burdens onto fans.
FIFA’s schedule creates predictable long-distance travel waves including group-to-knockout progressions, semifinal and final draws, but the U.S. has not (so far) paired that schedule with a transparent, nationwide plan for intercity surge capacity and consumer protection against itinerary collapse. Without such a plan, the tournament’s most global travel behaviors—following a team—may become disproportionately limited to affluent supporters or those with flexible work schedules and high tolerance for disruption.
Local Mobility and Stadium Access
Several U.S. host stadiums do have transit access in principle, but “transit-served” is not the same as “transit-sufficient for World Cup–scale peaks” (Table 12). Stadium access must be assessed for line-haul capacity (rail/bus frequency and load), last-mile pedestrian throughput and security screening queues, and post-match egress reliability when tens of thousands of fans attempt to leave within a narrow time window.
A practical way to distinguish readiness is to separate stadiums into tiers: stadiums with strong high-capacity urban adjacency include Philadelphia’s Lincoln Financial Field, served by SEPTA as part of a dense sports complex; and Seattle’s Lumen Field, reachable by Link light rail, Sounder trains, and several bus services.[143] These environments are better positioned to shift mode share away from private cars—if agencies fund the necessary frequency increases and crowd-management staffing.
TABLE 12
Transit Accessibility Grades for U.S. World Cup Stadiums
| Host City | Stadium (World Cup Name) | World Cup Capacity | Transit Grade | World Cup Parking Status | Primary Transit Mode | Nearest Station (to Stadium) | Station Dist. (miles) | Transit System Description | Federal World Cup Transit $ (Millions) | Car-Dependent? | World Cup Matches | Key Notes |
| Philadelphia | Lincoln Financial Field | 69,000 | A | Normal NFL parking available; SEPTA heavily promoted | Subway (SEPTA Broad Street Line) | NRG Station (at stadium) | 0 | SEPTA Broad Street Line — direct subway to Sports Complex, final stop | $8.50 | NO | 7 | Best transit access of any World Cup venue. Direct subway stop AT the stadium. SEPTA Broad Street Line runs straight from Center City. |
| Seattle | Lumen Field | 69,000 | A | No publicly available parking at stadium for WC | Light Rail (Link) | Stadium Station (at stadium) | 0.1 | Sound Transit Link Light Rail — downtown adjacent; airport connection. 4-min headways on match days. | $8.40 | NO | 5 | Downtown stadium with dedicated Link station. No public parking for WC. Sound Transit running 4-min headways. King County Metro adding 60 buses on match days. |
| Atlanta | Mercedes-Benz Stadium | 75,000 | A- | Standard event parking; MARTA promoted as primary | Heavy Rail (MARTA) | GWCC/ CNN Center Station (2-3 blocks) | 0.2 | MARTA Blue & Green Lines — direct from airport (20 min) and across metro | $9.40 | NO | 8 | MARTA provides airport-to-stadium transit. 2 stations within walking distance. Downtown location. $2.50 fare. |
| New York / NJ | MetLife Stadium | 82,500 | A- | No parking or tailgating on-site for World Cup. Limited $225 parking at American Dream mall. | Commuter Rail (NJ Transit) | Meadow-lands Station (at stadium) | 0.1 | NJ Transit from Penn Station; direct event trains + new bus terminal. Bus every 30 seconds planned. | $10.40 | NO | 8 | No on-site parking for World Cup. NJ Transit building new bus terminal at stadium. Direct event trains from Penn Station. Hosts the FINAL. |
| Houston | NRG Stadium | 72,000 | A- | Standard event parking available | Light Rail (METRORail Red Line) | NRG Park / Fannin South | 0.3 | METRORail Red Line — direct from downtown; limited metro coverage beyond central corridor | $9.10 | NO | 7 | Direct light rail to NRG Park from downtown Houston. METRORail only covers a narrow corridor — fans outside it need cars. |
| San Francisco | Levi's Stadium | 71,000 | B+ | Standard event parking available | Light Rail (VTA) + Commuter Rail (Caltrain) | Great America Station (0.5 mi) | 0.5 | VTA Light Rail + Caltrain + BART connections; stadium is in Santa Clara, not SF | $8.80 | NO | 6 | Reachable but requires transfers: BART→-Caltrain→VTA or drive. Stadium 45 mi from SF. SJC airport only 5 mi away. VTA hosted Super Bowl 60 transit successfully. |
| Boston | Gillette Stadium | 65,000 | B- | Restricted to ~5,000 spaces (down from ~20,000) due to expanded World Cup security perimeter | Commuter Rail (MBTA event trains) | Foxborough Station (at stadium) | 0.5 | MBTA commuter rail: up to 14 trains per match from South Station. New raised accessible platform built for WC | $8.70 | YES | 7 | Parking cut from 20K to 5K for World Cup. MBTA running up to 14 event trains per match (vs. 1 for Patriots games). 30 mi from Boston. New station platform built for World Cup. |
| Los Angeles | SoFi Stadium | 70,000 | C+ | Premium event parking; no direct rail access | Metro + Shuttle | Hawthorne/ Lennox Station (~2 mi) → shuttle | 2 | LA Metro C/K Line to Hawthorne/ Lennox, then WC shuttle bus. No direct rail to stadium. | $9.60 | YES | 8 | No direct rail. Requires Metro + shuttle transfer. LA Metro APM (People Mover) not operational by Jun 2026. LA committed to shuttle bus system. |
| Miami | Hard Rock Stadium | 65,000 | C+ | Standard event parking available; highway-dependent | Bus/shuttle only (no rail) | No rail station nearby | 5 | Miami Metrorail does NOT reach Miami Gardens. Rail + shuttle or bus on match days. | $8.70 | YES | 7 | No rail access. Located in Miami Gardens, far from Metrorail. Highway-dependent. Brightline available for intercity travel to/from Fort Lauderdale, Orlando. |
| Kansas City | Arrowhead Stadium | 73,000 | D | Standard event parking available; car-oriented complex | Bus (limited RideKC) | RideKC routes 47/29 (~10-15 min walk) | 1 | KC streetcar is downtown only — does not reach Arrowhead. RideKC bus limited. WC shuttles planned. | $8.60 | YES | 6 | No rail transit to stadium. KC streetcar doesn't reach Truman Sports Complex. RideKC buses routes 47 & 29 stop nearby. WC shuttles will be essential. |
| Dallas | AT&T Stadium | 94,000 | F | Standard event parking; no transit alternative | WC shuttle bus + charter bus from DART | No regular transit station | 8 | Arlington has NO public transit system. DART does not serve Arlington. WC shuttle buses from Dallas + special commuter train to Centerport with charter bus transfer. | $10.00 | YES | 9 | Worst transit of any World Cup venue. Arlington has no public transit. Charter buses from Dallas, special Fort Worth commuter train + bus transfer. Largest sta-dium (94k) + most matches (9). |
Other sites are transit-accessible but highly sensitive to service planning assumptions. MetLife Stadium depends on NJ Transit’s Meadowlands rail service on event days—an approach that can work but becomes a single point of failure if headways, platform management, or transfer nodes like Secaucus are not scaled for an international tournament with unfamiliar riders.[144] California’s Levi’s Stadium benefits from multi-operator connectivity, such as VTA light rail and Caltrain transfers, and already uses event-oriented fare products and late-night validity—useful building blocks for scaling.[145] Houston’s NRG Park/NRG Stadium is directly tied into MetroRail services, positioning it better than many U.S. suburban stadiums, but operational reliability still matters: Houston Metro has faced service disruptions requiring shuttle substitution in recent years, illustrating that maintenance and incident response are as relevant as route maps.[146]
Los Angeles’s SoFi Stadium demonstrates the core U.S. risk of transit served by shuttle. LA Metro’s own guidance for SoFi is explicit: fans connect via the Metro C Line to the LAX/Metro Transit Center and then use a free stadium shuttle running at high frequency around games.[147] This model is workable but is operationally fragile: it depends on bus staging space, traffic priority, and disciplined crowd control at transfer nodes. It also exposes capacity to roadway congestion, which is particularly acute in Los Angeles, one of the most congested U.S. metros by standard congestion indexes (Figure 5).[148]
Then there are stadiums where car dependence is structural. Kansas City’s Arrowhead notes bus service, including the RideKC on the 47 Broadway line, but the overall game plan framing remains parking-centered, signaling limited transit substitution capacity relative to a full stadium.[149] Arlington’s (Texas) AT&T Stadium sits in a region where fixed-guideway transit is not adjacent; even local circulators can be unavailable precisely when major events occur; the Arlington Trolley notes that fare-free service to the stadium is only on days when there are no major stadium events.[150] Miami’s Hard Rock Stadium illustrates the same pattern: it emphasizes rideshare, park & ride, and special shuttles, including Brightline-linked shuttles, rather than a direct rapid-transit station walk.[151]
When stadiums are parking-dependent, transportation becomes a policing and crowd-management problem as much as a mobility problem. Private-car surges create predictable chokepoints in interchange ramps, arterial intersections, and parking queue spillback, which can cascade into delayed entry, late kickoffs for many spectators, and higher risks of disorderly post-match egress—especially when international visitors are unfamiliar with local driving norms and parking systems. In these contexts, traffic management is not an add-on; it is a core security and an operational requirement.
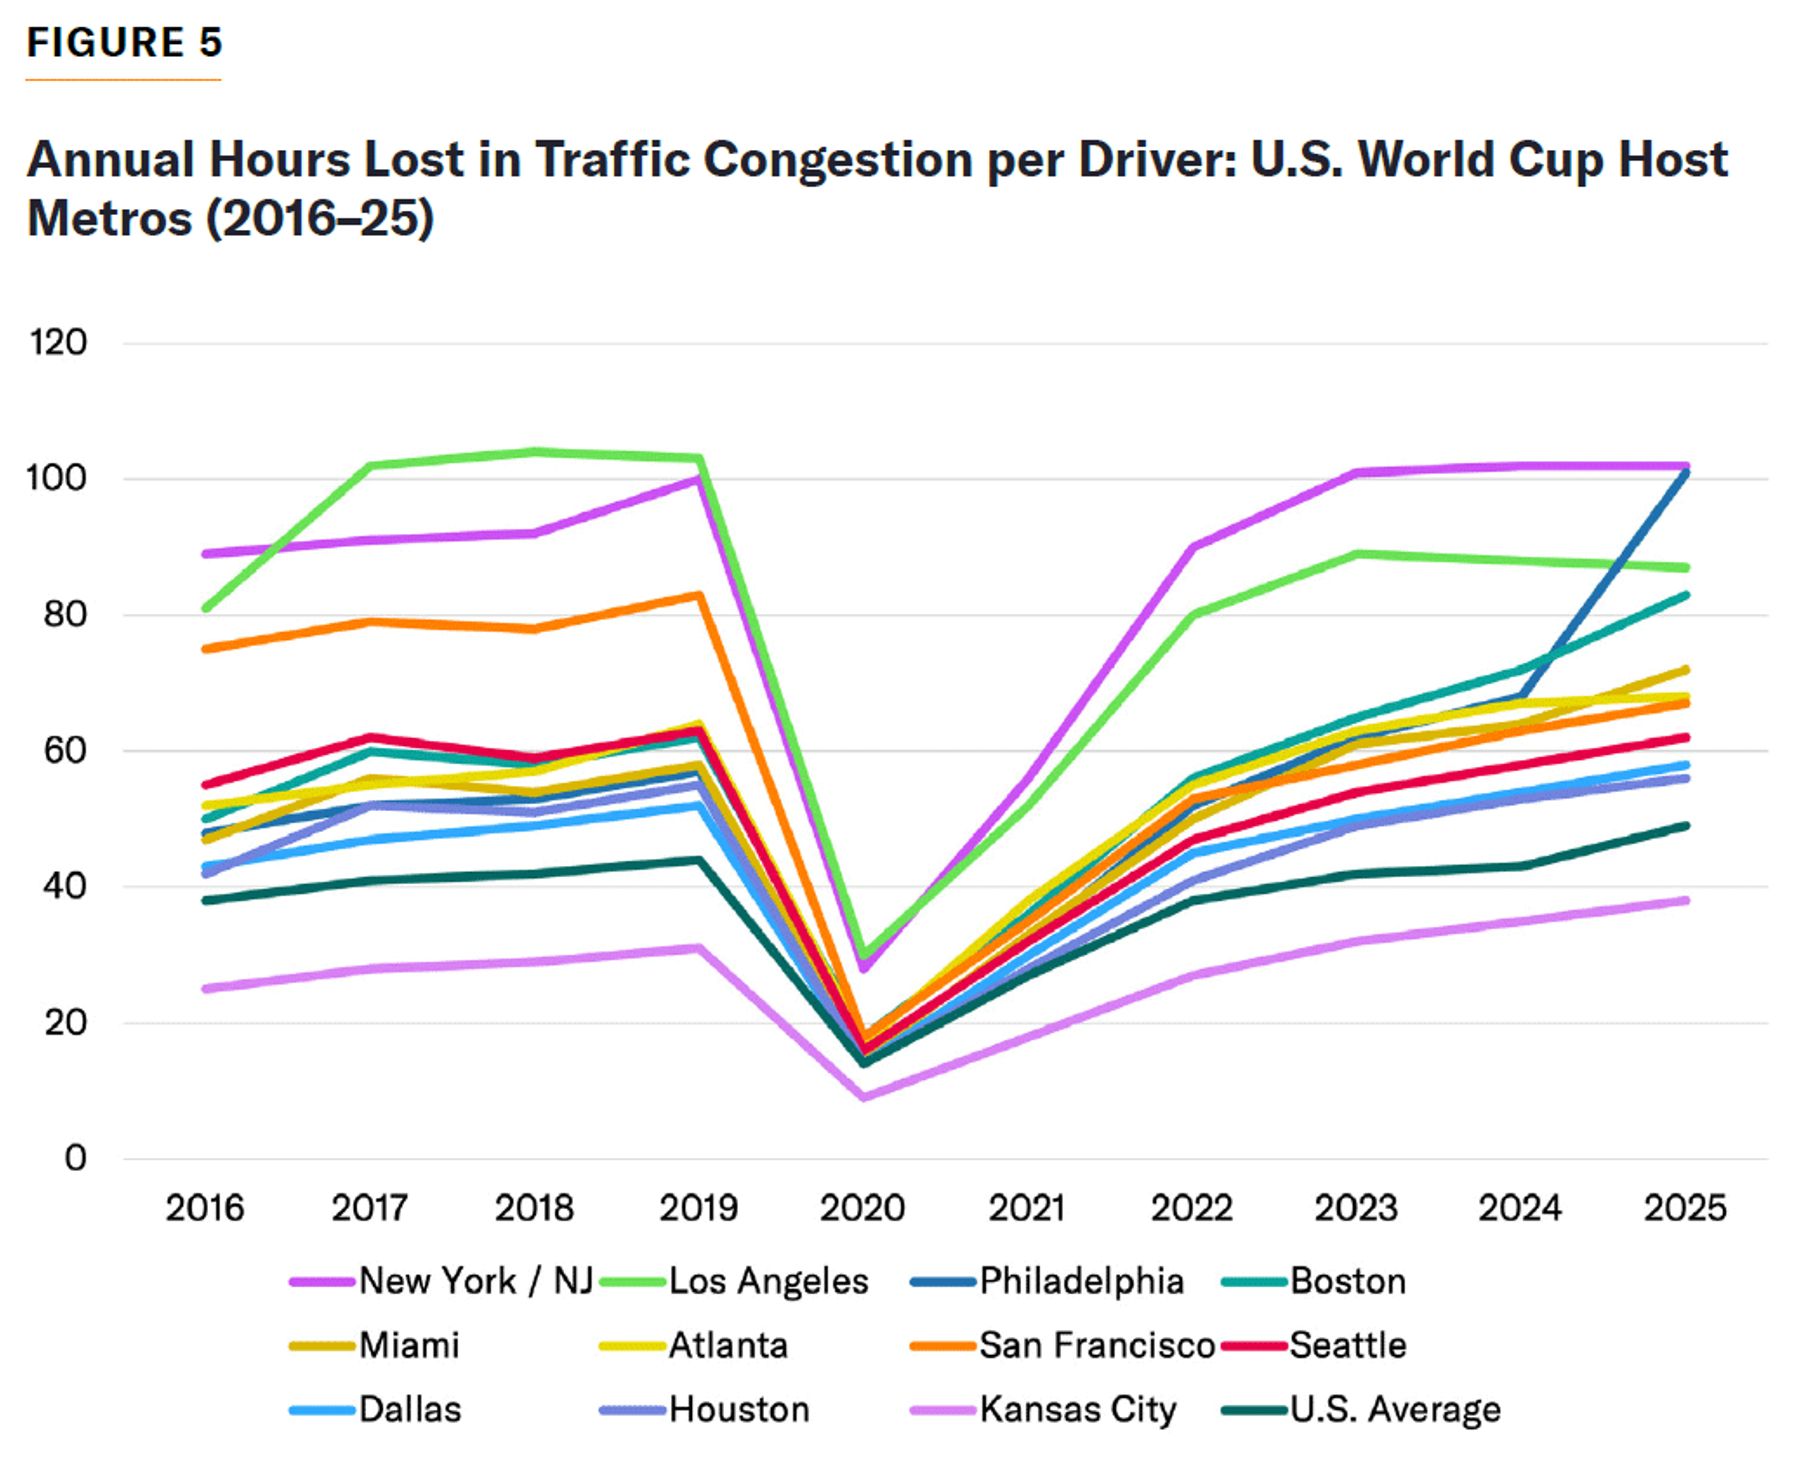
Until recently, many local World Cup transit plans were still at a conceptual stage, but federal funding announcements now create a window for operational upgrades. USDOT and FTA announced $100.3 million for public transportation support in U.S. host cities, which is not significant compared with the event size or investments from previous World Cup editions.[152] The accompanying federal FAQs clarify several readiness-relevant parameters: operating, planning, and capital expenses can be reimbursed; operating costs from June 1 to July 31, 2026, are explicitly considered in support of the World Cup; and the federal share is 100%, with no local match required.[153]
However, the same guidance limits what this funding can solve. It excludes Amtrak and charter-style or premium services that are not open to the general public; it is primarily a local transit operations tool, not a national intercity mobility program.[154] Scale also matters: $100.3 million across 11 U.S. host cities is helpful but not transformative when measured against the real costs of multi-week service expansions, overtime, contracted security, and bus fleet leasing. The funding should be treated as an enabler for targeted bottleneck relief—not as proof that last-mile readiness is assured.
New Jersey: What Not to Do Before the World Cup Begins
The New York/New Jersey plan illustrates a more specific readiness risk: even when a stadium is technically transit-accessible, the price and governance structure of that transit can undermine the host-city promise. NJ Transit originally announced that World Cup match-day round-trip rail tickets to MetLife Stadium would cost $150, compared with an ordinary New York Penn Station–Meadowlands round trip of about $12.90, with only 40,000 rail tickets available per match. Shuttle bus tickets are expected to cost $80, and most ordinary parking at MetLife will not be available, making public transit not merely an option but the central access system for many spectators.
Operationally, NJ Transit’s explanation is straightforward: the agency estimates tens of millions of dollars in special-event costs, including security, staffing, crowd control, and service changes, while FIFA has not agreed to directly absorb the gap. But politically, the optics are damaging. A fare that is nearly 12 times the ordinary price turns a public-transit solution into a quasi-premium event surcharge, weakening the argument that transit can make the tournament more accessible, affordable, and orderly. It also creates a distributional problem: higher-income visitors may absorb the charge as part of an expensive World Cup itinerary, while working-class fans, families, and local residents face a much steeper barrier before even reaching the stadium.
The controversy also exposes the limits of the U.S. host-city model. In a more integrated mega-event system, match tickets, transit fares, and event operations can be bundled into one customer-facing mobility plan. By contrast, the MetLife case shows a fragmented arrangement in which FIFA controls the event, the host committee coordinates local delivery, NJ Transit bears much of the operational burden, and riders are asked to cover costs through a highly visible fare hike. That structure may be fiscally defensible from NJ Transit’s perspective, but it is poor event design: it shifts a governance failure into the hands of individual fans and turns stadium access into a public controversy before the tournament begins.
For World Cup readiness, the lesson is not simply that the $150 fare was unpopular—so unpopular, in fact, that New Jersey backtracked as the Cup began, lowering the fare to $98. The deeper issue is that last-mile mobility cannot be evaluated only by whether trains or shuttles exist. It must also be evaluated by whether the service is affordable, predictable, legible to foreign visitors, and politically sustainable. If fans perceive official transit as overpriced or capacity-constrained, more will attempt workarounds—rideshares, informal drop-offs, illegal taxis, or complex car trips—which could increase congestion and complicate perimeter security. In that sense, the NJ Transit fare dispute is a warning sign for the entire U.S. tournament: without clear cost-sharing and integrated mobility governance, even a nominally transit-served venue can become a stress point for affordability, crowd management, and public trust.
Lodging Capacity, Affordability, and Regulatory Friction
If the baseline is that enough beds exist to host the World Cup, that might be plausible at the national level, but there is immense variation at the local level (Table 13). Constraints include geography, distance from venues and fan zones, and variations in price. Large metros clearly have substantial hotel inventory. New York City’s official tourism organization reports that hotel accommodations averaged more than 120,000 rooms in active inventory across the year in its accounting, with citywide occupancy averaging 81.6% and room nights sold reaching 36.1 million.[155] These are the metrics of a market that is already tight during peak periods before adding World Cup demand.
TABLE 13
Rooms vs. Required Beds by City
| Host City | State | Stadium | World Cup Stadium Capacity | # of World Cup Matches | Metro Hotel Rooms | STR / Airbnb Units | Total Available Accom. Units | Baseline Hotel Occupancy | Rooms Available (After Baseline Occ.) | Total Avail. Beds (After Baseline Occ. + STR) | Conservative Est. Visitors per Match Day | Scenario A Beds Needed (1.5 beds/visitor) | Scenario B Beds Needed (2.0 beds/visitor) | Shortfall/Surplus Scenario A (1.5 beds/visitor) | Shortfall/Surplus Scenario B (2.0 beds/visitor) | Assessment (Scenario A) |
| New York / New Jersey | NJ | MetLife Stadium | 82,500 | 8 | 118,000 | 3,500 | 121,500 | 85.00% | 17,700 | 21,200 | 123,750 | 185,625 | 247,500 | -164,425 | -226,300 | CRITICAL |
| Los Angeles | CA | SoFi Stadium | 70,000 | 8 | 115,000 | 32,000 | 147,000 | 80.00% | 23,000 | 55,000 | 105,000 | 157,500 | 210,000 | -102,500 | -155,000 | CRITICAL |
| Dallas / Arlington | TX | AT&T Stadium | 94,000 | 9 | 90,000 | 22,000 | 112,000 | 72.00% | 25,200 | 47,200 | 141,000 | 211,500 | 282,000 | -164,300 | -234,800 | CRITICAL |
| Houston | TX | NRG Stadium | 72,000 | 7 | 107,000 | 15,000 | 122,000 | 59.00% | 43,870 | 58,870 | 108,000 | 162,000 | 216,000 | -103,130 | -157,130 | CRITICAL |
| Atlanta | GA | Mercedes-Benz Stadium | 75,000 | 8 | 113,000 | 18,000 | 131,000 | 70.00% | 33,900 | 51,900 | 112,500 | 168,750 | 225,000 | -116,850 | -173,100 | CRITICAL |
| Miami | FL | Hard Rock Stadium | 65,000 | 7 | 65,000 | 25,000 | 90,000 | 76.00% | 15,600 | 40,600 | 97,500 | 146,250 | 195,000 | -105,650 | -154,400 | CRITICAL |
| Philadelphia | PA | Lincoln Financial Field | 69,000 | 7 | 50,000 | 8,000 | 58,000 | 73.00% | 13,500 | 21,500 | 103,500 | 155,250 | 207,000 | -133,750 | -185,500 | CRITICAL |
| Boston / Foxborough | MA | Gillette Stadium | 65,000 | 7 | 42,000 | 6,000 | 48,000 | 78.00% | 9,240 | 15,240 | 97,500 | 146,250 | 195,000 | -131,010 | -179,760 | CRITICAL |
| San Francisco Bay Area | CA | Levi's Stadium | 71,000 | 6 | 60,000 | 10,000 | 70,000 | 74.00% | 15,600 | 25,600 | 106,500 | 159,750 | 213,000 | -134,150 | -187,400 | CRITICAL |
| Seattle | WA | Lumen Field | 69,000 | 6 | 38,000 | 7,000 | 45,000 | 76.00% | 9,120 | 16,120 | 103,500 | 155,250 | 207,000 | -139,130 | -190,880 | CRITICAL |
| Kansas City | MO | Arrowhead Stadium | 73,000 | 6 | 40,000 | 5,000 | 45,000 | 65.00% | 14,000 | 19,000 | 109,500 | 164,250 | 219,000 | -145,250 | -200,000 | CRITICAL |
| TOTAL / WEIGHTED AVG | 805,500 | 79 | 838,000 | 151,500 | 989,500 | 73.70% | 220,730 | 372,230 | 1,208,250 | 1,812,375 | 2,416,500 | -1,440,145 | -2,044,270 |
Boston’s lodging indicators tell a similar story on rates: data published by Meet Boston shows an average daily rate (ADR) of $293 for year-end 2024 and comparable monthly-rate patterns continuing into 2025.[156] Miami’s tourism bureau has indicated that the region has about 65,000 hotel rooms—substantial but also subject to seasonal peaks and major-event surges.[157]
World Cup demand is not evenly distributed. It spikes around match days, creates short booking windows when teams and fans learn their paths, and concentrates in submarkets near stadiums (or near convenient transit to stadiums). This is where “gross supply” can be misleading. A metro may have many hotel rooms, but if the stadium sits far from the primary hotel clusters—or if transit between them is weak—then the usable supply for typical fans contracts sharply.
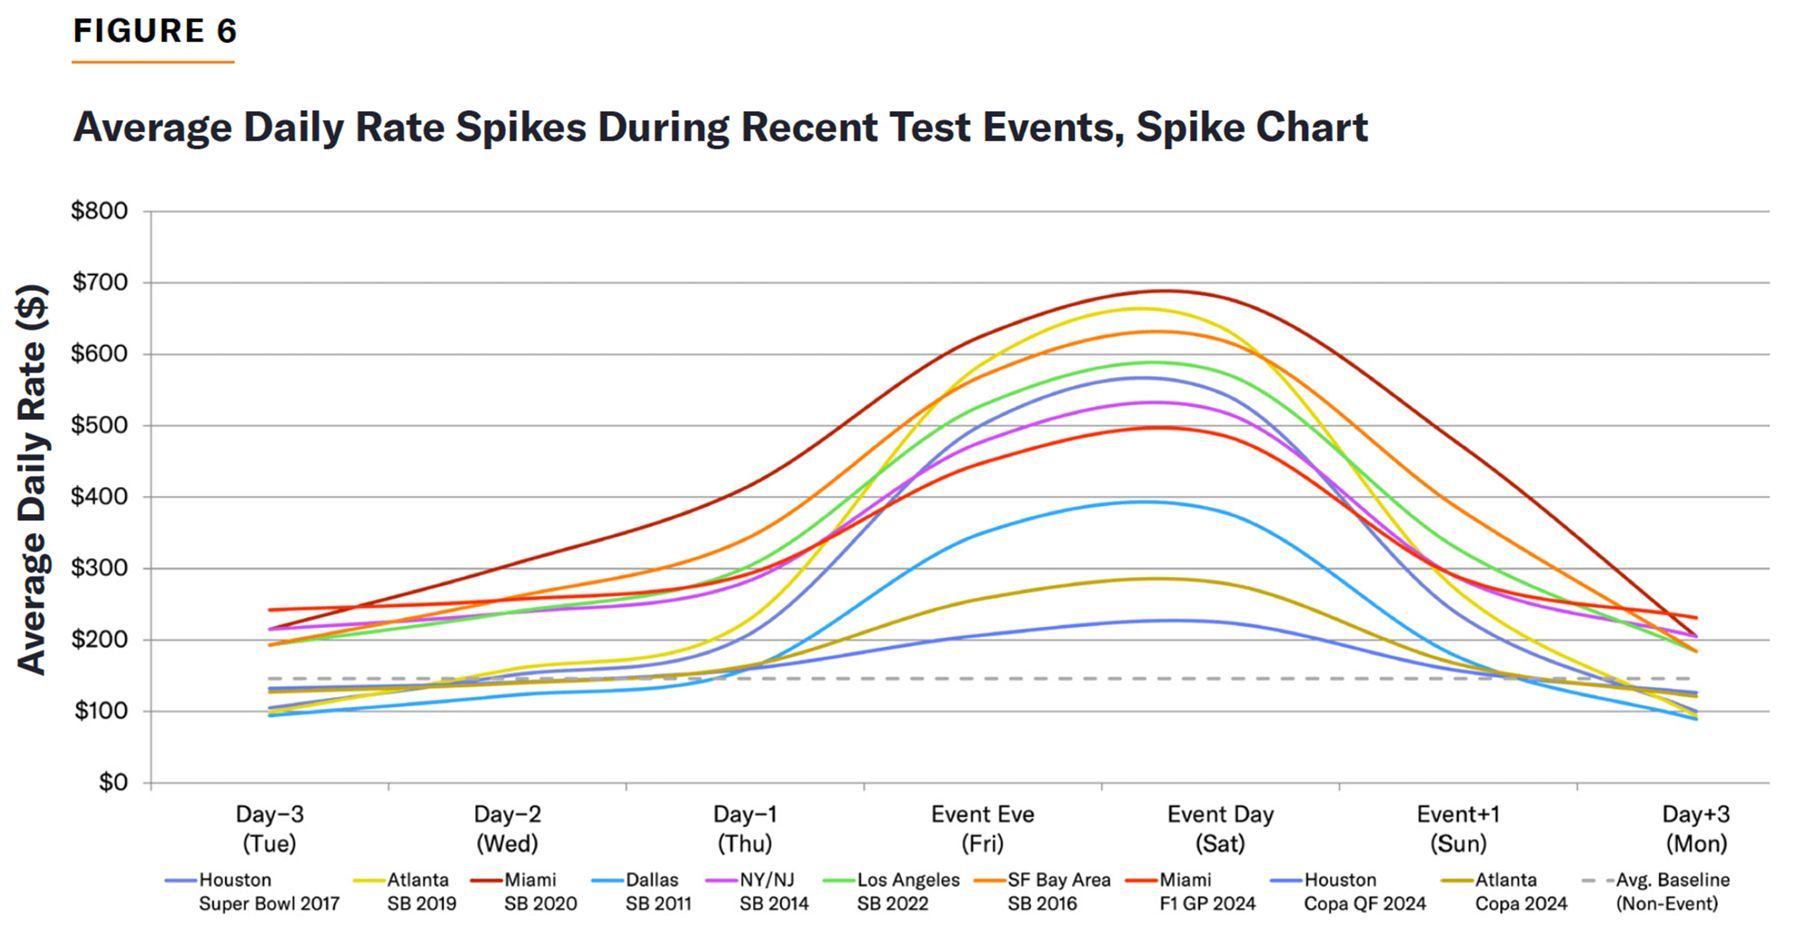
Figure 6 shows that major sporting events create a sharp, short-lived hotel-price shock in host cities. ADRs rise modestly in the days leading up to the event, and then spike dramatically on the event eve and event day before falling back toward baseline almost immediately afterward. The steepest increases are associated with Super Bowls: Atlanta, Miami, Houston, San Francisco, and Los Angeles all show event-day ADRs several times higher than their pre-event levels. By contrast, Copa América and other soccer-related events still raise rates, but the increase is generally more moderate, mainly because of their size and popularity within the American sports.
However, when we compare event-weekend ADRs with non-event baselines across recent marquee events in U.S. World Cup host cities, the trend is similar. Super Bowls produced the largest price effects, with ADR increases ranging from roughly 70% in New York/New Jersey to 250% in Atlanta. Miami’s Super Bowl weekend stands out in dollar terms, with ADR rising from about $195 to $559, while San Francisco and Houston also recorded large absolute increases. Other events, such as Copa América matches, Formula 1, NFL Draft, and college football games, produced smaller but still meaningful increases, typically in the 30%–70% range.
The main takeaway is that large sports events can generate concentrated lodging affordability pressures, especially in cities already facing constrained hotel or short-term rental (STR) supply. The World Cup may differ from one-off events because it will last several weeks and affect several host cities simultaneously, meaning that price pressure could be more sustained than the weekend spikes shown here. This suggests that host-city planning should treat lodging costs not only as a tourism-market issue but also as a consumer protection, visitor access, and local-capacity concern.
Industry forecasting underscores that the biggest demand swings can occur in smaller host markets or leisure destinations where baseline capacity is not designed for global crowds. CoStar reporting on a Tourism Economics assessment flagged New York, Kansas City, and Los Angeles among those with conditions for outsize World Cup demand impacts.[158] Oxford Economics/Tourism Economics has similarly forecast incremental hotel-room revenues associated with the World Cup rising meaningfully (with June 2026 increases in room rates), reinforcing that lodging stress will be concentrated rather than uniform.[159]
Regulatory friction matters because it determines elasticity—how quickly accommodation supply can expand when hotels sell out. Many U.S. host cities restrict STRs in ways that protect housing stock but reduce surge capacity: New York City’s Local Law 18 requires hosts to register and prohibits booking platforms from processing transactions for unregistered STRs, effectively narrowing legal STR supply during peak events.[160] Los Angeles restricts home-sharing to primary residences, with registration and enforcement mechanisms designed to prevent wholesale conversion of housing into de facto hotels.[161] Boston similarly limits STR eligibility to owner-occupied conditions and requires registration.[162] San Francisco requires hosts to be permanent residents (with a specified residency threshold) and operates under a formal STR ordinance framework.[163] Philadelphia’s rules require licensing/permits to operate STRs.[164]
TABLE 14
Short-Term Rental Regulatory Restrictiveness and Lost Capacity
| Host City | State | Regulatory Tier | Restrictiveness Score (1=Ban, 4=Permissive) | Key Law/Ordinance | Pre-Regulation STR Units | Current Legal STR Units | Units Lost to Regulation | % STR Cap. Lost | Primary Residence Required? | Night Cap? | World Cup Impact Assessment |
| New York/ New Jersey | NY/NJ | BAN (De Facto) | 1 | NYC Local Law 18 (Sep 2023) | 38,500 | 3,000 | 35,500 | 92.20% | YES | NO | SEVERE |
| Los Angeles | CA | STRICT CAP | 2 | LA Home-Sharing Ordinance (2019, updated 2024) | 45,000 | 32,000 | 13,000 | 28.90% | YES | YES | MODERATE |
| Dallas/ Arlington | TX | MODERATE | 3 | Dallas STR ban in single-family zones (2023) — ENJOINED by court | 25,000 | 22,000 | 3,000 | 12.00% | YES | NO | LOW |
| Houston | TX | PERMISSIVE | 4 | Houston Hotel & Motel Ordinance; new STR ordinance effective 2026 | 16,000 | 15,000 | 1,000 | 6.30% | NO | YES | LOW |
| Atlanta | GA | STRICT CAP | 2 | Atlanta Short-Term Rental Ordinance (updated 2022) | 22,000 | 18,000 | 4,000 | 18.20% | YES | NO | MODERATE |
| Miami | FL | MODERATE | 3 | Miami-Dade zoning rules; FL DBPR state license required | 28,000 | 25,000 | 3,000 | 10.70% | NO | NO | MODERATE |
| Philadelphia | PA | MODERATE | 3 | Philadelphia Rental License + Zoning Rules | 10,000 | 8,000 | 2,000 | 20.00% | NO | NO | MODERATE |
| Boston / Foxborough | MA | STRICT CAP | 2 | Boston Short-Term Rental Ordinance (2019) | 9,000 | 6,000 | 3,000 | 33.30% | YES | NO | MODERATE-HIGH |
| San Francisco Bay Area | CA | STRICT CAP | 2 | SF Office of Short-Term Rentals; 90-day unhosted cap | 14,000 | 10,000 | 4,000 | 28.60% | NO | YES | MODERATE |
| Seattle | WA | MODERATE | 3 | Seattle Short-Term Rental Ordinance (2019, updated) | 8,500 | 7,000 | 1,500 | 17.60% | NO | NO | LOW-MODERATE |
| Kansas City | MO | PERMISSIVE | 4 | KC STR Ordinance; new 'Major Event' STR category (2025) | 5,500 | 5,000 | 500 | 9.10% | NO | YES | LOW regulatory risk but HIGH capacity risk |
Table 14 classifies the 11 U.S. World Cup host cities by how restrictive their STR rules are and estimates how much STR capacity has been removed by those regulations. The most restrictive market is New York/New Jersey, where NYC’s Local Law 18 has created a de facto ban on many STRs: legal STR supply falls from an estimated 38,500 pre-regulation units to about 3,000 current legal units, a 92.2% capacity loss. That makes New York/New Jersey the clear outlier and the only city marked as facing a severe World Cup impact.
Several other host markets fall into a “strict cap” category, including Los Angeles, Atlanta, Boston/Foxborough, and the San Francisco Bay Area. These cities generally require registration, impose primary-residence rules or night caps, and have lost 18%–33% of estimated STR capacity. Boston/Foxborough appears most constrained within this group, with a 33.3% capacity loss, followed by Los Angeles and San Francisco, at just under 30%. These cities may not face the same acute shortage as New York, but their regulatory frameworks could limit the ability of STR supply to expand during peak World Cup demand.
By contrast, Dallas/Arlington, Houston, Miami, Philadelphia, Seattle, and Kansas City appear less exposed to regulatory bottlenecks, though for different reasons. Houston and Kansas City are classified as permissive, with relatively small estimated capacity losses of 6.3% and 9.1%, respectively, while Dallas/Arlington benefits from a court injunction that has blocked stricter enforcement. Lodging pressure during the World Cup will not be uniform across host cities: places with strict primary-residence requirements or effective bans may experience more severe price and availability constraints, while more permissive cities are better positioned to absorb visitor demand through STR supply.
These rules are defensible housing policy. But for the World Cup, they are also a readiness variable: constrained STR elasticity increases the probability that lodging demand spills into long commutes, cross-border stays (e.g., New Jersey for New York matches), and very high ADRs for remaining hotels.
U.S. lodging readiness discussions often stop at inventory counts, but the more decisive question is whether host cities have a credible pipeline of rooms that will actually open before June 2026, as well as an operational plan to make non-hotel beds (dorms, universities, legally compliant STRs, and other temporary inventory) geographically usable through shuttles and late-night transit. As of May 2026, public, comparable, city-by-city pipeline and “usable supply near venue” datasets were uneven—making it easy for optimistic projections to persist without rigorous stress testing.
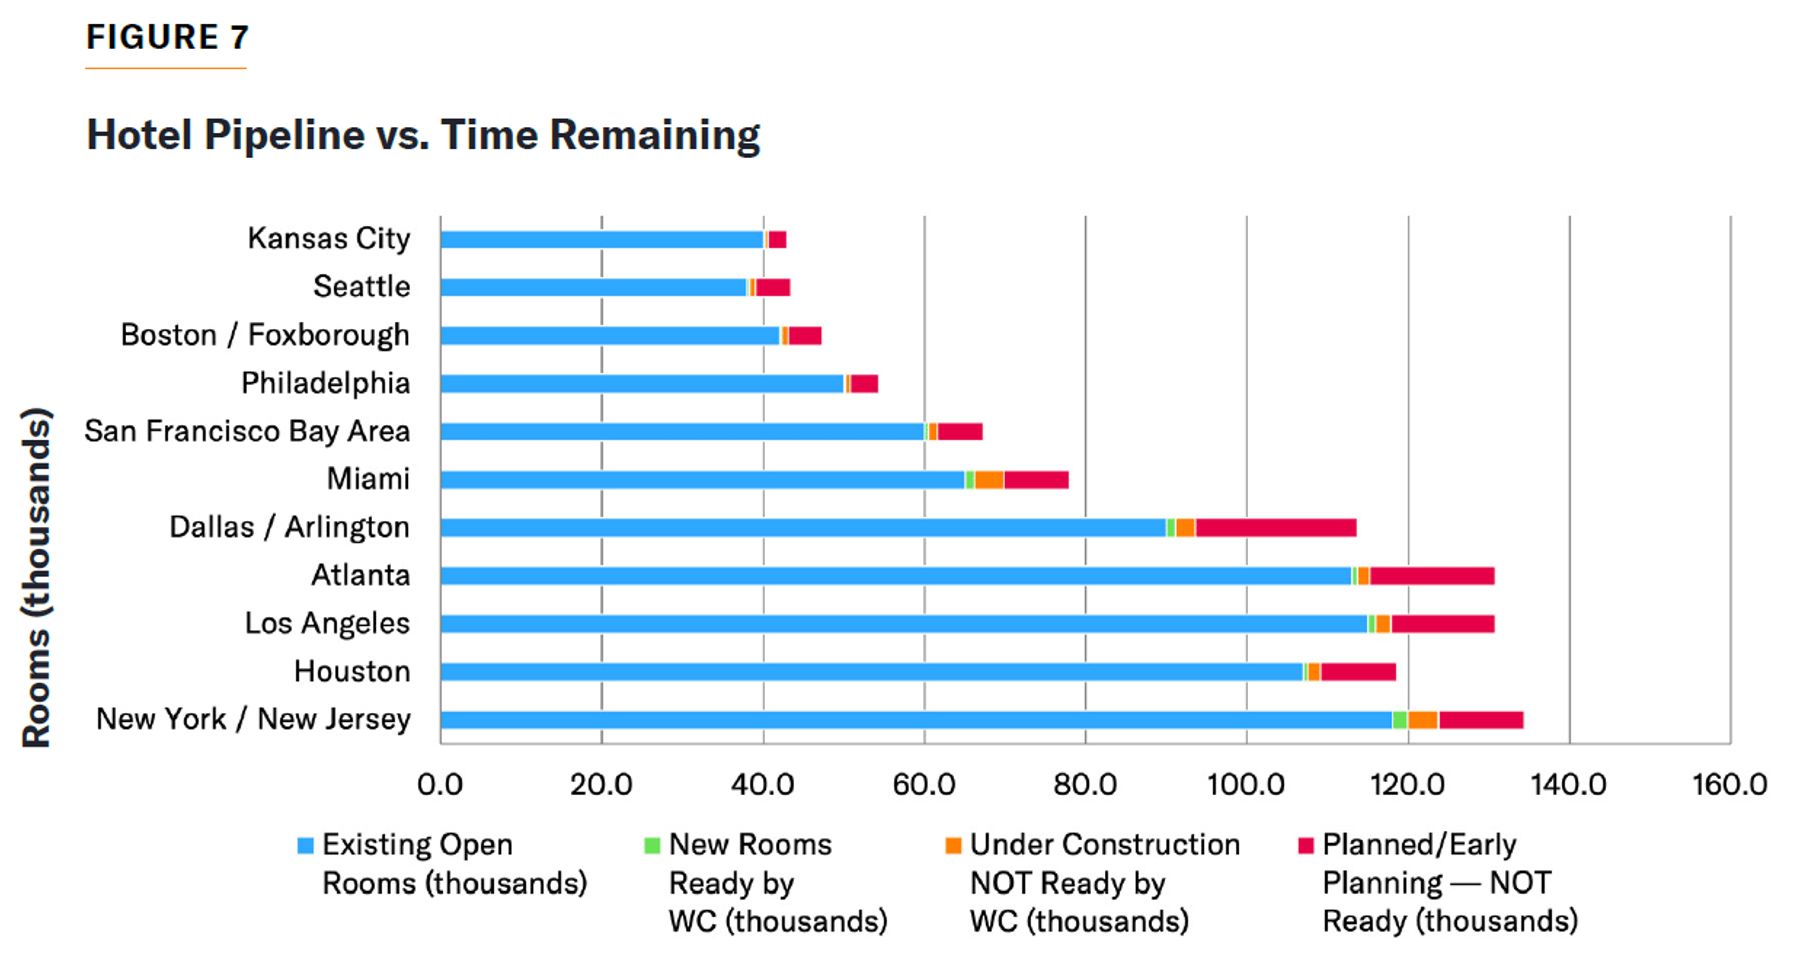
Hotel construction will do little to ease World Cup lodging pressure by June 2026. Across U.S. host cities, the overwhelming majority of rooms in the development pipeline are still under construction or only in planned/early planning stages and are thus unlikely to open before the tournament begins (Figure 7). Even in large pipeline markets like Dallas, Atlanta, New York/New Jersey, Los Angeles, and Miami, only a small portion of new rooms is expected to be available in time.
Host cities cannot rely on new hotel supply to absorb World Cup demand. Most markets will have to depend primarily on existing hotel inventory, STRs, and regional spillover capacity. This makes lodging availability, transportation links to nearby hotel markets, and STR regulatory flexibility especially important for tournament planning.
Policy Lessons for Host Cities
The central lesson for host cities is that formal coordination is not enough where operational authority is diffuse. Host committees are usually conveners, not commanding authorities; transit agencies, airport authorities, police departments, utilities, emergency managers, and private venue operators all retain their own chains of command, budgets, staffing limits, and service rules. That structure is manageable in ordinary times, but it becomes a liability when thousands of visitors must move through the same corridors at the same hours and when a delay in one system can quickly degrade another.
Mega-event host cities should therefore establish an event-time operating model that assigns a single lead executive for integrated delivery. They should also name deputy leads for mobility, public safety, infrastructure, and public information. And host cities should predetermine the threshold for when agency autonomy gives way to unified command. Los Angeles is the clearest example: SoFi Stadium’s shuttle-dependent access model and the uncertainty around the LAX Automated People Mover show why project sponsors, airport operators, Metro, the city, Inglewood, and public-safety agencies cannot simply “coordinate” in parallel and hope the seams hold.
Second, host cities should treat mobility as the main public-facing test of competence. “Transit-served” is not the same as “transit-sufficient.” A station on a map does not solve line-haul limits, transfer friction, curb congestion, last-mile walking flows, security-screening queues, or post-match egress. Some venues benefit from strong high-capacity transit adjacency, while others still depend on shuttles, parking, rideshare, or multi-transfer itineraries. The policy response is not simply to add vehicles. Cities should publish a single mobility plan for each venue that combines airport-arrival guidance, hotel-to-stadium trip chains, transit headways, shuttle staging, rideshare geofences, drop-off rules, pedestrian routing, and post-match egress. That plan should be built for unfamiliar international users, not for local regulars. Where shuttle transfers remain unavoidable, cities should give those transfers the same priority treatment they would give a rail line: dedicated staging, protected lanes, queue marshals, multilingual wayfinding, and hard limits on curb conflicts.
Third, cities should price and manage last-mile access to maximize compliance, not short-term revenue recovery. The New Jersey fare controversy is important not only because of the price itself but because it shows how quickly a fragmented cost-sharing model can convert a transportation solution into a legitimacy problem. If official options are perceived as overpriced, confusing, or unreliable, fans will route around them through informal drop-offs, illegal taxis, unplanned rideshare pickups, and unauthorized pedestrian approaches. That is not merely a transportation inconvenience; it expands the security perimeter, worsens congestion at exactly the wrong nodes, and undermines the city’s ability to predict flows. Host cities should negotiate event-time fare policy early, define who subsidizes extraordinary operating costs, and ensure that the official route is clearly the simplest and cheapest compliant option. In practice, cities should prefer integrated ticket-transit bundles, capped event fares, or explicit public subsidy over highly visible event surcharges that shift governance failure onto individual riders.
Fourth, host cities should plan for partial failure, not ideal execution. The real vulnerability often lies in projects or systems that appear adequate but are fragile at peak: airports with construction staging, stadiums dependent on bus transfers, transit corridors that work until a single transfer node overloads, and utilities that are reliable on normal days but vulnerable during heat stress.
This is especially relevant for Los Angeles, where the LAX Automated People Mover could reduce airport congestion but should not be treated as a guaranteed substitute for contingency planning. Cities should therefore adopt a formal degraded-operations doctrine. For every critical route, station, airport-terminal interface, and venue access point, agencies should pre-approve fallback service plans, reserve bus fleets and tow assets, portable barriers and signage, backup power and communications, and temporary staffing rosters. The correct planning question is not whether the primary plan works, but what the city will do in the first 15, 30, and 60 minutes after the primary plan degrades.
Fifth, cities should merge cyber, utility, and public-safety planning into one resilience program. Cyber risk is not a separate technical annex; it is embedded in ticketing, transit control, hotel operations, communications, power, and crowd management. Likewise, heat and power stress can quickly spill into airport systems, rail signaling, traffic management, cellular service, and water operations. Host cities should stop planning these as separate disciplines. Instead, they should run joint failure scenarios that assume a mobility disruption may begin as a cyber incident, a heat emergency may become a crowd-control problem, and a power fluctuation may immediately become a communications and wayfinding failure. At minimum, each city should identify a cross-sector resilience cell with authority to pull together utility operators, cyber teams, transit operations, public safety, and venue management into one common operating picture and one incident log.
Sixth, lodging should be managed as part of transportation policy, not as a separate tourism issue. Gross room counts are misleading, and constrained short-term-rental elasticity can turn a large metro into a difficult host if usable rooms are far from venues or poorly connected by late-night transit. This is particularly important in markets where stadiums sit far from the dominant hotel core, where short-term-rental regulation is tighter, or where match-day travelers may spill into neighboring jurisdictions. Cities should therefore build a “usable lodging” map rather than relying on aggregate inventory. That map should identify hotel and legal short-term-rental clusters by transit corridor, estimate realistic late-night return options after matches and fan events, and trigger supplemental shuttle or overnight service where lodging supply is available but operationally disconnected. In effect, lodging policy for a mega-event is access policy: a room that exists but cannot be reliably reached at midnight is not fully usable supply.
Finally, funding should arrive early enough to shape operations, and it should be tied to accountability for execution. Late or uncertain funding narrows local choices and pushes agencies toward improvisation. Federal transit support helps, but the broader lesson is that host cities need earlier certainty on operating funds for overtime, bus leasing, traffic control, communications systems, fan-zone staffing, and mutual aid. Going forward, cities and host committees should use formal spend plans and decision gates: what funding must be obligated now, what capability it buys, who owns delivery, and what fallback is triggered if funds slip. Event-time readiness improves when money is attached to discrete outputs rather than broad promises. That is particularly important where local staffing shortages are already binding and where missed funding windows immediately affect hiring, training, and service procurement.
Conclusion
The 2026 FIFA World Cup will be a stress test of U.S. capacity to host a global event at continental scale. America has enormous advantages: large stadiums, deep hotel and aviation markets, mature law-enforcement institutions, extensive private-sector event experience, and a level of national wealth that previous hosts could not always assume. Those advantages make a basic operational failure unlikely. The matches will almost certainly take place, the stadiums will be full, and most visitors will complete their trips without major incident.
But the more important standard is not whether the tournament happens; it is whether the U.S. can convert its assets into a coherent visitor experience. This report’s findings point to the same pattern across immigration, infrastructure, security, transportation, and lodging: national capacity is large, but localized bottlenecks are real; formal authority is distributed, but tournament demand is synchronized; and many of the most consequential risks appear at interfaces where no single agency naturally owns the full problem. A visa delay at a priority consulate, a thunderstorm-driven airport disruption, an overpriced official transit route, a perimeter breakdown, a ransomware incident, or a sudden lodging shortage would not necessarily stop the tournament. Yet any one of those factors could damage the fan experience, strain public resources, and weaken the soft-power value of hosting.
A successful World Cup would show that the U.S. can coordinate across various levels of government, geography, and private-sector complexity without needing the centralized command model of smaller or more authoritarian hosts. A weaker tournament would show the opposite: that American abundance can be undercut by fragmentation. The country still has enough time to improve the outcome, but the window for broad promises has closed. The remaining task is execution.
About the Author
Santiago Vidal Calvo is a Cities policy analyst at the Manhattan Institute, working primarily on government accountability and transparency through MI’s Freedom of Information Law (FOIL) efforts. He deploys open-records requests in New York, California, and other states to secure and analyze data that reveal inefficiency, illuminate policy outcomes, and empower citizens to hold public officials to account. He also works on immigration research, assessing how visa, asylum, and enforcement policies influence urban labor markets and civic integration, and providing data-driven recommendations that reconcile economic and security needs. His commentary ranges across government efficiency, urban policy, immigration, ideological influence, national security, and foreign policy.
Born in Caracas, Venezuela, Vidal Calvo immigrated to the United States in 2021. He earned a B.A. in political science and economics from Fordham University in 2023 and a Master of Public Policy from Georgetown University’s McCourt School of Public Policy in 2025, where he was a Tech & Public Policy Scholar from 2023 to 2025. He is currently pursuing a Ph.D. in political science at Texas A&M University’s Bush School of Government and Public Service. He completed the Stand Together Fellowship’s Koch Associate Program in 2026 and served as a Spring 2026 Young Voices Contributor.
Vidal Calvo’s writing has appeared in the New York Post, City Journal, UnHerd, National Review, USA Today, The Hill, The Daily Wire, RealClearPolitics, RealClearPolicy, RealClearDefense, The Spectator, El Espectador Colombia, and Caracas Chronicles.
Acknowledgements
This report would not have been possible without the support of many people over the last six months. I am especially grateful to Matias Ahrensdorf, web developer, for his incredible data skills and countless hours helping with data analysis, visualizations, and graphs throughout this project. His contributions significantly improved the quality of this report. I would also like to thank Nicole Gelinas, senior fellow, and John Ketcham, director of Cities, for their guidance, feedback, and support from start to finish. Finally, thank you to the Collegiate Associates who assisted with data collection and citation checking. Their careful work helped ensure the accuracy and reliability of this report.
Endnotes
Are you interested in supporting the Manhattan Institute’s public-interest research and journalism? As a 501(c)(3) nonprofit, donations in support of MI and its scholars’ work are fully tax-deductible as provided by law (EIN #13-2912529).