Understanding How Proportional Representation Might Work in New York City

Photo by Gary Hershorn/Getty Images
Executive Summary
On May 28, Mayor Zohran Mamdani announced the creation of a Charter Revision Commission (CRC), called the Commission on Government Efficiency, with a mandate to make government work better.[1] The CRC has an opportunity to address the democratic deficit produced by the city's current electoral rules, which recent reforms—including ranked-choice voting (RCV)—have not resolved.
The council’s single-seat districts disadvantage voters who are politically aligned but geographically dispersed. In recent New York City elections, right-leaning voters have been particularly affected by this "proportionality problem.” Right-of-center parties earned over a fifth of votes in the 2025 council elections but won only a tenth of seats, as their voters were spread too thinly across single-seat districts to translate into wins. Such dilution can make the council less reflective of the electorate’s preferences.
At the same time, because the decisive contest in most council races is a low-turnout Democratic Party primary, insurgent factions often compete for control of Democratic nominations instead of presenting themselves separately to voters as parties in the general election. Though only registered Democrats may participate in the closed primary, the Working Families Party nonetheless endorsed 23 winning council candidates in Democratic primary races. This “party-weakness problem” gives organized factions outsized influence over the composition of the council.
In short, New York City already has a de facto multiparty system. Despite reforms like RCV, its electoral rules channel political competition into lower turnout, intra-party factional fights, rather than contests between distinct parties in the general election.
Proportional representation (PR) offers a way to address these issues. PR systems allow parties to aggregate their votes over larger areas and convert each party’s share of the vote into a corresponding share of council seats. PR also might let New York City’s three political groups—socialist Democrats, establishment Democrats, and a Republican/ Conservative bloc—present themselves to voters as distinct entities, moving political competition from party primaries to the general election.
This paper uses the results of the 2025 council races to simulate outcomes under two types of PR: open-list proportional representation (OLPR) and mixed-member proportional (MMP).
Under OLPR, voters select from among candidates nominated by political parties. Each district (the five boroughs) produces multiple winners in proportion to each party’s share of the vote. MMP would retain the council’s current 51 single-seat districts but would achieve proportionality by adding an additional 20 council seats, which are then allocated to align each party’s overall seat share with its total vote share.
The results show that OLPR and MMP could bring each group’s seat share closer to its vote share without dramatically changing who gets elected. Simulated OLPR elects 47 of 51 candidates who win under the current single-seat rules. Simulated MMP elects all single-seat winners and generates party-proportional outcomes using 20 new seats allocated citywide. Readers can explore the simulations and vary their parameters in an online dashboard.[2]
Introduction
In 2019, New York City voters adopted ranked-choice voting for the city’s local party primaries, but RCV has addressed neither the proportionality problem nor the party-weakness problem. In the 2025 council elections, for example, the Working Families Party operated as an independent political force within the Democratic primary. It endorsed a total of 23 winning candidates, including 17 incumbents, all of whom also ran on the Democratic ballot line.[3]
This vulnerability to factional capture is not limited to closed primaries, as recent data from the Campaign Finance Board suggest that insurgent factions across the political spectrum were prepared to meet New York’s tight party-registration deadlines. Therefore, changing the city’s primary structure to an open or nonpartisan format would not necessarily eliminate factional interference or gamesmanship. Indeed, as this report goes to publication, a New York State court has allowed a candidate who switched from the Conservative Party to run on the Working Families ballot line in an upstate Assembly race to remain on the ballot—over the objections of the Working Families Party, which called it an attempt to hijack its line.
Since the adoption of RCV, groups still disadvantaged by the city’s electoral system, such as unaffiliated voters ineligible to vote in any primary,[4] have proposed reforms to increase their representation.[5] All would retain single-seat districts for city-council elections.
In this context, our March 2025 Manhattan Institute report urged greater consideration of proportional representation, a class of electoral systems that allocate legislative seats to parties in explicit proportion to their vote shares. That report suggested three potential benefits: PR might let the Democratic Party's left and establishment factions compete as separate entities; correct the geographic disadvantages facing the city’s dispersed right-leaning voters; and diminish the “neighborhood veto” that often accompanies single-seat districts, freeing legislators to advance more pro-growth housing policies.
Data from the 2025 council elections allow for a simulation of how PR systems might operate in New York City. This report shows the results of two models introduced in the earlier report: open-list proportional representation with each borough as a multi-seat district, and mixed-member proportional, which retains the 51 existing SSDs and adds 20 citywide seats to bring parties’ seat shares into proportion with their vote shares.
Both PR systems raise right-of-center seat share, while establishment Democrats gain under MMP due to the larger council. Both effects are due to the geographic dispersion of each party’s voters. Individual candidate winners are nearly identical to those under current rules—all 51 in MMP, and 47 of 51 in OLPR.
The report concludes with an assessment of alternative reform proposals that retain single-seat districts, and raises questions about assumptions underlying the case for open-primary reform.
New York City’s De Facto Multiparty System
All analysis below uses official returns for all 51 council districts in the 2025 general election in New York City from the city’s Board of Elections, which report vote totals by ballot line.
Under New York City’s system of ballot fusion (sometimes called fusion voting), two or more parties can nominate the same candidate. For example, Mayor Zohran Mamdani and many council candidates received endorsements from both the Democratic and Working Families parties. Several Republicans likewise received Conservative Party endorsements. The Conservative Party also endorsed two Democrats, both of whom were elected.
For candidates who appeared on the ballot on more than one party line, the official results report how many votes a candidate received on each line. We can treat each of these combinations of party endorsements as a distinct “party grouping.” For example, a Democrat/WFP fusion candidate represents one grouping, while a Republican/Conservative fusion candidate represents another.
Aggregating such ballot lines into candidate-level observations produces 27 unique “party groupings” with citywide vote totals ranging from 1 to 759,405 (Table 1).[6]
We can also use the party groupings to compute the effective number of parties (ENP) in the 2025 city council elections, which was 3.3. ENP is a standard political-science measure that weights parties according to their vote (or seat) shares, similar to concentration indices used in market analysis.[7] By contrast, the typical ENP for a U.S. House election is just around two.
The city would appear less politically fragmented if, rather than treating each ballot combination as a distinct party grouping, we simply counted votes for fusion candidates as votes for their major-party endorsers. For example, votes for Democratic-Working Families candidates would be counted as votes for Democrats, and those for Republican-Conservative candidates as for Republicans. Using that approach, the city’s ENP is only 1.6. Which approach is better?
The seat-product model (SPM) of the effective number of parties points to treating fusion candidates as distinct from their major-party endorsers. This model lets us calculate an expectation from assembly size (51) and the average number of seats per district (1), resulting in 2.7. This is closer to the observed value of 3.3 than it is to 1.6. Further, fusion candidates are presented to voters under multiple party lines, and the SPM assumes that parties’ self-presentation matters to voters.[8] In sum, the model validates treating endorsement combinations as distinct parties. It also suggests greater fragmentation than the existing electoral system is designed to accommodate.
TABLE 1
Number and Percent of Votes by Party Grouping, Including Write-in Candidates, November 2025 General Election
| Party Grouping | Number of Votes | Percent of Votes |
| Democratic and Working Families | 759,405 | 39.0% |
| Democratic | 688,156 | 35.4% |
| Republican and Conservative | 270,028 | 13.9% |
| Republican | 90,632 | 4.7% |
| Democratic/Law & Order and Conservative | 36,394 | 1.9% |
| Conservative | 25,373 | 1.3% |
| Democratic and Conservative | 17,062 | 0.9% |
| Write-in | 12,513 | 0.6% |
| A Blue Collar/Fight and Deliver | 4,955 | 0.3% |
| Republican and Trump MAGA | 6,615 | 0.3% |
| Republican and United Alliance | 3,811 | 0.2% |
| The Unity | 4,397 | 0.2% |
| United Alliance | 3,063 | 0.2% |
| Working Families and New North Shore | 3,838 | 0.2% |
| Asians United | 1,199 | 0.1% |
| CleanSafeStreet | 1,165 | 0.1% |
| Freedom | 1,045 | 0.1% |
| Libertarian | 1,834 | 0.1% |
| Patriot Workers | 1,039 | 0.1% |
| Revive East Side | 2,573 | 0.1% |
| Safe&Affordable | 1,549 | 0.1% |
| Safe&Affordable/Stop the Casino | 1,927 | 0.1% |
| Voters First | 1,294 | 0.1% |
| West Side United | 2,477 | 0.1% |
| Asians United/FAFO | 898 | 0.0% |
| Conservative and United Alliance | 873 | 0.0% |
| Patriot Party | 619 | 0.0% |
| TAMARA | 1 | 0.0% |
Source: NYC Board of Elections, 2025 General Election Results
The Geography of Voting in the 2025 City Council Elections
Figure 1 plots the district-level vote share for each of four main political blocs.[9] Each bloc is a set of party groupings that earns at least one council seat each in either the OLPR or MMP simulations described below. The left bloc comprises Democratic and Working Families groupings. The right bloc comprises Republican and Republican and Conservative groupings. The Democratic grouping is treated as its own bloc. Finally, the Other grouping includes one nominee of a Democratic/Law & Order Party who was also endorsed by the Conservatives, plus one candidate jointly endorsed by the Democrats and Conservatives.
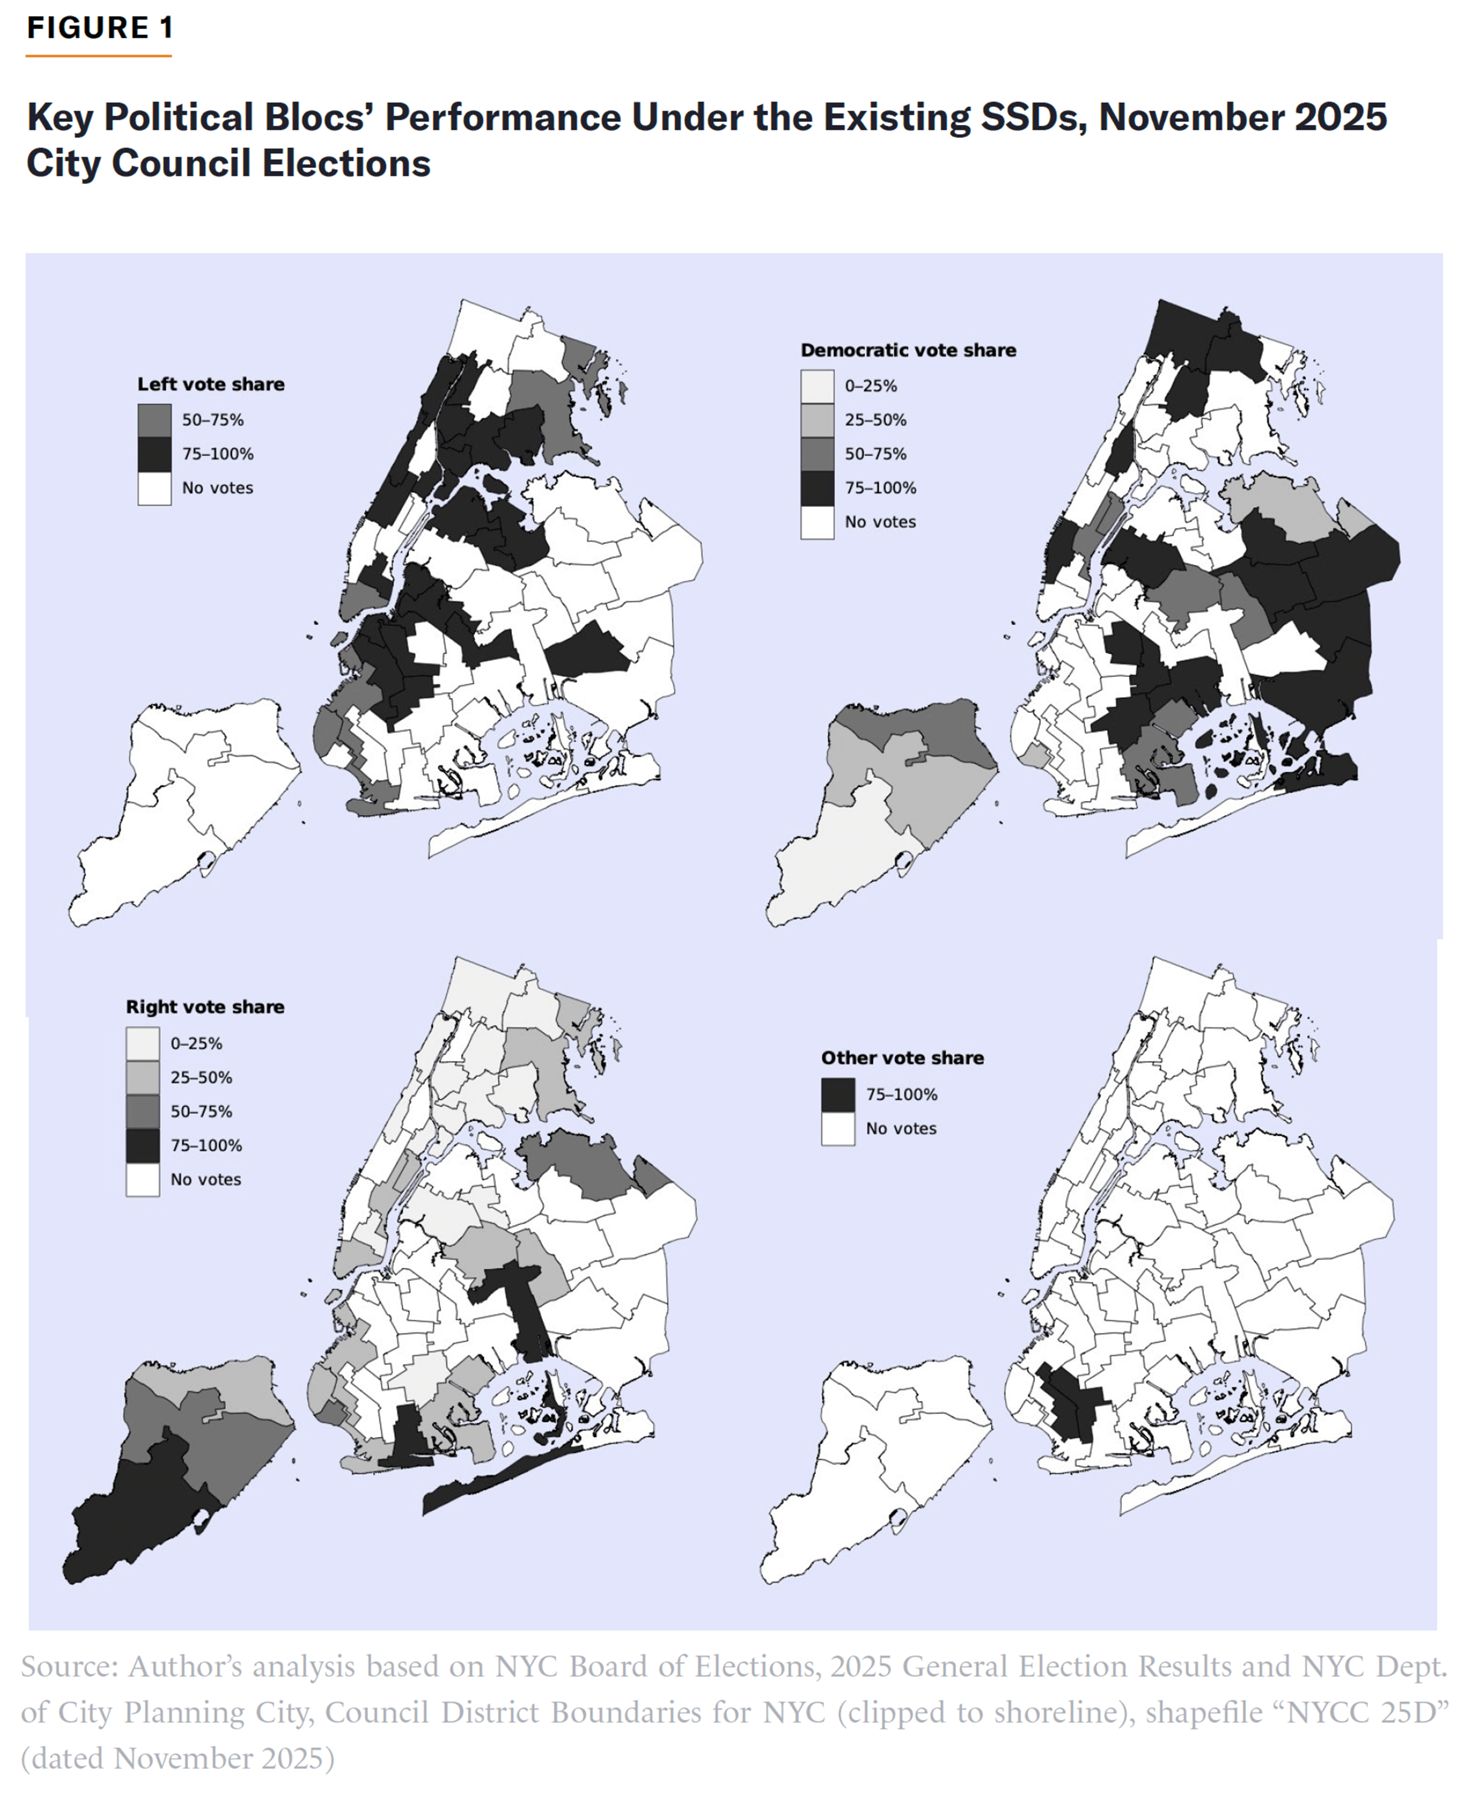
Three stark patterns emerge. One is the geographic concentration of the left-bloc vote. In no district did a Democratic and Working Families candidate earn less than half the votes. By contrast, Democratic and right-bloc vote shares vary widely across the city, and the right bloc is the most geographically dispersed. A few summary statistics support these observations. On the left bloc, there were 23 candidates with an average vote total of 33,018 and a standard deviation (SD) of 14,717. For regular Democrats, there were 24 candidates with an average of 28,673 votes (SD: 10,547). For the right bloc, there were 28 candidates with an average of 12,881 votes (SD: 11,433).
The geographic dispersion of right-leaning voters and concentration of left-leaning voters help to inform what outcomes we should expect in PR simulations. The right bloc clearly stands to benefit most from a PR system. Under the current rules, it wins 9.8% of seats on 21.7% of votes. At the same time, the left bloc might also benefit, even though it currently has 45.1% of seats with only 39% of votes. However, as we saw in Figure 1, the Democratic and Working Families grouping may currently “waste” votes from a PR perspective, because it is so geographically concentrated. (Simulations later show that this was not the case; this grouping wins the same number of seats under borough-wide PR with the same council size.) The expected effect on regular Democrats is less clear. On one hand, because its support was distributed throughout the city, this grouping often competed with parties assigned to the right bloc. On the other, PR may not provide much benefit to a grouping that is already distributed efficiently. Note that the overall vote for other parties (and write-in candidates) was about 12%. Some might conclude that these “wasted” votes warrant even more permissive rules than those modeled here (especially a larger assembly).
Simulating Proportional Representation
In the context of PR seat allocations discussed below, each endorsement combination becomes a “list.” The list gives the order in which a party’s (or allied group of parties’) candidates win seats in a district. For example, if a list is entitled to three seats, the first three listed candidates get these. A list bearing the names of two or more nominal parties (e.g., Republican and Conservative) can be thought of as a joint list. This approach is consistent with a recent proposal to use fusion alongside PR when a single-seat election (e.g., of a mayor) renders PR impossible.[10]
OLPR at the Borough Level
OLPR is a class of electoral systems with three key features. The first is a pre-election grouping of candidates, conventionally called a list. The second is an allocation rule that awards seats to lists in proportion to their vote shares. The third is that voters choose among candidates, and these votes for candidates set the order in which the candidates on a party’s list receive seats. For example, if a list is entitled to three seats based on its proportional allocation, the first three people on its list get those. Open lists are distinguished from closed lists, wherein some party procedure determines the order in advance of an election, and “free” lists, which let voters choose multiple candidates from multiple lists.[11] An OLPR system permitting multiple votes is conceivable as well, so long as those votes are within a single list.
In the OLPR simulation, each borough gets as many seats as it currently has in the City Council, plus an adjustment for crossover districts, which straddle borough lines. These exist mainly to satisfy the “one-person-one-vote” principle, which means that the ratio of representatives to constituents should be roughly equal across representatives. For the current simulation, I assigned each crossover district to the borough that generated the most votes, while keeping the votes from each borough in its simulated multi-seat district. For example, City Council District 8 covers portions of both Manhattan and the Bronx. Because most voters in the district are from Manhattan, I assigned it to Manhattan, but I kept the votes from the Bronx portion of the district with the Bronx for the purposes of this simulation. Separate simulations treating the four crossover districts as a single citywide district are available in the online replication materials.
To allocate seats to lists, I first computed each list’s total vote in the borough and then used the D’Hondt method to determine how many seats go to each list.[12] This is the most popular way to implement PR around the world, a version of which (known as the Jefferson method) was used by Congress to distribute U.S. House seats among states from 1791 to 1842. Another approach is the Webster method (also known as Sainte-Laguë), which leads to closer correspondence between a list’s vote and seat shares and may thus give more seats to smaller party groupings.[13] Put simply, D’Hondt/Jefferson is harder on small parties than Sainte-Laguë/Webster, and I used it because many readers are likely to be wary of small parties.
To give seats to candidates within lists, I used their vote totals to set the order of each list. In other words, a vote counts for both the respective candidate as well as for their list. If a list is entitled to more seats than the number of candidates it ran, I added a generic winner to that list.
Table 2 gives the citywide simulation results under three conditions: current rules, OLPR as described above, and MMP as described in the next section. The first column gives each party grouping’s name. The next column gives the number of votes that each party grouping earned in the November 2025 elections. The next three columns report raw seat totals in each system. The final four columns report each party grouping’s percent of votes, as well as its performance in each simulated system.
TABLE 2
Simulated Performance of SSDs (Current Rules), MMP with enlarged council, and OLPR, November 2025 Council Elections
| Party Grouping | Number of Votes | Number of SSD Seats | Number of MMP Seats | Number of OLPR Seats | Votes (%) | SSD Seats (%) | MMP Seats (%) | OLPR Seats (%) |
| Democratic and Working Families | 759,405 | 23 | 29 | 23 | 39.3% | 45.1% | 40.8% | 45.1% |
| Democratic | 688,156 | 21 | 26 | 20 | 35.6% | 41.2% | 36.6% | 39.2% |
| Republican and Conservative | 270,028 | 5 | 10 | 6 | 14.0% | 9.8% | 14.1% | 11.8% |
| Republican | 90,632 | 0 | 3 | 1 | 4.7% | 0.0% | 4.2% | 2.0% |
| Democratic/Law & Order and Conser-vative | 36,394 | 1 | 2 | 1 | 1.9% | 2.0% | 2.8% | 2.0% |
| Democratic and Conservative | 17,062 | 1 | 1 | 0 | 0.9% | 2.0% | 1.4% | 0.0% |
| Other | 70,545 | 0 | 0 | 0 | 3.7% | 0.0% | 0.0% | 0.0% |
| Total | 1,932,222 | 51 | 71 | 51 | 100% | 100% | 100% | 100% |
Source: Author’s analysis based on NYC Board of Elections, 2025 General Election Results Note: Numbers may not sum due to rounding.
Figure 2 gives a bar graph comparing party groupings’ seat shares under the current single-seat districts and simulated OLPR. The citywide results for both are similar, but differences are consistent with the analysis of partisan geography above. Recall that the left-bloc party grouping was most concentrated, the right bloc was least so, and the regular Democrats’ vote shares occupied a middle position. The most obvious effect of OLPR is to increase the right bloc’s seat share by two: one additional seat for the Republican and Conservative grouping, plus one seat for Republicans (versus no seat under current rules). The lone Democratic and Conservative candidate did not have enough votes to earn a seat as a list of one. However, Simcha Felder (Democratic/Law & Order and Conservative, District 44) did.
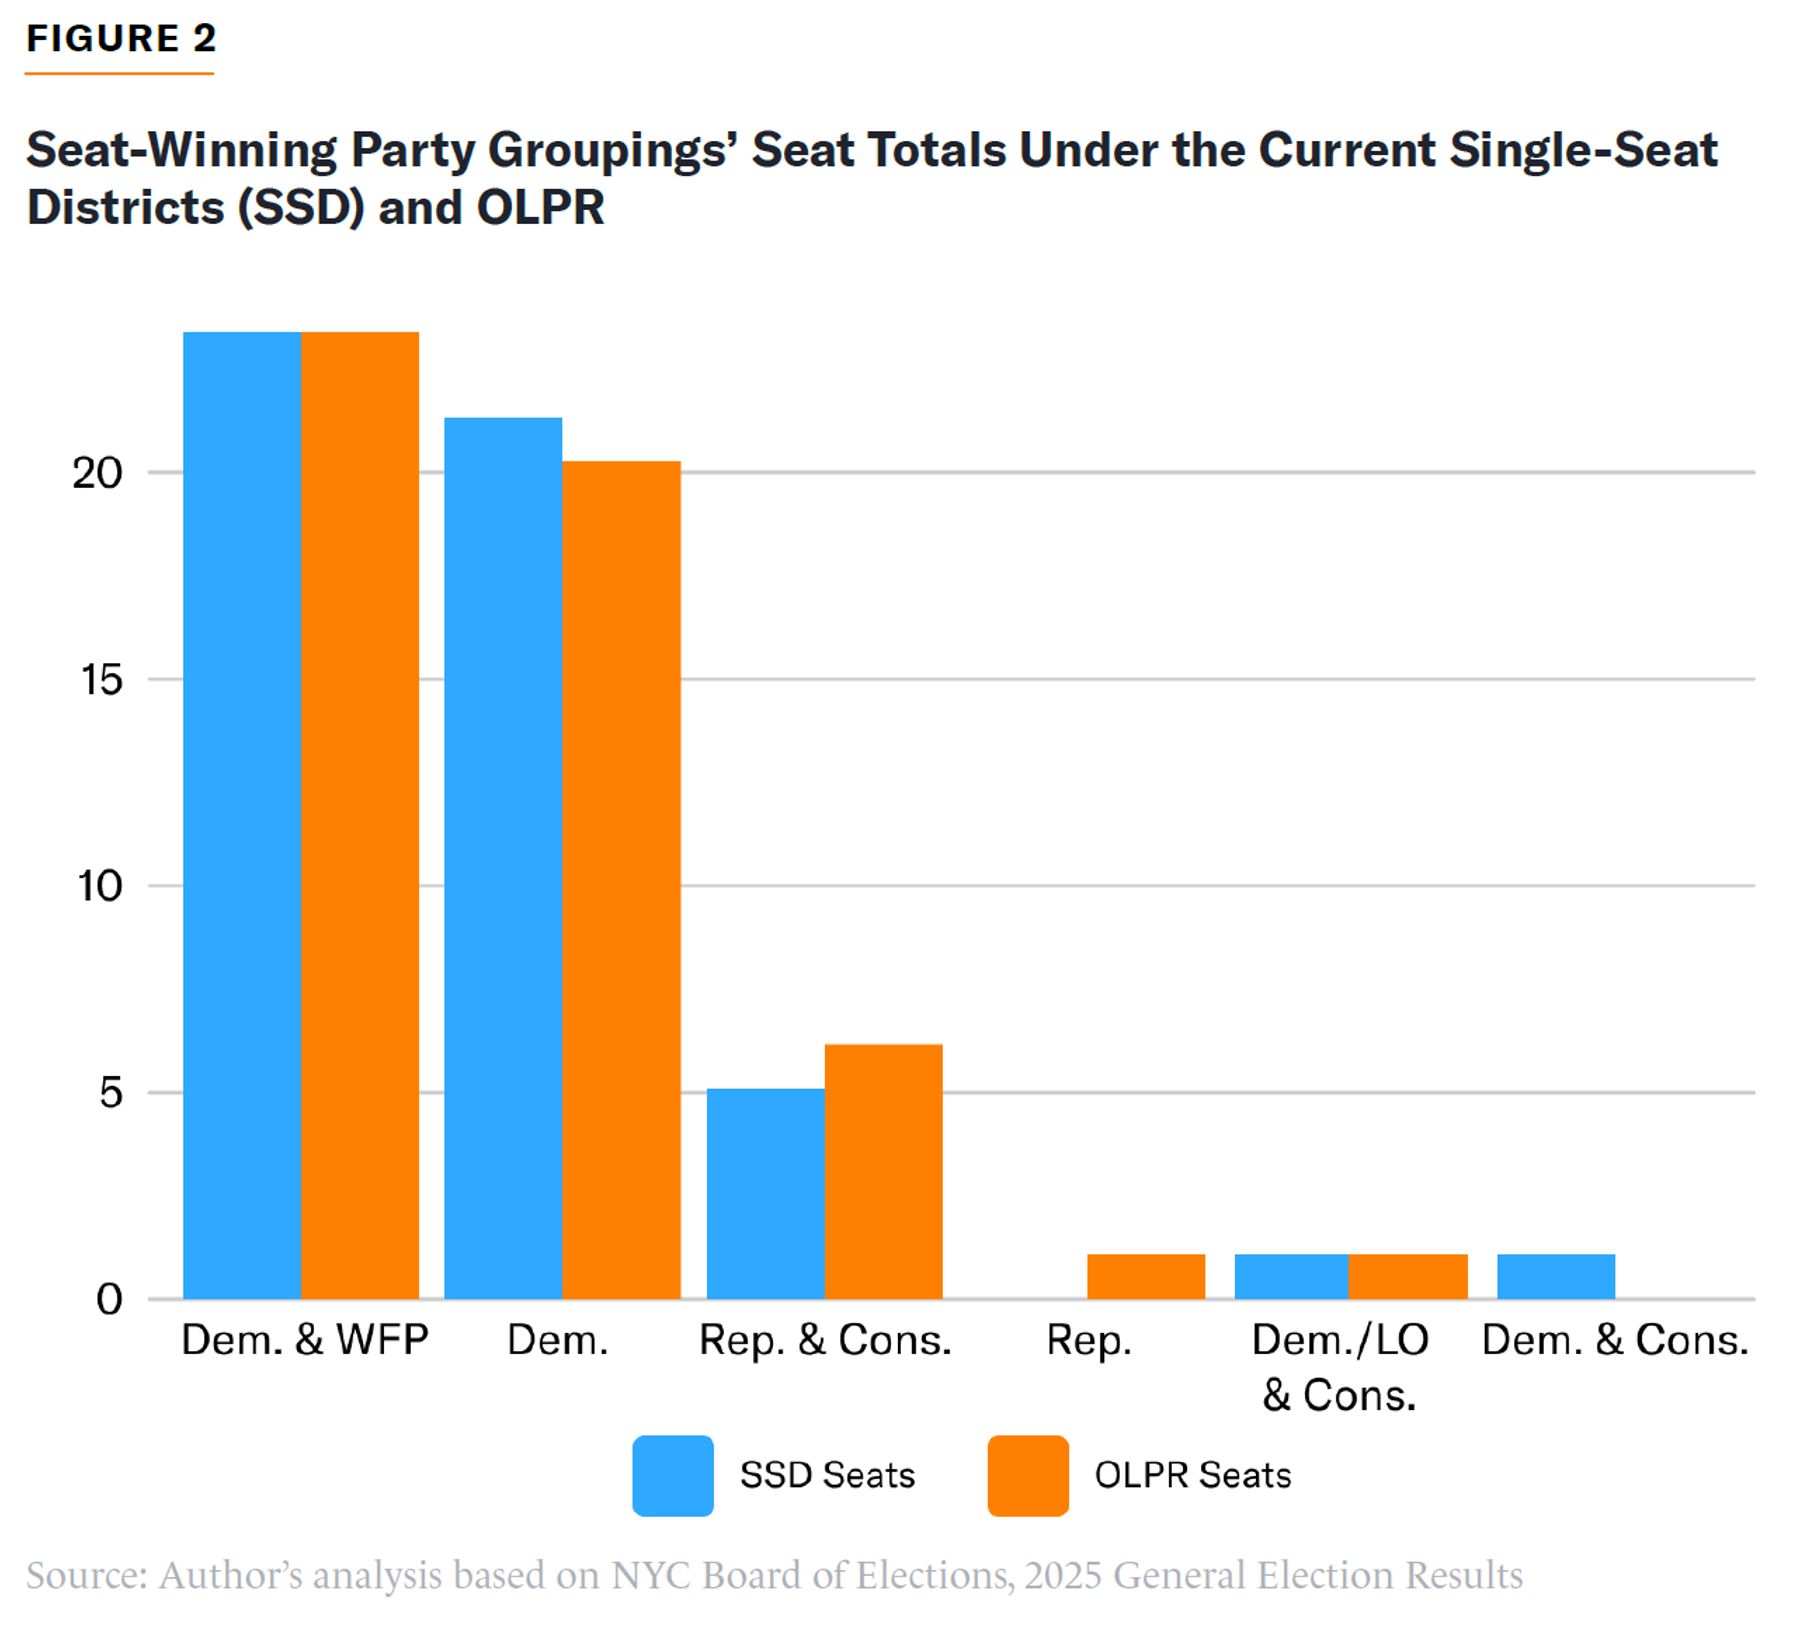
The handling of crossover districts makes it impossible to compare SSD and OLPR performance at the borough level. However, there are only four candidates who win under the current rules but not in OLPR. In Brooklyn, two generic Democratic and Working Families candidates replace Chris Banks (Democratic, District 42) and Susan Zhuang (Democratic and Conservative, District 43). This is because the Democratic and Working Families grouping ran fewer candidates than it wins under PR, which points to an unpacking effect. In Queens, Benjamin Chou (Democratic, District 19) and Alicia B. Vaichunas (Republican and Conservative, District 30) replace Sandra Ung (Democratic, District 20) and Shanel Thomas-Henry (Democratic and Working Families, District 21). The replacement of one Democrat with another results from the fact that Chou’s vote (18,496) put him ahead of Ung (15,243) on the party list. Vaichunas’s victory over Thomas-Henry, meanwhile, points to an uncracking effect.
Again, it is not possible to directly compare OLPR to the current system due to the handling of crossover districts, but the results in Queens under OLPR are informative. With OLPR, the Republican and Conservative grouping has 42,474 votes per seat in contrast to the Democratic and Working Families grouping’s 19,681. Since both groupings ran five candidates but won two and three seats, respectively, the Republican and Conservative grouping’s votes were spread thinly in Queens.[14]
MMP with a Citywide Compensation Tier of 20 Seats
MMP systems incorporate several SSDs and deliver party proportionality through an additional compensation tier, which is a set of seats that are allocated in one or more multi-seat districts that “sit atop” the SSDs.[15] The idea is to allocate seats to parties from the compensation tier until their seat totals (including seats won in SSDs) come as close as possible to what they would have been if all seats in the election were allocated by PR. In the next simulation, I created a compensation tier of 20 seats. This is consistent with the New Zealand model, wherein compensation seats are 40% of total assembly size.
Most existing MMP systems ask the voter for two votes: one for a party (to determine parties’ proportional allocations) and one for a candidate within their district. The simulation used observed votes in the existing SSDs and can be thought of as a one-vote variant.[16] A two-vote variant would permit ticket splitting, which might reduce fragmentation in the SSD contests by letting voters support small parties with their party vote instead of their district vote.[17]
In MMP, it is possible for a party to win one or more SSD seats even though its overall performance does not proportionally entitle the party to any seats. A true MMP system lets parties retain these seats, known as overhang. Overhang seats can cause the size of an assembly to change from election to election, and provisions governing them can change frequently.[18] The current simulation keeps council size at 71, lets party groupings keep all seats they win in SSDs, and starts a D’Hondt allocation of compensation seats from those totals.[19]
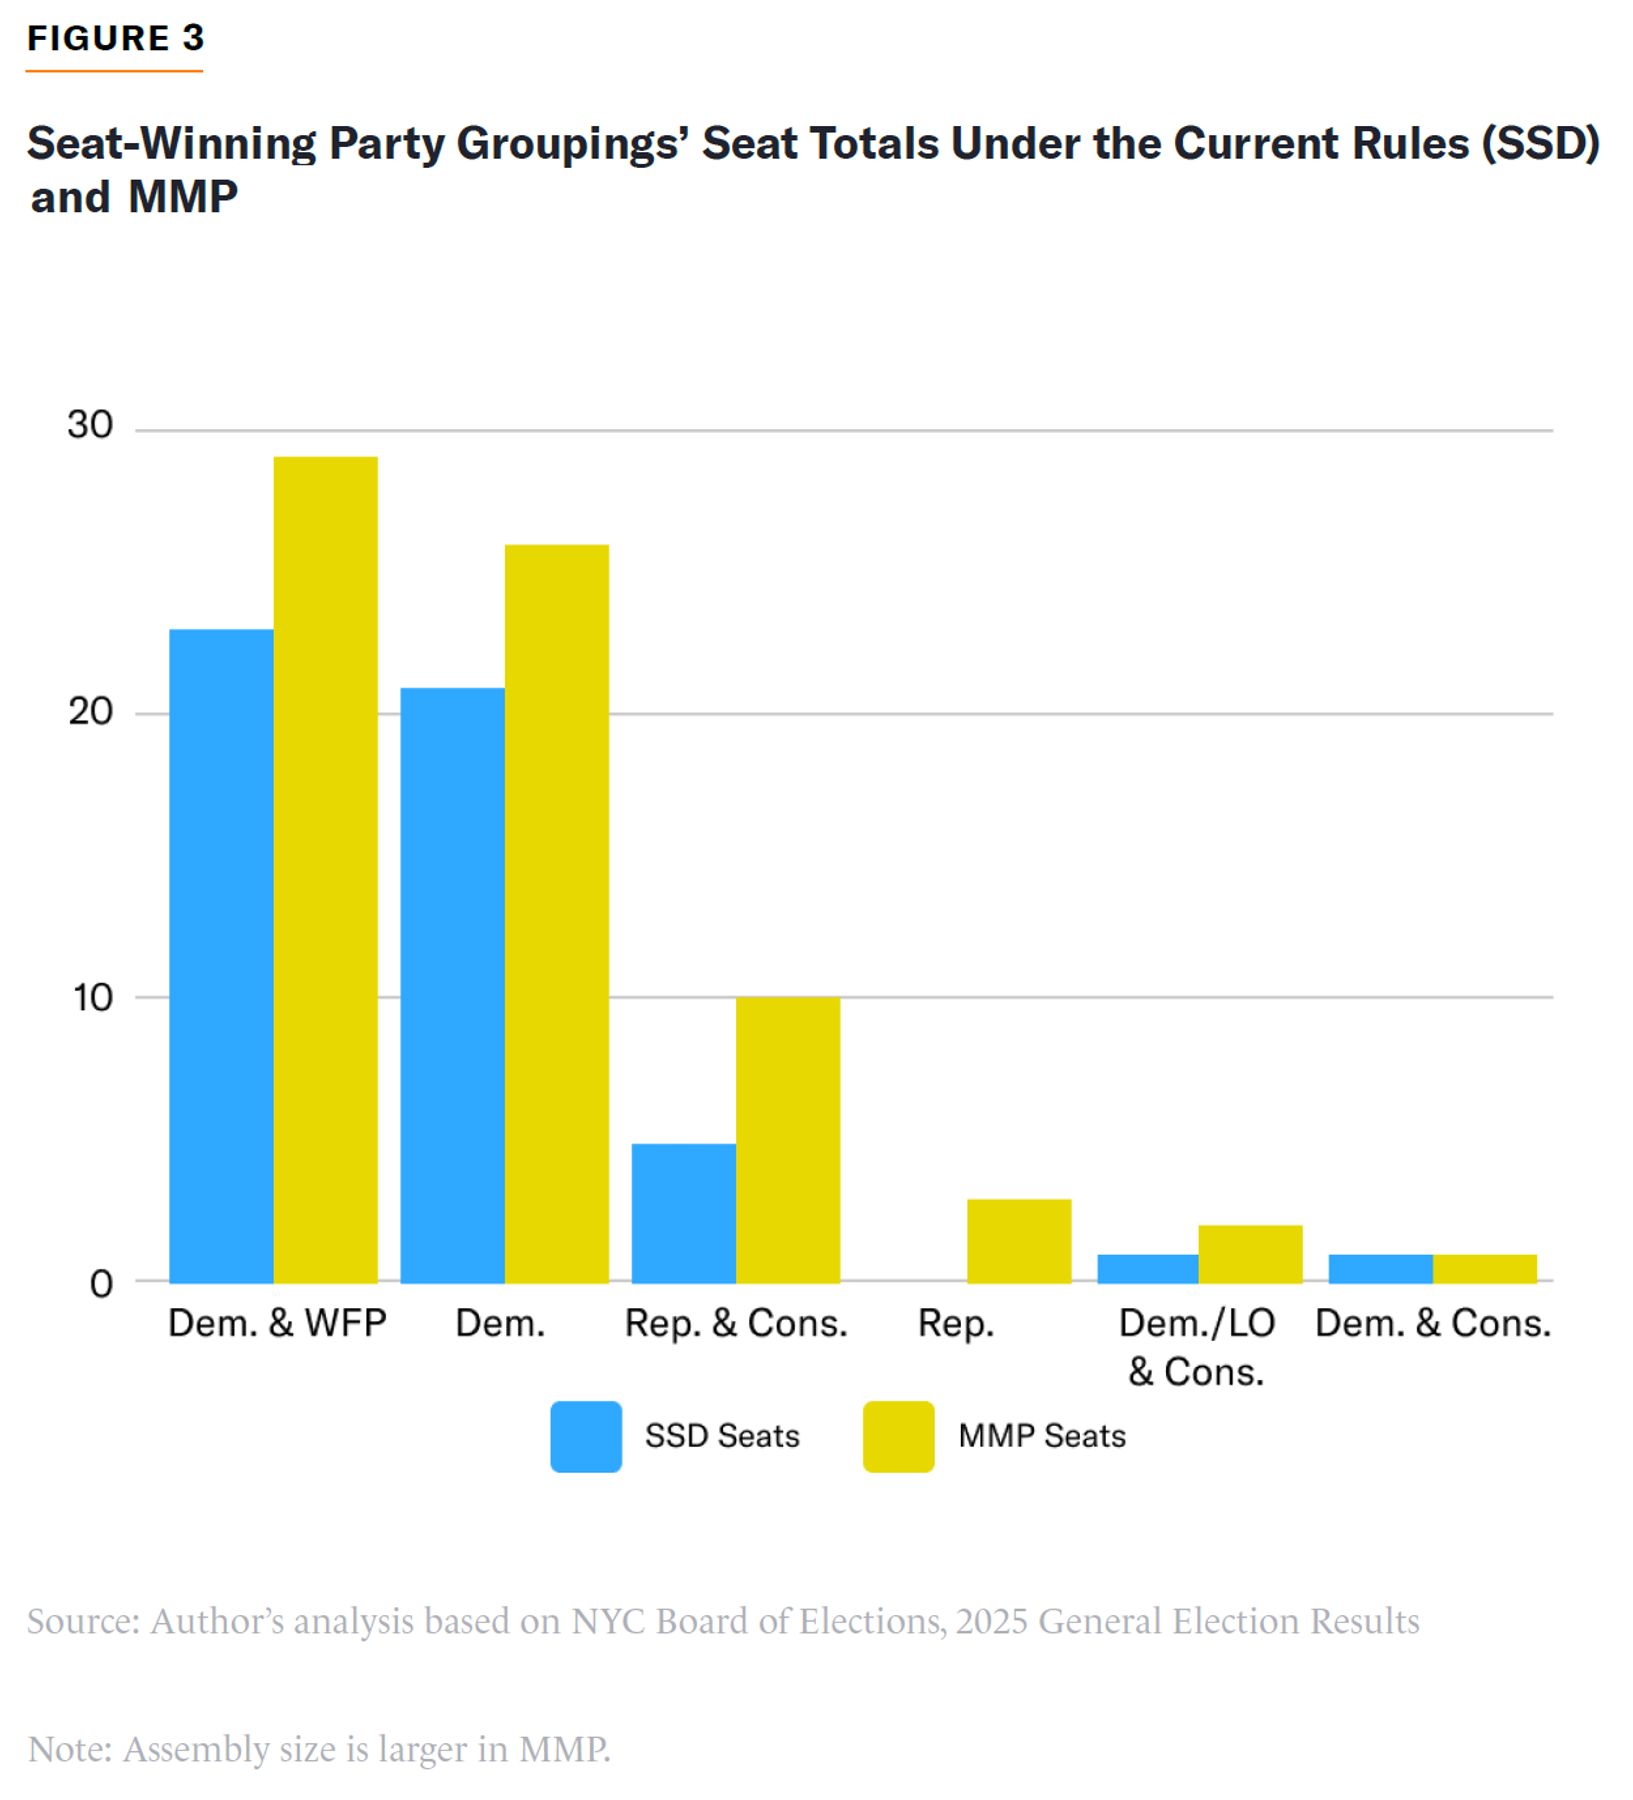
Results from the MMP simulation are in Table 2, and Figure 3 compares its performance to the current system (same districts, no compensation tier). Trivially, all members who win in SSDs also win here. Other key results are as follows: First, MMP brings the Democratic and Working Families seat share to within 2 percentage points of its citywide vote share. It brings the Democratic seat share to within 1 point of its vote share. Republican and Conservative seats rise from 9.8% to 14.1%, which is 0.1 percentage points greater than this group’s vote share. Republicans also win 4.2% of seats, whereas they win none under the existing rules. Finally, the Democratic/Law & Order and Conservative grouping wins two seats instead of one. All of these effects are due to the compensation seats.
Conclusion
New York City has three identifiably different political groups, and competition between two of them is playing out in Democratic primaries. Further, some of those groups are too geographically dispersed to win proportional shares of seats under the existing single-seat districts. Both types of situations have led to PR adoption in other contexts. With these facts in mind, this brief projected election outcomes under two plausible PR designs.
MMP unsurprisingly produces more overall proportionality due to the citywide compensation tier. Most benefit accrues to the Republican and the Republican and Conservative lists, and its competitors get seat shares much closer to their vote shares. Meanwhile, in OLPR, both the Democratic and the Democratic and Working Families lists win more seats in certain boroughs than they do under the current rules.
These simulations also point to further questions about institutional design. One concerns population equality under OLPR using boroughs as districts. Another is about the merits of one- or two-vote variants of MMP. Two-vote is advisable because it could cut down on fragmentation in the district contests. But there is also a risk that parties that do well in district contests from “cloning” themselves under different names to game the compensation process.[20] There would have to be a mechanism to prevent this, which could involve requiring parties to demonstrate their organizational independence if they wish to run lists in the compensation tier (i.e., no interlocking directorates, to use an analogy from the analysis of firms).
More broadly, the large share of “wasted” votes raises the question of whether the overall assembly should be larger in either OLPR or MMP. One might expect assembly enlargement to stimulate fragmentation. However, the existing demand for representation could have manifested as even further fragmentation of the SSD contests, producing too many overhang winners for the compensation mechanism to accommodate. Readers interested in exactly how many parties that any given design might produce can consult research that models such outcomes explicitly.[21]
An obvious question is how parties would determine the compositions of lists. One option is to use vote shares from primaries, as recently proposed for Wyoming.[22] There are other possible approaches worth considering in future reports.
Separate from the simulations, the dynamics of the Democratic primaries speak to the potential value of having party factions compete as separate entities. PR’s rival reforms seek to manage fragmentation by funneling voters’ preferences through some form of two-round election.[23] These proposals take SSDs as a point of departure because many believe that they deter third-party entry.[24] Instead, the key intervention is to make it easier for voters not affiliated with a party to affect the candidate it sends to a general election (i.e., primary reform). This assumes that a party’s regulars also are its “extremists.” However, the Working Families Party won 23 council seats by winning the respective Democratic primaries. Data from the NYC Campaign Finance Board (CFB) suggest this may have been due to new-voter mobilization rather than the outsized influence of party regulars. Working Families saw a 157% increase in registrations, followed by 78% for Democrats, 53% for Republicans, and 32% for Conservatives. New registrations concentrated among voters under 30 (64.8%). Further, CFB notes that single-day registration before the deadline beat 2021’s record fivefold.[25] This surge occurred in a context of closed party primaries, which are widely thought to impede participation by voters not tied to either major party.[26] “Moderation” via primary reform therefore may require voter mobilization to counteract whatever is its target.
The usual case against PR is that it might break up existing political parties. The New York City party system is already fragmented.[27] When we treat candidates’ combinations of party endorsements as parties in their own right, the effective number of electoral parties is 3.3. Note that this situation obtained under the current “first-past-the-post” system. It also obtained in a system that should be expected to produce 2.7 parties without any electoral reform.
Acknowledgment
The authors thank Matthew Shugart for comments on an earlier draft.
About the Authors
Jack Santucci is a Professorial Lecturer at the George Washington University and adjunct fellow at the Manhattan Institute, focusing on electoral systems and government reform in U.S. cities. He also teaches public opinion for NYU Washington, DC. Santucci is the author of More Parties or No Parties: The Politics of Electoral Reform in America (Oxford, 2022), several journal articles on parties-and-elections issues, and two recent white papers on reform of federal and local elections. His current academic projects are in the fields of state politics and public opinion.
John Ketcham is a legal policy fellow and director of Cities at the Manhattan Institute. His areas of expertise include housing, local elections, infrastructure, parental rights, and more, particularly in New York City and State. He holds a JD from Harvard Law School and a BS from Fordham University. While in law school, Ketcham spent a summer at the Permanent Observer Mission of the Holy See to the United Nations and was treasurer of the Harvard Federalist Society and managing editor of the Harvard Journal of Law & Public Policy. He has been published in The Wall Street Journal, Newsweek, the American Mind, New York Daily News, New York Post, and City Journal. He was awarded a New York City Leonine Forum Fellow in 2021–22 and the Napa Legal Institute’s Good Counselor Project Fellowship in 2023–24.
A lifelong resident of Astoria, Queens, John serves as the president of the Long Island City Lawyers Club, trustee and past Grand Knight of the Knights of Columbus Colon-Msgr. Higgins Council 309, public relations officer of the Astoria Homeowners, Tenants & Business Civic Association, and treasurer of St. Francis of Assisi Catholic Academy.
Endnotes
Are you interested in supporting the Manhattan Institute’s public-interest research and journalism? As a 501(c)(3) nonprofit, donations in support of MI and its scholars’ work are fully tax-deductible as provided by law (EIN #13-2912529).