Short- and Long-Term Explanations for the New Homicide Decline

Photo: kali9/iStock/Getty Images Plus via Getty Images
Executive Summary
The U.S. homicide rate shot up in 2020 but began to fall, starting in 2022—and kept falling, to the point that 2025 saw the lowest recorded murder rate since the 1950s. In this report, I note and assess two broad frameworks for analyzing the decline.
One framework focuses on the short term, looking for factors that have improved since the chaos of 2020. The other framework is a longer-term narrative in which structural factors have gradually reduced Americans’ tendency toward violence, but these background factors are sometimes interrupted by waves of killings, such as those we saw in 2015 and 2020. These two years were both characterized by unrest over racially controversial policing incidents, and 2020 was disrupted by the Covid-19 pandemic as well.
I then document trends in numerous variables that crime watchers propose might accompany these broader narratives, and I summarize the evidence as to whether each variable indeed affects crime. The most promising short-term factors include the post-pandemic rebound in policing activity—coupled with concerted efforts to prevent serious violence, in particular—as well as a return-to-normal for the economy and Americans’ schedules. Key long-term structural factors include a decline in youthful rambunctiousness, accompanied by changing technology and an aging population.
While it is too early for firm conclusions, a combination of the two broad narratives and numerous contributing factors appears necessary to fully explain recent trends.
Introduction
Murders in the U.S. exploded in 2020—but shortly thereafter started falling at a rapid clip and still have not stopped falling. The FBI reports that 2025 saw the lowest murder rate since the 1950s.[1] Further data this year suggest continued declines.[2] Other types of crime are down lately as well.
In the 1990s, the U.S. experienced a “great crime decline” in which the murder rate fell by more than a third. We appear to be enjoying something similar now. The question is why.
Strikingly, even the broadest national trends provide two different ways of viewing this phenomenon. One might see the murder decline since 2022 as an extremely strong and rapid recovery from the pandemic years—indeed, one so strong that it brought us below 2019 homicide rates. Or, one might see it as a much longer-running phenomenon that began in the mid-to-late 2000s—and in some ways might even have continued the 1990s crime drop—but, crucially, was interrupted by waves of violence that began in 2015 and continued in 2020, years characterized by unrest over racially charged policing incidents.
Obviously, these two broad ways of looking at the trends will affect which specific explanations fit. Are we looking for factors that gradually got better starting 20 years ago? Or should we focus on factors that suddenly got better after the pandemic ended—ideally, conditions that improved so much that they wound up even better than they had been before?
As a first step toward answering these questions, I compile and assess numerous crime-decline theories that have been proposed, asking whether the timing fits and whether there is good evidence that the proposed mechanism can indeed reduce crime.
It is too soon for firm conclusions, and if the still-unresolved debate over the 1990s crime drop is any indication, the time for a final resolution may never come. I argue that the most promising narrative combines the two frameworks, emphasizing the confluence of strong short-term recovery from the pandemic years—across key dimensions including police activity, concerted antiviolence efforts, and a return to normal routines such as work and school—with deeper trends that have gradually suppressed crime during the current century, such as increasingly docile behavior from teens and young adults, an aging population, gradual advances in policing strategies, and the proliferation of cell phones and surveillance cameras.
Crime-Rate Trends
Figure 1 depicts the FBI’s national homicide, aggravated-assault, robbery, and overall property-crime rates going back to 1958, which the bureau compiles from law-enforcement agencies throughout the country. These include only crimes reported to the police, and the bureau estimates missing data from non-reporting agencies. Note that robbery is considered a violent crime, although it involves property being taken (in a robbery, the property is taken by force in person, as opposed to the property crime of theft, which does not involve physical confrontation).
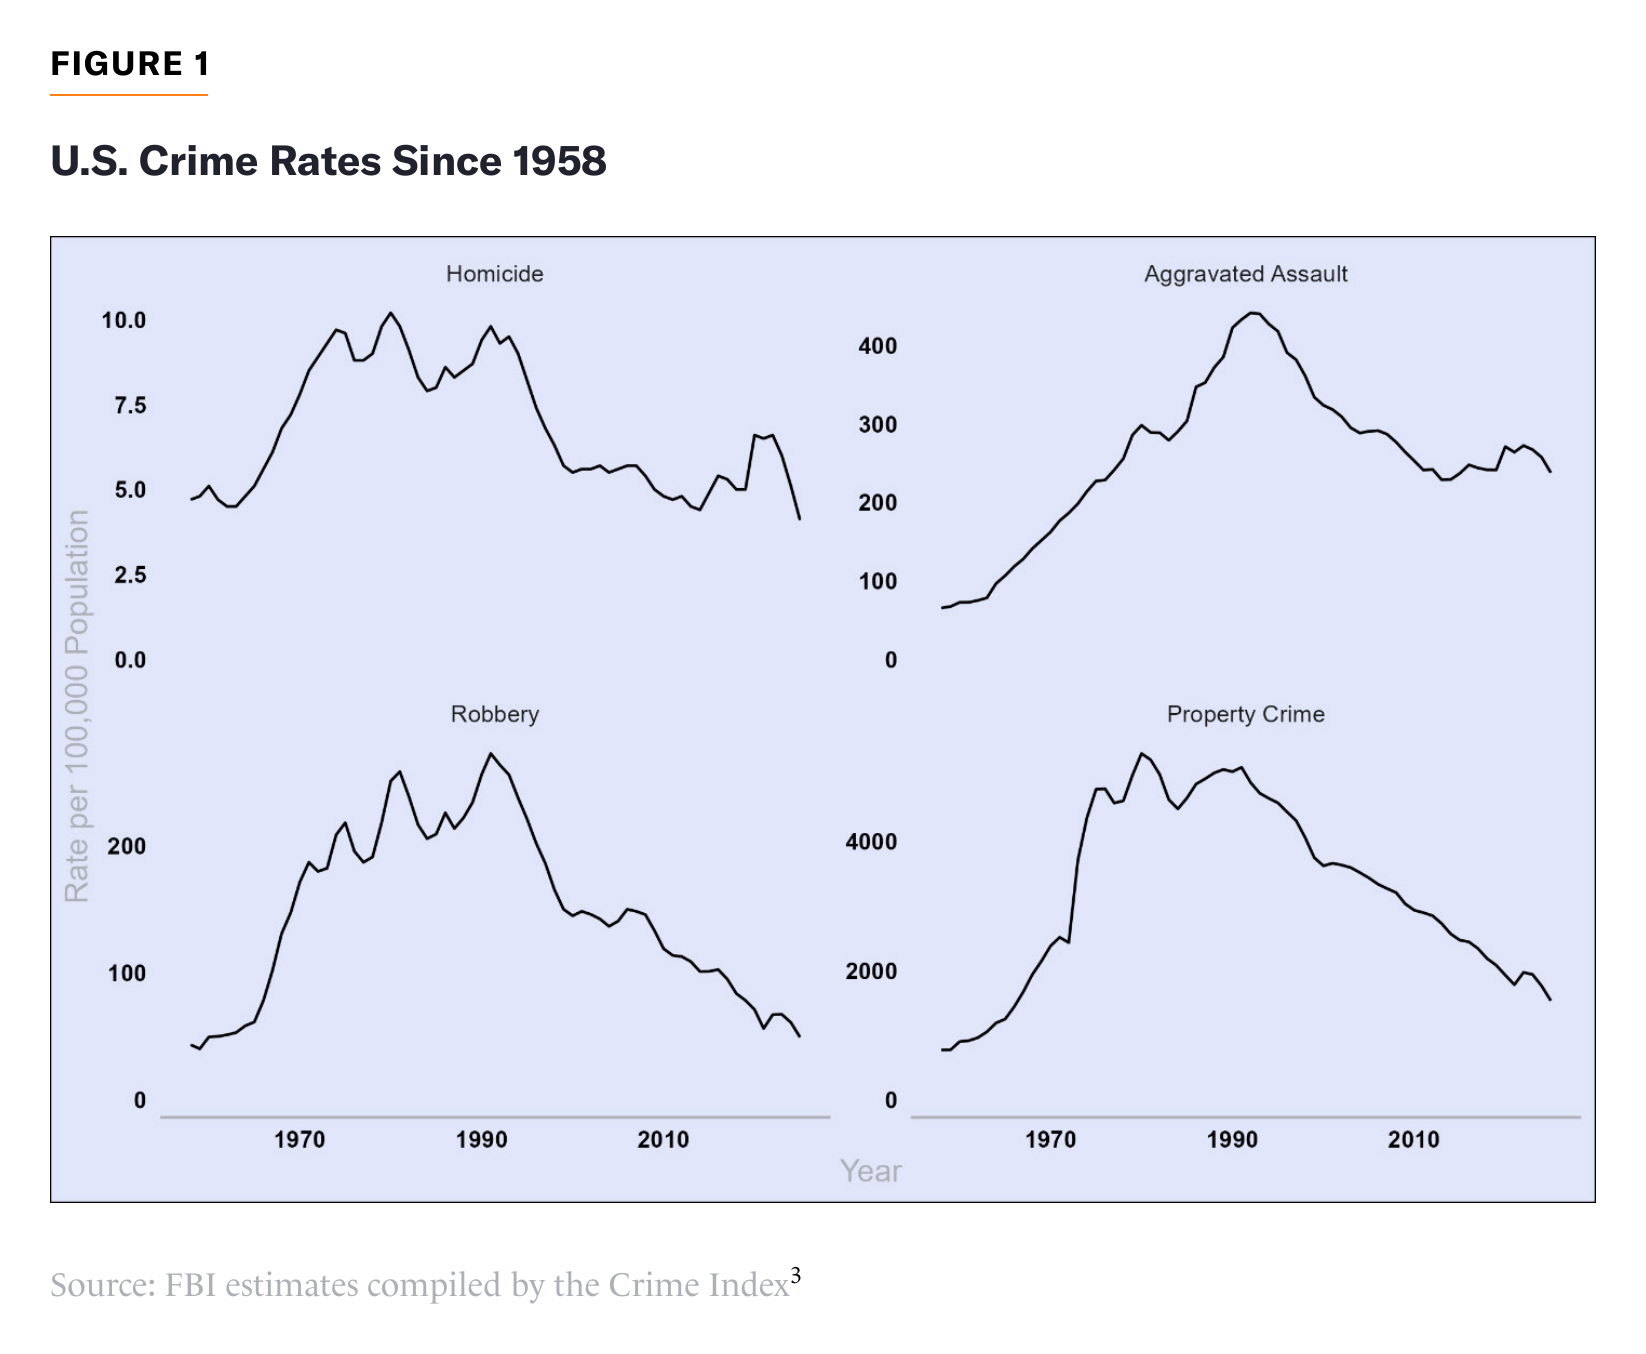
During the “great crime decline” of the 1990s, all these offenses fell substantially from their high points. The three violent crimes then stagnated for a brief period after the turn of the century, before resuming a slower decline, while property crimes simply continued to fall. Homicide and aggravated assault, however, both saw an increase in 2015 and an even sharper rise in 2020, and then fell again through the most recent data. This report focuses on trends in homicide, as it is the most severe and, arguably, the costliest for society,[4] and by far the best-measured crime; but it is worth noting how these other forms of crime resemble and differ from homicide in their trends over time.[5]
Further data, compiled from police publications and other sources by the Crime Index—a project that aggregates American crime data across a wide variety of sources and time periods—suggest continued crime decreases into 2026. Murder dropped an estimated 17% between the first half of 2025 and the first half of 2026, alongside decreases of 3% for aggravated assault, 14% for robbery, and 10% for property crime.[6]
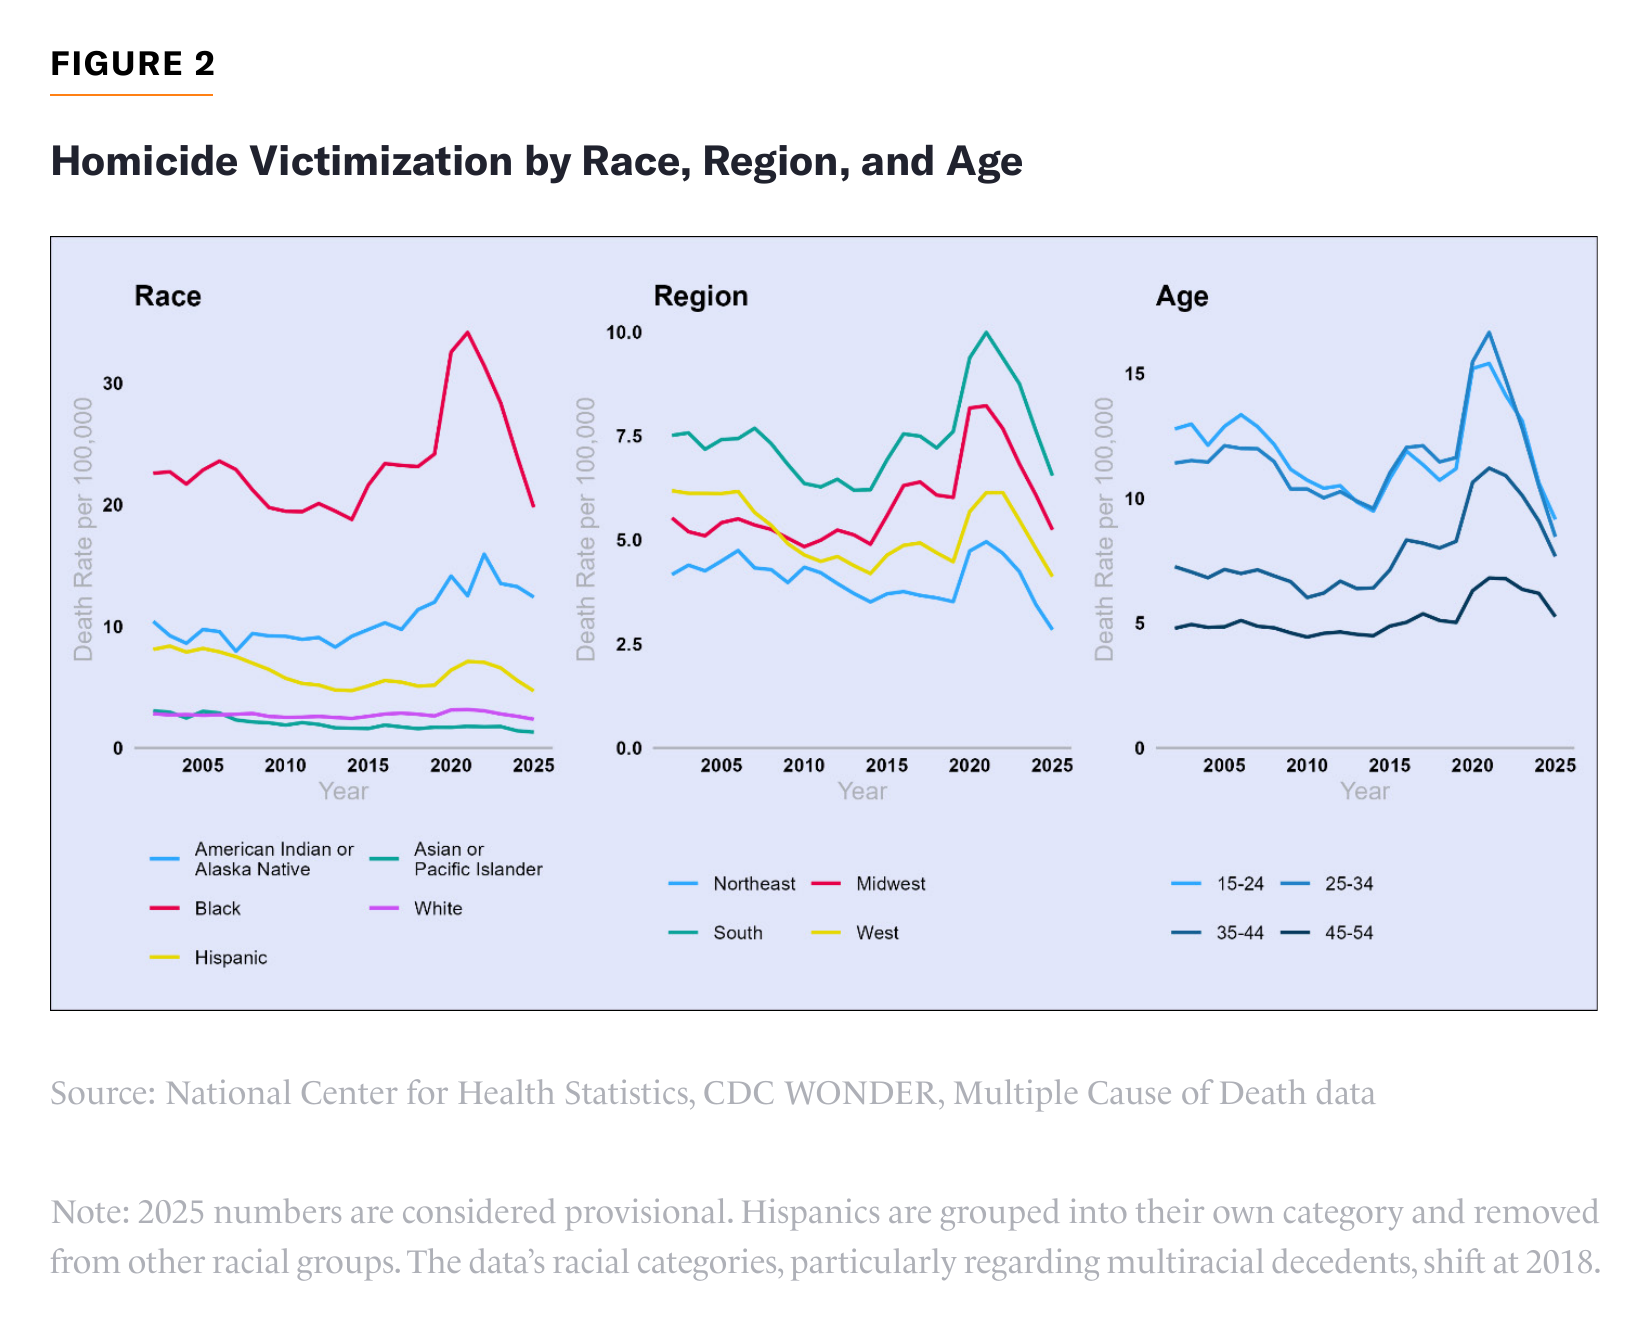
Importantly, trends in lethal violence have been reasonably consistent across numerous subsections of the U.S., which Figure 2 documents using the Centers for Disease Control and Prevention’s (CDC) death-certificate-based data on homicide victims. The chart depicts homicide death rates by race/ethnicity, region, and age. Naturally, groups and places with higher homicide rates tend to experience more extreme fluctuations when crime rises and falls, but all groups tend to move up and down at similar intervals. Also, in a city-by-city analysis that I discussed in a previous Manhattan Institute brief, I found that the overwhelming majority of big cities experienced a homicide spike in 2020–21, with most also seeing rates turn around over the next two years—and declines strengthening thereafter.[7]
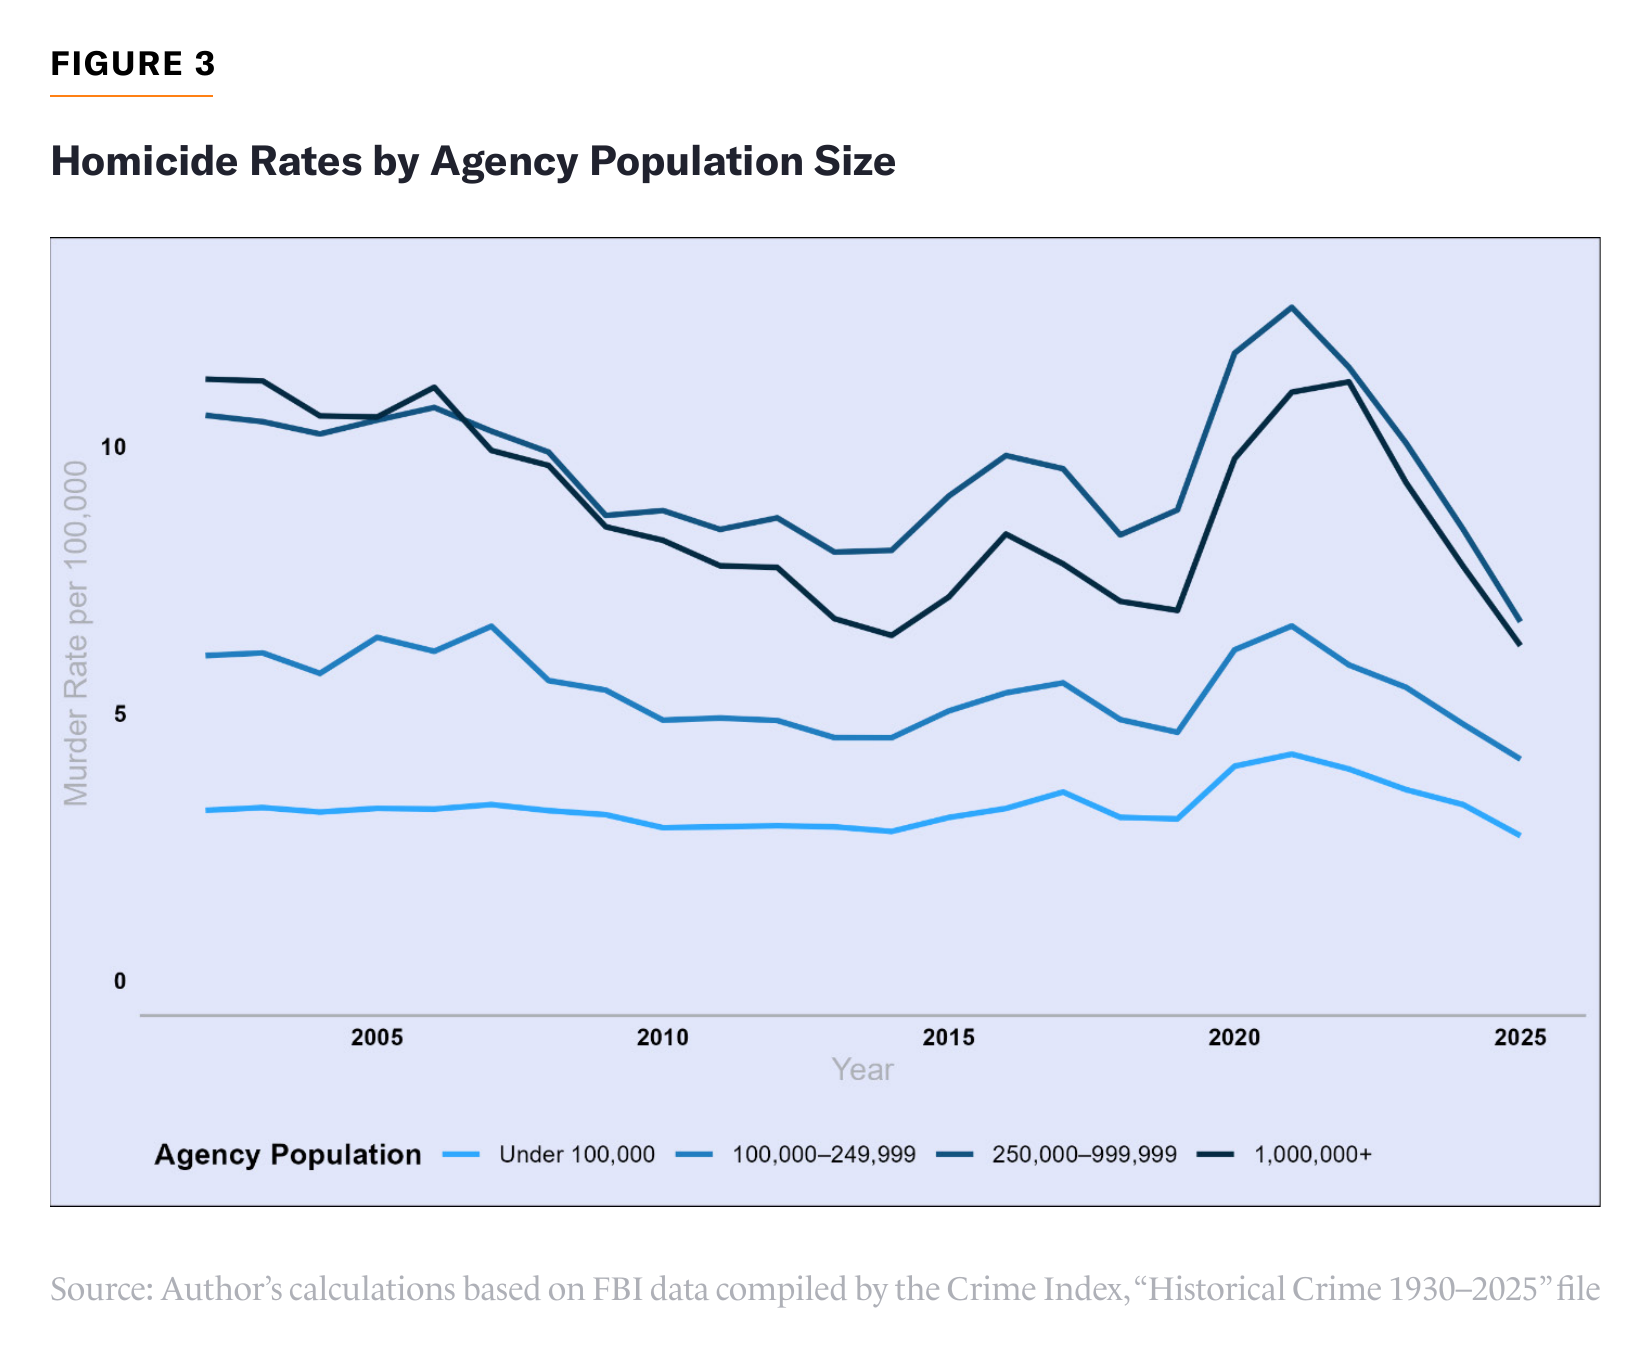
The trends are not just a big-city phenomenon. Similar patterns are seen when examining cities by their population size, depicted in Figure 3, using FBI data compiled into a large historical dataset by the Crime Index. Bigger cities have higher homicide rates, but homicide’s recent rise and fall affected small cities and police agencies, too.
There is, however, not perfect uniformity across cities. My earlier brief noted some cities that stood out, such as Minneapolis, which was home to the George Floyd incident and experienced one of the worst homicide spikes in the country in proportional terms; Baltimore, which had seen homicides skyrocket in 2015, following the death of Freddie Gray, but did not see a further increase in 2020 (and since then, has seen unusually strong improvement); and Newark, which had begun making progress against its homicide problem before the pandemic and managed to maintain pace through it. Such differences can be helpful to sort out which factors had the biggest effects. These cities’ experiences highlight the importance of local viral policing incidents and the ability of improved public-safety strategies to reduce crime.
The broader trends offer two ways of thinking about the recent crime decline. One might narrowly focus on the drastic decrease in homicide since 2022—pointing out that it did not merely undo the spike of 2020–21 but actually brought us to lower rates than Americans had experienced previously, and that homicide had shown little sign of a downward trend for over five years before that. In that case, we need to be looking for things that radically improved after the pandemic.
Or, one might take a broader view: perhaps a much longer-term crime decline began in the mid-2000s, which could have been a continuation or reinvigoration of the phenomena that created the 1990s drop. This fundamental downward trend was merely interrupted in 2015 and 2020—in part by “Ferguson effect” dynamics, in which police back off in the face of intense criticism, but also by pandemic stresses in the 2020 case.
As these dynamics wore off, we returned to a baseline level of crime that was still gradually falling over time. This framework focuses our attention on slower, longer-term trends, while conceding that the spike-and-recovery dynamics of the early 2020s are different and potentially of interest in themselves.
Crime has many causes, and both frameworks almost certainly have something to offer. Some things have changed drastically for the better since the end of the pandemic, while numerous long-term trends have lowered Americans’ baseline tendency toward criminality and stretch back much further.
“Strong Post-Pandemic Recovery” Theories
Some theories for the crime decline focus on the steep drop that began after 2021. In many ways, these are explanations for the initial 2020–21 surge—but in reverse, as they represent a return to normal after a shock to the system. As evidence, one recent study confirms that cities with bigger crime increases during the 2020 spike also saw bigger declines.[8] However, since crime rates have now dropped below their 2019 levels, we need to consider factors that “overshot” their recovery from the pandemic, becoming even better than they had been previously.
Few factors fit that full description, but several may be contributors to the overall decline—such as a rebound in policing activity invigorated by a new focus on serious violence and a return to normal routines after the disruption of the pandemic.
Policing Theories
Connecting the recent crime decline to policing trends requires a somewhat nuanced approach. However, one can weave a compelling narrative by combining a fall and recovery in basic activity and staffing with concerted post-pandemic efforts to stop serious violence.
Basic police activity such as stops and arrests plummeted in many cities during the pandemic and then rose again as crime started to recede[9]—a key piece of evidence for “Ferguson effect” theories. However, these forms of activity generally did not grow to exceed their prior levels and often stayed well below them. Meanwhile, large police departments lost staff during the pandemic and recovered only slowly afterward; cities with more than 1 million in population still had 9% lower staffing in 2025 than in 2019.[10]
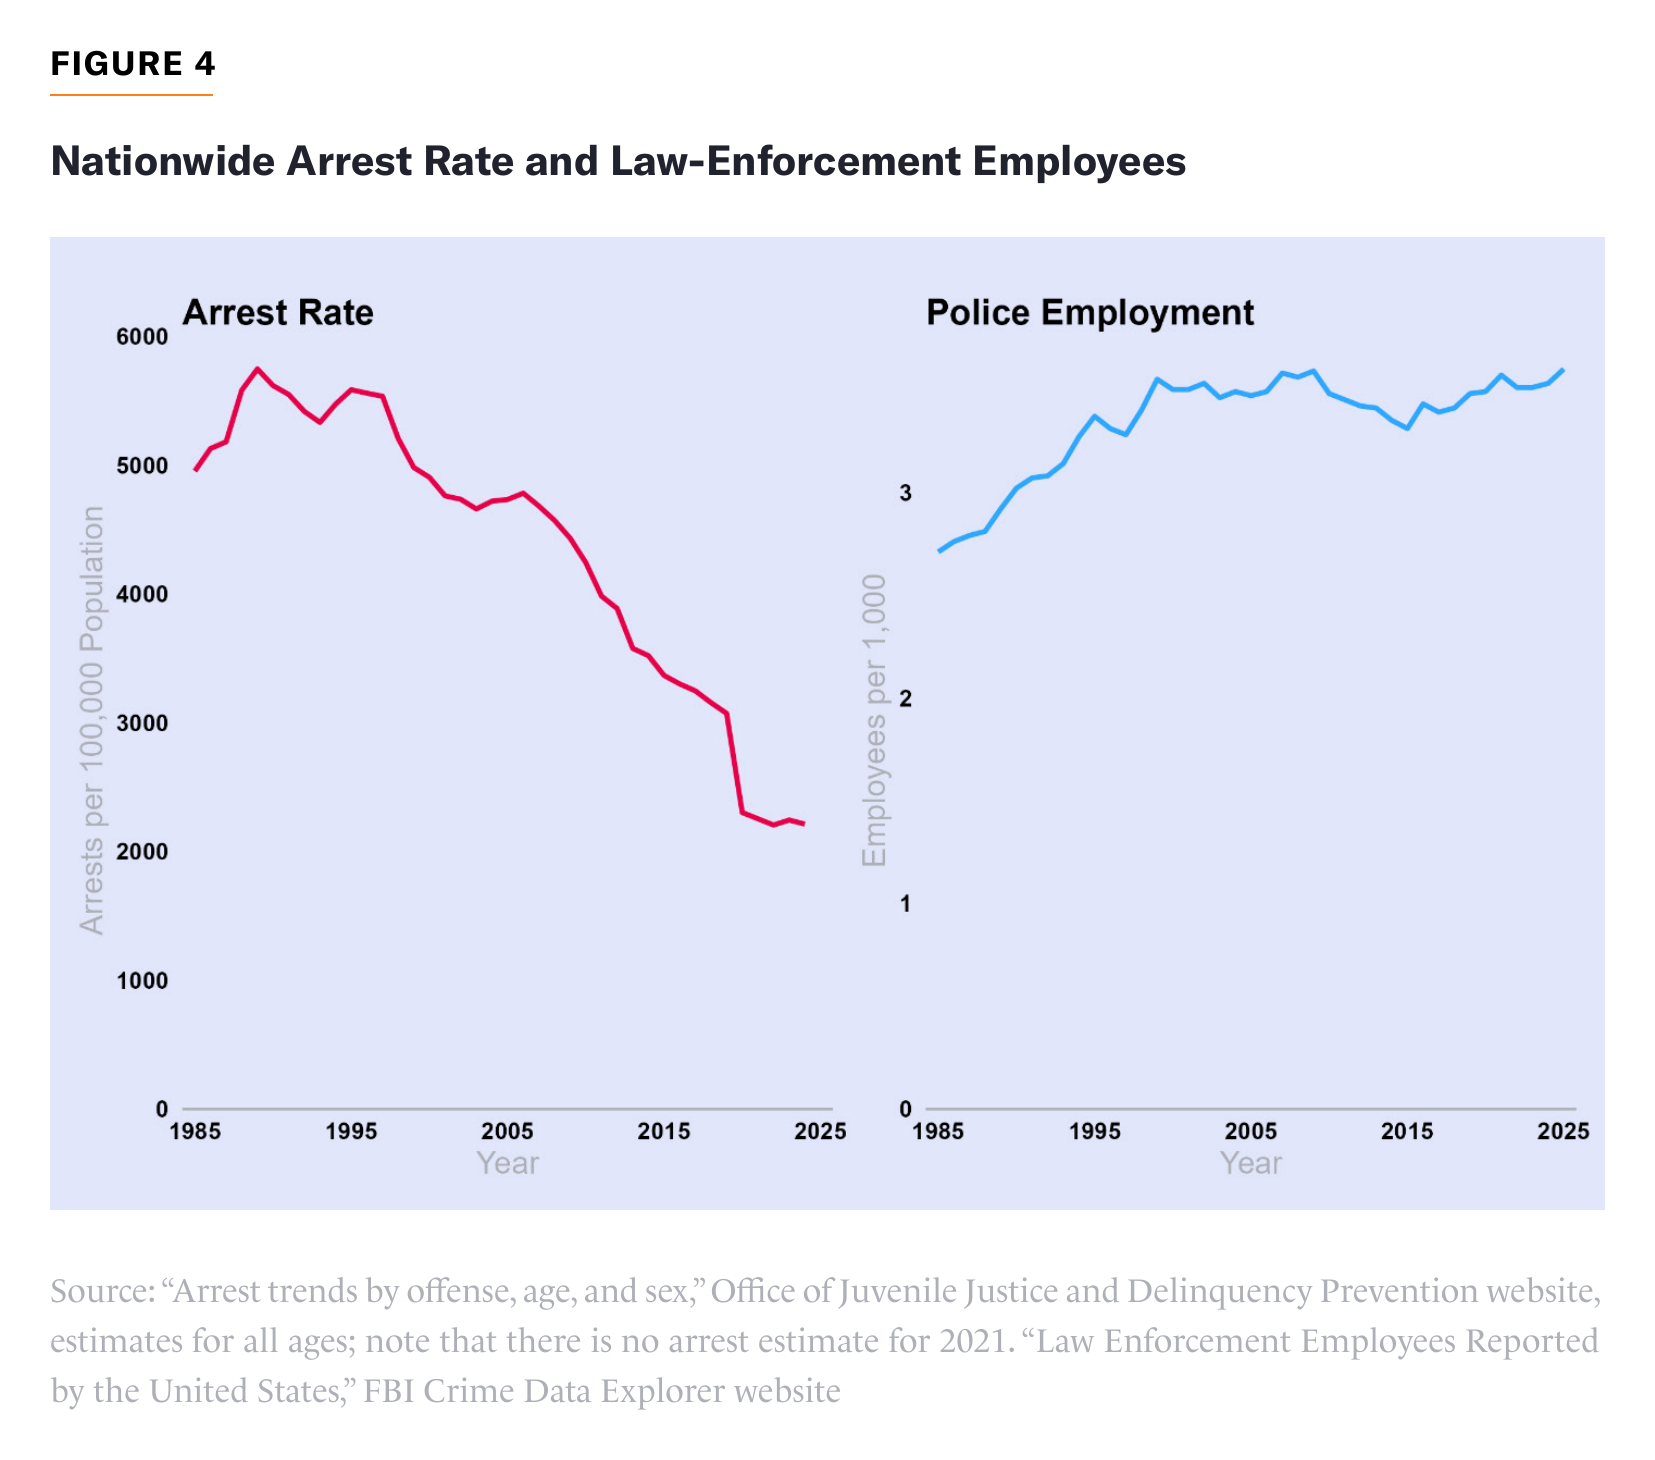
Figure 4 depicts nationwide trends in arrests and law-enforcement employment. The arrest rate has plummeted since the high-crime, tough-enforcement days of the early 1990s and has not recovered from an abrupt plunge in 2020, although low arrest rates partly stem from low crime (i.e., there are fewer offenses to arrest people for). Meanwhile, despite the losses of bigger departments, overall law-enforcement employment nationally is near its historical high point and well above where it stood decades ago. Although there is strong evidence that police employment and activity can reduce murder rates,[11] and while the fast, severe dropoff in policing activity certainly helps explain the 2020 spike,[12] any later improvements in these variables struggle to match the sheer scale of the homicide decline.
Perhaps the missing part of the story lies in improved, targeted tactics, with which departments can control serious crime without necessarily increasing staff.
One major law-enforcement success story is Baltimore—which, as we have already noted, has had elevated rates of violence for decades and suffered a sustained homicide increase after the death of Freddie Gray in police custody in 2015. It not only shared in the nationwide crime decline in the past few years but has seen a stunning two-thirds drop in homicides since 2022, per the most recent Crime Index data.[13] There are several explanations for Baltimore’s success, including a switch to a stricter prosecutor and growing arrests,[14] but a recent study gives a considerable share of the credit to an approach known as “focused deterrence.” This involves making contact with individuals and groups known to be at high risk of serious violence, keeping close tabs on them, offering them social services if they are receptive, and arresting them if the violence continues. The study’s authors confirm that crime fell disproportionately in parts of Baltimore where the strategy was being rolled out.[15]
A recent report from the Niskanen Center points out that crime fell more in Washington, D.C., than in the nation as a whole, “even as the police force shrank to its smallest size in half a century.” The authors credit a “tactical shift toward proactive, upstream enforcement”—and further find that the Trump administration’s deployment of the National Guard to the city produced “a 24 percent reduction in opportunistic property crime in the first six months, with no measurable effect on violent crime.”[16]
Across the country, the administration has made extensive efforts to both deport and encourage the voluntary return of unlawful immigrants, including many with criminal records.[17] From the demographics and regional patterns in homicide depicted in Figure 2, not to mention the sheer scale of the decline, it is clear that unlawful-immigrant crime cannot be the whole story. Unfortunately, U.S. crime statistics do a poor job of tracking offenders’ immigration status, so it is difficult to pin down this policy’s contribution to the crime decline.
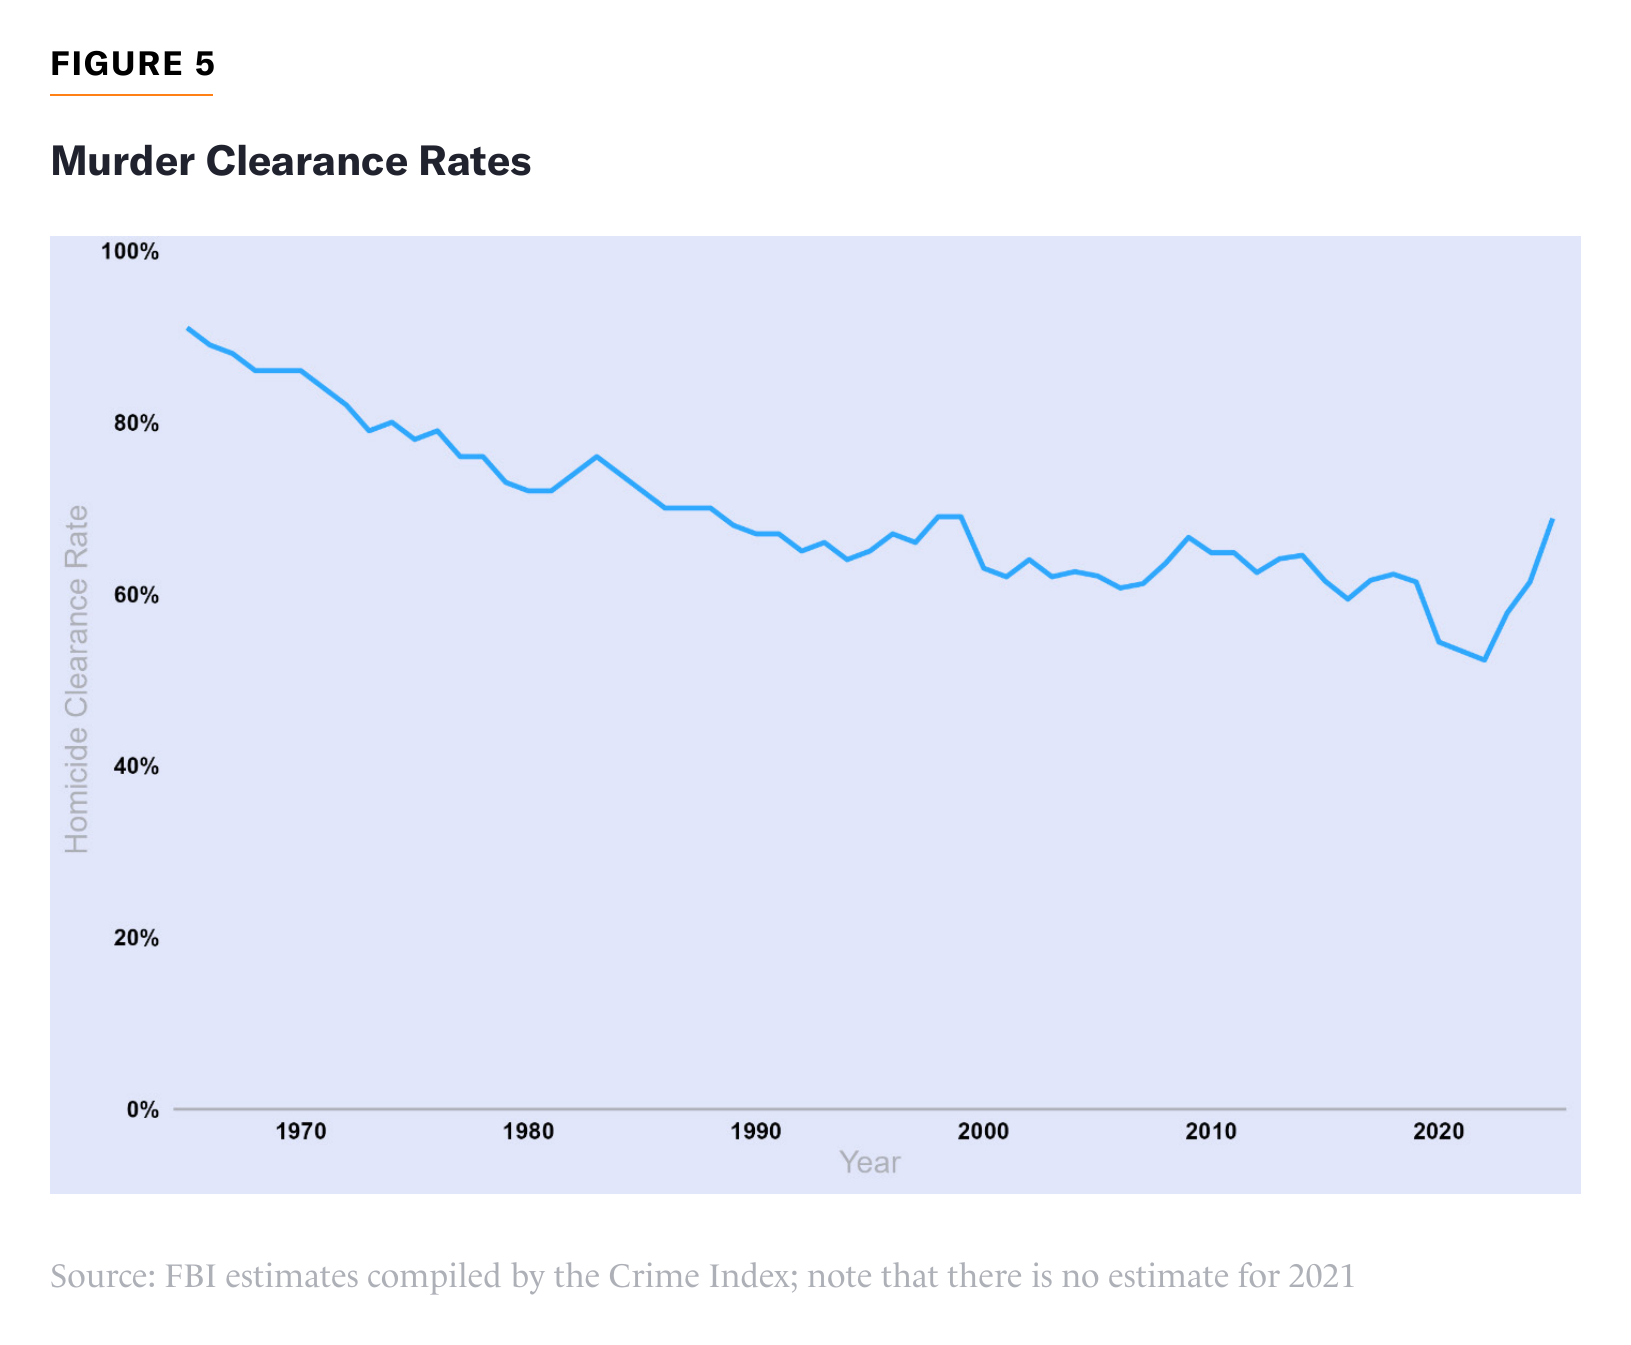
Another important recent policing trend is a marked increase in homicide clearance rates, depicted in Figure 5. To some extent, like the decline in arrests, this increase is a result of the homicide decline—all else equal, detectives solve a higher proportion of homicides when they have fewer homicides to deal with at a time.[18] The numbers can be misleading when clearances are counted in different years from the original offenses. However, the recent improvement in clearance rates interrupts an extremely long-running trend toward lower rates, and it is a rare indicator that, like the homicide rate itself, not only reverted to but improved upon the pre-2020 baseline. It is not entirely clear how this measure improved so drastically and so suddenly. Assuming that this proves to be more than a temporary blip, it deserves considerable further research attention.
A Turn Away from Progressive Prosecutors
Several big-city “progressive prosecutors”—such as George Gascón in Los Angeles and Chesa Boudin in San Francisco—have lost their jobs recently. Such localized events cannot explain such a broad nationwide trend, but stronger prosecution in these places could reinforce the role of renewed police focus on serious crimes. However, most purported “progressive prosecutors” appear to focus their leniency on minor offenses that were unlikely to lead to prison terms to begin with, according to an important study that was unable to detect effects on prison incarceration or crime rates when progressive prosecutors take office.[19] So far, while some individual progressive prosecutors have been accused of alarming behavior,[20] the broader phenomenon seems to have had a small enough impact on serious crime as to be hard to measure.
Idle Hands: Employment and School
Another big-picture theory of recent crime trends holds that changes in young men’s routines, including work and school, played a large role in the rise and fall of crime.[21] Figure 6 depicts the employment and school statuses of men aged 18–29,[22] as well as a measure of nationwide chronic absenteeism for K–12 students (meaning the share missing at least a tenth of the school year) developed by the American Enterprise Institute.[23] Regarding employment, note that “unemployed” means that one is looking for a job, in contrast to “not in the labor force” (NILF), and the latter is divided into those who are in school and not in school. Regarding absenteeism, note that states with available data indicate continued improvement in 2026 but generally have still not returned to the pre-pandemic status quo.[24] Of course, even students who attended school tended to do so remotely in much of 2020 and 2021.[25]
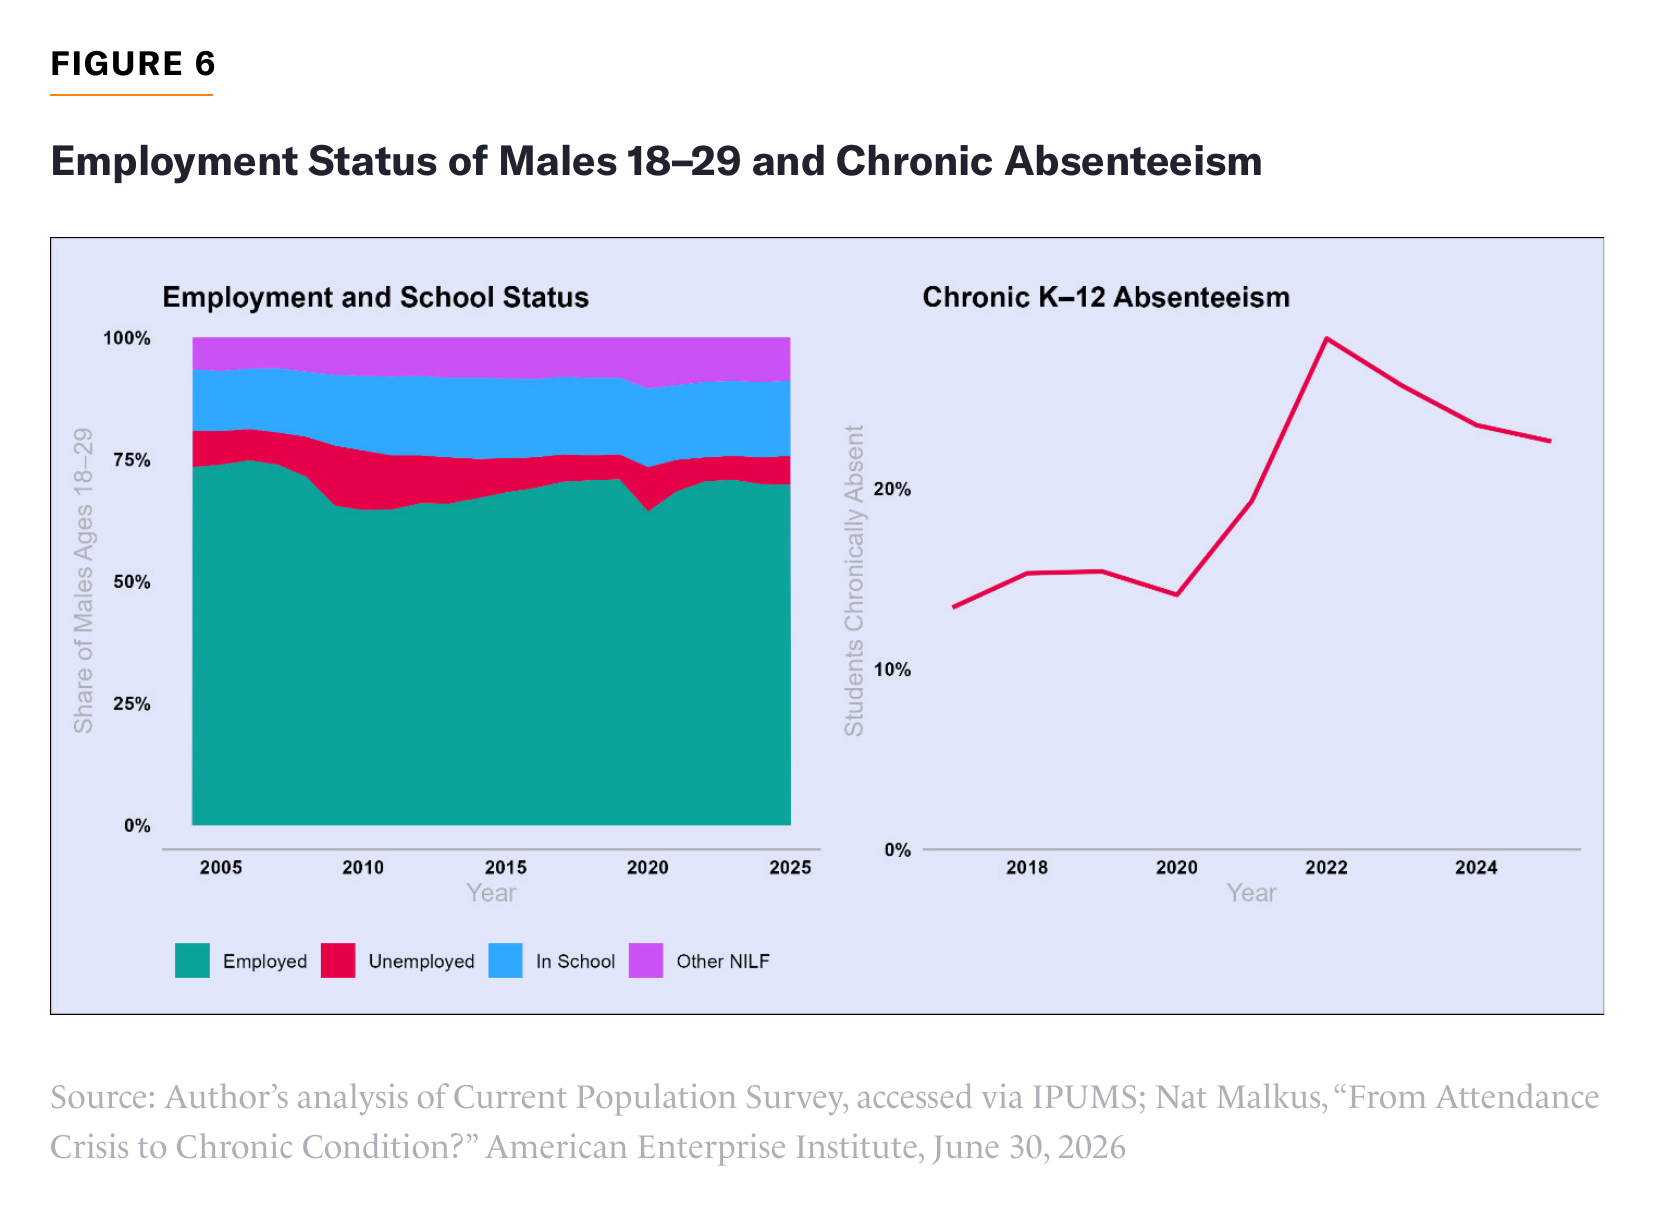
Employment for young adults has some promise as an explanation, with a shock and recovery that resembles homicide trends—although the link between broad economic performance and crime is contested. Previous work has found at least a tentative link between the Covid-related unemployment shock and homicide,[26] although the late-2000s Great Recession years actually coincided with declining murder, as can be seen in Figure 1.
Absenteeism is yet another variable that spiked with the pandemic but never regained its former level, to say nothing of improving upon it. Schools going to remote instruction could theoretically help explain the fluctuations in crime as well, but only for younger age groups; studies of that phenomenon have even suggested that school closures reduced property crime.[27]
Community Violence Intervention
In a recent survey of crime experts conducted by the Council on Criminal Justice (CCJ), the expansion of community violence interventions was one of the most chosen explanations for the homicide decline, with nearly half labeling it a “major factor.”[28] Like focused deterrence, these programs entail intensely concentrated efforts to end violence among extremely high-risk individuals and groups—but with little to no law-enforcement involvement. They employ “credible messengers” from within the community to reach out to those at risk, act as mentors, mediate conflicts, and refer individuals to services.
As CCJ’s own report on the survey noted, experts’ high level of enthusiasm may not be entirely justified:
Evidence is mixed, with more favorable findings for some participants than for neighborhoods overall. A randomized trial in Denver found lower levels of violent offending among participants, while evaluations in Baltimore found reductions in youth homicide and nonfatal shootings that were not statistically significant and varied across sites; studies in Washington, D.C., found no reductions in gun violence associated with CVI, and one found higher gun homicide in one neighborhood. CVI funding and infrastructure also expanded beginning in 2020 and 2021, before the national homicide decline. Among large city and county governments, 28% used American Rescue Plan Act funds for CVI, although about 70% of those investments were concentrated in five jurisdictions.[29]
Local Government Capacity
The crime analyst John Roman has proposed that local-government capacity—a broad concept that includes the ability to fund police and community violence intervention—might be a substantial driver of the rise and fall in crime. Local governments lost staff during the pandemic and then rebuilt, in significant part thanks to federal funds provided by the American Rescue Plan Act (ARPA).[30]
A recent working paper from Ethan Doshi challenges this idea.[31] As readers may recall from Figures 2 and 3, murder fluctuations have been more severe for people and groups that started out with higher levels of homicide, and Doshi points out that factors correlated with crime (such as poverty rates) were used to determine ARPA funding levels. To avoid confusing this pattern—i.e., high-violence places would be expected to have bigger declines when crime falls as well as being prioritized in the ARPA formula—with positive effects from the law itself, Doshi statistically removes the variation in funding that stemmed from these elements of the formula. This focuses his analysis on more idiosyncratic sources of variation. He finds that places that received more funding did not experience measurably better crime declines.
Doshi’s analysis cannot rule out modest-size effects, and some of this money was undeniably spent on things known to reduce crime, such as maintaining police staff. But it does suggest that such effects were on the smaller side. Further research is warranted to quantify any effects more precisely.
Considering these short-term explanations, it makes sense to see much of the recent homicide decline as a (sometimes partial) return to normal after the pandemic and unrest of 2020, boosted by concerted efforts in policing and other realms to drive violence down. However, most of these variables struggle to explain why homicide would be even lower in 2025 than it was in 2019.
Theories of Longer-Term Crime Decline
Instead of restricting their focus to the drop in homicide since 2022, some analysts have offered a longer-term narrative, one where deep structural trends have tended to drive down crime over the past several decades, but short-term dynamics temporarily interrupted the decline in 2015 and then 2020.
These dynamics include the Ferguson effect, in which police back off routine enforcement and crime rises in the wake of viral policing incidents. While this theory remains controversial, this exact pattern has been observed in numerous cities that were home to viral incidents—such as Chicago, when the Laquan McDonald video was released;[32] and Minneapolis, after the death of George Floyd[33]—and the broad strokes of the idea apply just as easily to the nationwide surges in 2015 and 2020. The latter surge, of course, was likely compounded by the stresses of the pandemic.
A recent paper by Jens Ludwig notes that the 2020 murder wave was concentrated in “expressive” gun violence stemming from arguments, as opposed to “instrumental” violence meant to achieve some end (such as a robbery). He contends that the pandemic imposed a “cognitive tax” on individuals’ ability to control violent impulses—a temporary factor that one would expect to recede on its own, potentially explaining much of the recent decline by itself but leaving open the question of why murder is even lower today than it was beforehand.[34]
In a 2024 article, my colleague Charles Fain Lehman proposed a version of the punctuated-long-term-decline theory in which the U.S. has a falling baseline rate of crime—thanks to factors like an aging population, growing surveillance, and improved approaches to policing—but faces recurring “Ferguson cycles.”[35]
More recently, Scott M. Mourtgos and Ian T. Adams proposed that crime trends going back to the 1960s could largely be explained by “criminogenic entropy,” meaning “the number of feasible crime-producing configurations in a society.” They analyzed 15 factors, some of which would be expected to increase crime (e.g., inequality, family disruption, substance use, geographic mobility) and some of which would be expected to decrease it (e.g., incarceration, police presence). They found that the combined fluctuations in these variables nicely track many major trends—including rising crime in the 1970s and 1980s and declining crime starting in the 1990s. Notably missing from their model’s predictions were the temporary increases in violence circa 2015 and 2020, suggesting that one needs other factors to complete the picture. Mourtgos and Adams stress the difference between “structural” and “shock” factors and note the “anomaly” of 2020, when entropy continued to fall but violence shot up. As they explain, their model is not intended to predict exogenous shocks like pandemics and viral policing incidents; the “critical test,” they argue, is what happened afterward: “Rather than persisting, homicide returned to roughly its pre-pandemic level by 2023, realigning with the long-run entropy trend.”[36]
Next, I review some long-running trends that might contribute to a background equilibrium of falling crime. Highlights of this section include a surprisingly small role for population aging since the turn of the century, but plausibly larger ones for young people becoming less rambunctious and police tactics and technology gradually improving.
Demographics
Homicide rates are measured in per-capita terms, but the old are much less involved in violence than adolescents and young adults, and the U.S. population is quite famously aging as the large baby-boomer generation retires.
Per census data, the share of Americans falling into the 15–29 age range surged from 20% to 27% between 1960 and 1980 and returned to 20% around the turn of the millennium. Demographic shifts like these have been found to explain a modest proportion of the rise and fall of crime in the late twentieth century.[37] However, this particular figure held roughly steady, at 19%–21% through 2024 as the relatively large millennial generation reached maturity but delayed childbearing. It can be expected to fall in the near future, though, as birthrates began to decline in the late 2000s and those shrinking cohorts are now entering prime crime ages.[38]
Another way to see the impact of twenty-first-century population aging is to compare CDC’s raw per-capita homicide death rate with the same “age-adjusted” statistic as seen in Figure 7, noting that these data pertain to victims, not offenders. (Offenders are very often never identified, but from available data, they do appear to skew somewhat younger than victims, so this approach probably underestimates the total effect of age on the commission of murder.)
CDC estimates this figure by re-weighting each year’s deaths to reflect a specific age distribution—so if, say, 70-year-olds become a bigger share of the population over time, their death rates will get less weight in data that are adjusted to an earlier year. In this case, the distribution is standardized to the year 2000.
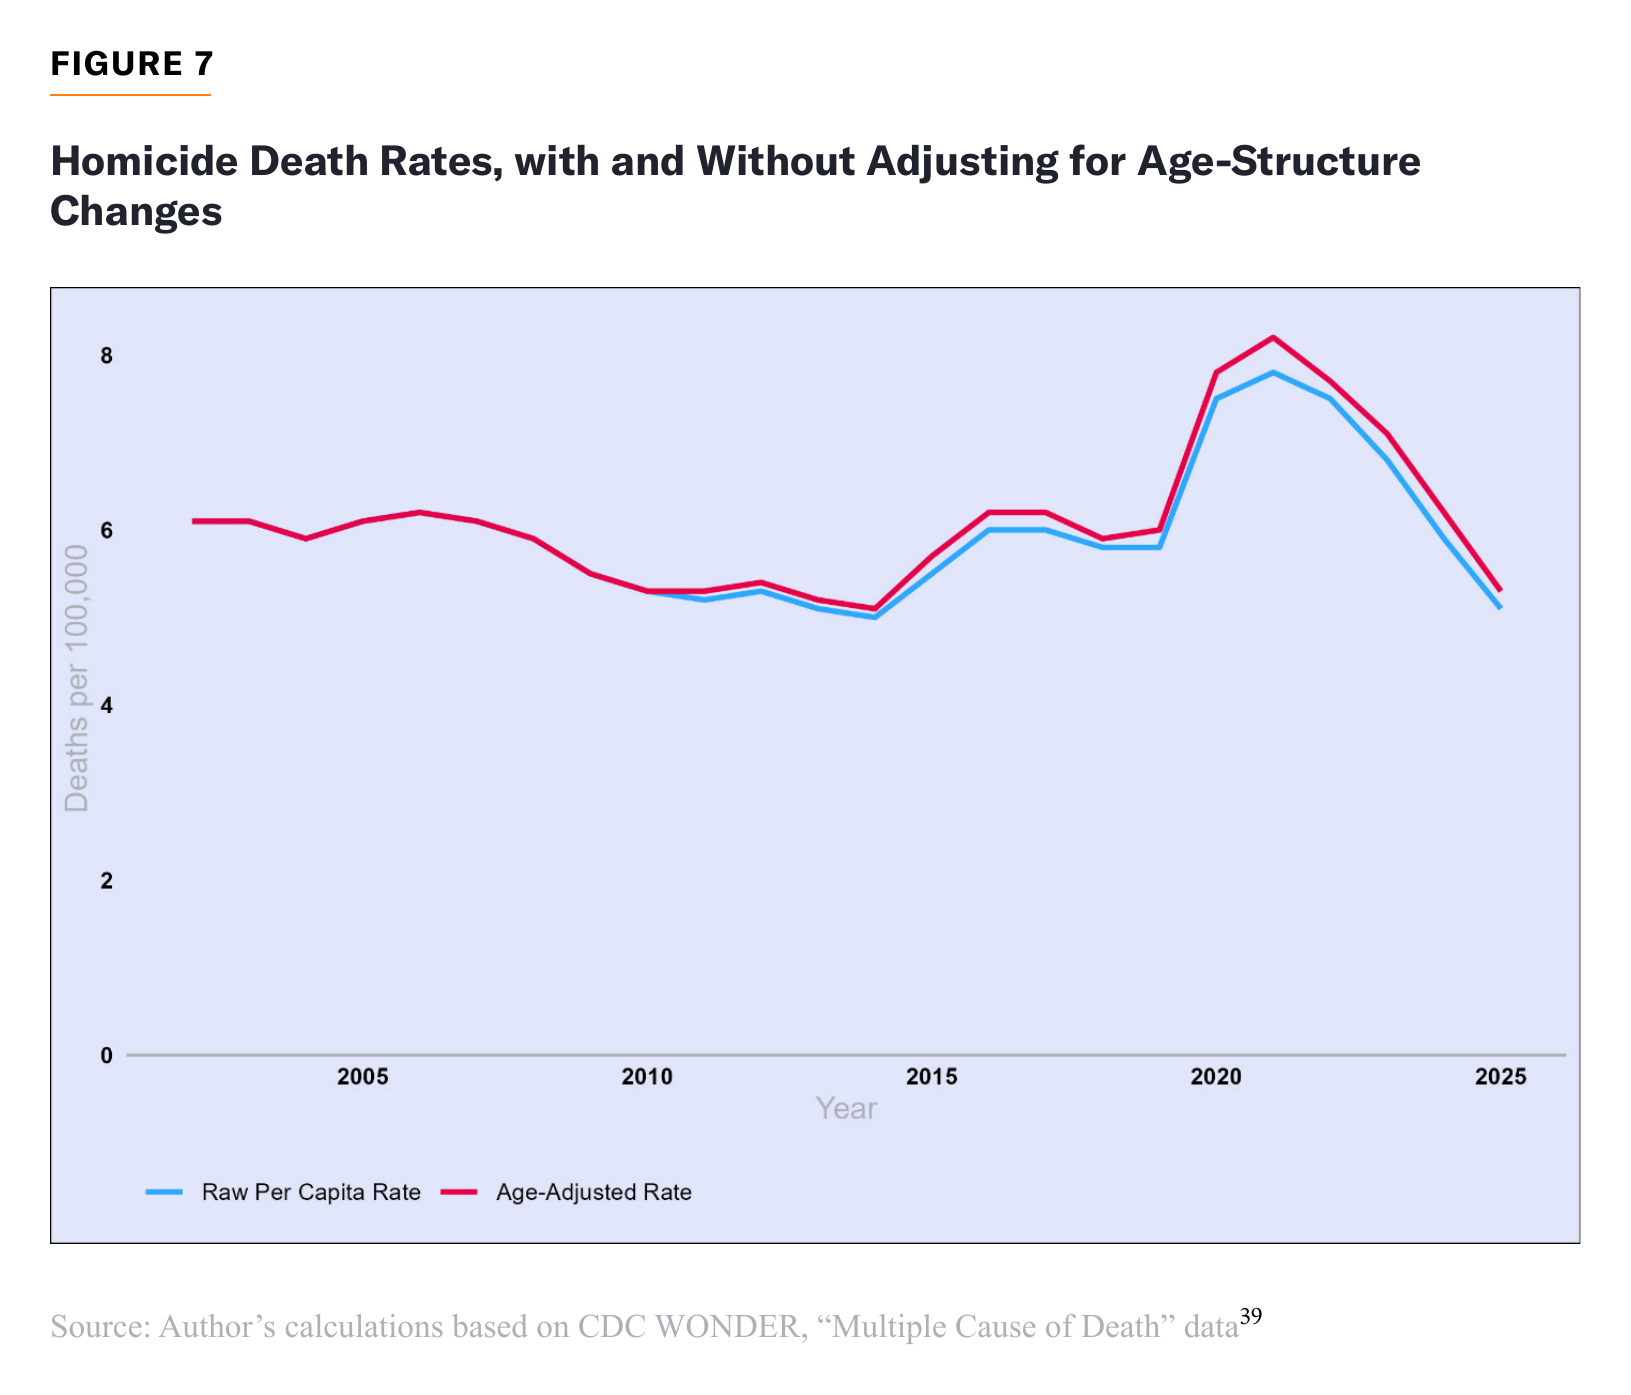
We would have a higher homicide rate in a world where Americans had the age distribution of 2000 but death rates by age were held constant. But the difference is tiny—a rate of 5.3 instead of 5.1 per 100,000 in 2025.
The Pacification of the Young
Adolescents and young adults may not be too few in number yet, but they are less rambunctious. For example, Figure 2 shows that younger age groups had a particularly pronounced homicide decline earlier this century, before the violence waves of 2015 and 2020.
Relying heavily on surveys of high school students, the psychologist Jean Twenge has meticulously documented the myriad ways in which young people have calmed down. Previous generations of parents worried about fistfights, drinking, and teen pregnancy; today’s parents worry about kids never looking up from their phones and video games. The new approach to youth may be bad for social adjustment, healthy romantic relationships, and, ultimately, fertility, but it is not hard to imagine how increasingly docile cohorts of young people would reduce crime rates.
In a 2019 paper, Twenge and a coauthor documented a “decline in adult activities” among adolescents that, in some cases, stretched back to the 1970s but tended to accelerate in the current century—things like “having sex, dating, drinking alcohol, working for pay, going out without their parents, and driving.” Twenge believes that the internet helped drive these trends and that they reflect a “slow life strategy” focused on avoiding risk.[40]
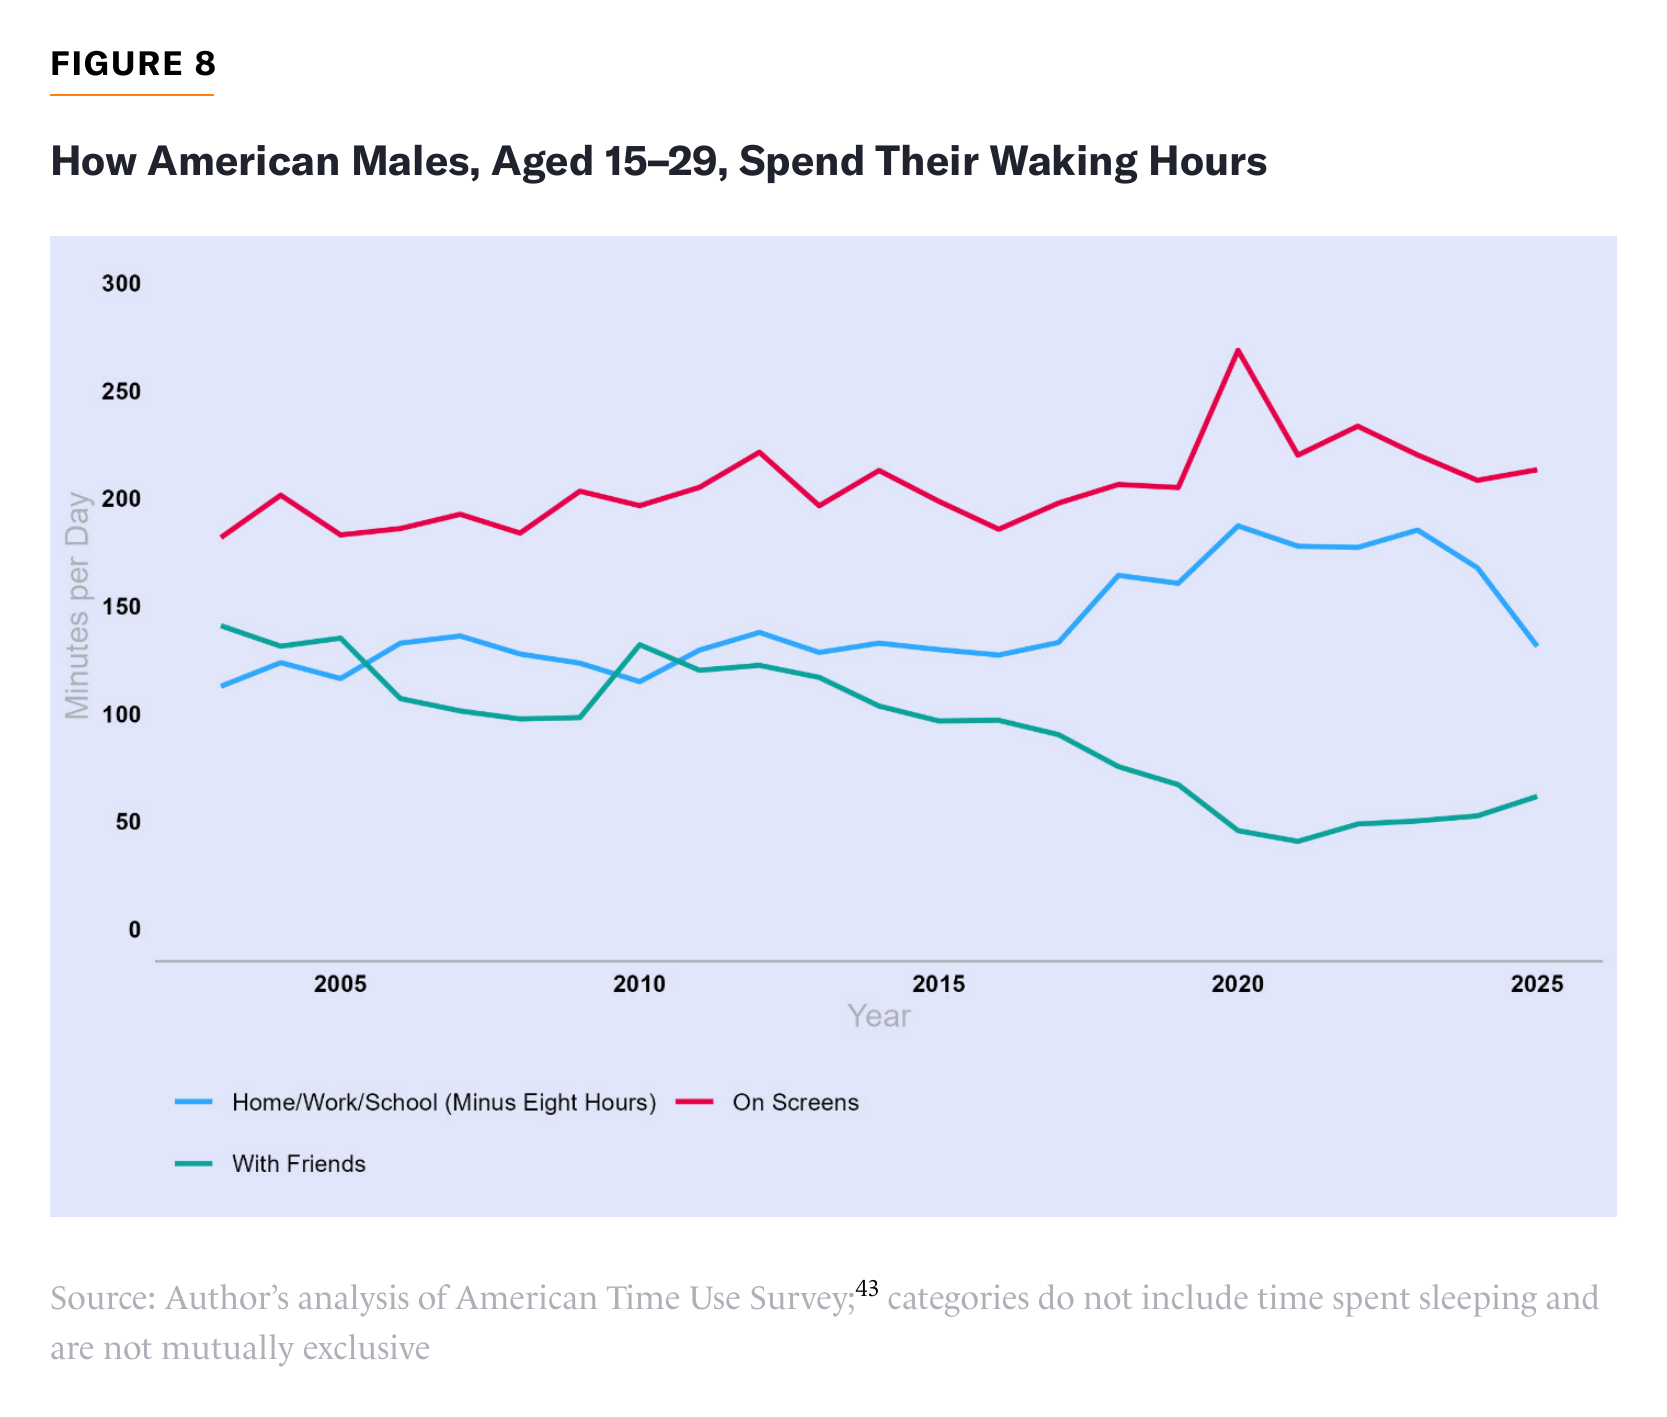
Young Americans have also changed how they spend their waking hours, shifting to more passive entertainment and less social interaction, which I document for males aged 15–29, using the American Time Use Survey in Figure 8. Their rise in screen time (summing up television, computer use for leisure, and “playing games,” although the last technically includes board games in addition to video games) has been milder than one might expect; as another study has documented, the increase in smartphone use came largely at the expense of television.[41] They’ve also spent more time in more controlled environments, which I depict as time spent in excess of eight hours at home, school, or the workplace.[42] And men have especially spent less time with their friends, which could lessen the potential for mischief and peer conflict even as it erodes social capital. All these trends were especially pronounced during the pandemic, which is exactly when violence spiked. It may matter, for example, whether being at home is a choice or a disruption of usual activities.
Policing
In the previous section, I noted that advances in policing, as well as the targeted deployment of police amid the post-2020 violence spike, could help explain the short-term decline in homicide. It’s worth adding that this is part of a much longer-running process. The 1990s NYPD pioneered the practice of meticulously tracking crime locations and addressing any patterns that emerge through increased police presence and basic problem-solving, which can include activities like adding lighting or greening vacant lots where problems recur. The focused-deterrence strategy that is helping Baltimore was first rigorously demonstrated in Boston several decades ago, as well.[44]
One broad trend has been for agencies to focus on serious violence while avoiding broader forms of enforcement that can inflame public passions. Back in 2011, the NYPD generated controversy by stopping and frisking almost 700,000 people in a single year;[45] a lawsuit alleging racial discrimination forced deep changes to the practice. More recently, by contrast, an important study has shown the success of its “gang takedown” efforts, a form of “precision policing” in which police arrest gang members in coordinated raids for conspiracy prosecutions. This technique reduced gun violence in and around affected public-housing communities by a third.
Unfortunately, these interventions tend to be studied on a short-term, department-by-department basis. With 18,000 police agencies throughout the U.S. and no comprehensive database showing which departments used which strategies when, it would be hard to determine how advances like these affected nationwide crime trends over several decades. But they certainly deserve to be part of the conversation. Police approaches to crime have benefited immensely from a growing body of research into what actually works.
Police have also acquired new technologies, including surveillance cameras, gunshot detection, and license-plate readers, and established “real-time crime centers” that combine various technologies to guide police as they respond to incidents. There is good evidence for many aspects of this approach, including the bundling of multiple technologies through real-time crime centers and the focus on finding video evidence,[46] though research on many specific technologies remains in its early stages—and there has been serious backlash to the use of license-plate readers—on privacy grounds, putting the future of these strategies in doubt.[47]
Private surveillance technology has also proliferated. Cell-phone ownership went from rare to almost universal between the 1980s and the 2010s. A 2015 study connected the proliferation of phones with a decline in property crime,[48] while a more recent study finds that cell phones may have reduced murder in the 1990s by undermining turf-based drug dealing.[49] Today’s cell phones have instantly accessible video-camera capabilities.
In general, crime today carries a much higher risk that the offense will be documented, witnesses will be able to quickly contact police, and police will be able to respond quickly—even if a great many crimes are still never solved.
Guns and Other Crime-Related Factors Worth Noting
Last, I note three factors that, while always relevant to discussions of crime, do not neatly fit the trends on which this report is focused.
Gun laws and gun ownership are the first. Most American homicides are committed with guns—and, as noted, the recent rise and fall were heavily concentrated among firearm homicides[50]—but the legal regime surrounding gun ownership and carrying has steadily liberalized over the past two decades as murders have risen and then fallen to half-century lows, with the Heller and Bruen decisions from the Supreme Court coupled with nearly 30 states now allowing the concealed carry of firearms even without a permit.[51] There has been a modest increase in self-reported gun ownership in the past few years, depicted in the first panel of Figure 9 using two sources of survey data, though it is unclear to what extent the 2025 drop in the Gallup data is a quirk or a sign that the increase could settle back to the pre-pandemic norm soon.[52]
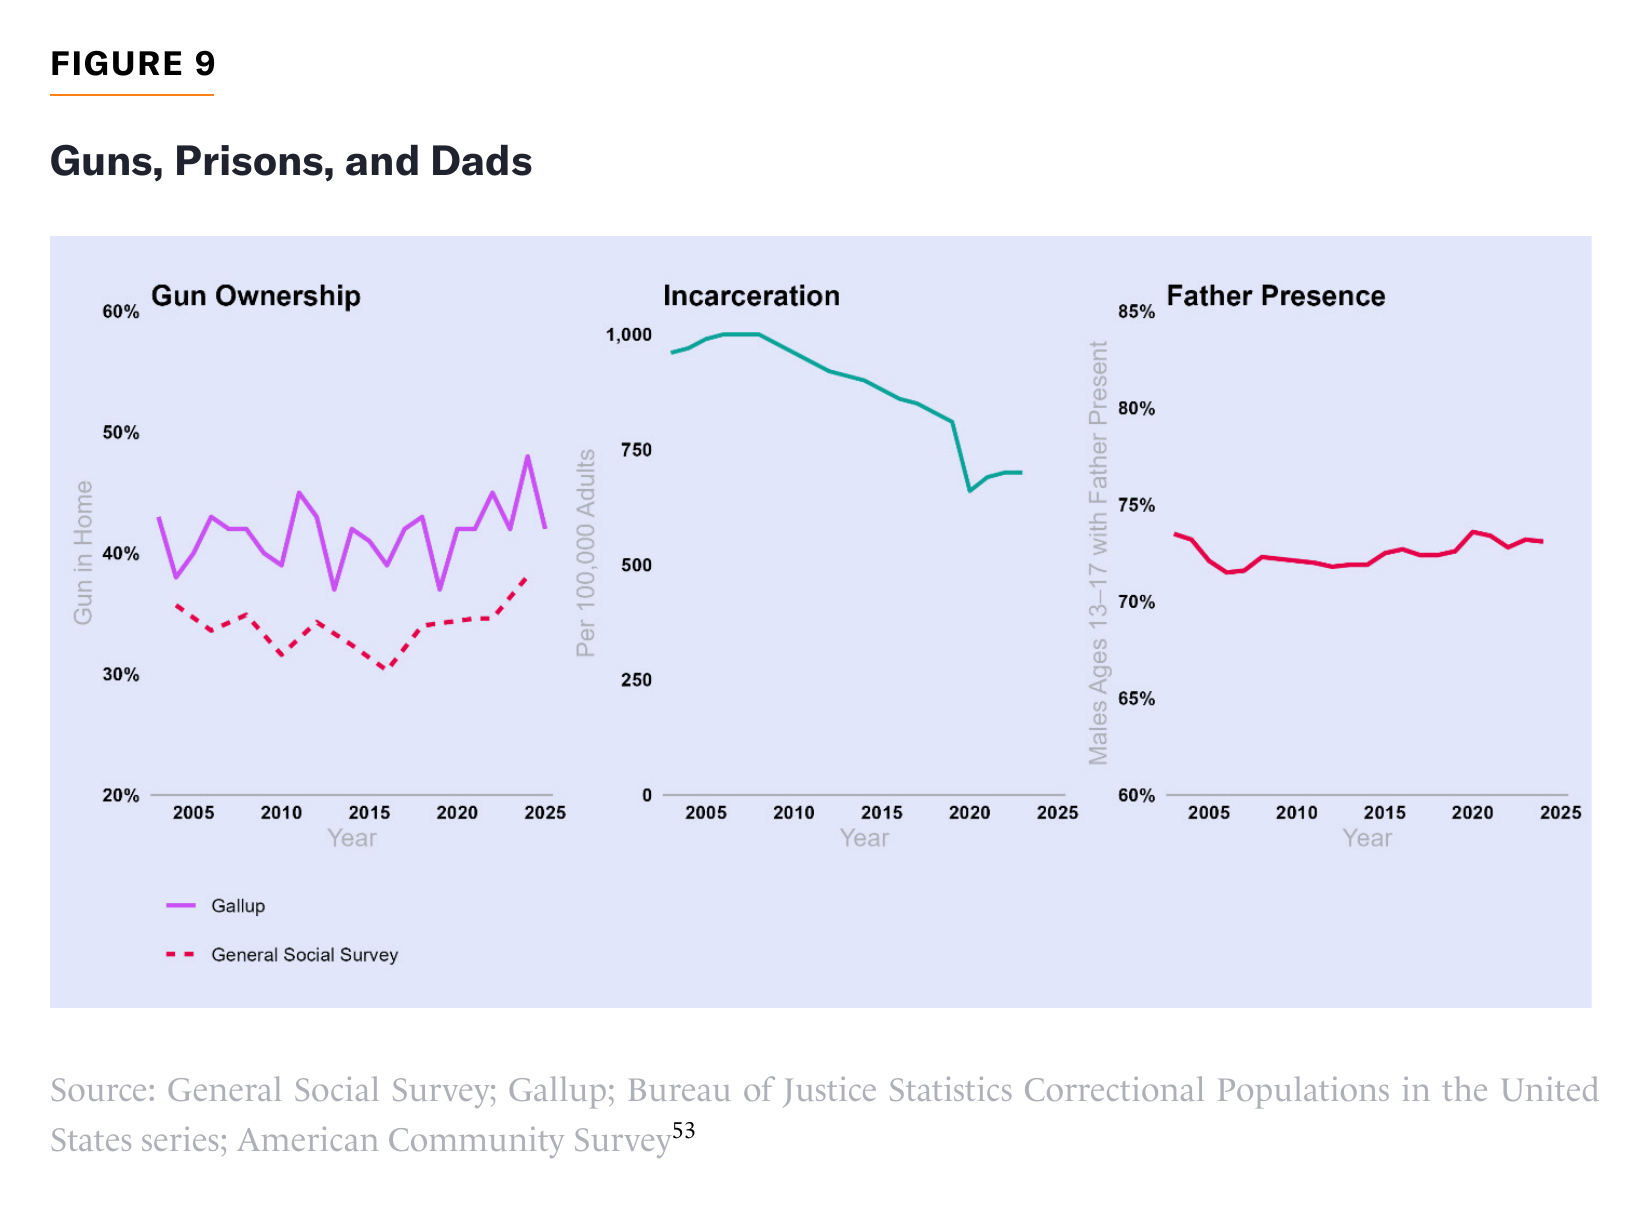
Other measures of gun availability might provide at least some explanatory power. New gun purchases surged during the pandemic (corresponding to the increase in ownership), which some connected to the homicide spike. However, new sales are accompanied by background checks, there was not a strong geographic link between the sales and the spikes in violence,[54] the new stock came on top of the hundreds of millions of guns that Americans already owned, and the later dropoff in sales did not make all those new guns disappear (leaving it mysterious as to why murders then fell). Some have pointed to increased gun carrying during the pandemic as a potential explanation of recent trends, though this can be measured only indirectly, such as through the percentage of police stops that result in gun confiscation, which will also be affected by the changes in policing practices over this period, not to mention changes in how frequently members of the public leave home.[55]
A sensible way to think about gun explanations more broadly: from the surge and fall in firearm homicides, we can infer that Americans changed their behavior with guns during this time; and America being awash in firearms certainly affected how the stresses of 2020 played out. But Americans’ access to guns did not fundamentally change during this period, and murders are now at a multigenerational low, which did not happen because the U.S. population disarmed.
Incarceration is another factor that does not fit—at least, not neatly. Rising incarceration has widely been studied as a likely contributor to the crime drop of the 1990s,[56] but the incarceration rate has been declining for most of the current century and fell especially hard in 2020.[57] Like many other factors, it can help explain the increase in murder rates in the pandemic, but it cannot explain the decline afterward.
A similar story obtains for family structure. Out-of-wedlock births and fatherlessness were frequently posited as reasons that crime rose in the 1970s and 1980s; but crime fell afterward, despite the out-of-wedlock share continuing to rise until the late 2000s and leveling off (about 40 percent) with only minor improvements thereafter.[58]
The second and third panels of Figure 9 depict the U.S. incarceration rate and the share of males aged 13–17 with a father present (including adoptive and stepfathers) in the home, a different way of measuring changes in family structure that has also seen only minor improvement. Note that the y axes on the gun and father presence charts do not start at zero, in order to give a little more visible detail to the trends.
Conclusion
To date, there is not enough evidence to accurately partition the new crime decline into all its constituent causes. Given the limits of social-science methods and the still-unresolved debates over the similar 1990s decline, that time may not come. The most compelling narrative thus far combines a strong pushback to the violence explosion of 2020—including renewed policing activity, concerted antiviolence efforts, and economic recovery—against a backdrop of a progressively less crime-prone and more heavily surveilled society.
About the Author
Robert VerBruggen is a senior fellow at the Manhattan Institute, where he provides policy research, writes for City Journal, and contributes to special projects and initiatives in the president’s office. Having held roles as deputy managing editor of National Review, managing editor of The American Conservative, editor at RealClearPolicy, and assistant book editor at The Washington Times, he writes on a wide array of issues including economic policy, public finance, health care, education, family policy, cancel culture, and public safety. VerBruggen was a Phillips Foundation Journalism Fellow in 2009 and a 2005 winner of the Chicago Headline Club Peter Lisagor Award. He holds a B.A. in journalism and political science from Northwestern University.
Endnotes
Are you interested in supporting the Manhattan Institute’s public-interest research and journalism? As a 501(c)(3) nonprofit, donations in support of MI and its scholars’ work are fully tax-deductible as provided by law (EIN #13-2912529).