Rethinking Federal Student Aid: Despite Many Problems, Loans Have Enabled Millions To Obtain an Education

Photo: Rattankun Thongbun / iStock / Getty Images Plus
In 1965, the federal government passed the Higher Education Act (HEA), which paved the way for today’s federal student loan program. Its stated goal was “to provide support to both individuals pursuing a postsecondary education and institutions of higher education.” More than a half-century later, the program’s success can be characterized as mixed, at best; the total student loan portfolio balance exceeds $1.4 trillion, with significant levels of delinquency.[1]
Much of the policy debate about student loans centers on the amount of debt that has already been issued, escalating default rates, and what can be done to make repayment more affordable. But often overlooked in this policy debate is the overall health of the student loan portfolio.
Fewer than 40% of student loans are fully repaid, often for reasons other than default. At the same time, new student loan refinancing companies are targeting the portfolio’s lowest-risk borrowers, which results in a higher-risk, lower-performing federal student loan portfolio.
While rates of default and non-repayment are high and expected to grow, millions of borrowers have obtained an education that otherwise might not have been possible. At the same time, the program has allowed the government to reduce unemployment levels, by shifting large numbers of people into higher education.
Student Loans Are Unlike Any Other Loan
Like most loans, student loans extend credit from a lender to a borrower; in many ways, this is where the similarities end. They differ from most traditional loans—auto loans, credit-card accounts, or mortgages—in how they are granted, how they are repaid, and, most important, the rate at which they are repaid. These differences matter because they make it difficult to quantify the value of the student loan portfolio and, therefore, difficult to assess the true cost of the program.
In most traditional loans, access to funds is extended by the lender in anticipation of future cash flows that include interest payments. This interest compensates the lender for taking on risk and for the lost opportunity cost. Potential borrowers are assessed for their ability, stability, and willingness to repay. In some cases, collateral may be required. Then, based on an assessment of these relative risks, an interest rate is agreed upon, and a repayment schedule is established.
But for federal student loans, there is no risk review of most individual borrowers. Nor is there tangible collateral for the lender to hold. After all, how do you repossess an education?
In addition, the repayment of student loans bears little resemblance to that of most traditional loans. Student borrowers have considerable flexibility on the timing of their first loan payment, and they can repeatedly renegotiate the loan’s repayment terms through deferral, forbearance, or other options, based on their personal situation. Furthermore, some student borrowers—including a significant number of graduate student borrowers—qualify for loan forgiveness. Often available for those working in public service occupations, loan forgiveness allows borrowers to make smaller payments over a set number of years—at which point, the balance of their loan is forgiven.
Even students who do not qualify for forgiveness or forbearance have an option that other types of loans do not provide. Income-based repayment (IBR) plans allow borrowers to tie their monthly payments to their income, which can vary significantly over time. Of the $355 billion currently in IBR plans, the Government Accountability Office recently estimated a loss of $74 billion.[2] IBR enrollment is expected to continue to grow, which will only increase the variability of student loan repayment.
Traditional loans rarely, if ever, offer these flexible repayment options. As a result, traditional loans are almost always categorized as performing (payments are being made on schedule) or nonperforming (payments are not being made on schedule). For student loans, by contrast, these simple categories of performance are murky. Because student borrowers can change repayment terms, it is more difficult to value the full portfolio of these loans.
Performance Data Compel a Closer Look at Student Loan Goals
The biggest challenge in accurately assessing the value of the student loan portfolio is the probability of loan repayment. In 2017, the National Center for Education Statistics (NCES) released a study that examined the rate of student loan defaults over a 20-year period. It revealed a default rate of about 28% for students who began their postsecondary education in the 1995–96 academic year.[3] Compounding this high rate of default is the low rate of complete loan repayment—fewer than 40% of borrowers completely repay their loans, according to the analysis.
A more granular analysis of the data gives a fuller picture of student loan repayment: 23.6% of loans were paid off within 12 years. Given the prevailing interest rate at the time (8.25%), and assuming that these loans were paid off using the standard 10-year payment schedule, the total amount paid would have been about $1,472 per $1,000 borrowed; 14% of the loans were paid off within 20 years. At the prevailing rate and assuming payments on a 20-year schedule, the total amount paid would have been about $2,045 per $1,000 borrowed; 3.7% of the loans appear to have been forgiven (though specific payment data are not readily available).
Nearly 38% of student loans for this cohort were paid in full at the end of 20 years. But only 28% of loans granted to borrowers in this class were characterized as defaults. This highlights another important issue when attempting to assess the market value of the student loan portfolio: many borrowers never fully repay their loans for reasons other than default. Policymakers should take this into account when considering the value of federal student loans as pure investment vehicles for the federal government.
Repayment Trends Will Continue to Confound an Accurate Valuation
It is possible that the high default rate in 1995–96 cohort is an anomaly, perhaps the result of a stagnant economy, but it’s not likely. Judith Scott-Clayton, a professor of economics at Columbia Teachers College, extrapolated the lifetime performance for this cohort to compare it with 2003–04 student borrowers. She projects that loans made to the 2003–04 cohort will have an even higher default probability.[4]
Moreover, current student loan balances reveal a disturbing trend. From 2008 to 2017, the percentage of borrowers who were making sufficiently large enough payments to reduce their loan balances fell by 24%. That means that even fewer loans are on the road to being paid off by reducing both principal and interest with each payment. This supports Judith Scott-Clayton’s findings and portends a dismal outlook for future cohorts.
With the 1995–96 cohort, just over one-third of loans from earlier borrowers were ever fully paid. Of current borrowers in this cohort, only about 28% are reducing their student loan balances with monthly payments.
Another factor that will continue to affect repayment is the changing demographics of student borrowers. The number of college students has remained reasonably consistent for the past 10 years, but the number of borrowers under 30 years old has decreased steadily. More than half of new borrowers are over 40 years old, with those over 65 representing the fastest-growing segment. Borrowers over 40 years old also have higher loan balances, on average, compared with their under-40 counterparts ($33,200 versus $30,200, respectively).[5] Studies show that as the age of the borrower increases, so does the probability of default.[6] And these higher levels of default occur regardless of the type of institution attended, whether the borrower graduated, or if a degree is earned. Data on these changing demographics are limited because this phenomenon is fairly recent. But policymakers should consider the potential impact that borrower age has on the portfolio’s performance.
Furthermore, the number of women attending college has increased drastically; women now constitute the majority of the college-educated workforce in the United States. Because women graduate at higher rates than men, this change might be expected to improve the overall health of the student loan portfolio. However, on average, women graduate with higher levels of borrowing and lower starting salaries than their male counterparts.
Compared with Other Asset (Debt) Products, Student Loans Are in a Class of Their Own
When traditional loan portfolios are valued, the typical practice is to discount future cash flows to the present day—and then to compare them with similar asset classes as a point of validation. But there is no good way to validate our assessment of a student loan portfolio because no asset is truly comparable, especially in terms of default or nonpayment rate.
Moreover, when trying to assess student loans against other types of comparable asset (debt) products, startlingly few options provide valuable context. One might, for example, consider another more high-risk benchmark such as high-yield bonds, which are frequently used by risky borrowers to raise capital. But in the past 25 years, these bonds had a maximum default rate of 14.25%, during the financial crisis,[7] and, more recently, the default rate dropped to just over 3%. These bonds also have fixed and stable terms, which help facilitate a more accurate valuation at any point in time, and they are subject to an initial risk assessment, which student loans don’t contain.
Credit-card receivables, in the form of asset-backed securities (ABS), are like student loans in that these securities are an asset with intangible collateral. Like high-yield bonds, credit cards have high interest rates, often exceeding 25%. These high rates help compensate lenders by mitigating risk. However, these rates are about five times higher than the interest rates for student loans. Even during the 2008 financial crisis, delinquency rates for credit cards were less than 7%, according to the Federal Reserve Board.[8]
Newer Players Are Now Skewing the Portfolio’s Risk Profile
Lenders understand that a loan’s interest rate is compensation for the cost of lost opportunities, as well as the risk associated with a borrower’s ability to repay the loan. When repayment terms of a student loan change, the interest rate remains the same; thus lenders don’t receive compensation for the increased period of risk or for other investments that could have been made. As a result, these changes can affect the value and performance of the loan portfolio. Private lenders are acutely aware of this, and their review of a loan portfolio’s health allows them to readjust lending allocations and to end or initiate new loan programs to improve the portfolio’s risk management, sustainability, and profitability.
In reviewing the health of the federal student loan portfolio, we might consider the extent of student loan refinancing outside the federal student loan program as a positive metric.[9] But this practice is likely increasing the risk of the portfolio and making it more difficult to evaluate accurately.
Since the financial crisis, new companies, such as SoFi and CommonBond, have refinanced student debt at lower rates for hundreds of thousands of borrowers. But there’s a catch: most of these companies are interested only in the lowest-risk borrowers—those who graduated from top schools with high-demand degrees, such as engineering and computer science.
The more selective the school, the lower the probability of a loan default, according to a New York Federal Reserve Bank report.[10] Because these students represent the lowest-risk borrowers, lenders can offer terms that are attractive to both the student and the investor.
This student debt is then bundled, much like other types of debt, and sold by these refinancing companies to investors as ABS. This trend has several negative effects on the federal student loan portfolio. Prepayments mean that less interest is paid to the federal government than would be otherwise. Prepayments can also belie a loan portfolio’s actual payoff performance. Early loan payoffs, via refinancing, may give the impression that loans are being paid off on schedule, but they provide very little benefit to the overall portfolio in terms of interest paid and performance.
Additionally, outside refinancing increases the risk profile of the federal student loan portfolio, since it pulls out the lowest-risk borrowers—those most likely to fully repay their loans. Programs with this type of cherry-picking, or adverse selection, are not fiscally sustainable over the long term. And without a backstop, more low-risk borrowers are likely to leave the federal loan pool. Currently, there are no student loan prepayment fees that might mitigate this lending risk; federal student loans, like most U.S. loans, can be paid off at any time without penalty.
The ramifications of this refinancing can affect student borrowers beyond a lower interest rate. When a loan is refinanced by one of these companies, borrowers no longer have access to federal repayment options, should their personal circumstances change. Borrowers who refinance outside the federal student loan program give up these safety-net options—including income-based repayment.
Looking at the Portfolio Through a Macroeconomics Lens
As we consider the state of the student loan portfolio today, it is worth looking at the stated purpose of the Higher Education Act (HEA) of 1965 when it was first instituted more than 50 years ago. College enrollment has increased about 500% since 1960.[11] Academic employment has also increased, growing more than 300% between 1970 and 2016, although the number of fulltime employees at postsecondary institutions grew at a slower rate, just over 200% during the same time period.[12] That said, it’s not clear if the act’s aspirational goals have been achieved—either for students or for colleges and universities. For students, success is best measured by the attainment of a college degree. About 41% of students in the 2010 academic year cohort graduated within four years; 56% graduate within five years, and 59% within six years.[13] But that means that over 40% of students fail to obtain a degree within six years—hardly a resounding success.
For many educational institutions—particularly, “for-profit” schools—the student loan program has been a boon. Schools face minimal repercussions when students fail to graduate. While borrowers who fail to graduate may have less debt than those who do graduate, they also have less income and, thus, less ability to pay back their loans.
When reviewing graduation rates among borrowers, the low rate of student loan repayment, and the reported losses within loan repayment programs, one might surmise that taxpayers’ “investment” in the student loan program is bearing little fruit for the realized risk. But, as with many complex problems, there is another perspective: in the case of the student loan portfolio, we must also consider the institutional benefits realized.
Using Student Loans to Mitigate Unemployment Costs
Federal student loans have many impacts on the overall economy. One that is often overlooked is the depression of the unemployment rate. Students, along with some other groups (for example, retirees), are not employed, but because they are not looking for work, they are not included in labor-force calculations and therefore have a significant impact on reported U.S. employment rates.
During the 1960s, the civilian labor force was beginning to experience the impact of the postwar baby boom. Unprecedented numbers of individuals entered the labor market. Throughout the 1950s, the unemployment rate averaged 4.5%. From 1960 to 1964, the average rate climbed to 5.7%, but retreated to the 4% range from 1965 to 1970.
HEA significantly increased the number of students attending U.S. colleges. Between 1959 and 1969, the population of college students more than doubled, from 3.6 million to 8 million. While recent years haven’t matched the dramatic growth of the 1960s, steady growth has pushed the number of current college students to about 20 million. To put this number in context, about 160 million people are in the U.S. civilian labor force and roughly 146 million on nonfarm payrolls.
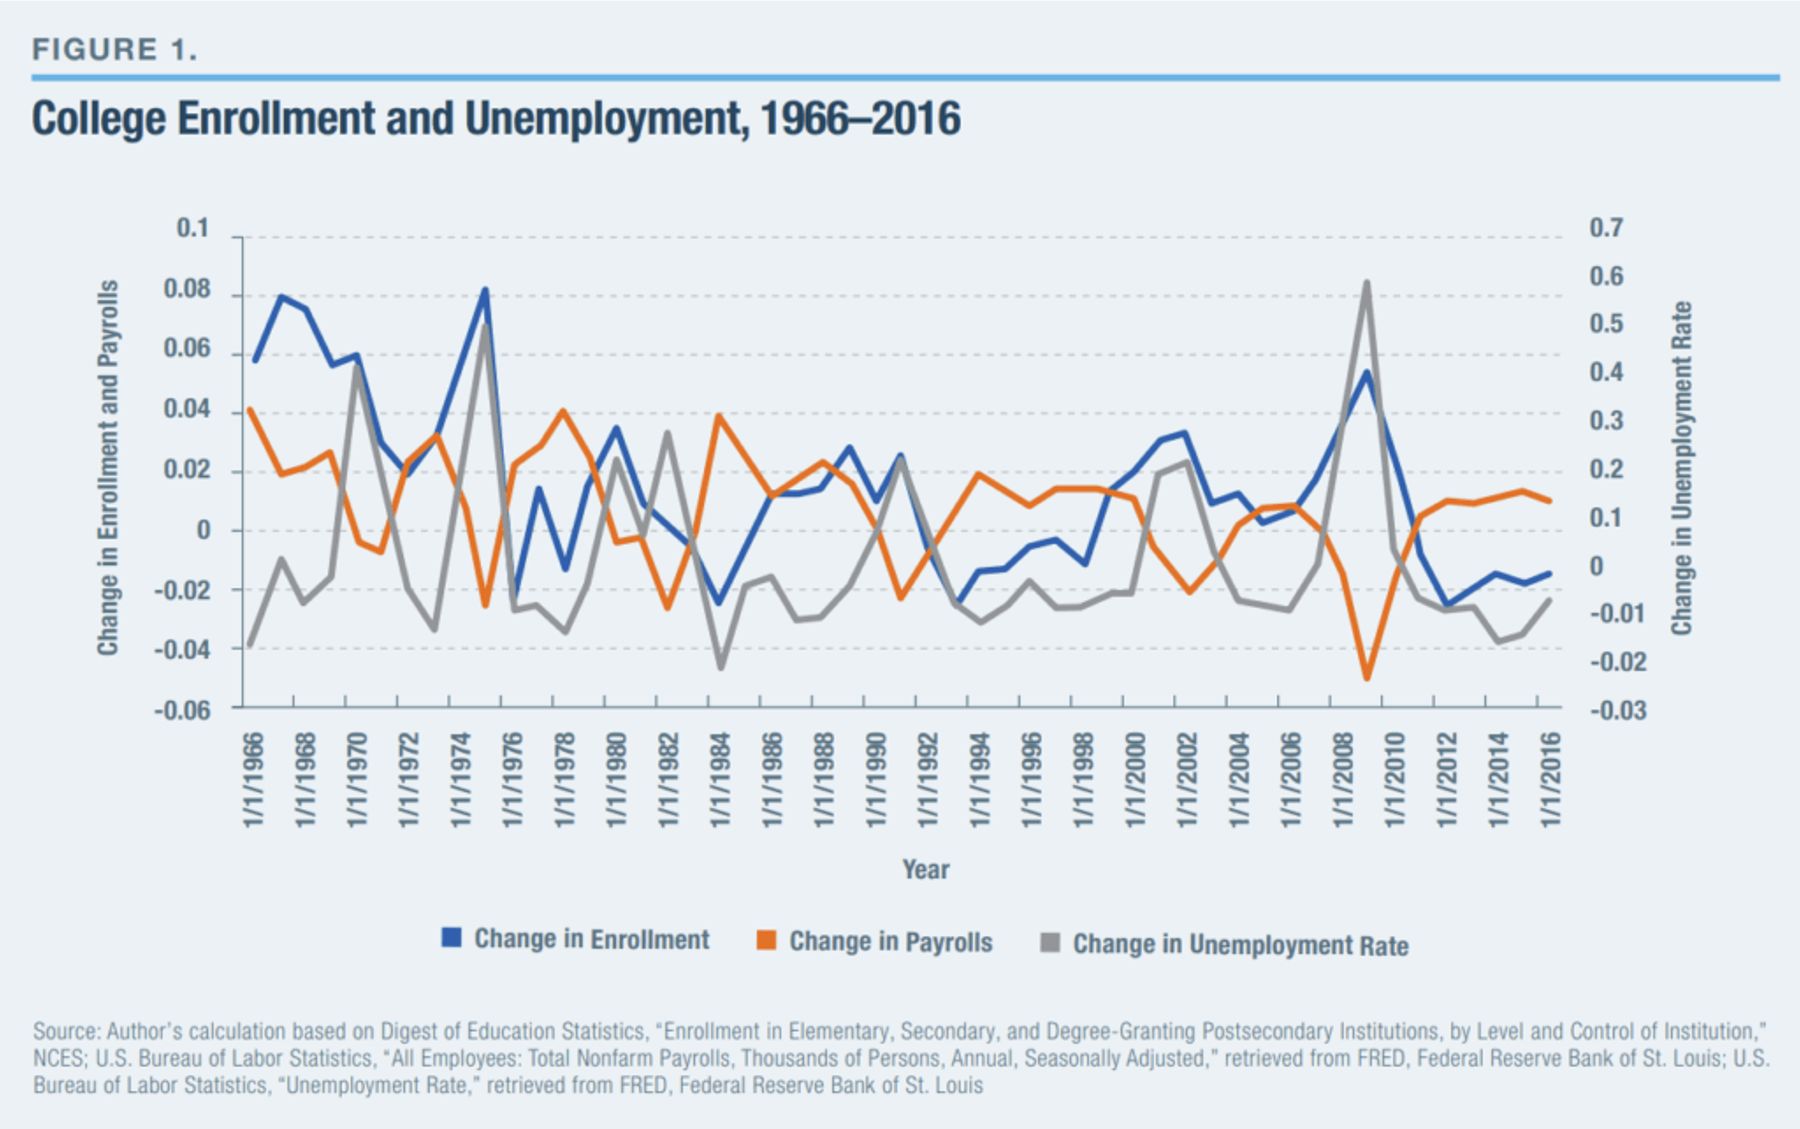
Figure 1 shows the relationship between changes in postsecondary enrollment and unemployment rates over a 50-year period, from 1966 to 2016.[14] Changes in the unemployment rate correlated strongly with changes in the rate of college enrollment. And even though payrolls and enrollment were correlated, payrolls did not appear to drive enrollment.
Higher unemployment has direct and indirect costs to society. Direct costs may include higher borrowing rates, increased unemployment insurance and benefits, and higher rates of crime. Indirect costs may include lower consumer spending, higher savings rates, and lower rates of investment due to a real or perceived higher-risk environment. For example, more than 50,000 U.S. municipalities—in addition to the federal government—borrow in the form of bonds sold to the public. This staggering amount of borrowing could be adversely affected by the smallest increase in borrowing rates brought on by a change in factors like the unemployment rate. Encouraging people to attend college through easy access to credit, even with low rates of full loan repayment, may be thought of as helping to achieve a broader economic goal. But moving people off the unemployment rolls by putting them in school does not really mitigate the costs of unemployment; it simply masks the problem.
It is difficult to quantify what the broader impact of student borrowers not having access to federal student loans would be. In fact, the influence of the federal student loan program on factors outside academic achievement is rarely considered. This is not to suggest that student loans serve only macroeconomic goals. Instead, it offers a possible reason for the growth trajectory of student loans and the population using them to advance their education. Through access to student loans, millions of borrowers have obtained an education that otherwise might not have been possible. And by doing so, they have contributed to the U.S. Gross Domestic Product (GDP). The growing trend, however, toward borrowers in more advanced age segments limits the productivity that might be realized, but it also reduces the number of individuals seeking employment.
Conclusion
In determining the market value of the student loan portfolio, we must consider defaults as only one part of the equation. With the level of full loan repayment falling below 40%, often for reasons other than default, any valuation that only considers defaults will overestimate the portfolio’s expected returns.
Based on recently released data, student loan repayment trends are not expected to improve. In fact, the shrinking percentage of loans that have decreasing balances is one of the starker illustrations of the portfolio’s current (and future) loan performance. This is compounded by observations from the 1995–96 student cohort, in which the average size of loan balances increased between years 12 and 20 because of negative amortization. The more recent 2003–04 cohort of student loans is trending even lower, suggesting that higher levels of loan defaults and lower levels of full loan repayment are to be expected. These troubling trends are magnified by newer student loan refinancing companies that are targeting the portfolio’s lowest-risk borrowers. The result is a higher-risk, lower-performing federal student loan portfolio.
Even amid these disappointing loan performance realities, the program might be succeeding in achieving other goals, especially when we consider the broader impact of student lending on employment rates and national GDP. When viewed in this more comprehensive way, perhaps taxpayers will see the cost of student loans as an investment in the health of our nation’s economy, albeit with dividends that are difficult to fully quantify. This macroeconomic consideration, on the other hand, forces the question “Are student borrowers shouldering much more than the cost of their education?”
Endnotes
About the Author
Dr. Jimmie Lenz is the academic director of the Financial Technology Graduate Program at Duke University’s Pratt School of Engineering and a clinical assistant professor of finance at the University of South Carolina Moore School of Business. He is an experienced executive, lecturer, and scholar in the field of banking and capital markets. Starting his career as an equity and derivatives trader over 25 years ago, Lenz found he reveled in fast moving atmospheres that required both strategic thought and the ability to take immediate action. His successes propelled him into a number of senior management roles within the finance community including leading an NYSE broker dealer with foreign and domestic operations, and serving as chief risk officer and chief credit officer at a top three broker dealer, and the head of predictive analytics for one of the largest wealth management firms in the US. Lenz holds an undergraduate degree from the University of South Carolina, an M.S. in finance from Washington University in Saint Louis, and D.B.A in Finance from Washington University’s Olin Business School. He currently serves as the Chairman of Neocova’s strategic advisory board, and on the board of directors of Zen Blockchain Foundation.
This report was written as a part of MI's Solutions from Beyond the Beltway series
Photo: Rattankun Thongbun / iStock / Getty Images Plus
Are you interested in supporting the Manhattan Institute’s public-interest research and journalism? As a 501(c)(3) nonprofit, donations in support of MI and its scholars’ work are fully tax-deductible as provided by law (EIN #13-2912529).