Paying More for Less Care: Maryland’s Hospital Payment Regulations

Photo: SDI Productions/E+ via Getty Images
Executive Summary
Advocates of single-payer health care claim that regulated fees and revenues can greatly reduce costs by forcing hospitals to cut wasteful expenses and improve population health.
This idea is currently being tested in five states—most substantially in Maryland, where hospital fees have been set by state regulators for over 50 years. Maryland’s regulatory system was extended in 2014 to fix total revenues at each hospital, and in 2019 to penalize hospitals for excessive expenditures incurred at other providers by Medicare beneficiaries assigned to their care.
These payment reforms have been touted as a success in official evaluations, which find that they led to “savings” in the form of reduced health-care spending. But in fact, the reduced spending is driven by Maryland hospitals admitting fewer patients—and charging more for those they do admit.
In Maryland, as these reforms were implemented:
- Hospital admissions declined from 7% above the national rate to 18% below it.
- The largest cuts were to costly services for the most seriously ill patients. Kidney transplant rates declined from 161% to 60% of the national average.
- Emergency department (ED) wait times increased from 137% to 153% of the national average—substantially more than in any other state.
- The costs of common inpatient procedures rose by 7%–34% more than they did nationwide.
Maryland’s hospital industry has traditionally supported the state regulation of hospital payments because of a deal that allows the state’s hospitals to claim 37% more from the federal government for Medicare and Medicaid patients than they would in other states, in return for reducing fees by private insurers. But this external windfall is being phased out, so the state is unlikely to remain enthusiastic about a burdensome regulatory apparatus that pays facilities more, but for less care.
The Debate over Hospital Payment Regulation
Hospital payment regulation was once widespread in the U.S., but it now exists in a comprehensive form only in the state of Maryland. There, fees have been fixed by state regulators since 1974. Since 2014, the total revenue obtained from patients has also been regulated.
In a 2019 Manhattan Institute report, I investigated the consequences of Maryland’s regulation of hospital fees. The present report assesses the effect of the more recently established limits on total hospital revenues.[1]
Maryland’s system of all-payer hospital payment regulation is the most significant American effort to replicate the approach that many liberal policy analysts credit for lower health-care costs in other developed countries.[2]
Advocates argue that caps on fees may prevent hospital systems from exploiting their market power to overcharge patients and insurers. They suggest that limits on hospital revenues may also help restrain inflated volumes of low-value procedures, steer patients to lower-cost providers, and prevent duplicative services, while giving facilities an incentive to keep the local population healthy. They also claim that hospital-payment regulation helps equalize fees between different payers, support the financial stability of facilities, and improve public accountability.[3]
Incrementalist reformers see hospital-spending regulation as a way to reduce needless expenditures without disrupting existing health-insurance coverage arrangements.[4] More radical advocates—who support replacing private health insurance with a single-payer system—believe that such regulation contributes substantial savings and efficiency gains necessary to pay for their desired reforms.[5]
Fundamentally, the regulation of hospital revenues is an attempt to reduce health-care costs by trusting hospitals to ration expenditures for their allocated patient populations.
But capping hospital revenues eliminates the market incentive for hospitals to attract additional patients with the best services.[6] Making permitted revenues less responsive to the volume of essential care encourages facilities to cut costs by withholding treatment or diverting seriously ill patients to other facilities. Making hospitals responsible for expenditures incurred elsewhere mostly rewards or punishes them for spending over which they have little control.
Asking hospitals to manage total costs for a defined population becomes far more difficult when they must compete with rival facilities for patients. Serious efforts to do so therefore tend to produce policies that strengthen hospitals’ monopoly power in local markets. That, in turn, makes it easier for hospitals to meet their budgets by withholding the highest-quality care from patients while allowing per-patient treatment costs to rise unchecked.
The government must set limits on payments for Medicare or Medicaid patients, but there is no need to limit how much private insurers spend to provide enrollees with access to better care. If private payers cannot purchase hospital care efficiently, policymakers should seek ways to enhance competition between providers rather than attempt to eliminate it.
The Development of Maryland’s All-Payer Model
The history and objectives of Maryland’s all-payer rate-setting system are discussed at length in my 2019 report.[7] Since then, Maryland’s payment model has changed substantially. Figure 1 provides an overview of the system’s development.
FIGURE 1
Evolution of Maryland Health-Care Payment Regulation
| Rate-Setting (regulated inpatient and outpatient fees) | Global Budgets (regulated total hospital revenues) | Total Cost of Care (regulated total spending on all services) | |
| Private payers | Since 1974 (state) | Since 2014 (state) | None |
| Medicaid | Since 1977 (state) | Since 2014 (state) | None |
| Medicare | 1977–2027 (state); from 2028 (federal) | 2014–31 (state); from 2028 (federal) | Since 2019 (state, under overall federal target) |
In 1974, Maryland gave an independent regulatory agency, the Health Services Cost Review Commission (HSCRC), the authority to set rates for inpatient hospital care. Beginning in 1977, the U.S. Department of Health, Education, and Welfare allowed Maryland’s HSCRC to also set fees for hospital services purchased by Medicare and Medicaid. In 1980, Congress amended the Social Security Act to give Maryland a statutory right to set the same hospital fees for Medicare, Medicaid, and privately financed patients, on the condition that the state’s Medicare spending per inpatient admission increased by less than the national average.[8] Due to this provision, Maryland was exempt from the national Medicare inpatient fee schedule, established in 1982, which typically also limits permitted Medicaid rates.
Over time, Maryland’s unique right to increase fees that the federal government must pay for Medicare and Medicaid patients became increasingly lucrative.[9] Nationwide, fees for hospital care paid by private insurers rose from 117% to 162% of Medicare rates from 1980 to 2014. As a result, Maryland’s unique right to raise Medicare and Medicaid fees in line with those paid by private payers became increasingly valuable.[10] By 2014, Maryland’s exemption from the standard Medicare fee schedule enabled it to obtain an additional $2.3 billion in federal funding for Medicare and Medicaid patients—14% of the state’s total hospital revenue.[11]
The Affordable Care Act of 2010 increased the value of Maryland’s exemption from Medicare’s standard rates by cutting nationwide fees for hospital services. Combined with incentives to shift simpler cases to outpatient settings, Maryland’s per-inpatient Medicare spending threatened to increase above the cumulative growth of national inpatient expenditures, violating a condition of its 1980 waiver.[12] To maintain its right to claim elevated reimbursements, the state negotiated a new waiver with the Center for Medicare and Medicaid Innovation (CMMI) that required the state to limit total spending on hospital services.
From 2014, Maryland’s waiver from standard Medicare fees required the state to:[13]
- Cap revenues from in-state patients at each hospital with “Global Budgets” (GBs).
- Limit statewide all-payer hospital revenue growth to 3.58% per year, based on 2013 levels.
- Reduce statewide Medicare hospital spending by $330 million over five years, relative to national trends.
- Reduce the frequency of hospital-acquired conditions by 30% over five years.
- Reduce the hospital readmission rate of Medicare patients to the national average.
Under this arrangement, hospitals are still paid fee-for-service, but rates are adjusted up (by up to 10%) or down (without limit) as necessary to meet GB aggregate spending targets. These GBs encompass the bulk of all-payer hospital revenue, with high-cost outpatient drugs, new inpatient technology, organ acquisition, and other costly services carved out.
HSCRC adjusts GB targets for:
- Inflation, productivity, and demographic changes.
- Shifts in utilization by privately insured, publicly funded, and uninsured patients between Maryland hospitals (in about 20,000 markets defined by 60 service lines within 350 geographic areas).[14]
- Performance on quality metrics (adherence to processes of care, mortality, readmissions, and hospital acquired conditions).
- Approved hospital-specific capital investments (construction and equipment).
Since 2019, Maryland’s Medicare waiver has been contingent on limiting growth in the total cost of care (TCOC) for Medicare patients, to prevent the state from circumventing the other targets by merely shifting expenditures to unregulated nonhospital settings.[15] This tied the state’s Medicaid waiver to three targets:[16]
- Limit statewide all-payer hospital revenue growth to 3.58% per year, based on 2013 levels.
- Reduce total Medicare Part A and B spending by $2 billion over 2019–26, relative to the growth rate of equivalent national spending since 2013.
- Prevent total Medicare Part A and B spending from growing faster than equivalent national spending for two consecutive years, or by 1% point in any single year.
Maryland attempts to restrain TCOC by making each hospital responsible for health-care spending incurred by part of the state’s Medicare beneficiaries. HSCRC attributes Medicare beneficiaries to hospitals according to geographic location or primary-care practitioner referral patterns. If total Medicare spending by those beneficiaries (including at other providers) exceeds a benchmark level of expected total expenditure, rates paid to hospitals are reduced as necessary to meet statewide Medicare spending targets.[17]
In 2027, Maryland’s all-payer model will be incorporated into CMMI’s new Achieving Healthcare Efficiency Through Accountable Design (AHEAD) model.[18] This model is designed to support the expansion of GBs to other states—namely, Connecticut, Hawaii, Rhode Island, and New York.[19] The AHEAD model requires states to include hospital inpatient revenue from at least one private insurer, Medicaid, and 30% of Medicare fee-for-service revenue in GBs.[20]
In November 2024, the Biden administration’s CMMI reauthorized Maryland’s waiver from the standard Medicare fee schedule as part of the AHEAD model. The incoming Trump administration, however, believed that the waiver’s Medicare spending baseline was needlessly inflated and that it was unable to track how federal funds distributed through the Maryland model were being used. The new administration was frustrated by an incomprehensible web of hospital cross-subsidies orchestrated by HSCRC, and it had little capacity to verify the legitimacy of savings claimed. Data reported by the state were often incomplete, did not conform to standard Medicare accounting practices, and were poorly integrated with national payment evaluations.
In November 2025, CMMI renegotiated Maryland’s waiver agreement. This increased the required reduction of Medicare spending from 1.1% to 2.66% but also imposed more fundamental reforms.[21] The new agreement will end HSCRC’s right to set Maryland’s Medicare hospital rates in 2028, phase down its role in allocating GBs between hospitals, and phase out overpayments for Medicare patients from 2028 to 2035. Maryland’s HSCRC will retain the authority to set hospital rates for Medicaid and privately insured patients, but payments for Medicare patients will be based on Medicare’s standard national fee schedule and directly controlled by CMMI.[22]
Assessing the Maryland Model
To assess the performance of Maryland’s hospital payment arrangements, this report compares the state with nationwide trends and a panel of similar mid-Atlantic states (Figure 2). On most demographic measures, Maryland is fairly similar to the country as a whole; but economically, it is more similar to relatively affluent neighboring states.
FIGURE 2
Features of Comparator States
| USA | MD | DE | NJ | PA | VA | |
| Median household income ($, 2024) | 81,604 | 102,904 | 87,534 | 104,294 | 77,545 | 92,090 |
| Family physician mean wage ($, 2023) | 240,790 | 263,340 | 255,550 | 213,320 | 266,410 | 251,230 |
| Life expectancy (years, 2022) | 78 | 78 | 77 | 80 | 77 | 78 |
| Population (millions, 2024) | 331.2 | 6.1 | 1.0 | 9.3 | 6.1 | 8.5 |
| Share of population: | ||||||
| Aged 65+ (2024) | 18% | 18% | 22% | 18% | 21% | 18% |
| Poor (2024) | 12% | 9% | 10% | 9% | 12% | 10% |
| Urban (2020) | 80% | 86% | 83% | 94% | 77% | 76% |
| Obese (2024) | 33% | 33% | 37% | 28% | 34% | 32% |
All-Payer Spending
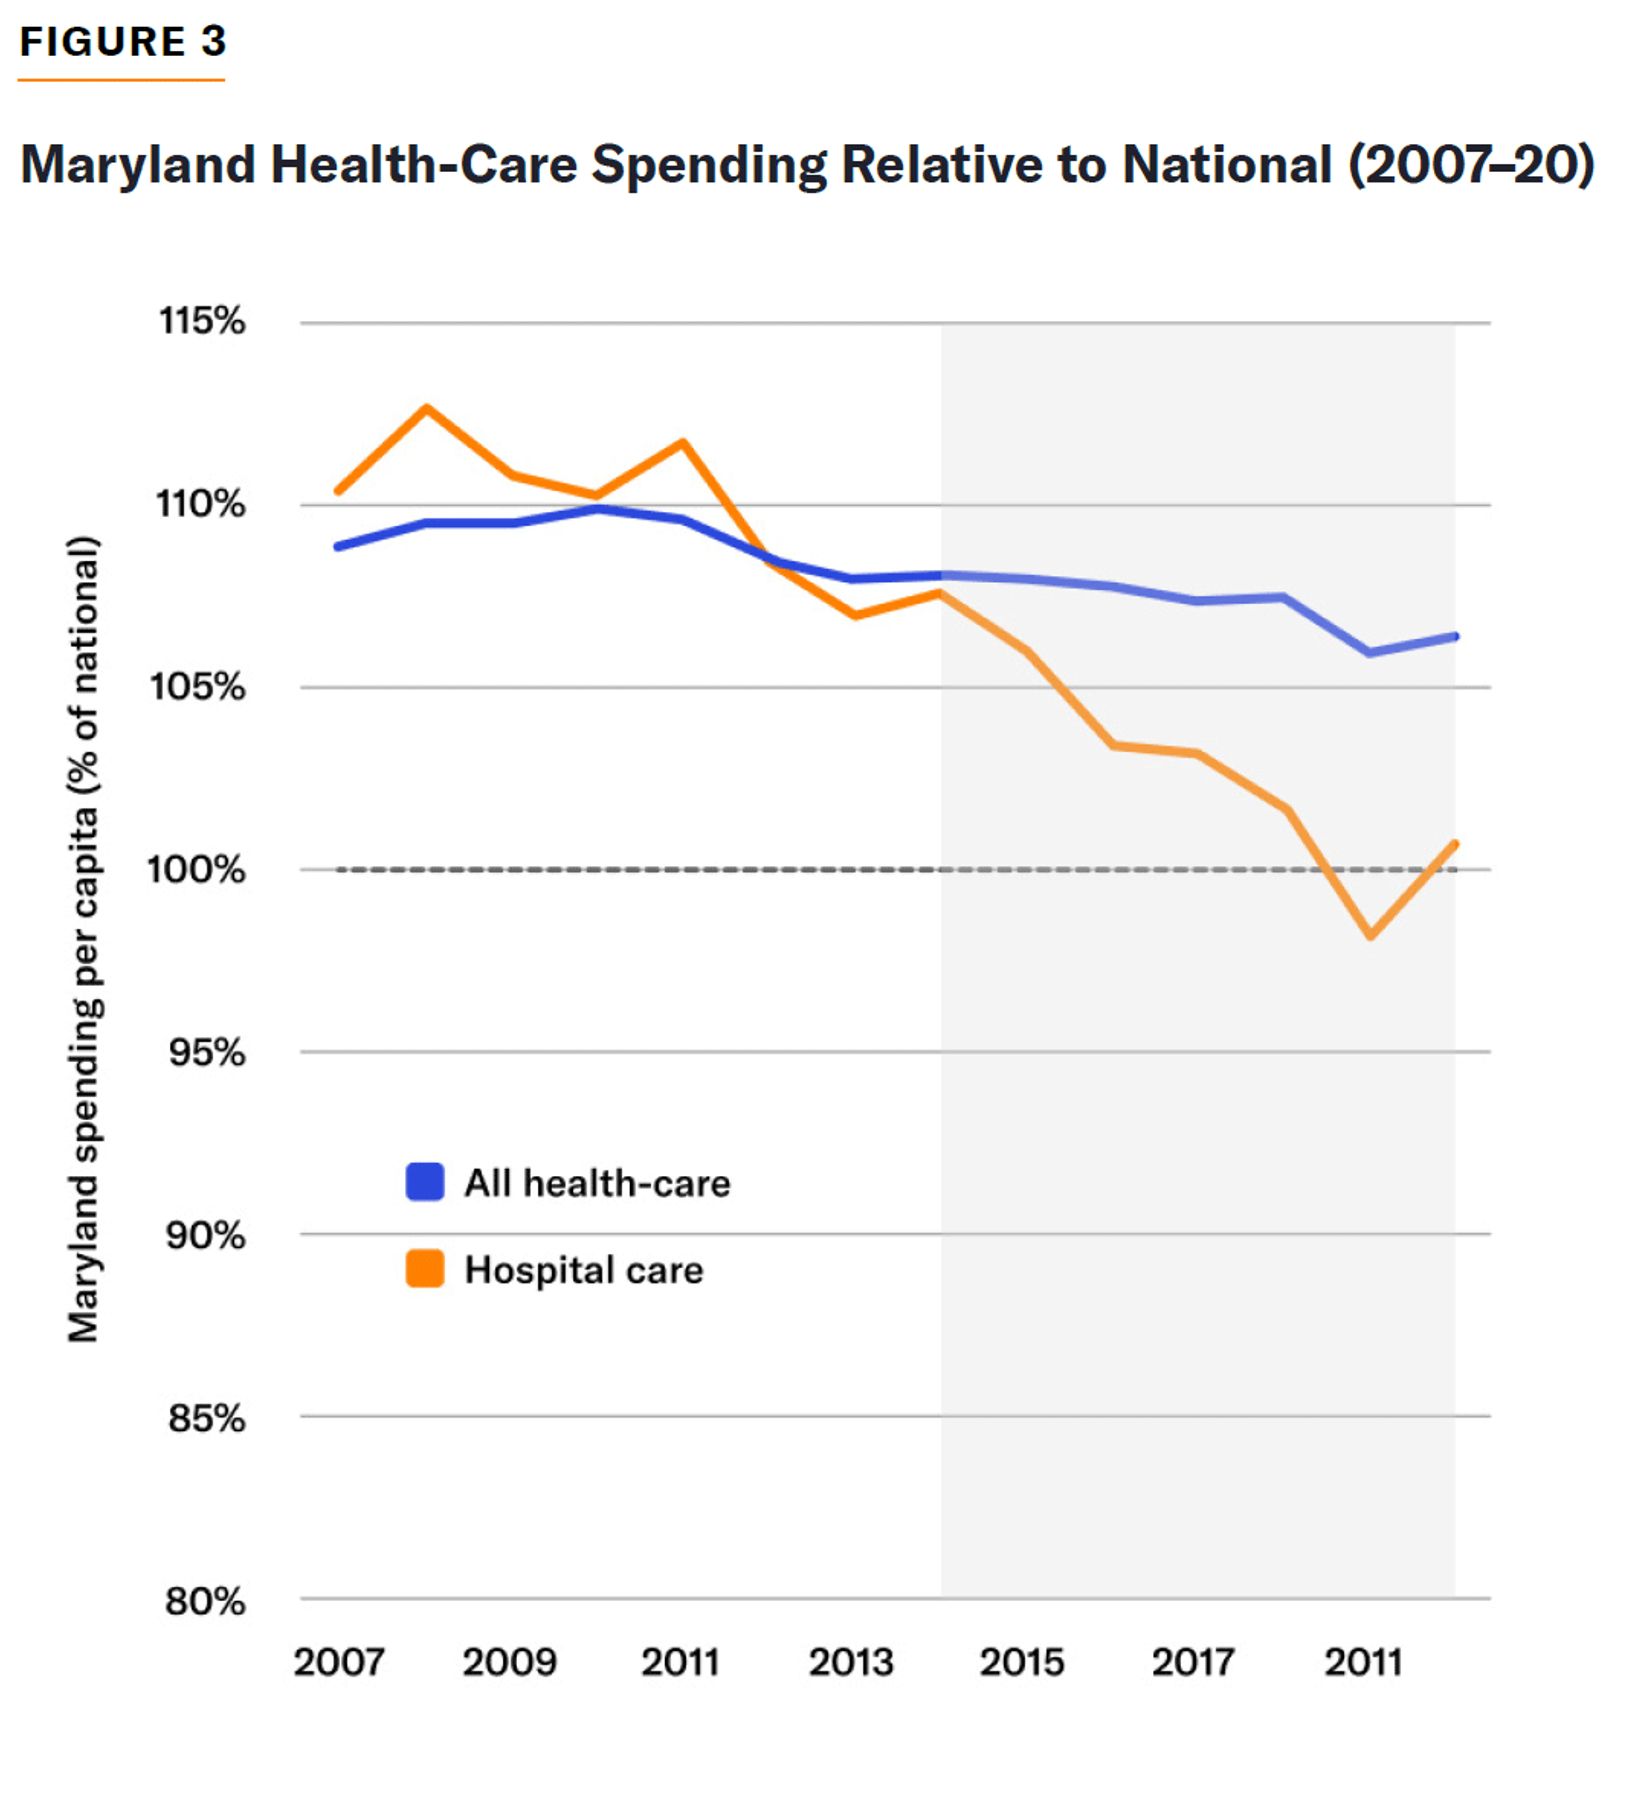
Across all payers (private insurance and self-pay in addition to Medicare and Medicaid), Maryland spends more on health care than the national average.
Compared with the national average, the level of health-care spending by Maryland residents declined only slightly since GB implementation in 2014, from 108% of the national average in 2013 to 106% in 2019.
However, hospital spending by Maryland residents fell substantially, relative to the rest of the country, since 2014. In 2008, Maryland’s per-capita hospital was 13% higher than the national level; in 2019, it was 2% lower (Figure 3).
Utilization
By decoupling hospital revenues from the volume of services provided, GBs have undoubtedly reduced the volume of inpatient services delivered by Maryland hospitals.
From 2008 to 2023, the number of inpatient admissions in Maryland declined from 107% to 82% of the national per-capita rate.[23] From 2013 to 2023, after adjusting for aging and other demographic changes, total hospital utilization fell by 17% in Maryland, while the rest of the country experienced a 6% decline.[24]
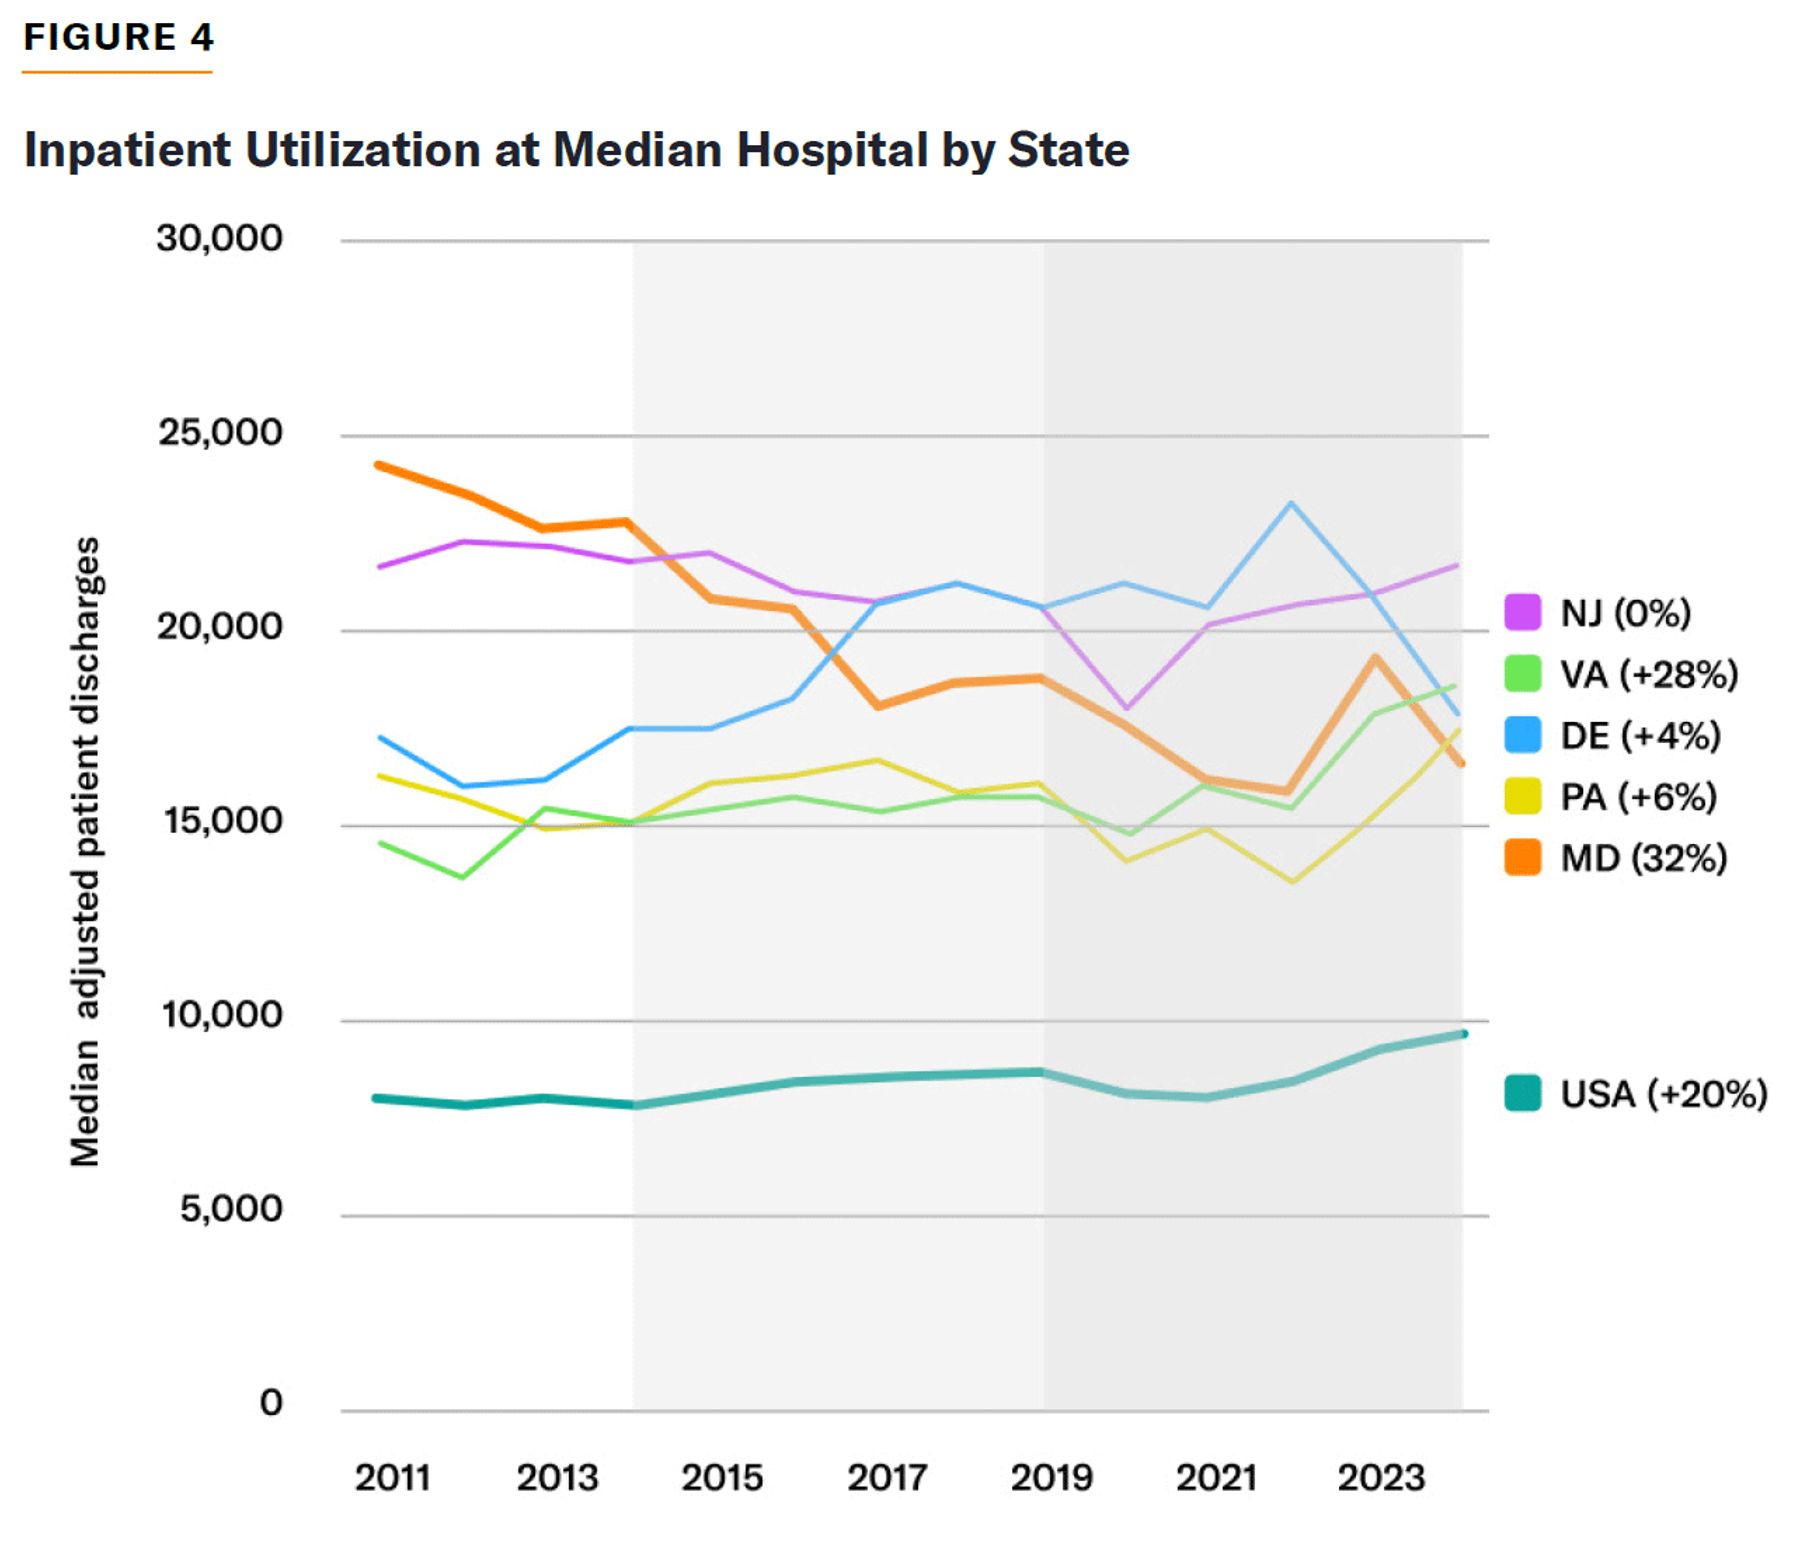
From 2011 to 2024, the number of patients admitted to the median hospital in Maryland has declined by 32%, compared with a 20% increase nationwide. There was no decline in any other mid-Atlantic state. (The number of hospitals in Maryland declined by 4% over that period, compared with a 3% decline nationwide.)[25]
Prior to GB implementation, the median hospital in Maryland admitted three times as many patients per year as the median hospital nationwide, and more than any other mid-Atlantic state. By 2024, the median hospital in Maryland admitted fewer patients than that in any other mid-Atlantic state (Figure 4).
The decline in hospital utilization was not concentrated in low-value care. Maryland counties saw no significant changes in measures of systemic overuse, relative to out-of-state controls, following the introduction of GBs.[26] The decline in emergency admissions was similar across medical conditions, regardless of sensitivity to timely ambulatory care.[27] In fact, according to two standard measures of wasteful hospital services, Maryland still performs worse than the national average and poorly compared with other mid-Atlantic states (Figure 5).
FIGURE 5
Wasteful Utilization, Median Hospital (2024)
| USA | MD | DE | NJ | PA | VA | |
| MRI for lower back pain before physical therapy | 35.5% | 39.7% | 25.6% | 28.3% | 31.9% | 33.7% |
| Abdomen CT scan performed as combination | 5.9% | 1.5% | 3.7% | 3.4% | 6.5% | 5.3% |
| Cardiac imaging stress test before low-risk surgery | 3.7% | 3.9% | 3.3% | 4.6% | 3.9% | 3.2% |
Source: CMS, “Care Compare”; CMS, Provider Data Catalog, “Timely and Effective Care”
Improvements in technology—especially the ability to perform more surgeries on an outpatient basis—have led to nationwide shifts in hospitalization over time. But across a wide variety medical conditions, the volume of inpatient hospital care in Maryland has declined relative to the country as a whole.
The decline has not been uniform across medical services (Figure 6). In some cases, such as maternity procedures, hospitals have little control over the number of patients they must treat. Hospitals cannot ration access to care for women who are about to give birth or divert them to outpatient settings or out of state. As expected, therefore, the hospitalization rate for maternity procedures in Maryland has matched nationwide trends.
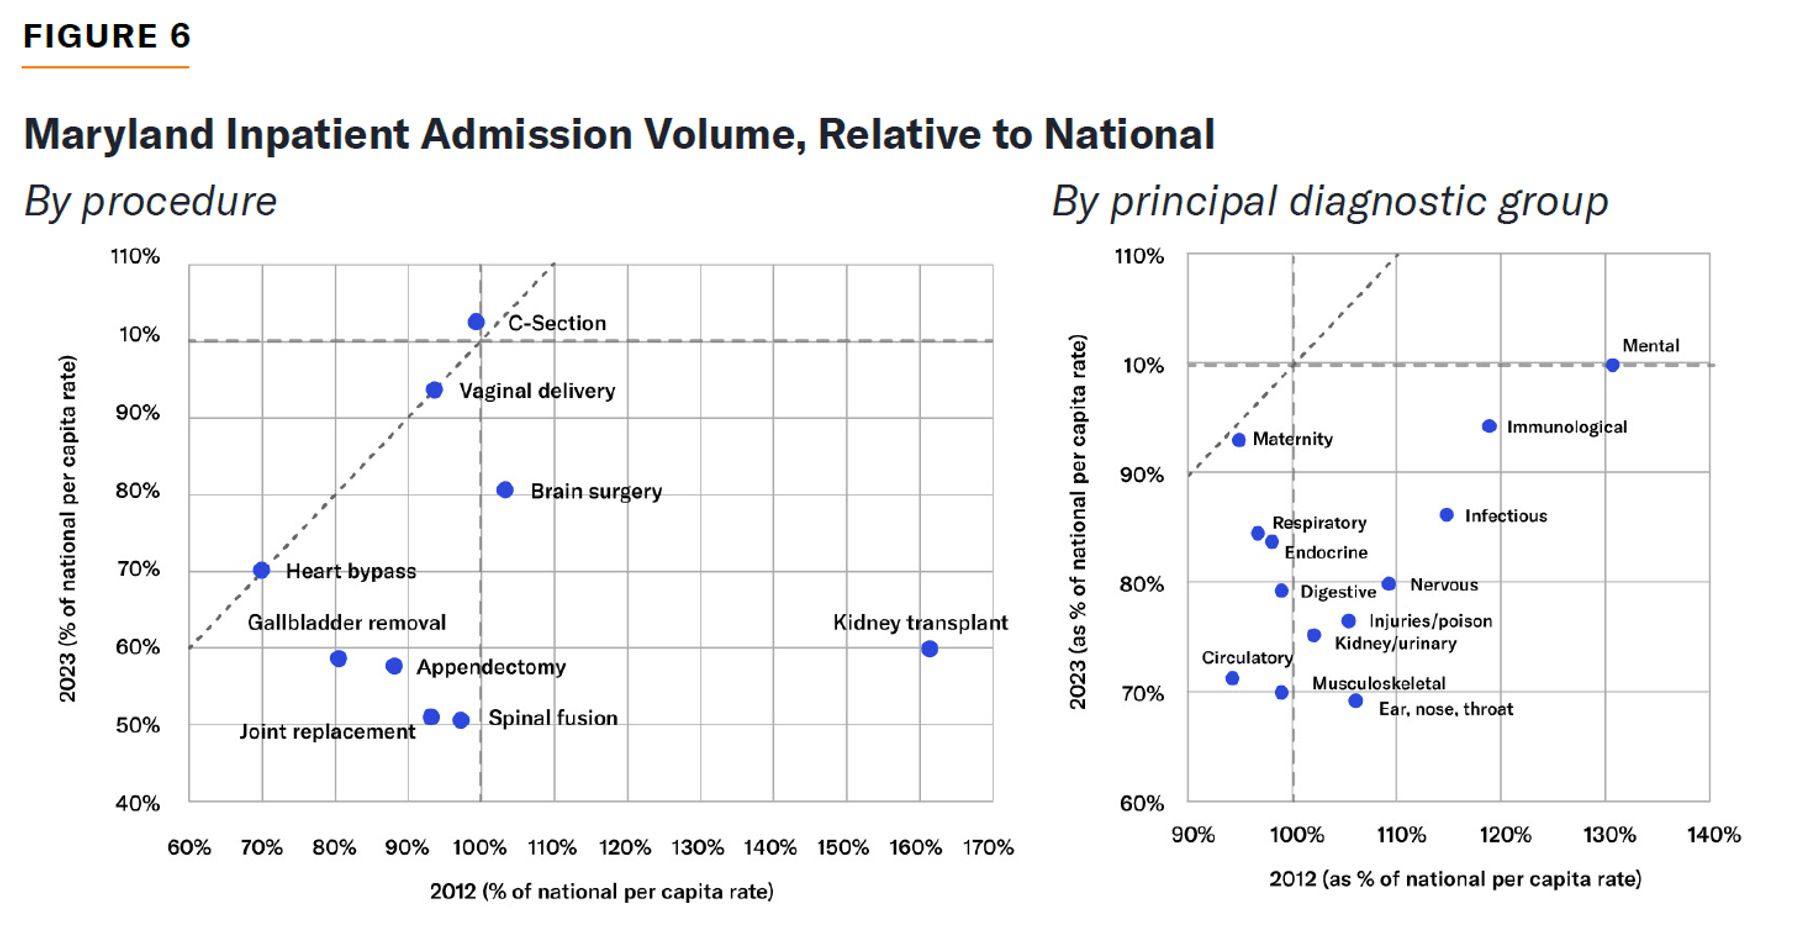
By contrast, there has been a great decline in the relative number of kidney transplants performed by Maryland hospitals. In 2012, the state’s facilities performed 61% more kidney transplants per capita than the country as a whole; in 2023, they undertook 40% fewer.
Global Budgets encourage hospitals to cut access to the most expensive procedures, such as transplants. This is because GBs eliminate the incentive for hospitals to obtain additional revenue by admitting patients who may cause them to incur substantial additional costs. Transplant surgery is particularly easy for hospitals to withhold. This is because transplants are generally subject to wait lists, which reduce utilization directly by preventing patients from accessing treatment and indirectly by diverting them to other providers. Furthermore, transplants are extremely expensive (averaging $103,456 in 2023), and so, under capped GBs, eliminating one kidney transplant surgery may allow facilities to fund 12 admissions for childbirth.[29] As transplants are likely to be diverted out of state or made entirely unavailable to patients, facilities are also unlikely to be penalized for withholding them by GB “market shift adjustment” penalties, where utilization moves to other in-state facilities.
For other procedures, the decline in hospitalizations has been less extreme than for transplant surgery, with trends generally reflecting the ease with which facilities may withhold treatment or divert patients elsewhere.
Shift to Outpatient Settings
For some medical specialties, it has been argued that the establishment of GB caps on hospital revenue may have reduced utilization by diverting procedures to cheaper outpatient settings. From 2013 to 2025, the share of Medicare physician services delivered outside a hospital rose from 57% to 74% in Maryland, while declining from 66% to 62% nationwide.[30]
However, the decline in inpatient procedures most amenable to a shift to outpatient settings has not been offset by an increase in outpatient volumes. From 2013 to 2019, the rate of major outpatient orthopedic procedures in Maryland rose from 69% to 97% of the national average. Yet this figure fell back to 84% in 2021, following the 2019 extension of revenue caps to the TCOC for Medicare patients. In any case, the volume of orthopedic procedures in Maryland remained below the national average (Figure 7). In 2021, including procedures performed in hospital outpatient departments and ambulatory surgery centers, Maryland delivered a relatively low volume of knee replacements to Medicare beneficiaries.[31]
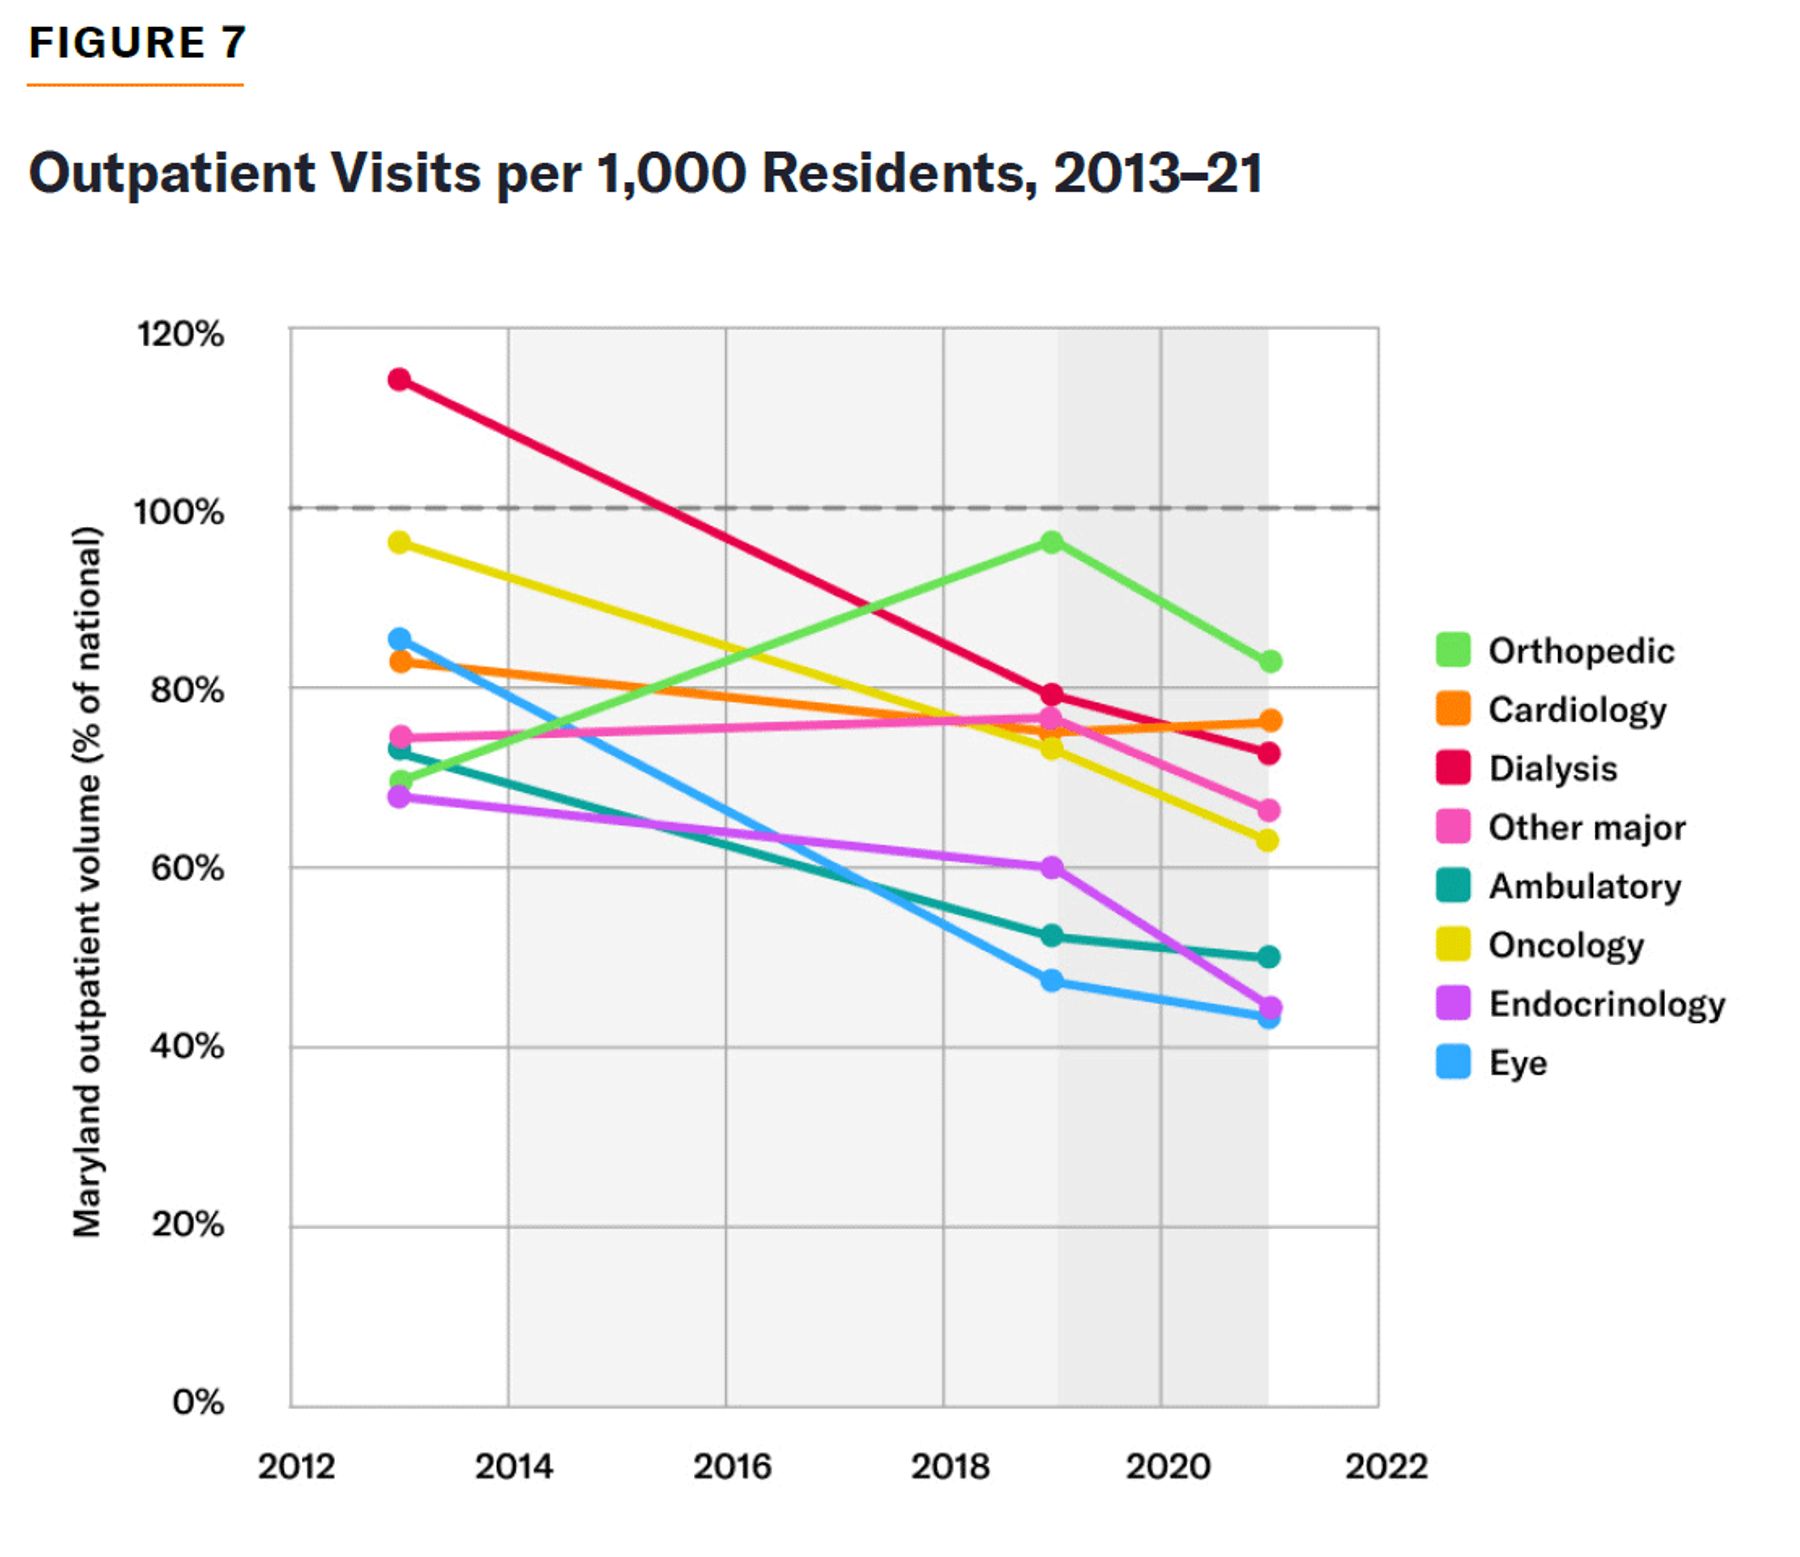
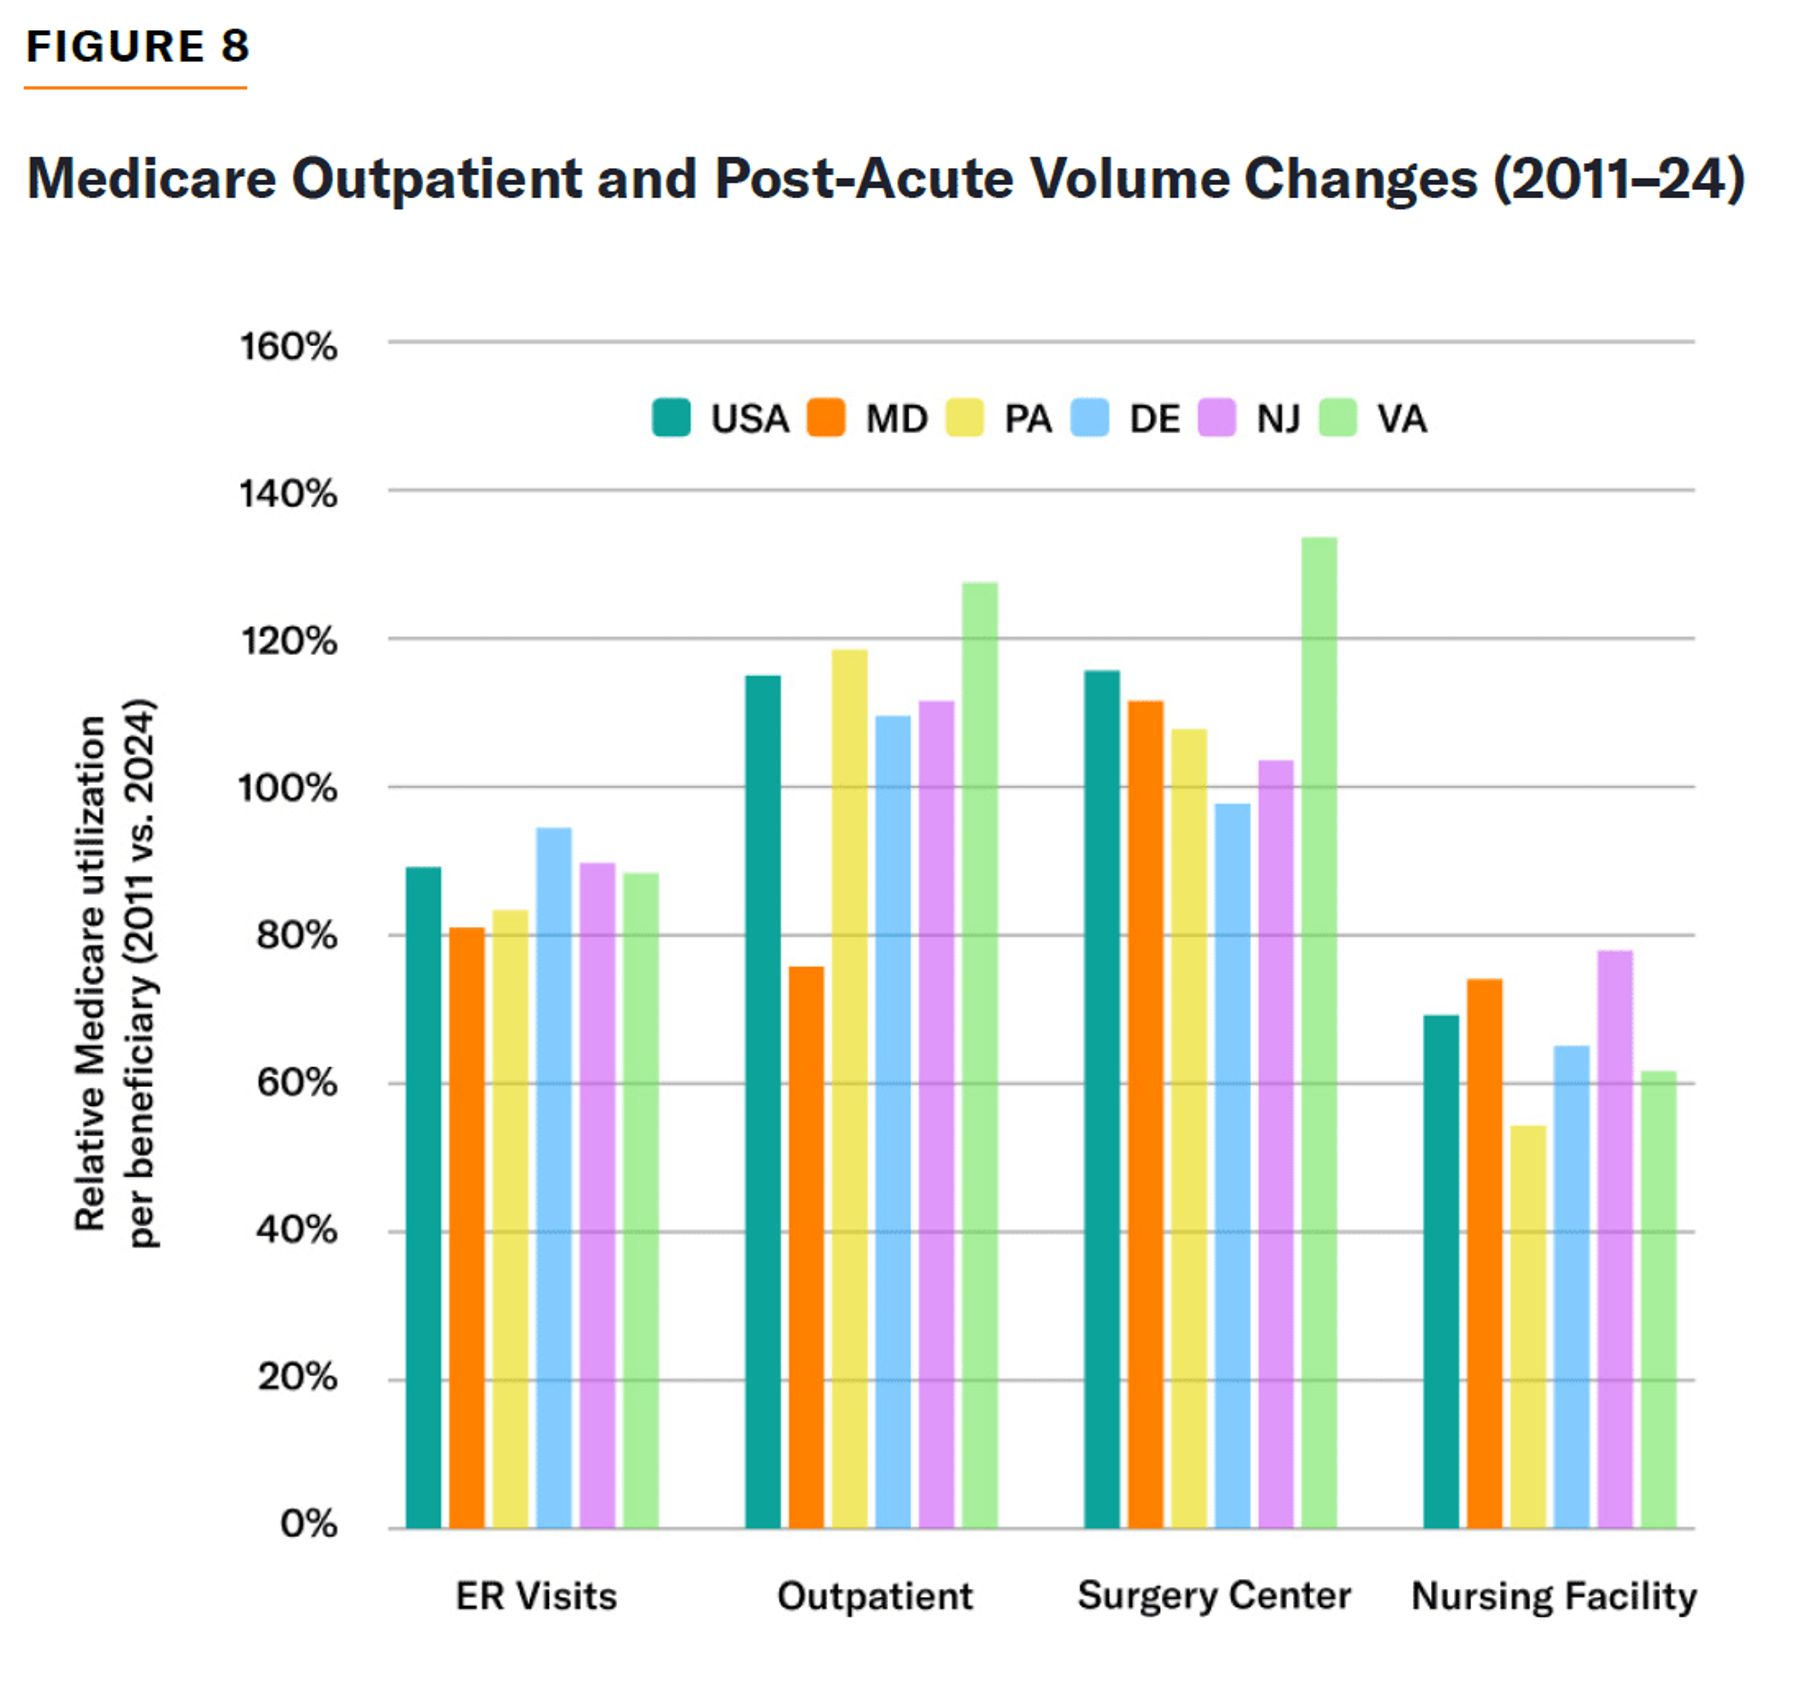
In fact, for most categories of outpatient procedures—where there was no shift in demand from inpatient settings—the volume of outpatient procedures delivered in Maryland declined relative to other states from 2013 to 2021.[32] Outpatient procedures for Medicare beneficiaries in the state declined by 24% while increasing by 15% nationally. But utilization of emergency departments (EDs), surgery centers, and nursing facilities was similar to national trends (Figure 8).
Access to Care
There is little doubt that Maryland’s hospital resources are under strain. The state has fewer hospital beds per capita than 45 other states, 25% below the national average.[33]
In a recent survey, Maryland surgeons explained how hospitals attempt to transfer costly patients to the state’s teaching hospitals. One noted “gridlock” at the teaching hospital, which “runs at a 90-plus percent capacity every day, so there’s no beds ever.” Another explained: “When funds start dwindling … beds get shut down. We essentially turn from a 750-bed hospital to operating as if we are a 500-bed hospital. And that happens abruptly.”
The burden is most obvious in emergency care, for which Medicare-participating hospitals are required to record patient waiting times. Wait times may gauge overall hospital capacity, as severely ill patients are often kept in the ED when no beds are available elsewhere. Maryland’s wait times are higher than any other state and substantially higher than the national average (Figure 9).
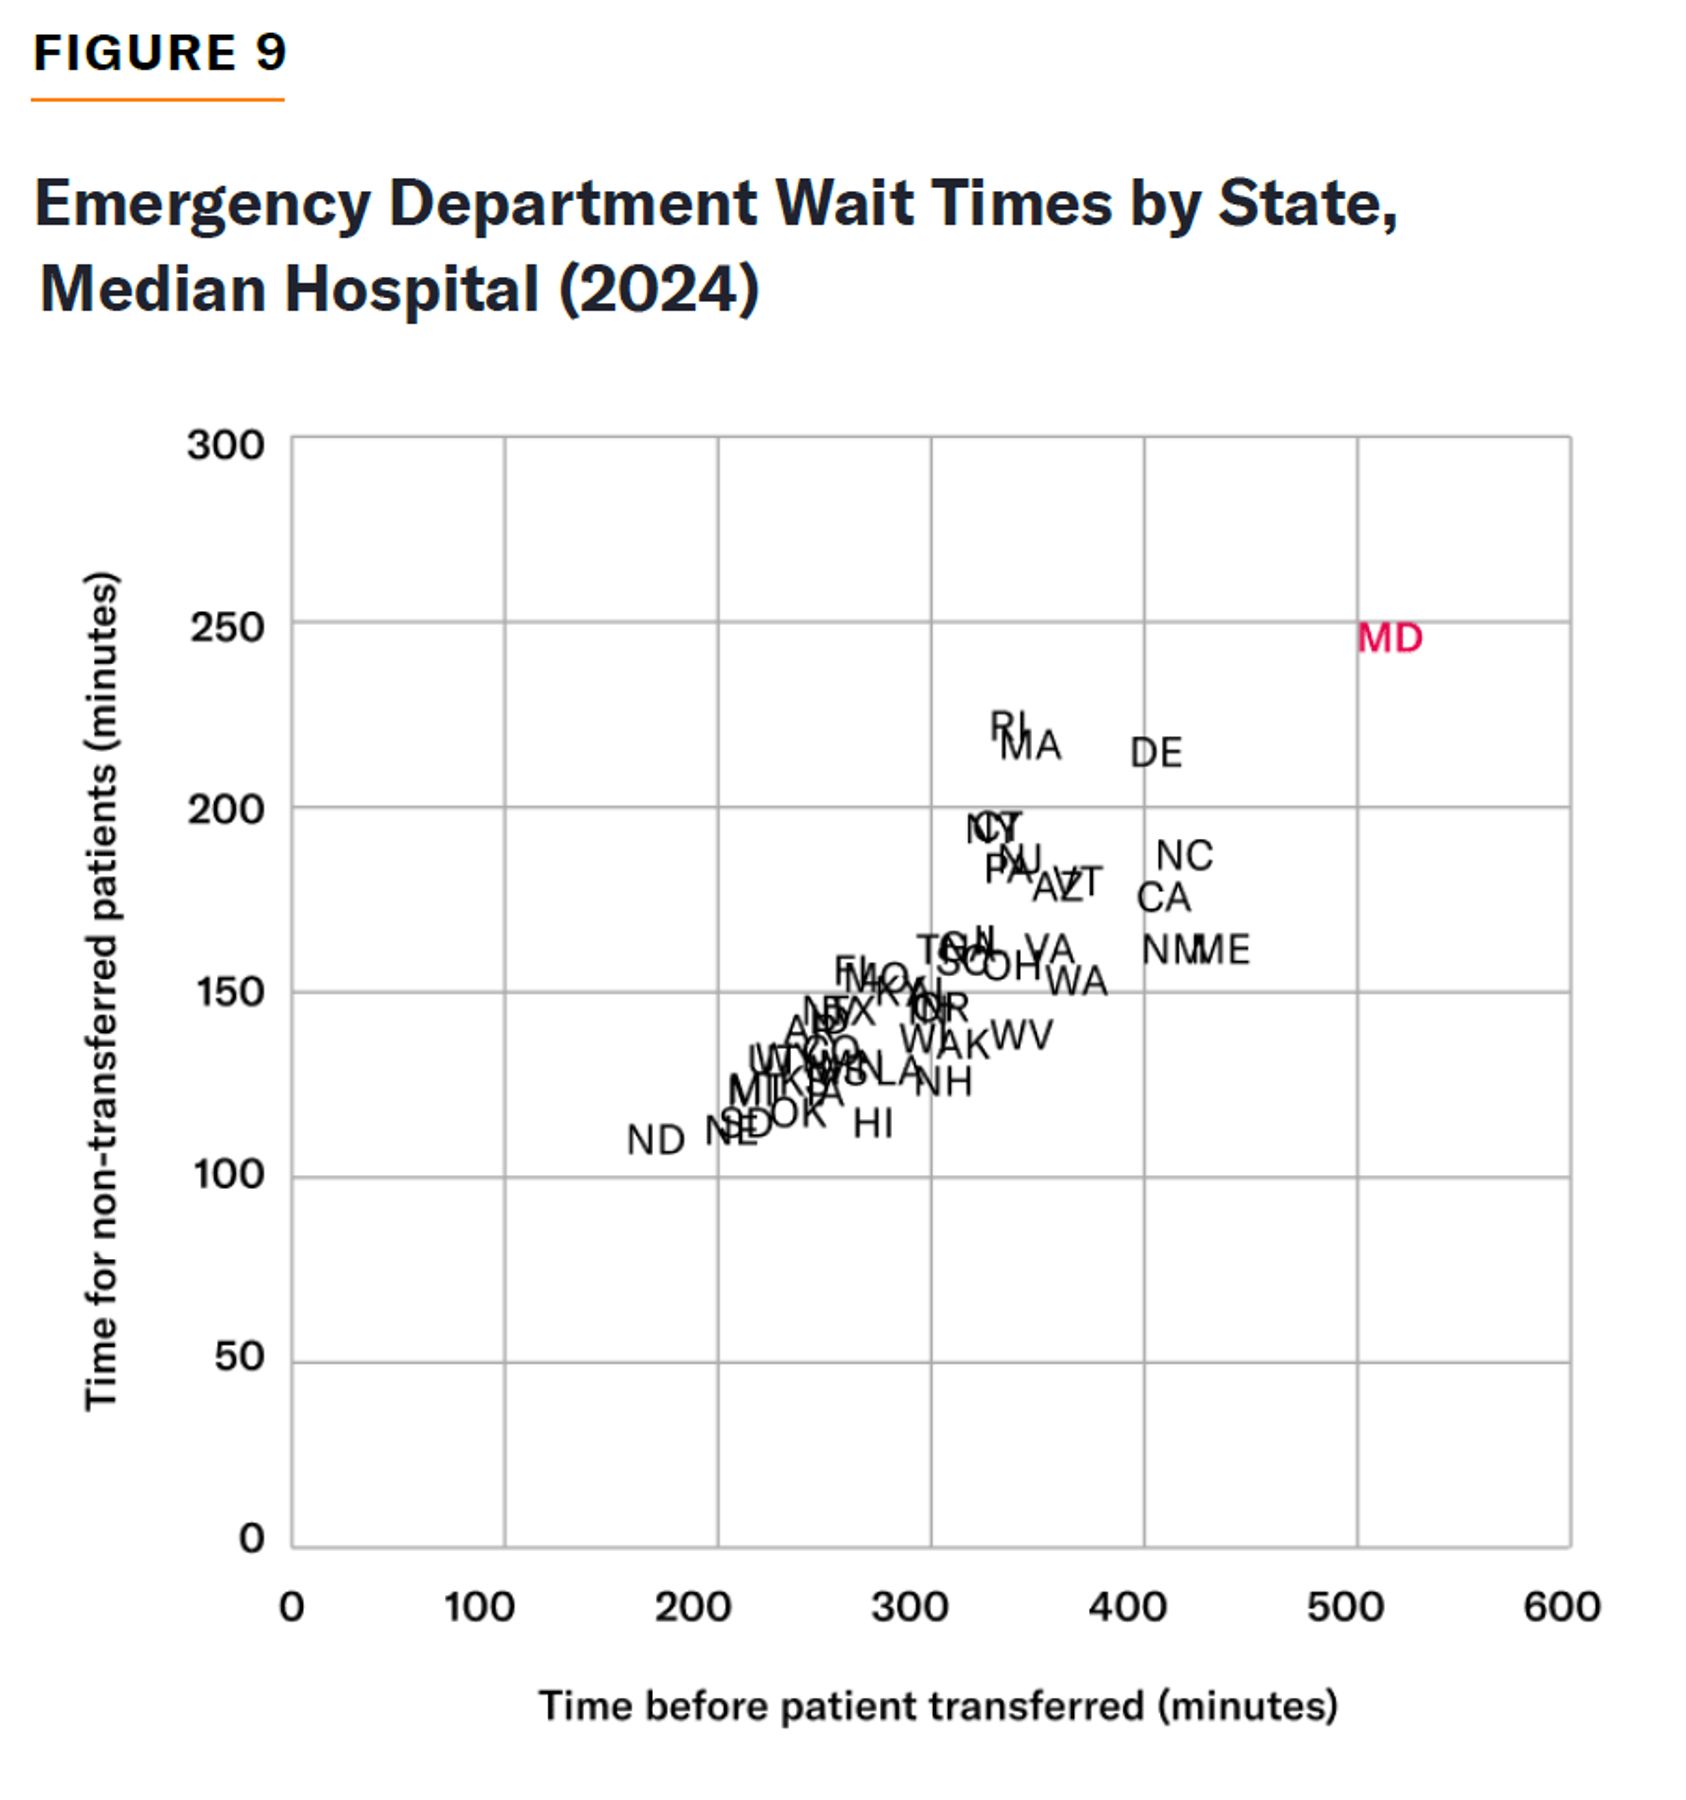
From 2014 to 2023, average ED wait times for Maryland patients rose from 137% to 153% of the national average.[34] The rise occurred despite a 30% decline in the state’s per-capita ED utilization during 2012–23, while national ED use remained flat.[35]
Shifting Treatment Out of State
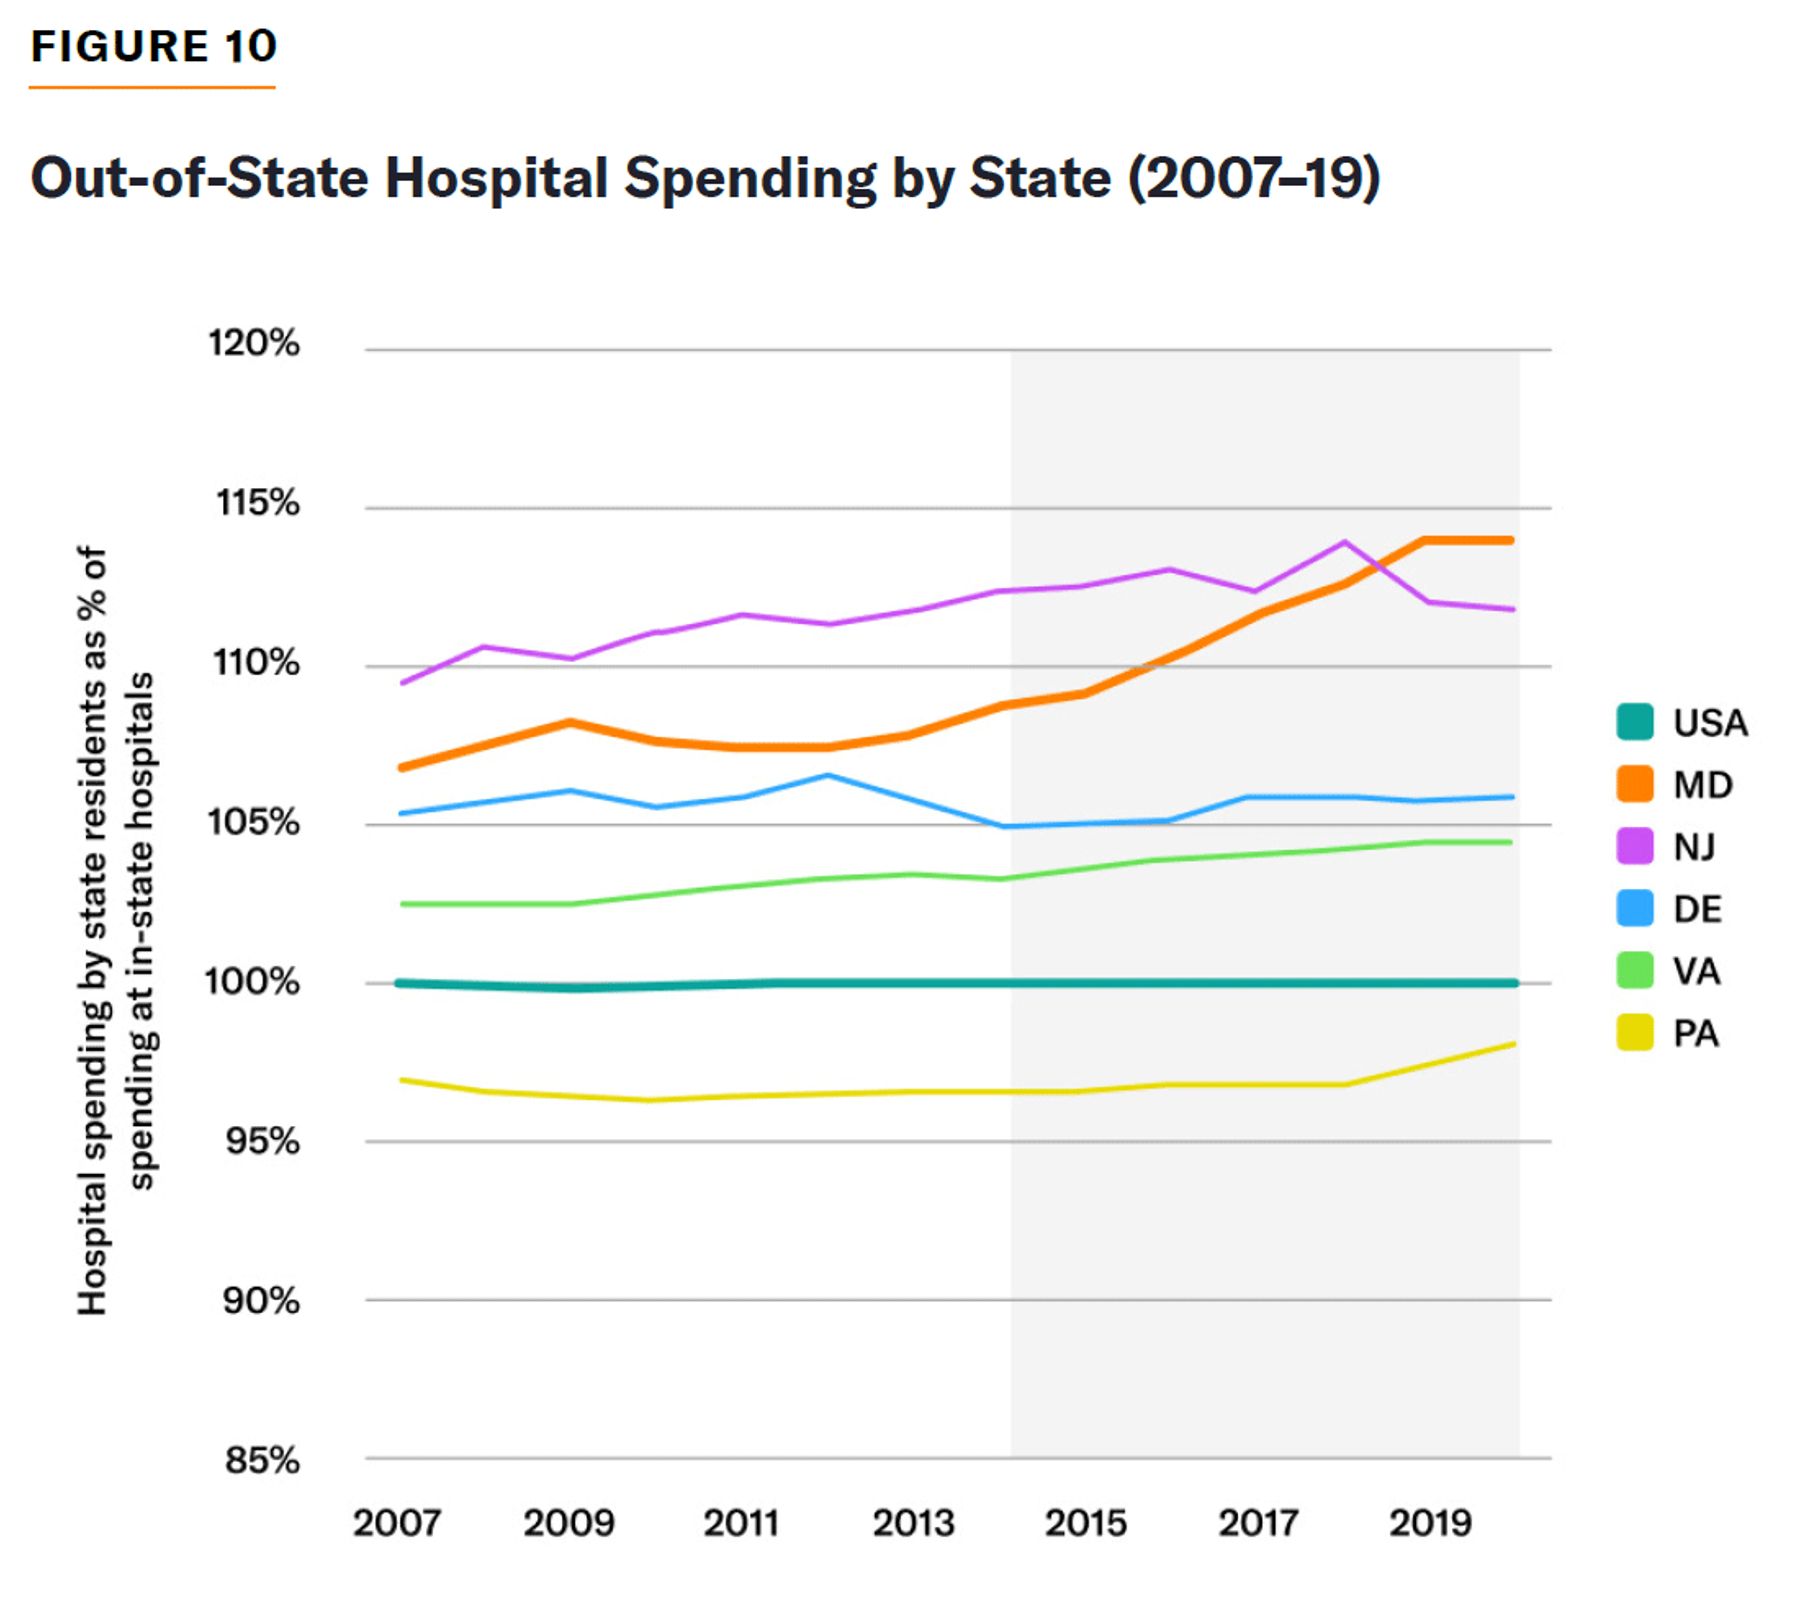
The introduction of spending limits at Maryland hospitals often diverted health-care expenditures out of state. From 2013 to 2019, the ratio of hospital spending by Maryland residents to spending at Maryland hospitals rose from 108% to 114%, a metric that remained stable in other states (Figure 10). The ratio of total health-care spending by Maryland residents to health-care spending at Maryland medical providers rose from 103% to 107% over the same period.[36]
The out-of-state shift can be seen clearly in elective orthopedic surgery. Major joint replacements for Maryland residents at affiliated hospitals in adjacent states rose by 23% following the introduction of GBs. At Maryland hospitals with affiliates in other states, the growth in major joint replacements was 13% slower than in Maryland-only hospitals.[37]
Consolidation
Payment regulation has likely encouraged mergers and acquisitions in Maryland’s hospital sector. Some policy analysts have blamed unregulated hospital fees and revenues for the consolidation of hospital markets.[38] But payment regulation may have increased hospital consolidation, as it encourages facilities to shift patients and costs to out-of-state facilities exempt from regulations. Of the six independent Maryland hospitals acquired by systems from 2011 to 2024, three were taken over by systems based in neighboring states.[39]
Making hospitals responsible for the TCOC beyond inpatient facility fees has encouraged further consolidation. From 2003 to 2024, consolidation was higher in Maryland (with the share of hospitals in systems rising from 49% to 84%) than the country as a whole (from 54% to 70% in systems).[40]
Costs
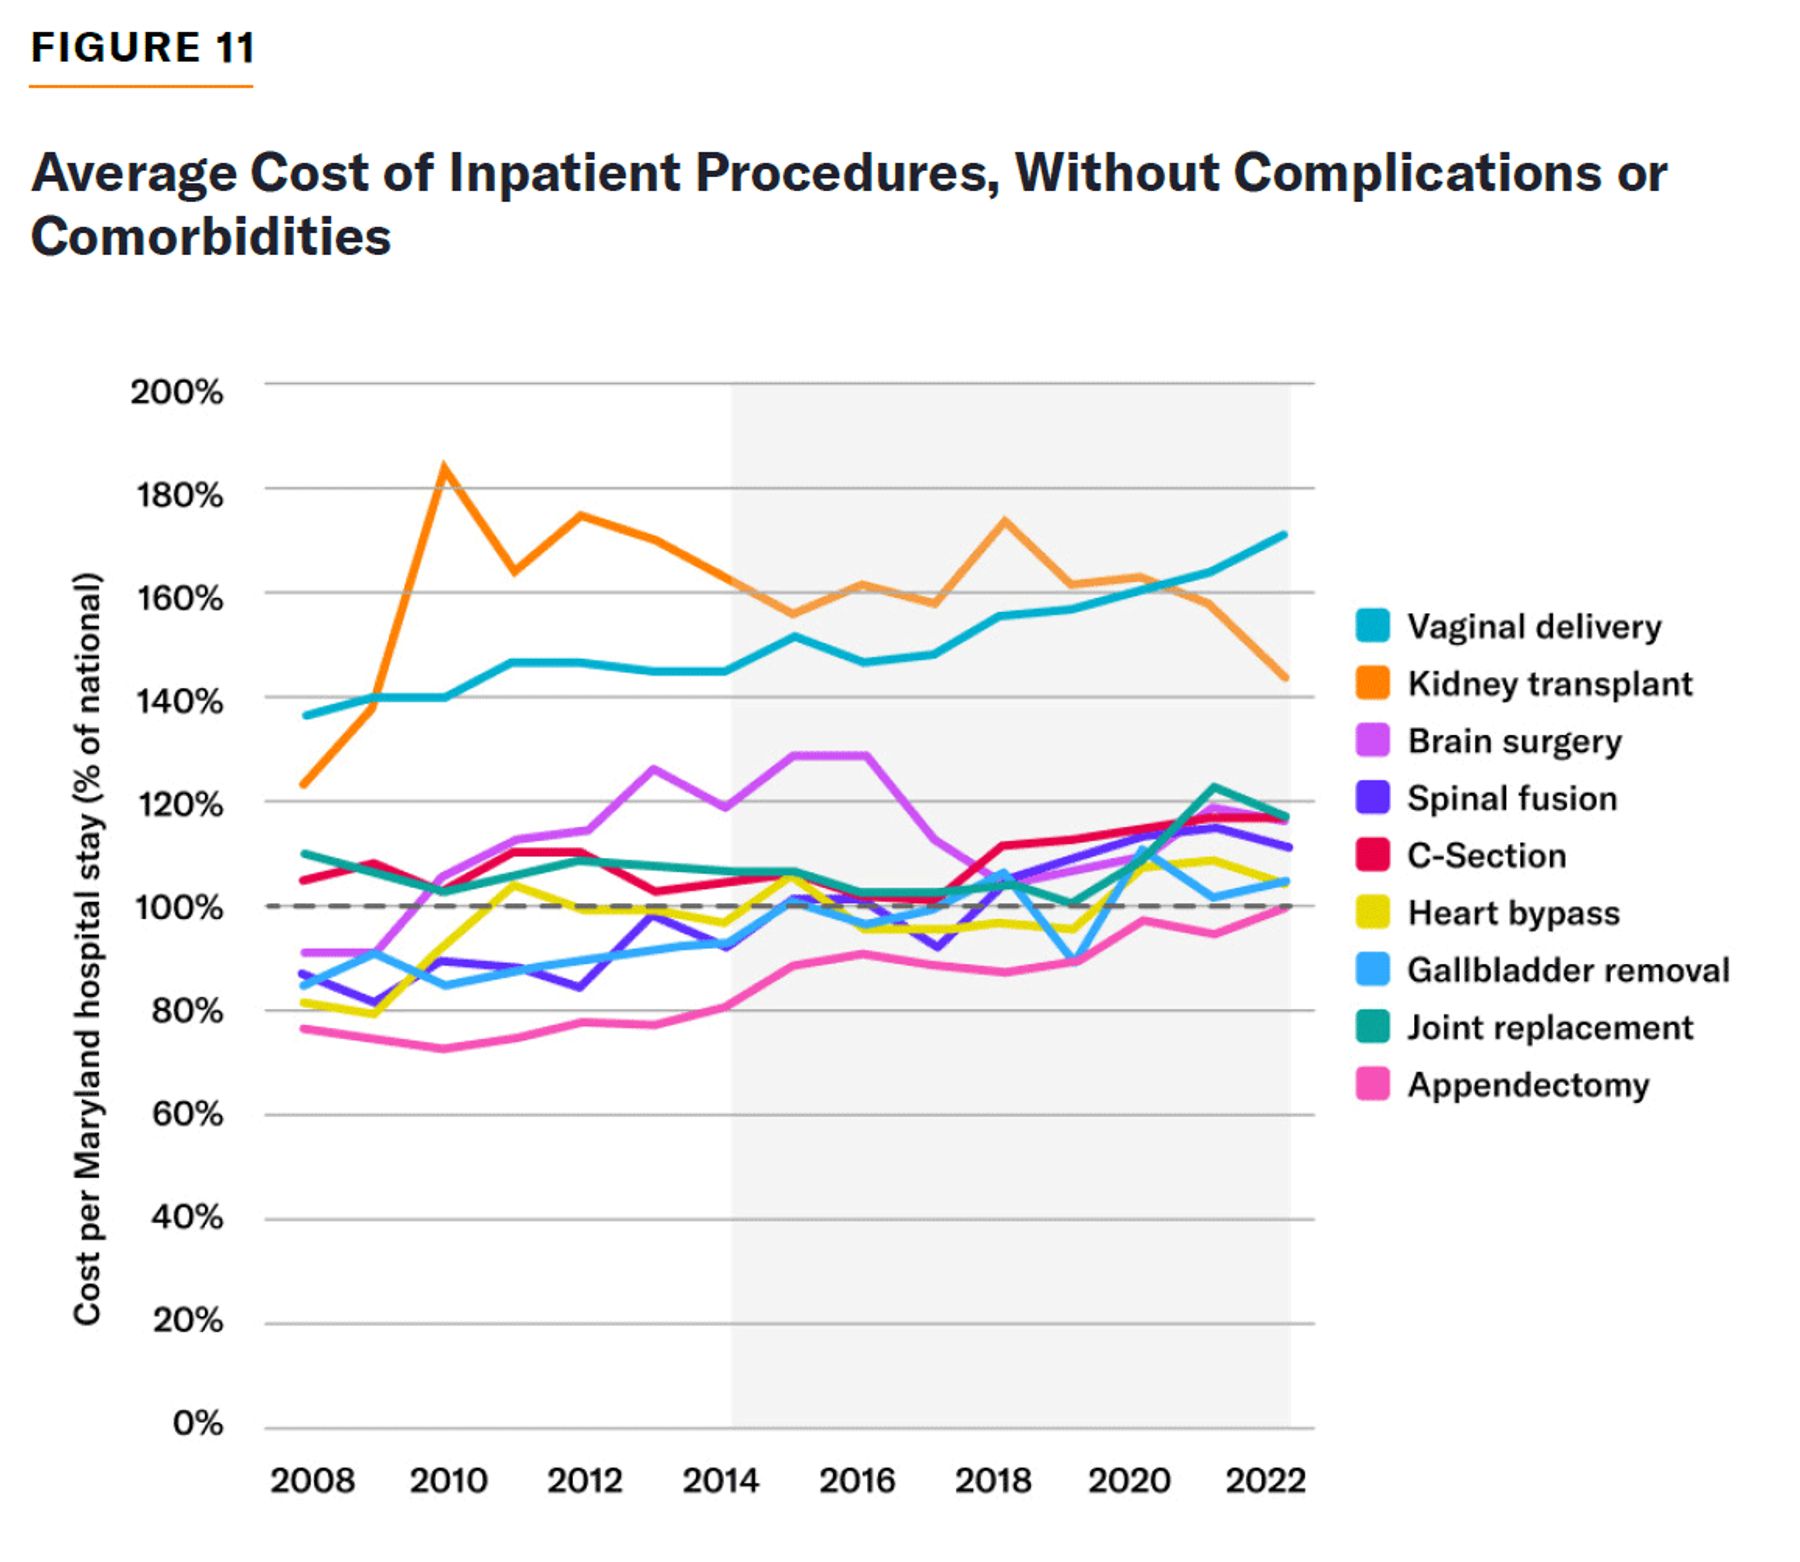
Because GBs fix total hospital revenues, the decline in the volume of services provided across the state has led to an increase in the cost of each.
From 2008 to 2022, the cost of several common hospital procedures for patients without complications or comorbidities increased 7%–34% more in Maryland than nationwide (Figure 11).
Furthermore, HSCRC estimated that, from 2014 to 2024, 42 of 50 Maryland hospitals received more revenue from GBs than they would have by delivering the same procedures fee-for-service—adding a further $1.1 billion to the TCOC (about 0.5% of hospital spending in the state over that period).[42]
Quality of Care
Despite higher costs, the absence of additional revenues for readmissions, and special penalties for inferior performance, Maryland hospitals do not appear to offer patients a superior quality of care, by most standard metrics of appropriate treatment (Figure 12).
FIGURE 12
Quality of Care, Median Hospital (2024)
| USA | MD | DE | NJ | PA | VA | |
| Received appropriate sepsis care | 64% | 64% | 46% | 72% | 59% | 66% |
| Received timely scan post-stroke | 69% | 70% | 55% | 72% | 69% | 69% |
| Pressure sores | 0.51% | 0.65% | 0.61% | 0.50% | 0.55% | 0.38% |
| Bloodstream infection after surgery | 5.10% | 5.00% | 5.81% | 5.22% | 5.04% | 5.09% |
| In-hospital fall-associated fracture | 0.27% | 0.26% | 0.26% | 0.25% | 0.26% | 0.26% |
| Collapsed lung due to treatment | 0.20% | 0.20% | 0.18% | 0.18% | 0.20% | 0.20% |
| Accidental cut/tears due to treatment | 1.02% | 0.95% | 1.04% | 0.98% | 1.03% | 1.03% |
Source: CMS, Provider Data Catalog, “Complications and Deaths—Hospital”
The state saw a modest relative decline in rates of avoidable complications and hospitalization costs following the implementation of GBs.[43] Following cancer surgery, there was also a modest relative decline in 30-day readmissions but no significant changes in associated expenditure, mortality, or ED visits.[44] But Maryland’s Medicare hospital readmission rate remained slightly above the national average.[45]
The readmission rate after hospitalization may reflect some avoidable costs but does not necessarily measure quality of care. Maryland saw a 9% reduction in the 30-day unplanned hospital readmission rate during 2019–22, relative to a control group, but this was less than the 16% relative reduction of general hospital admissions over the same period.[46] A relative decline in readmissions may also capture patients being shifted to other sites of care or observation status.
Health outcomes after major hospital procedures are not significantly different in Maryland, compared with other states or nationwide (Figure 13). These broad statistics, however, should be treated with caution, as they likely reflect other more substantial differences in patient health.
FIGURE 13
Patient Outcomes, Median Hospital
| USA | MD | DE | NJ | PA | VA | |
| Heart attack, 30-day mortality | 12.1% | 11.8% | 12.9% | 11.9% | 12.0% | 12.0% |
| COPD, 30-day mortality | 8.7% | 8.5% | 8.3% | 8.0% | 8.5% | 8.7% |
| Stroke, 30-day mortality | 13.1% | 13.6% | 12.4% | 12.5% | 12.9% | 13.2% |
| Pneumonia, 30-day mortality | 16.2% | 16.4% | 15.2% | 15.4% | 15.5% | 16.4% |
| Complications for joint replacement | 3.5% | 3.5% | 4.2% | 3.6% | 3.5% | 3.7% |
| Infant mortality, per 1,000 live births | 5.6% | 6.0% | 7.5% | 3.6% | 5.7% | 6.2% |
Source: CMS,“Complications and Deaths—Hospital”; Commonwealth Fund,“Hospital 30-Day Readmissions Age 65 and Older, per 1,000 Medicare Beneficiaries”
Medicare Payments
Maryland values its all-payer waiver largely for its impact on Medicare payment. The waiver serves to increase payments for Medicare patients and is contingent on the state’s level of Medicare spending.
Medicare spending per beneficiary is substantially higher in Maryland than nationwide and in most neighboring states. Maryland’s rate of hospitalizations per Medicare beneficiary is similar to the national average, but Maryland receives far more money for each hospitalization than any other state. In 2014, nationwide, Medicare paid hospitals 32% more, on average, than standard inpatient rates for services, due to payment add-ons and geographic adjustments; in Maryland, Medicare paid 82% more (Figure 14).
FIGURE 14
Medicare Spending by State
| USA | MD | PA | DE | NJ | VA | |
| Total spending per beneficiary ($) | ||||||
| (2024) | 13,606 | 14,982 | 12,923 | 13,584 | 15,596 | 11,791 |
| (2012) | 9,713 | 11,397 | 10,008 | 9,690 | 11,287 | 8,462 |
| Inpatient spending per beneficiary ($) | ||||||
| (2024) | 3,807 | 5,065 | 3,720 | 3,630 | 4,458 | 3,195 |
| (2012) | 3,280 | 4,514 | 3,424 | 3,281 | 3,803 | 2,869 |
| Hospitalizations per 1,000 beneficiaries | ||||||
| (2024) | 225 | 218 | 240 | 209 | 247 | 207 |
| (2012) | 300 | 320 | 327 | 278 | 317 | 286 |
| Inpatient spending per hospitalization ($) | ||||||
| (2024) | 16,920 | 23,234 | 15,500 | 17,368 | 18,049 | 15,435 |
| (2012) | 10,933 | 14,106 | 10,471 | 11,802 | 11,997 | 10,031 |
| Inpatient payment relative to standard prospective payment | ||||||
| (2024) | 132% | 182% | 125% | 133% | 142% | 119% |
| (2012) | 121% | 153% | 120% | 126% | 131% | 112% |
Source: CMS, “Medicare Geographic Variation—by National, State & County”
The most recently published CMMI evaluation concluded that the TCOC model reduced Maryland Medicare spending by 2.1% during 2019–22.[47] HSCRC estimates that Maryland’s Medicare spending in 2025 was 8.8% below the target in TCOC waiver agreement.[48] From 2013 to 2025, HSCRC claims that Maryland reduced Medicare spending by $696 million, relative to national trends—with the bulk of savings associated with hospital outpatient care.[49]
Maryland’s total Medicare revenue has declined relative to the rest of the country, but the decline was already happening before the implementation of GB in 2014 or TCOC caps in 2019. From 2007 to 2024, Maryland’s hospital inpatient spending per beneficiary declined from 147% to 133% of the nationwide level, and its total Medicare spending declined from 119% to 110% of the national level (Figure 15).[50]
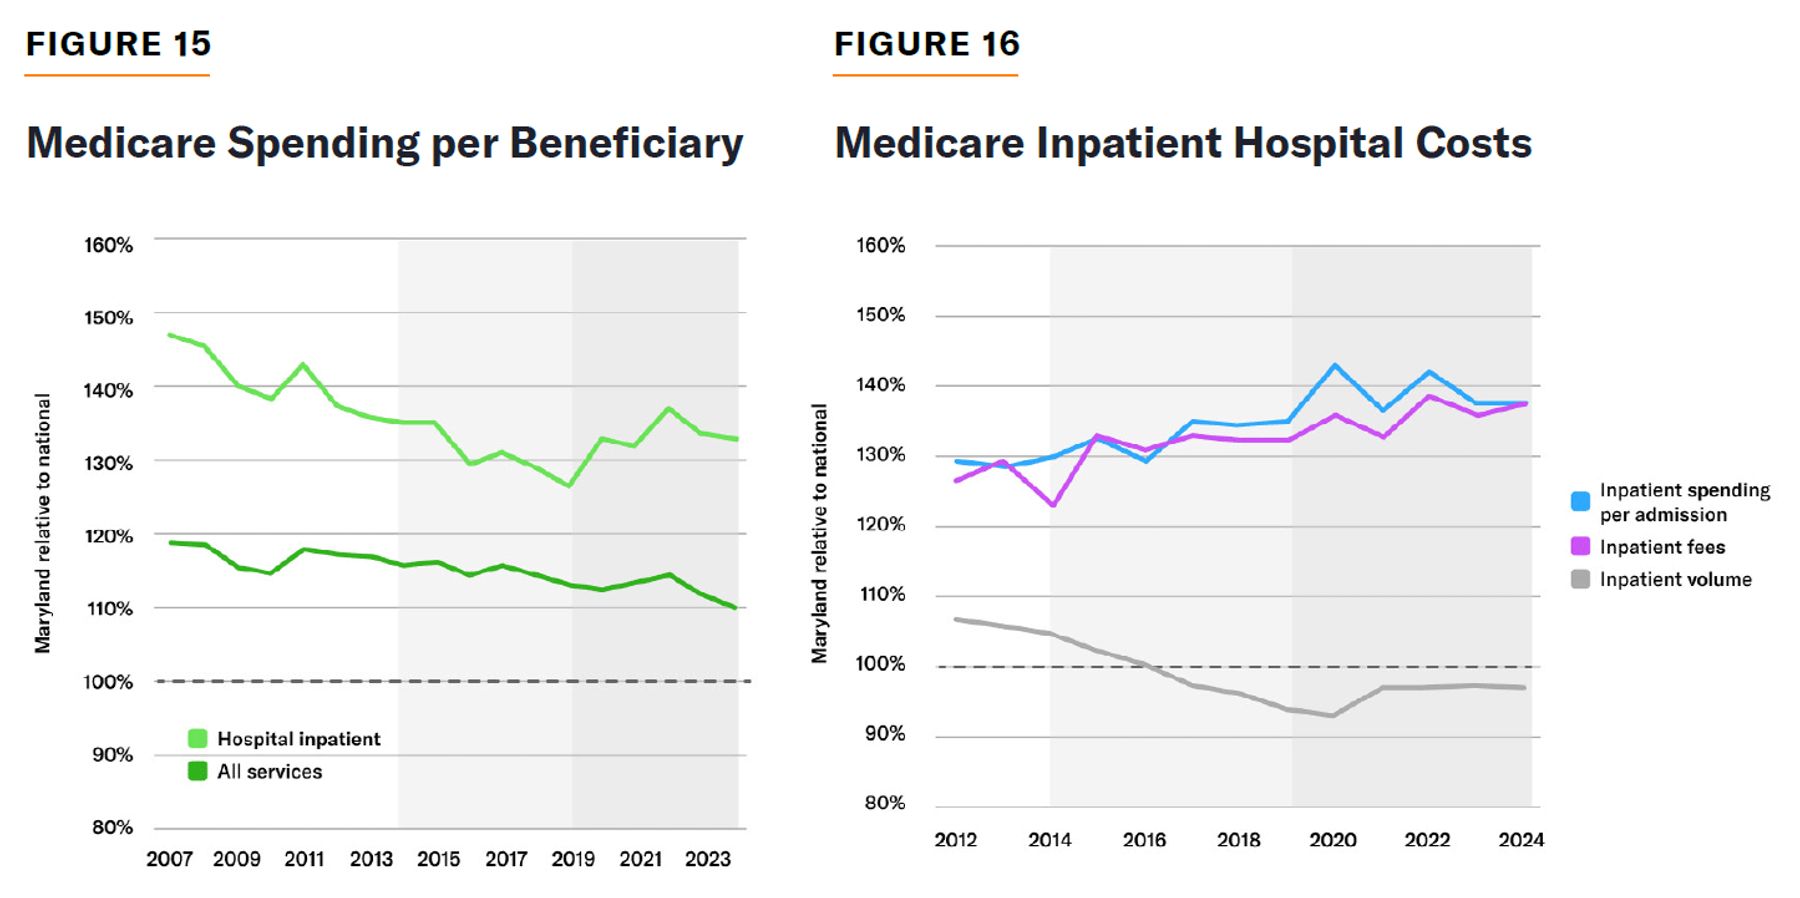
The federal government still pays Maryland hospitals substantially more than other states for equivalent Medicare services. (These fees, in turn, set upper payment limits for Medicaid fees, which limit the matching funds that states can claim from the federal government.) In 2024, payments to Maryland hospitals for equivalent inpatient procedures were 37% higher than in the rest of the country. Over recent years, the increase in payments for Medicare services in Maryland, relative to the national average, has largely offset the relative decline in the volume of Medicare inpatient procedures (Figure 16).[51]
Although aggregate Medicare spending in Maryland has decreased slightly in recent years, it remains high relative to national levels. In fact, as the volume of care has declined faster than total spending, the rate of overpayment for specific Maryland Medicare hospital services has increased slightly over recent years.
The Prospects of Capped Hospital Budgets
Maryland’s comprehensive restrictions on payments for hospital care remain unique in the United States. The AHEAD model in other states remains largely limited to enrollees in Medicare and Medicaid. Without the prospect of a major subsidy from the Medicare program, all-payer hospital payment regulations have struggled to gain the support of both insurers and hospitals.[52] Other countries, such as the United Kingdom and Germany, are gradually moving away from GB caps for hospitals, even though most services in those countries remain publicly financed.[53]
Even in Maryland, comprehensive hospital payment regulation rests on an increasingly shaky foundation. Since 2014, the state’s exemption from traditional caps on Medicare and Medicare rates has depended on a waiver at the discretion of CMMI, rather than a special statutory provision. As a result, the state will increasingly be held to the same standards as other states and required to demonstrate that its regulatory system does not increase costs for federal taxpayers.
In 2022, Maryland’s Medicare TCOC spending growth exceeded the national trend for a second straight year, violating a condition of the waiver.[54] When CMMI assumes control of Maryland hospital fees in 2028, such violations will be easier to sanction. Fees will likely gravitate toward national Medicare rates, even if a future administration is not enthusiastically committed to eliminating overpayments.
This makes it unlikely that CMMI will long maintain a major windfall for a single state that can persuade its health-care providers, insurers, and patients alike to all swallow whatever reservations they may have about payment regulation.
Indeed, Maryland’s hospitals are increasingly frustrated with caps on their revenues. Hospitals prefer predictable market signals to a complex web of arbitrary revenue regulations, which reduce control over revenue that is needed for long-term investments. Smaller hospitals lack the capital reserves and diversified patient population to bear the cost of even a few of the most seriously ill patients. Prestigious facilities like Johns Hopkins are struggling to compete with academic medical centers in other states for patients and top physicians.
GBs create a constant fight between hospitals over limited total resources. The system tries to adjust hospital budgets according to shifts in patient demand between facilities. But this has yielded a web of increasingly complex payment add-ons. These add-ons are the product of political negotiations over multiple conflicting objectives, and thus tend to be rigid, deteriorating in fit as market circumstances shift over time.
As a result, payments do not fully compensate academic medical centers for the costliest patients transferred from local hospitals, which have a strong incentive to transfer them. Imperfect adjustments for volumes (only 50% of revenue moves with service provision), combined with a policy objective of preventing rural hospital closures, tend to steer resources toward inefficient hospitals with declining patient populations. From 2012 to 2023, for example, Chester River Hospital Center saw its operating profit per patient discharge surge from $1,510 to $8,796, while the number of patients it admitted slumped from 5,828 to 1,899.[55]
The change in the Medicare waiver condition, from all-payer rate uniformity to Medicare spending control, has already eroded Maryland’s commitment to using regulation to limit charges to private insurers. In November 2025, the state proposed increasing the permitted disparity in fees between private and public payers to 11.55% to make up for reduced Medicare and Medicaid revenues.[56] As Maryland’s Medicare rates fall toward national levels, its hospital industry is likely to insist on further increases to make up for lost revenues, which will make Maryland’s regulatory system less distinctive from payment arrangements in other states.
Conclusion
For over half a century, Maryland hospitals have been able to claim a Medicare and Medicaid revenue windfall from the federal government due to state control of all fees for inpatient procedures. Over recent years, this system has been used to limit hospitals’ total revenue, from both public and private payers.
While these GB caps have slowed the growth of hospital expenditures, they have done so mostly by reducing the amount of care that is delivered in the state. There has not been a substantial reduction in wasteful utilization of health-care services or a large-scale shift of procedures to cheaper sites of service. Rather, Maryland has substantially reduced access to the most expensive surgical procedures, while increasing wait times for emergency care beyond those in any other state. As the volume of medical services delivered in Maryland has declined, compared with the rest of the country, the cost of specific procedures has increased.
Other states should not look to Maryland’s system of hospital payment regulations for an effective model for improving the delivery of health-care services. Indeed, Maryland itself will likely seek to move away from this arrangement in the years to come.
About the Author
Chris Pope is a senior fellow at the Manhattan Institute, where his research focuses on entitlement reform, insurance markets, and healthcare payment policy. Pope is the author of The American Way of Welfare – an assessment of the historical development, current effectiveness, and opportunities to reform the welfare state. He has recently published reports on Medicaid managed care, the extent of redistribution by age and income, social determinants of health, and rural hospital finance. Previously, Pope was director of policy research at West Health, health-policy fellow at the U.S. House Committee on Energy and Commerce, and research manager at the American Enterprise Institute. He holds a B.Sc. in government and economics from the London School of Economics and an M.A. and Ph.D. in political science from Washington University in St. Louis.
Appendix Tables
FIGURE A-1
Health-Care Spending by State
| USA | MD | DE | NJ | PA | VA | |
| Total per capita (2020) | 10,191 | 10,839 | 12,899 | 11,969 | 11,604 | 9,195 |
| Total per capita (2012) | 7,477 | 8,110 | 9,446 | 8,337 | 8,577 | 7,045 |
| Hospital per capita (2020) | 3,855 | 3,881 | 5,377 | 4,135 | 4,199 | 3,403 |
| Hospital per capita (2012) | 2,797 | 3,033 | 3,695 | 2,758 | 3,121 | 2,587 |
Figure A-2
Volume of Inpatient Stays per Million Residents (2012 vs. 2023)
| Diagnostic category | USA | MD | NJ | NY | NC |
| Nervous system (2012) | 6,987 | 7,639 | 7,443 | 11,536 | 8,205 |
| (2023) | 6,954 | 7,443 | 6,383 | 11,239 | 8,373 |
| Ear, nose, throat (2012) | 1,188 | 1,260 | 1,229 | 2,509 | 1,058 |
| (2023) | 792 | 550 | 798 | 1,732 | 862 |
| Respiratory (2012) | 11,307 | 10,916 | 11,079 | 16,889 | 13,704 |
| (2023) | 8,808 | 7,477 | 8,601 | 13,911 | 11,506 |
| Circulatory (2012) | 15,280 | 14,383 | 17,584 | 27,616 | 18,213 |
| (2023) | 13,324 | 9,529 | 12,713 | 20,718 | 16,592 |
| Digestive (2012) | 10,331 | 10,241 | 11,123 | 17,207 | 11,344 |
| (2023) | 7,618 | 6,041 | 7,510 | 12,621 | 9,256 |
| Musculoskeletal (2012) | 10,358 | 10,272 | 8,441 | 15,140 | 11,736 |
| (2023) | 7,390 | 5,189 | 5,794 | 5,794 | 8,870 |
| Endocrine (2012) | 3,696 | 3,626 | 3,813 | 6,802 | 4,343 |
| (2023) | 4,097 | 3,436 | 4,030 | 7,004 | 5,418 |
| Kidney, urinary (2012) | 5,325 | 5,437 | 5,781 | 8,219 | 6,175 |
| (2023) | 5,040 | 3,787 | 5,274 | 7,496 | 6,035 |
| Maternity (2012) | 13,254 | 12,569 | 12,462 | 20,405 | 15,099 |
| (2023) | 11,039 | 10,287 | 10,841 | 15,714 | 14,308 |
| Immunological (2012) | 1,565 | 1,856 | 1,773 | 3,116 | 1,877 |
| (2023) | 1,282 | 1,210 | 1,467 | 2,348 | 1,695 |
| Infectious (2012) | 4,550 | 5,218 | 4,384 | 7,475 | 5,672 |
| (2023) | 8,333 | 7,203 | 7,431 | 12,469 | 9,246 |
| Mental (2012) | 4,550 | 5,942 | 5,064 | 9,205 | 5,554 |
| (2023) | 3,694 | 3,697 | 3,878 | 6,829 | 4,889 |
| Injuries/poison (2012) | 1,789 | 1,887 | 1,515 | 2,865 | 1,982 |
| (2023) | 1,530 | 1,171 | 1,305 | 2,290 | 1,777 |
Source: AHRQ, AHRQ Data Tools; KFF, State Health Facts, “Total Number of Residents”
FIGURE A-3
Inpatient Procedures per Million Residents (2012 vs. 2023)
| Procedure | USA | MD | NJ | NY | NC |
| Vaginal delivery (2012) (2023) | 7,987 6,673 | 7,410 6,255 | 6,893 6,708 | 11,959 9,329 | 9,383 8,858 |
| Cesarean section (2012) (2023) | 3,997 3,090 | 3,973 3,162 | 4,318 3,110 | 6,177 4,625 | 4,230 3,728 |
| Joint replacement (2012) (2023) | 3,324 603 | 3,022 309 | 2,329 296 | 4,268 2,179 | 4,074 843 |
| Spinal fusion (2012) (2023) | 1,217 994 | 1,184 506 | 745 690 | 1,650 1,387 | 1,481 1,296 |
| Appendix removal (2012) (2023) | 710 215 | 625 124 | 963 201 | 1,330 528 | 529 219 |
| Gallbladder removal (2012) (2023) | 998 632 | 805 371 | 1,170 616 | 1,415 1,087 | 1,020 744 |
| Heart bypass (2012) (2023) | 473 466 | 330 328 | 395 379 | 574 568 | 562 634 |
| Brain surgery (2012) (2023) | 466 663 | 483 536 | 355 470 | 762 1,068 | 539 825 |
| Kidney transplant (2012) (2023) | 49 55 | 79 33 | 40 59 | 86 87 | 61 61 |
| CAR-T therapy (2012) (2023) | - 17 | - 15 | - 14 | - 38 | - 14 |
Source: AHRQ, AHRQ Data Tools; U.S. Census Bureau, “State Population Totals and Components of Change: 2020–2025”; U.S. Census Bureau, “State Population Totals: 2010–2020”[57]
Endnotes
Are you interested in supporting the Manhattan Institute’s public-interest research and journalism? As a 501(c)(3) nonprofit, donations in support of MI and its scholars’ work are fully tax-deductible as provided by law (EIN #13-2912529).