If You Can’t Measure It, Can You Improve It?

Photo: Thana Prasongsin / Moment via Getty Images
Executive Summary
In 2023, the U.S. dedicated nearly $1 trillion in combined state, local, and federal funding to K–12 education, more than any other program aside from major entitlements.[1] Across municipalities ranging from small villages to major cities, education spending dwarfs other essential services such as transportation, housing, sanitation, and law enforcement. Cumulatively, more taxpayer funds are spent on elementary and secondary education than on national defense.[2]
Given the scale of our investment in education, a fierce debate is occurring about how the system should function. An enormous array of policies, programs, and perspectives exists on how best to prepare America’s young people for higher education and the rapidly evolving modern workplace, as well as their civic role in contemporary society. These practices often conflict and are sometimes mutually exclusive. Depending on what one reads or to whom one listens, the public is told the following:
- Charter schools are a striking success—or a failed and damaging experiment.[3]
- We spend not nearly enough on public education—or way too much.[4]
- School choice programs do—or don’t—result in fewer resources being available to public school students.[5]
Such proclamations inevitably yield confused and frustrated parents, educators, and taxpayers. Precious resources are squandered; most significantly, opportunity is diminished for countless students. It is not easy to evaluate how much we are getting from this massive investment. Despite the abundance of data on K–12 education, little empirical analysis is publicly available about how well education funds are managed. Nor is there a commonly accepted methodology to evaluate how spending strategies or other policies translate into academic outcomes and broader student development.
This report presents a new, easily understood, framework—Educational Return on Investment (EROI)—which can be used to evaluate which primary and secondary educational options offer the public, students, and other stakeholders the best return on their K–12 educational investment. Using the EROI framework, this report evaluates several existing K–12 systems in New York State, and it offers recommendations as to how this framework should be broadly and deeply deployed—and what is needed to do so.
Key Findings
- New York’s public school systems do not lack financial resources. From kindergarten through high school, New York City on average spent nearly $400,000 per student in current dollars, or approximately $30,000 per year for the 2013–17 traditional high school cohort examined in this report.
- This total, sizable as it is, pales when student outcomes are factored in by utilizing the EROI approach. To produce one high school graduate with a low-income socioeconomic status costs about $639,000 in today’s dollars. To yield an eventual single associate’s or B.A. degree recipient from that same low-income cohort, the NYC public school system expended approximately six times the amount spent per pupil, $2.2 million in constant 2025 dollars.
- The aforementioned is not strictly a NYC public school phenomenon. When examining New York State public schools, both with and without New York City students included, the same disturbing trends and disparities are observed.
- The value that is actually realized by New York public school taxpayers and students assumes greater salience when comparing New York public school systems with one NYC private school alternative, which, at the secondary level, exclusively serves families of limited economic means: six times the number of college graduates for the same funding as NYC district public schools, a multiple that grows to nearly nine times when comparing low-income students only.
Background: “Lies, Damn Lies, and Statistics” or “To Measure Is to Know”?
Before elaborating on the EROI framework, we will address a potential objection. Many participants in the debate over K–12 education resist any kind of quantitative measures or analysis in assessing the effectiveness of various school models, systems, and programs. Some argue that such techniques, especially when they influence funding or are linked to teaching and learning practices, do more harm than good.
In a recent New York Times Magazine article, “America’s Children Are Unwell. Are Schools Part of the Problem?” journalist Jia Lynn Yang argues that one cause of mental-health problems among youth may be “school itself,” which“can be a cause of stress that exacerbates anxiety or depression.”[6] The problem with schools, Yang says, traces back to “growing evidence that school itself is essential to understanding why so many children seem to be struggling. It can be a cause of stress that exacerbates anxiety or depression.” The reason? Starting in the 1980s, “a metrics-obsessed regime took over American education and profoundly altered the expectations placed on children, up and down the class ladder.” Modern education policy “strips away the particulars of people, treating them as interchangeable data points” (emphasis added).[7]
It is not our purpose to opine whether Yang has made a compelling case for a causal connection between the addition of new school standards and the explosion in mental-health diagnoses among young people and, as seems to be suggested, why “math and reading levels are at their lowest in decades.”[8] But it is important—and ironic as well—to note that Yang builds her argument largely on the basis of various studies, data, statistics, and polls/surveys.
It is essential not to conflate diagnosis with causation, prescription, or cure. As noted above, the overarching objective behind this report is to offer a value-added new tool that will materially assist in the diagnosis of K–12 schools’ ability to effectively deliver on the enormous responsibility and resources entrusted to them and, where falling short, facilitate efforts to determine causes and successfully execute alternatives and solutions.
Lord Kelvin, a nineteenth-century British mathematician and physicist, is generally credited with coining the maxim “if you can’t measure it, you can’t improve it,” often shortened as “to measure is to know.” Decades later, this idea was introduced to the business world by Peter Drucker, who helped pioneer modern management theory. But this lesson has eluded large swaths of the nation’s K–12 educational sector.
Ample data on education are available to academic scholars and other stakeholders. But therein lies the first obstacle. Too often, stakeholders are overwhelmed with voluminous, partial, opaque, or contradictory information, making it difficult, if not impossible, to discern signal from noise. Whether intentional or not, educational insiders and supposed experts with a vested interest or particular bias are able to cherry-pick narrow data points to support almost any position.
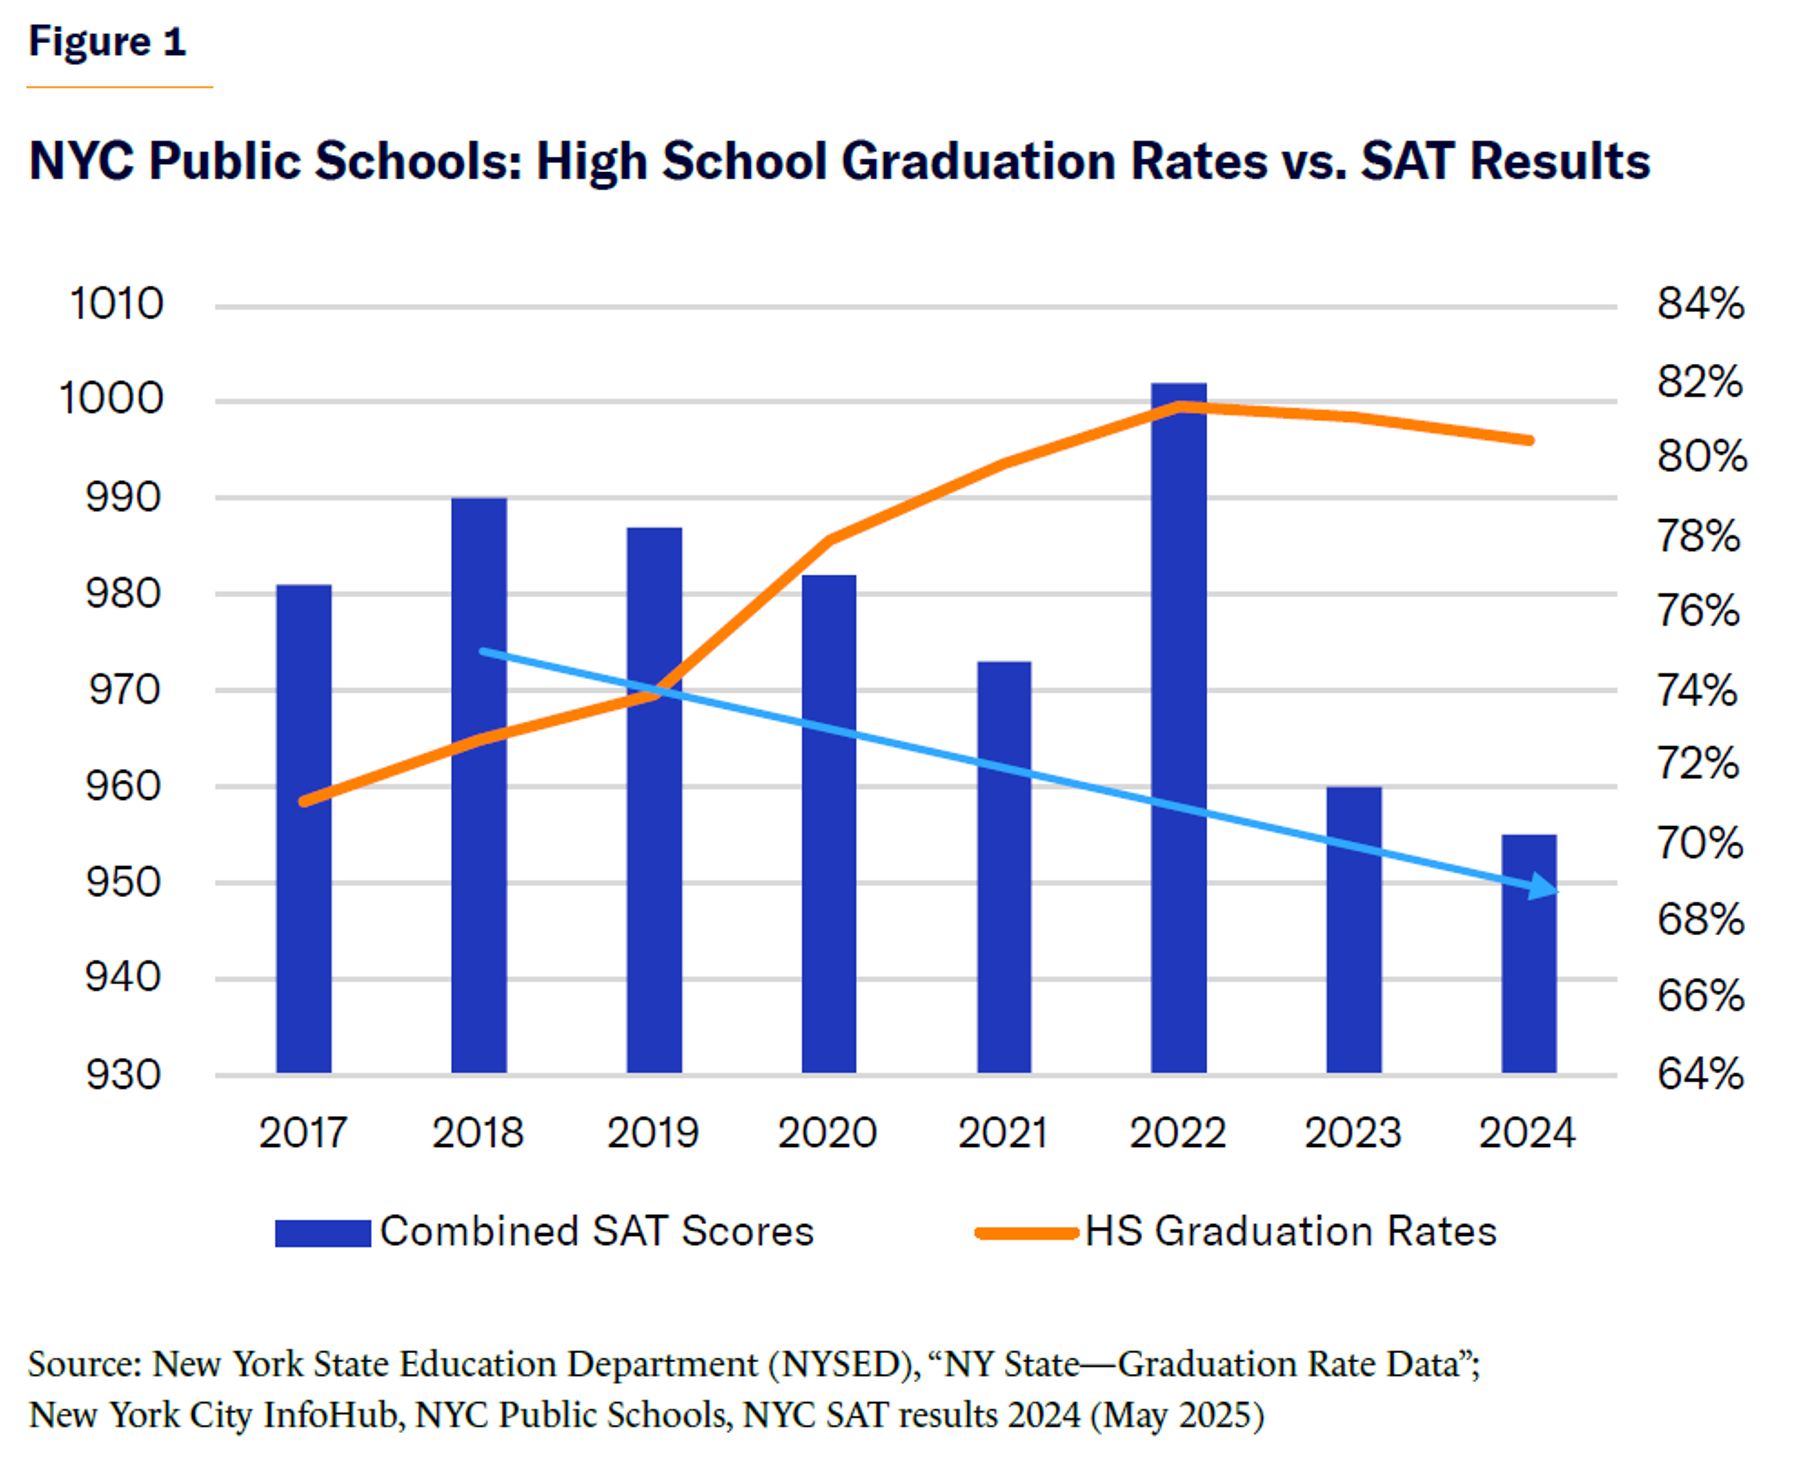
Suppose you want to find out how well New York City public elementary and secondary schools are doing. You might examine recent public high school graduation rates—which increased from less than 60% in 2013 to 80% in 2024, with the number of students receiving an Advanced Regents diploma growing by an even higher percentage: 23% in 2024 vs. 17% in 2013—and conclude that schools have been steadily improving, even excelling.[9] But if instead, you look at SAT participation and scores from the same cohort and period—which have fallen in all but one year since 2018[10]—you would likely get the impression that the same school system is languishing, if not failing (Figure 1).
The SAT data are especially concerning. A recent Wall Street Journal column explained: “After many colleges made standardized tests optional, the College Board last year dumbed down the SAT in an effort to encourage more students to take it. The test now takes two hours, instead of three, and students get more time to complete each question. Gone, too, are long reading passages that might strain TikTok attention spans. Analogies were eliminated in 2005 after academics claimed they were culturally biased.”[11]
Despite the wealth of information available, little publicly available data exist that can be used to assess how well K–12 schools steward taxpayer and benefactor financial resources, be it on an absolute basis or relative to alternatives.
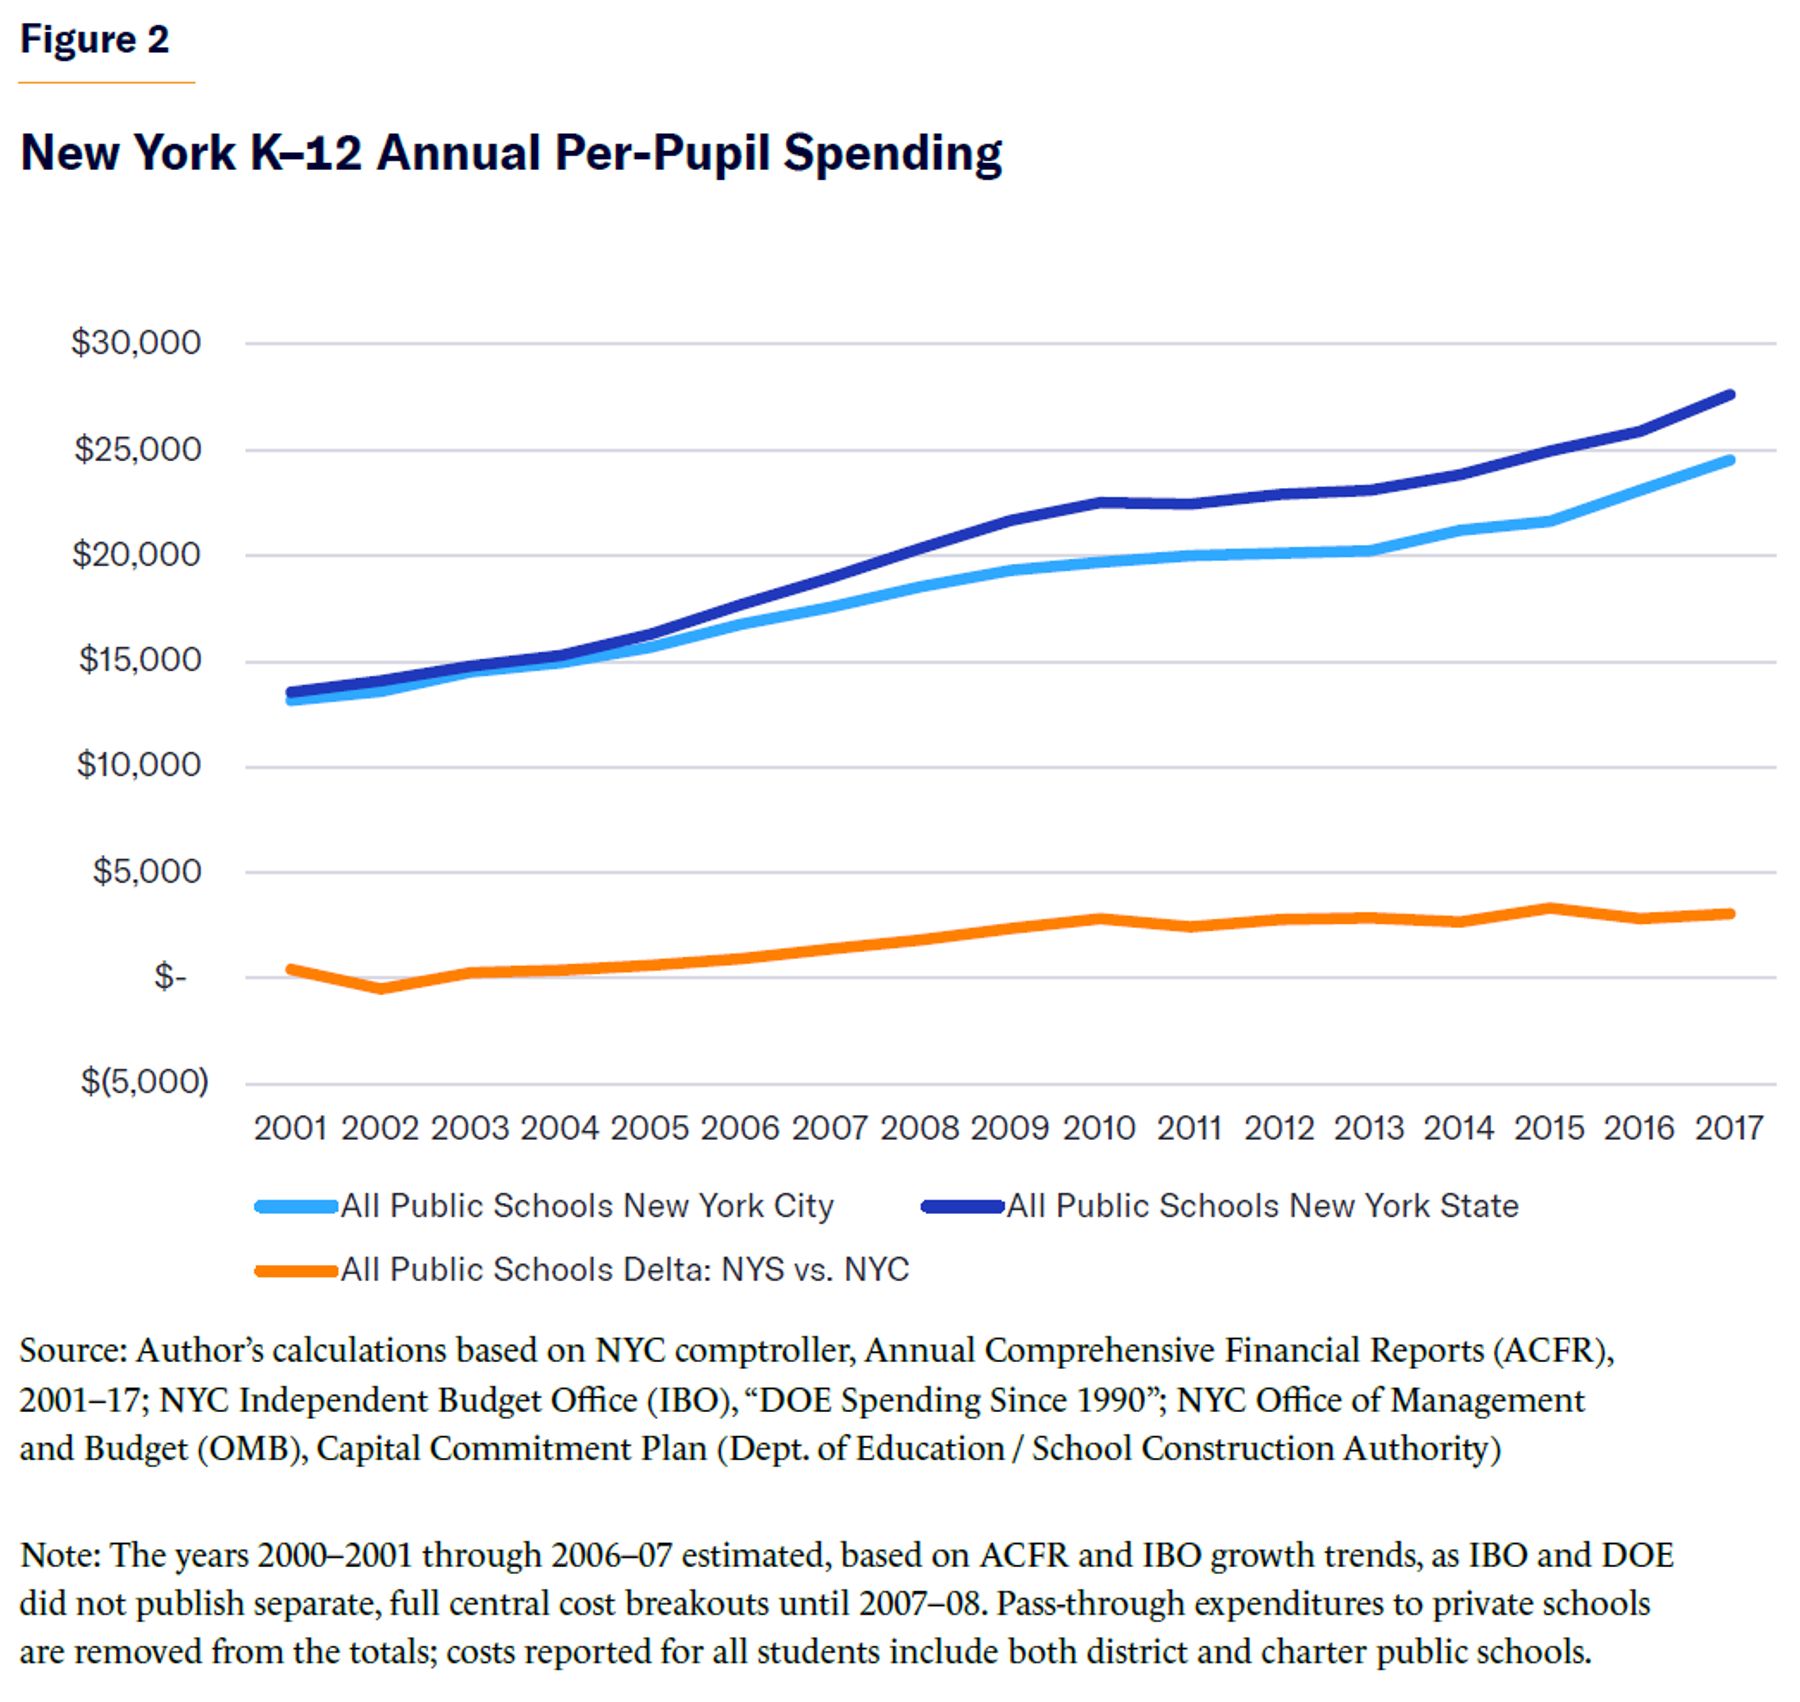
One type of information that is available is annual per-pupil spending (PPS), which can be regularly obtained or calculated for local school districts (and sometimes individual schools) on city, state, and national levels. Total budget information—PPS multiplied by total enrollment—is similarly available. These metrics can be valuable: they can provide insight into changes and trends over time and can allow for comparisons between educational districts or between education and other goods and services. Figure 2 shows annual PPS for New York schools.
However, PPS fails to capture academic outcomes, limiting its utility as an analytical tool. Imagine assessing a company by its operating costs alone rather than its top and bottom lines. Per-pupil expenditures can tell what a system costs but says nothing about what it delivers. Picture two public schools, similar in location and student body profile: if school A spends 1.5 times as much as school B, but school A enjoys a 90% four-year college acceptance rate, compared with 70% for school B, which institution is more effective and represents the better “investment”? Conversely, if school B not only spent less but also achieved better academic outcomes, then the simple spending metric alone would dramatically understate its true value.
However, a focus purely on academic outcomes absent economic context is also flawed. Few would consider two schools to be of equal value if they produce the same academic results, but one does so for $15,000 per student per year, while the other spends $30,000.
In sum, two types of measures have been widely but discretely employed to assess various educational models: PPS; and academic achievement metrics such as standardized test results, GPAs, high school graduation rates, and higher-education outcomes. Each of these types of information can be helpful on its own; but unless they are integrated together, they are incomplete, limited in scope, and potentially misleading. Consequently, the true value of various educational models may be over/underestimated or significantly misunderstood by stakeholders and the general public.
The implications and limitations inherent to current educational evaluation and oversight practices and the pressing need for viable alternatives assume even greater urgency today, when considering the current state of the nation’s K–12 educational system and other trends well beyond the classroom that are gathering political momentum:
- The 2024 National Assessment of Educational Progress—known as the “Nation’s Report Card”… shows 12th-graders’ performance slipping to a record low.… The proportion of students at the 10th and 25th percentiles has fallen to historical lows, widening the gap between the highest- and lowest-achieving students and leaving many unprepared for life after high school” (emphasis added).[12]
- Nearly two-thirds of New York City’s approximately 1,600 public schools reported fewer students than budgeted for 2025–26. In the past, those schools would have had to return over $250 million to the city. But those funds will now stay with schools, per a November 2025 announcement from the city’s school chancellor.[13] By way of context, $250 million is more than the recent year’s total operating expenditures for various leading K–12 systems, including:
- Noble Network of Charter Schools: Chicago, 17 campuses, 12,000+ students (2024)
- Yes Prep Public Schools: Houston, 21 schools, 17,000+ students (2023)
- Cristo Rey Network: National, 39 schools, 12,000 students (2023)
In his November 2025 victory speech, recently inaugurated New York City mayor Zohran Mamdani boldly asserted,“We will prove that there is no problem too large for government to solve and no concern too small for it to care about.” Before committing to such breathtaking ambition, it would seem rational—indeed, obligatory—to conclusively determine how well that same government has addressed the challenge of K–12 education, which is arguably the most important, and inarguably the most expensive, function for which it has retained primary responsibility for well over a century.
Educational Return on Investment (EROI)
To capture the performance and value of K–12 educational systems, we need a straightforward framework that integrates economic efficiency with academic effectiveness and yields reliable, insightful, and ultimately actionable results.
In business operations, corporate finance, and investment management, return on investment (ROI) analysis measures the amount of return on a particular investment compared with required expenditures. Expressed as a percentage, ROI is calculated by dividing an investment’s net profit (or loss) by its initial cost or outlay. It can be used to evaluate the profitability of a product line, business, or financial investment and to compare alternative investment opportunities and rank various projects or assets.
With one critical difference, the basic premise behind ROI (and similar financial ratios) can be applied in an educational context to integrate both the economic investment (i.e., PPS) and the return (i.e., specific student performance indicators). An approach based on ROI can be used to produce a series of straightforward metrics to track, compare, and assess academic performance and economic efficiency.
ROI in an educational context differs from ROI in business in one key way: in education, the return variable is generally nonfinancial, measured by academic outcomes such as standardized test results and high school or college completion rates.
A primary benefit of the EROI framework is that—as long as the data are available—there is no real limit on what types of performance indicators can be incorporated into the methodology. Variables included could easily extend well beyond the purely academic, including both hard and soft factors (e.g., students’ adult earnings, taxes contributed, governmental expenditures “saved,” family formation, career and life satisfaction).
There have been efforts to apply a cost-benefit approach to higher education, comparing the financial benefits of a degree with the cost to the individual student. Specifically, the Foundation for Research on Equal Opportunity (FREOPP) has estimated the ROI of higher education, by calculating the incremental lifetime earnings that students with a particular postsecondary credential can expect after deducting the cost of that program, while also estimating how much the student would have otherwise earned, absent that credential.[14] But this report aims to assess ROI in elementary and secondary education that flows not only to individual students but also to society more broadly, including taxpayers, policymakers, educators, families, and benefactors.
Educational Return on Investment Framework
The objective of this report is to measure, assess, and communicate the combined economic efficiency and educational effectiveness of various K–12 educational models and systems via a new framework—EROI—in order to enhance stakeholder understanding and decision-making.
To present comprehensive and objective results, compensate for limitations in data availability, and account for differences among educational models, this report presents a multi-variate, multi-scenario analysis using the EROI framework, which integrates academic performance results with the financial expenditures made to achieve those outcomes.
The EROI framework encompasses two categories of statistical metrics that serve as value-added indicators of overall educational ROI:
- Spending per academic performance indicator: Expressed as a dollar amount, this metric is computed similarly to PPS. It measures the cumulative dollar amount expended by a school, district, or network over a 13-year period (K–12) to achieve specific baseline or target objectives for a single student. (No postsecondary, higher-education expenditures are included in this calculation and its output.) Unlike PPS, however, which is a function of primary and secondary school enrollment, these metrics incorporate actual academic performance, as reflected by specific key success indicators, to yield straightforward measures of institutional performance. These metrics are further broken down to capture the cumulative expenditures required to matriculate, enroll, persist, or graduate a single student from elementary school through high school or college:
- Spending per high school student (including enrollment attrition)
- Spending per high school graduate
- Spending per college enrollee
- Spending per college graduate
- Academic performance indicator multiple: Expressed as a multiple (or fraction, depending on results), this metric assumes a fixed expenditure amount and then measures the success or completion rate of a specific educational organization/cohort relative to another system/ cohort, or to a single baseline rate. We calculate the college completion rates of various New York–based educational systems and cohorts, relative to others, to produce a simple college graduation multiple (CGM). If school network A boasts a graduation rate twice that of school district B, then the CGM of the charter school network is 2.0 relative to the school district, i.e., for the amount that it costs the school district to graduate one student from college, the charter school network is able to graduate two. Again, assuming data availability, this approach can be used with many other performance indicators.
Cohorts and Academic Performance Indicators Studied
The analysis in this report is based on:
- Five educational segments: High school graduating classes of 2013–17, incorporating the first cohort’s kindergarten year (2001) through six years post–high school of the 2017 class (2023)
- Three educational models: All public schools, non-charter (i.e., district) public schools, and select parochial schools
- Two geographic regions: New York City and New York State
- Two economic cohorts: All students and a low-income segment of students
- Two academic tracks: General education and special education
- Two matriculation periods: Primary and secondary (K–12) and secondary only (9–12)
To measure academic performance, the analysis uses:
- High school persistence: For each of the graduating classes of 2013–17, the number of students enrolled in grades 9–12
- High school graduation: Number and rate of high school students graduated by August of their scheduled high school graduation year
- College enrollment: Number and percentage of high school students enrolled in a two- or four-year college in the fall of their scheduled high school graduation year
- College completion: Number of high school students who graduated from college within six years of scheduled high school graduation date or 10 years of ninth grade
Analytical Methodology
The spending per academic performance indicator, as well as the related indicator multiple, is a function of three variables:
- K–12 enrollment
- K–12 per pupil and total spending
- Number of students achieving the designated academic performance indicator
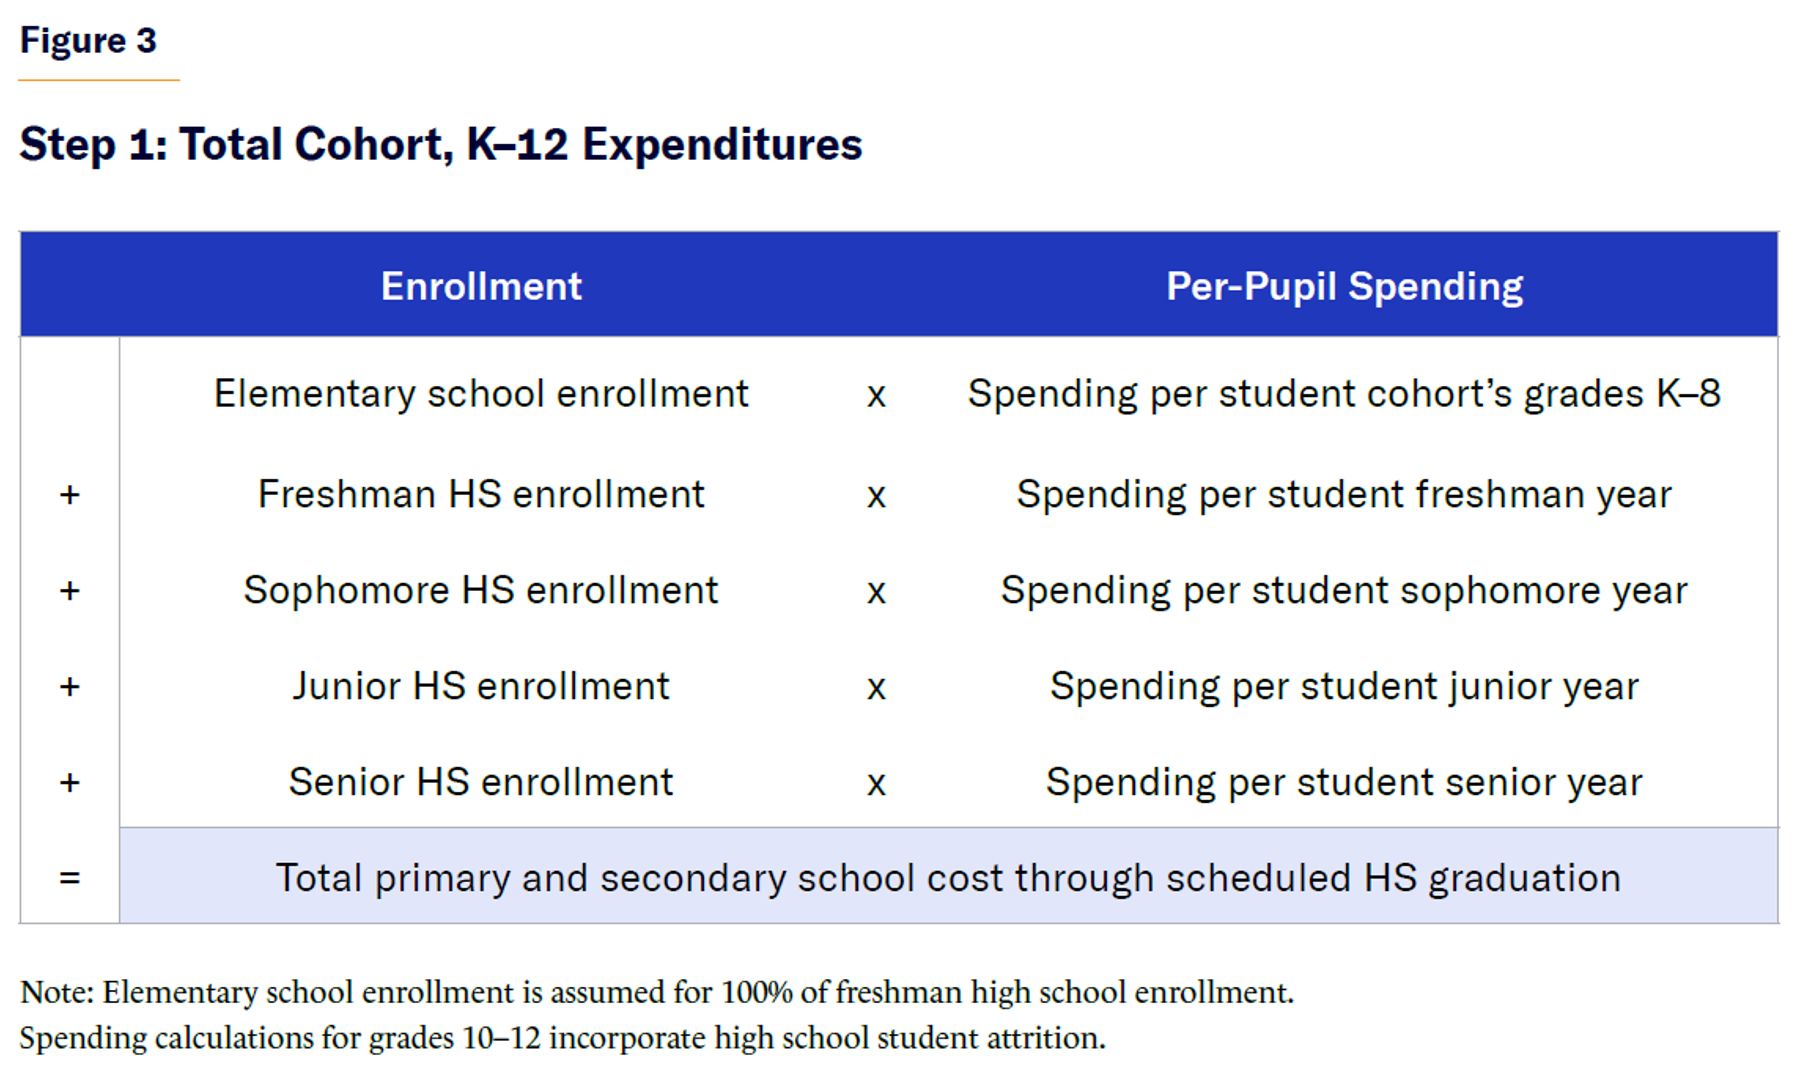
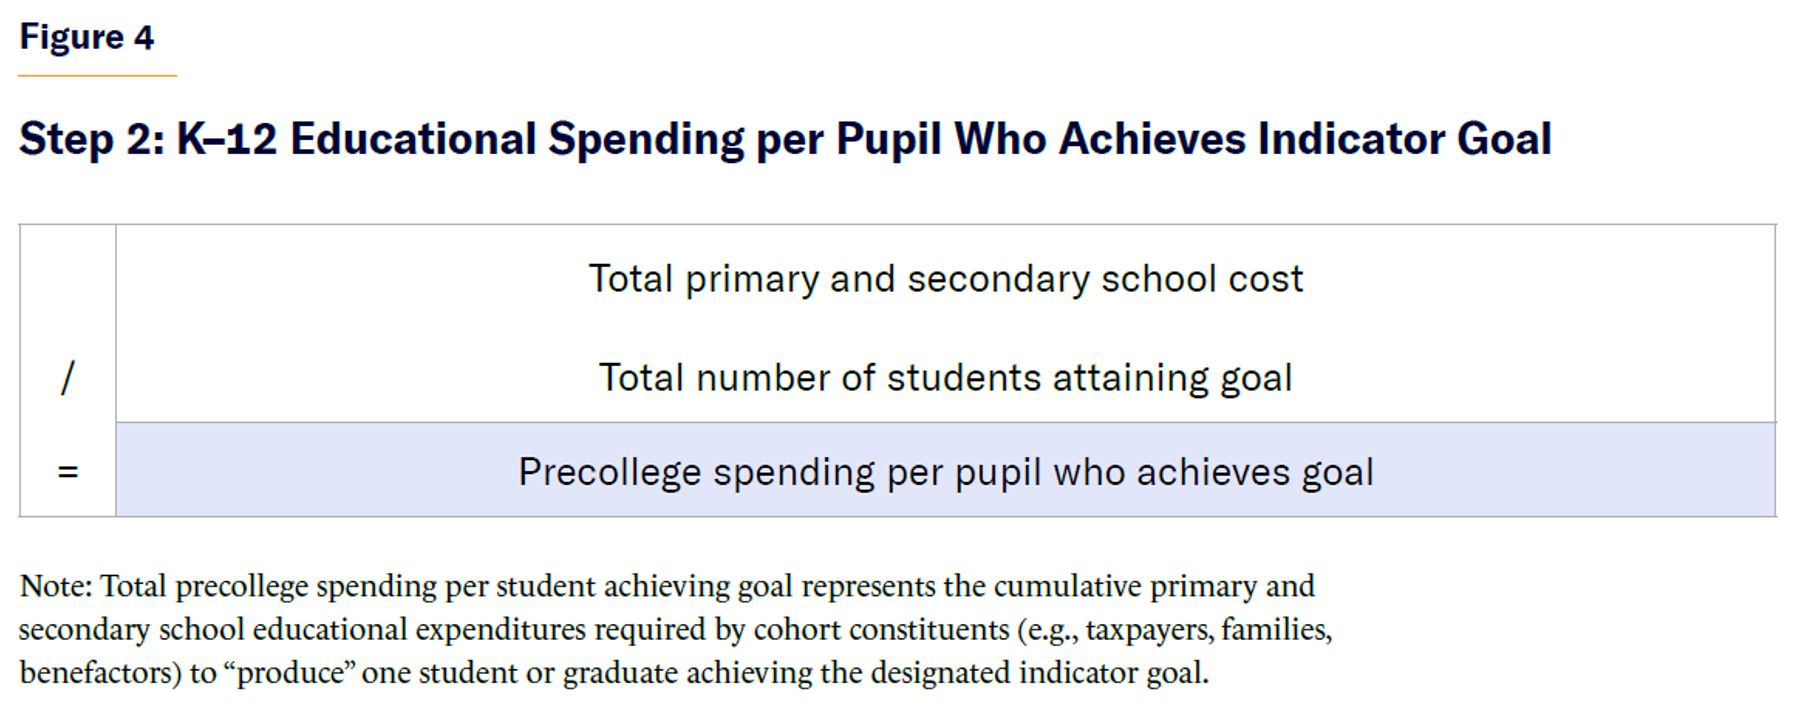
Figures 3 and 4 show the steps used to calculate these metrics.
Hypothetical Example: Per–College Graduate Spending, District A Public Schools
The methodology is demonstrated in Figures 5 and 6, which show the calculations for a hypothetical high school class graduating in 2013.
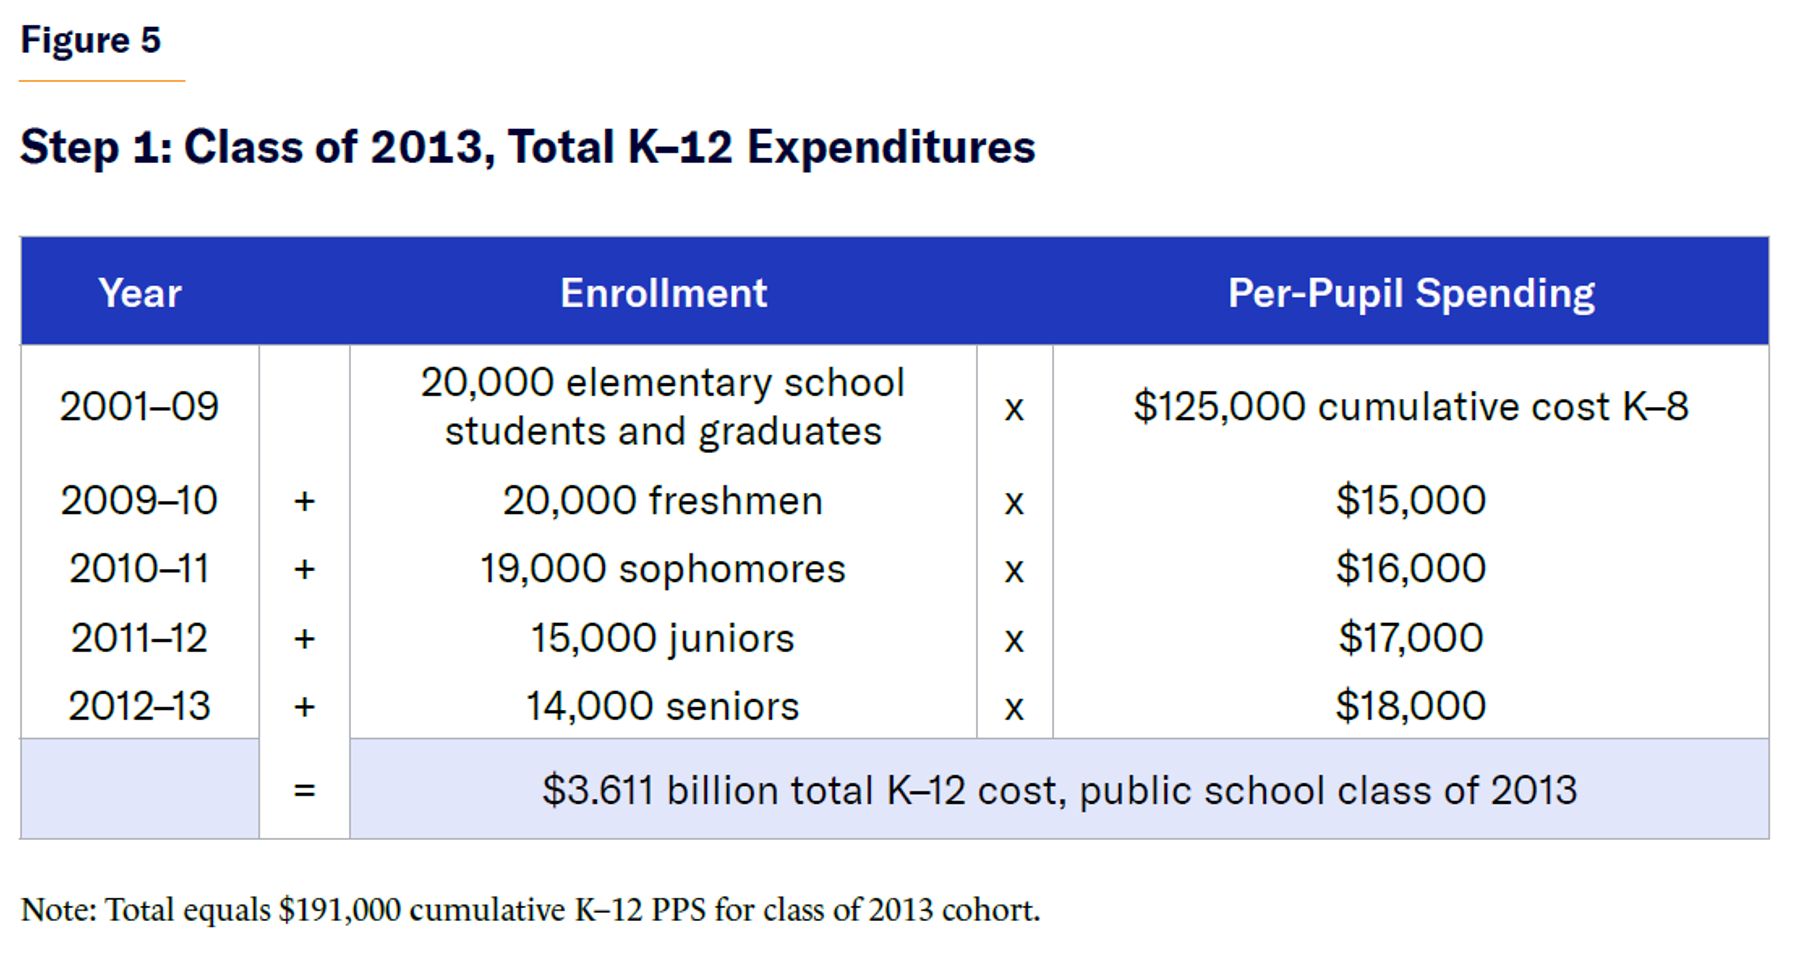
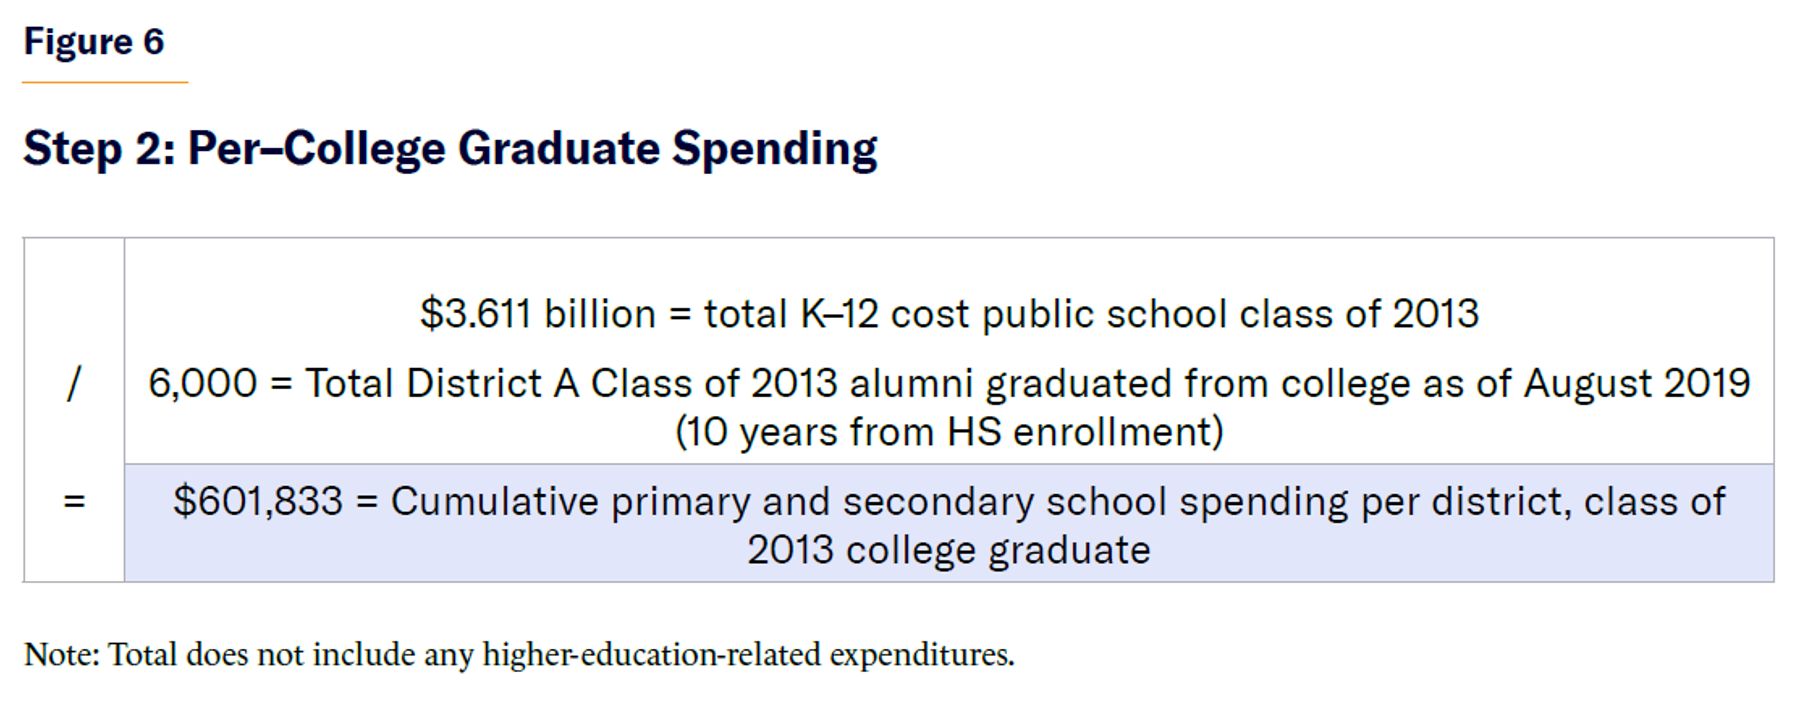
In this hypothetical case, the District A public school system spent, on average, $191,000 per student in the high school class of 2013 from kindergarten through 12th grade. However, the cost to produce a single college graduate from that class was $601,833 over that period, yielding a multiple of more than three times the PPS.
Detailed Look at One System: New York City Public Schools
Cumulative K–12 education expenditures for NYC public school students in the high school classes of 2013–17 totaled nearly $250,000 per pupil, on average, with PPS of their four-year secondary schooling alone approaching $100,000. As striking as these amounts may be, they pale in comparison with the estimates that incorporate EROI—specifically those involving high school graduation and postsecondary outcomes, as shown in Table 1 and Figure 7.
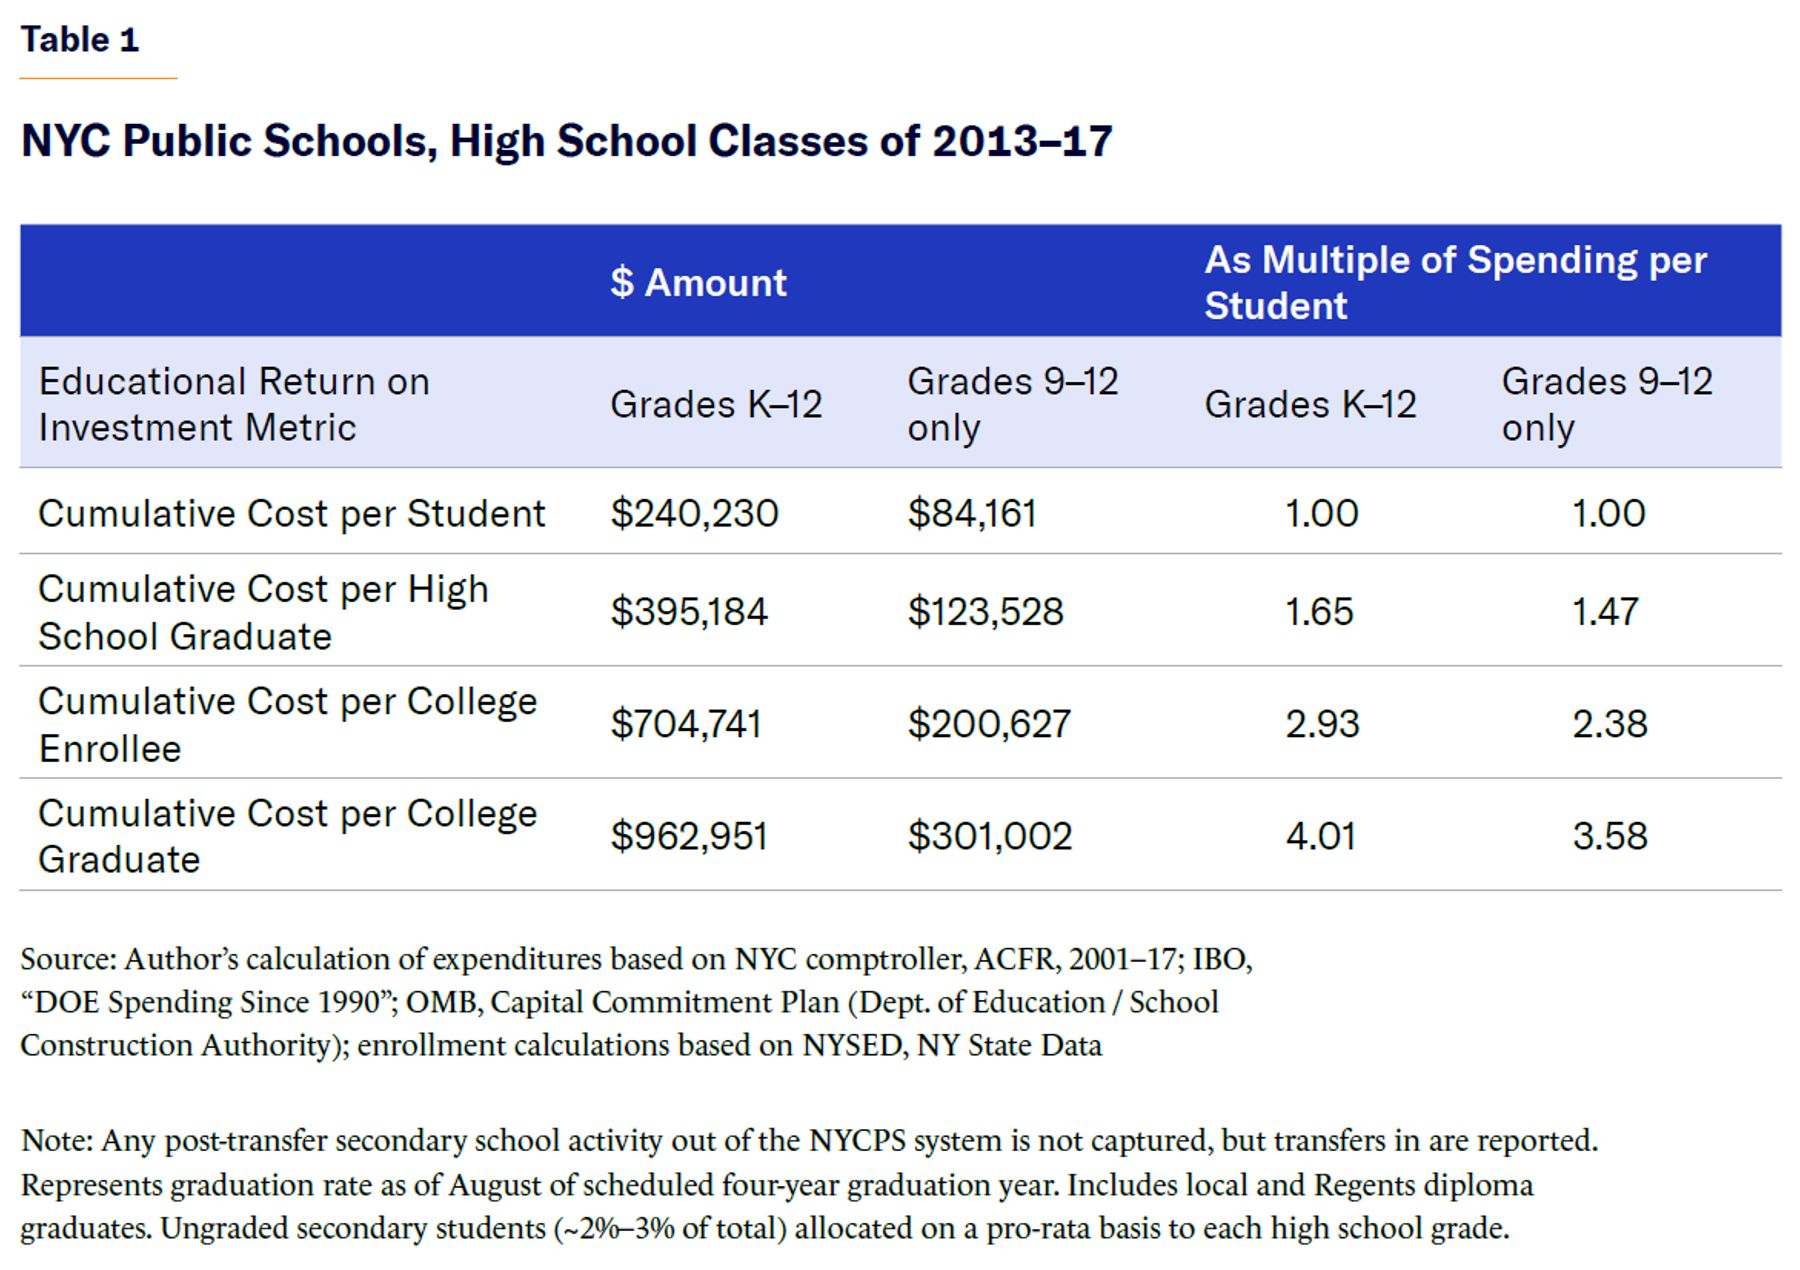
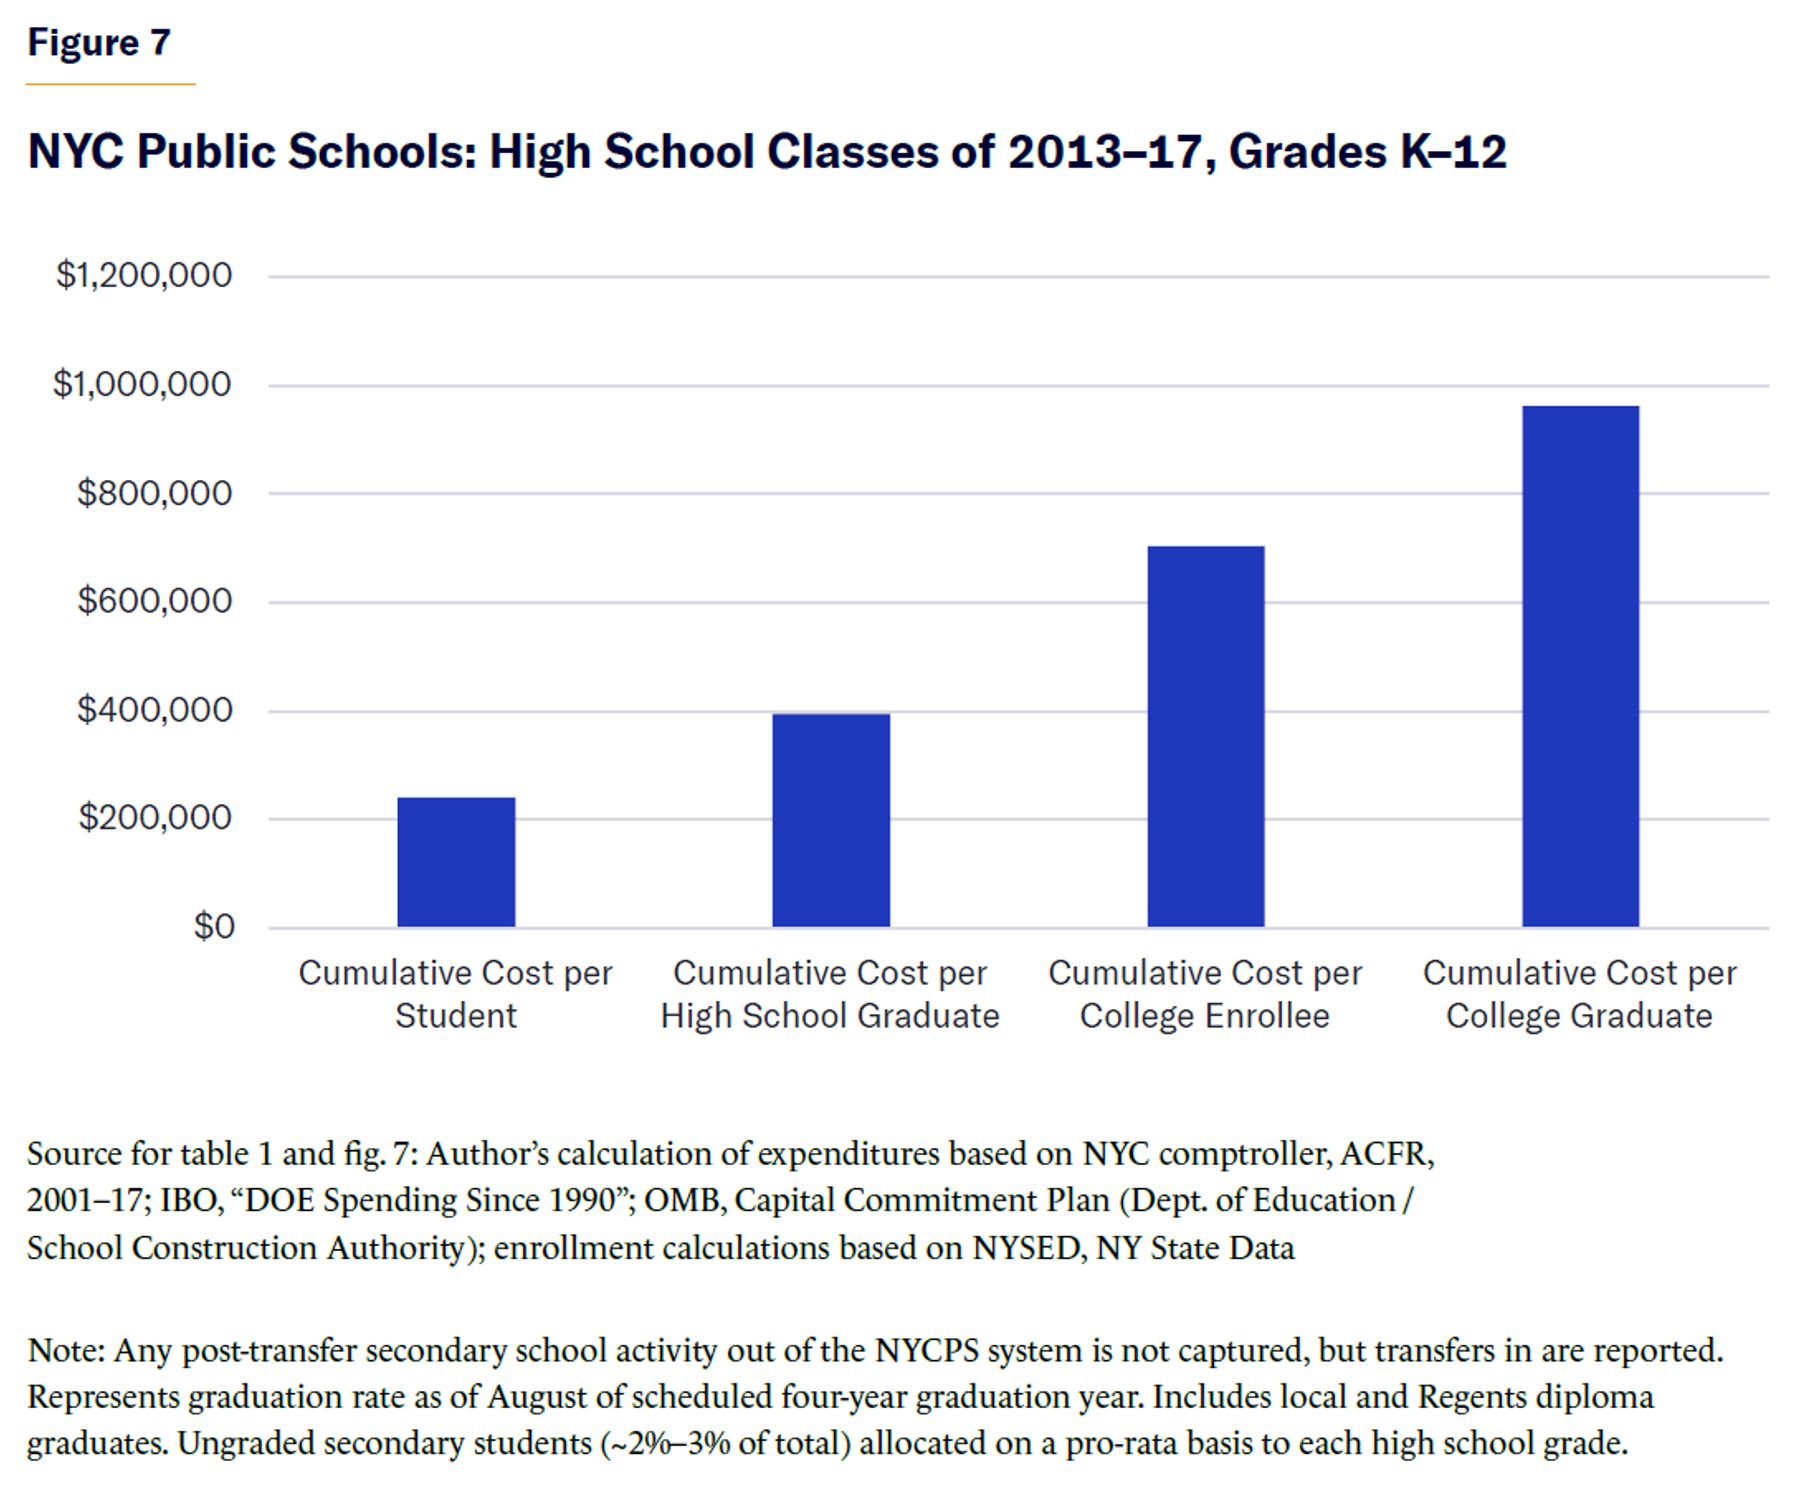
It cost $240,000, on average, to educate a student in primary and secondary public schools in NYC during this period. However, because only 57% of ninth-graders graduated high school by the August four years after their initial high school matriculation, the NYC public school system actually spent almost $400,000 to produce a single high school graduate.[15]
Given that less than a third of the high school freshmen in this period matriculated in college four years later,[16] the cost per college enrollee was over $700,000, approximately three times the cumulative PPS amount.
Only 24% of these ninth-graders went on to graduate from college within 10 years of beginning high school,[17] i.e., for every college graduate, the cost to taxpayers was nearly $1 million—four times the PPS amount.
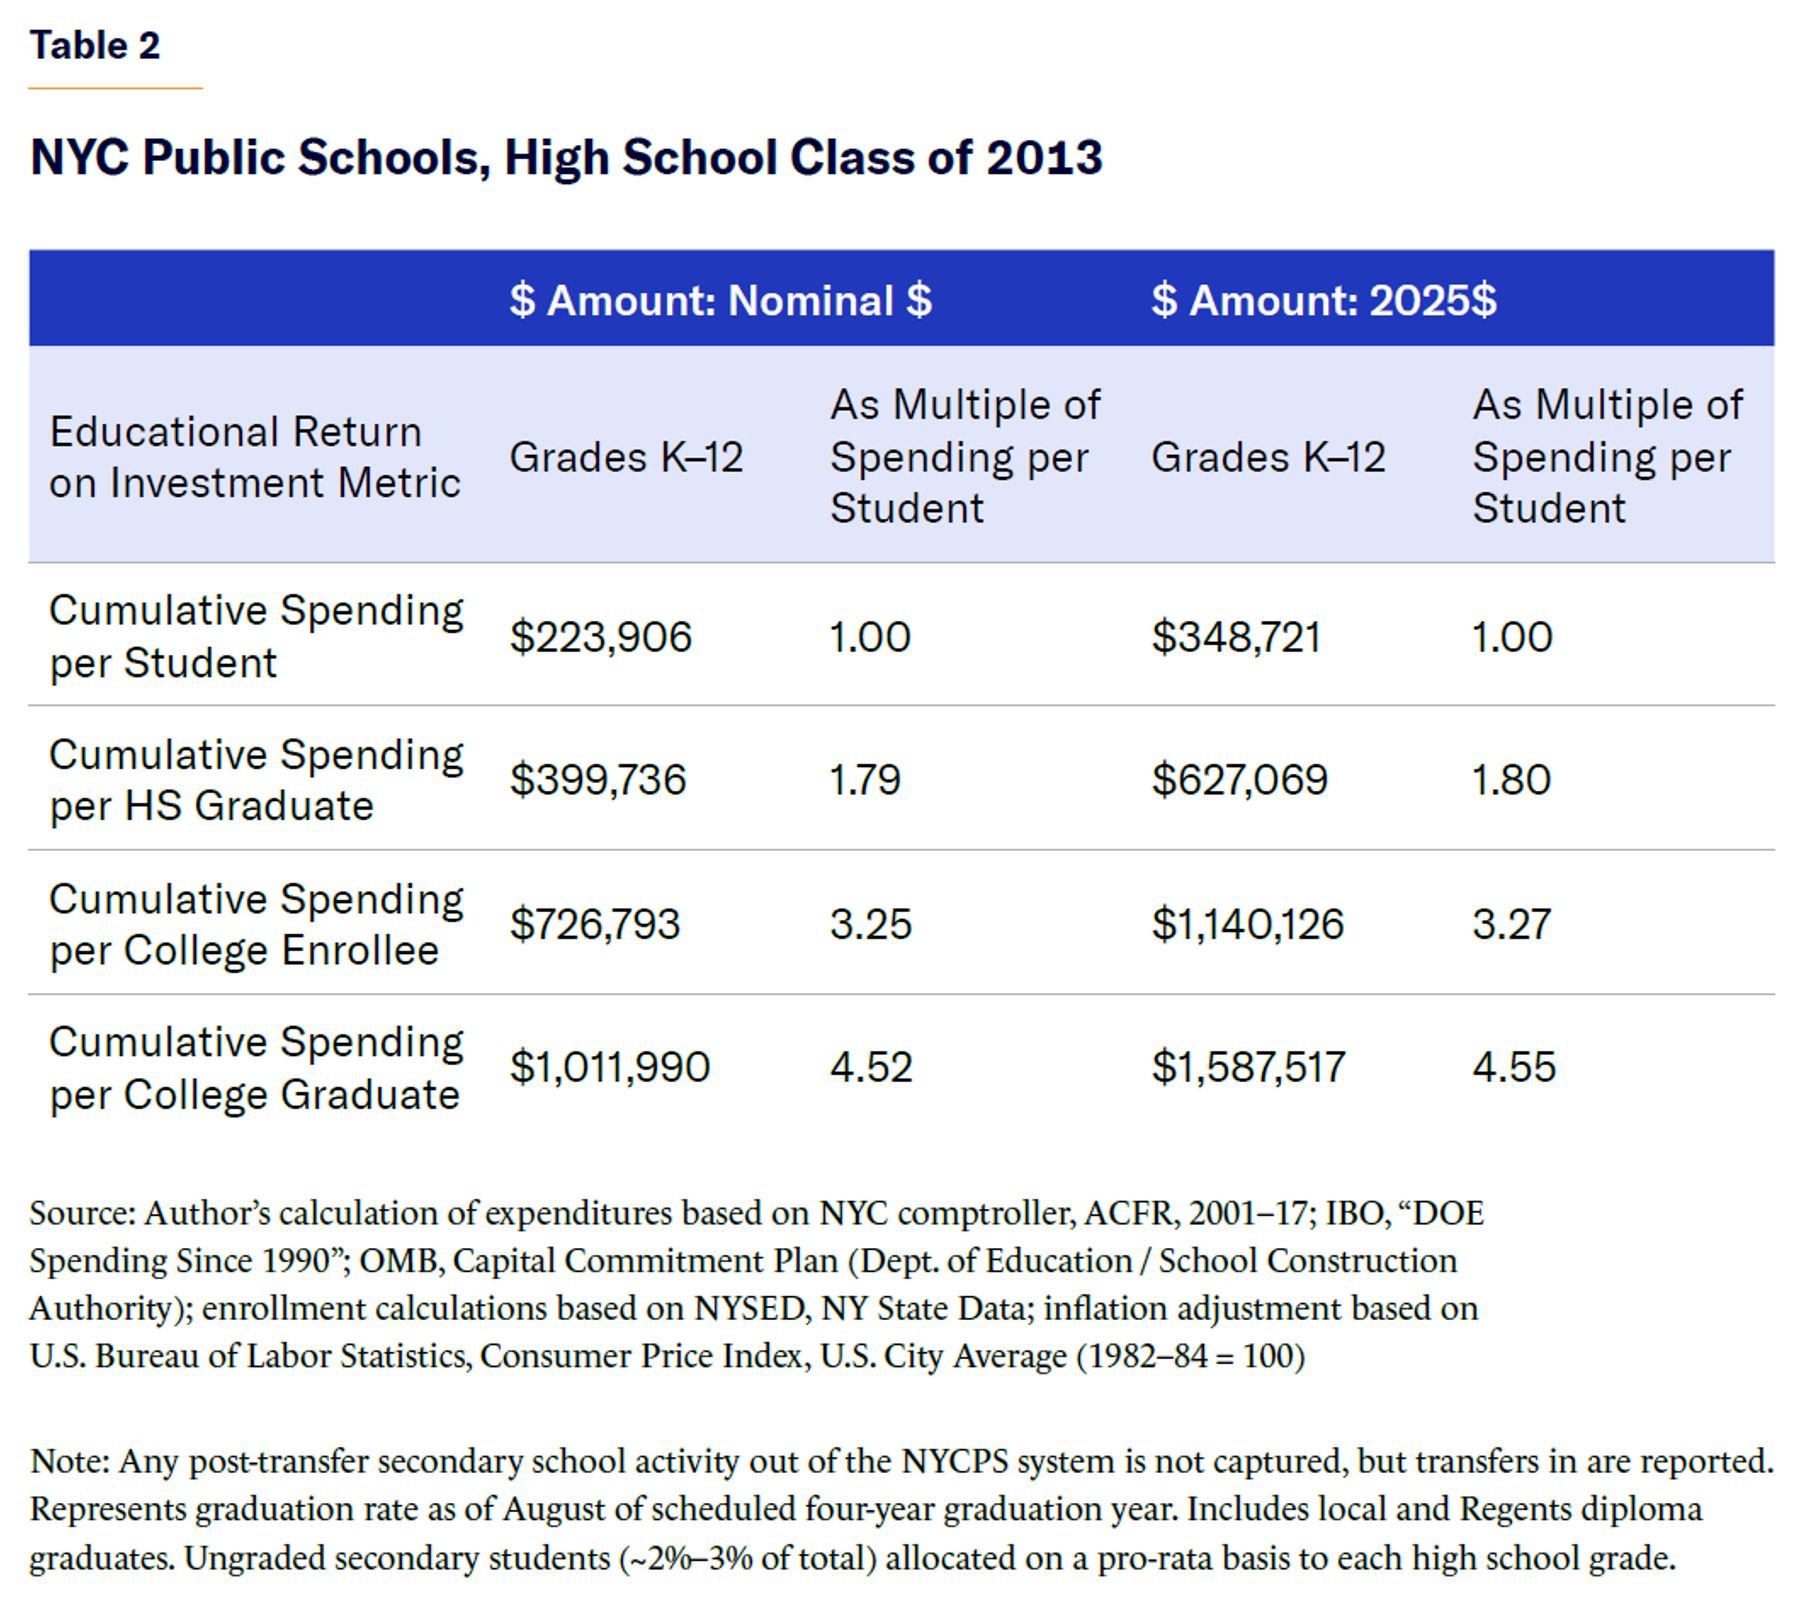
Adjusting the EROI estimates for inflation shows that, for this cohort of students, taxpayers spent nearly $700,000 per diploma and almost $1.7 million per degree, in today’s dollars (Table 2).
NYC Public Schools: A Deeper Dive
New York City has a complex public school system with a large and diverse population. It remains the largest K–12 operation in the country, even after notable enrollment declines in recent years. Therefore, to account for any unique pedagogical and economic dynamics and to facilitate apples-to-apples comparisons with other systems, the analysis above is repeated for the following segments of the school population:
- Traditional district and charter public schools
- Special-education and general-track student populations
- Low-income and all student socioeconomic segments
Charter Schools
According to the New York City Charter School Center: “Charter schools are free public schools open to all students, including students with disabilities and multilingual learners. Charter schools are independent of the New York City Department of Education, which allows them the freedom to try new approaches, respond to community needs, and put student learning first. Public charter schools are held accountable for advancing student achievement; if they do not meet their goals, a charter school can be closed.”[18]
Charter schools were barely a presence in NYC when the 2013–17 cohort began elementary school in 2001, accounting for less than 1% of public school enrollment. Even during 2013–17, charter schools accounted for only 6%–10% of enrollment (compared with approximately 15% today), and even less as a percentage of the high school population at the time.[19]
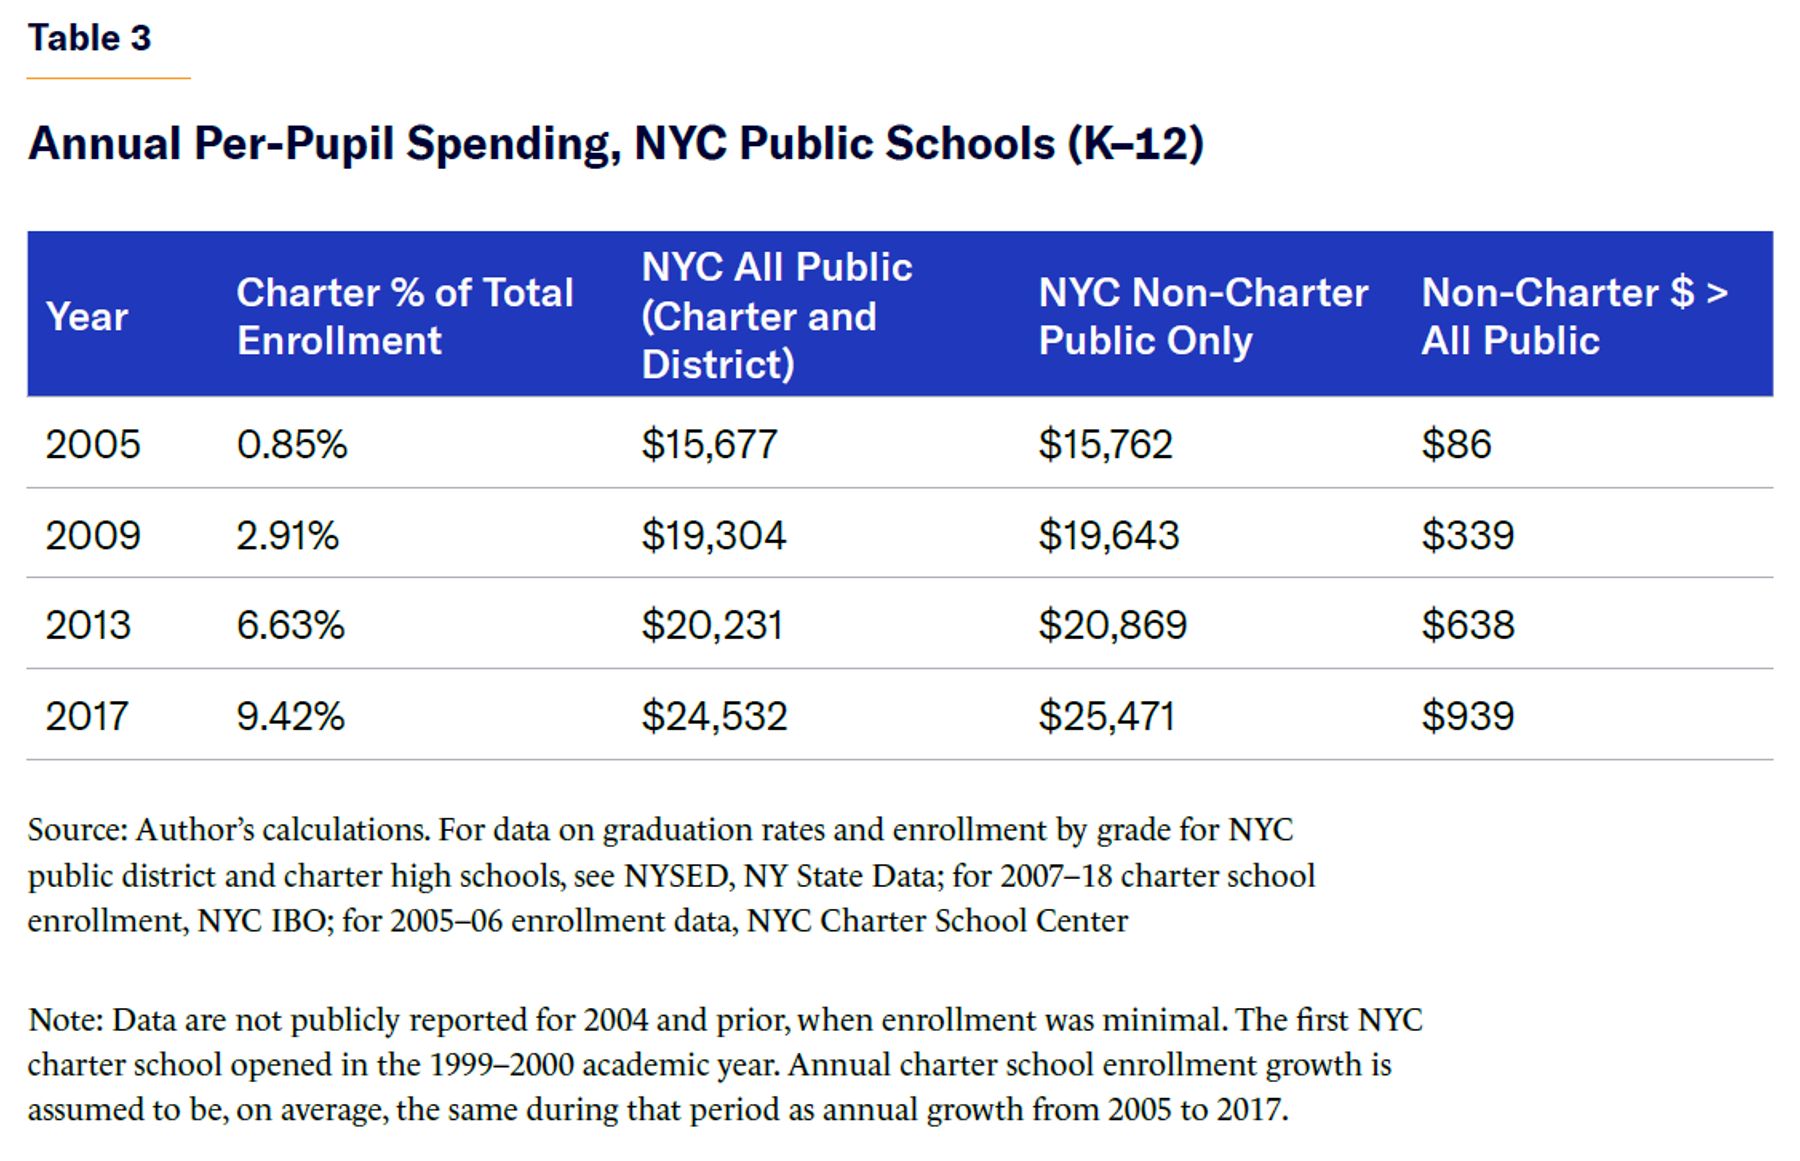
Nonetheless, separating out charter schools from the overall public school population has a noticeable effect, which begins modestly in the earlier part of the period but grows over time. Because per-pupil state and local “tuition payments” made to charter schools were (and remain) less than the outlays to district schools, traditional district school student spending is higher when measured on a stand-alone basis (Table 3).[20]
As a consequence, the disaggregated EROI outcomes for district schools alone are worse, albeit minimally, than the EROI outcomes for charter and district schools combined (Figure 8).
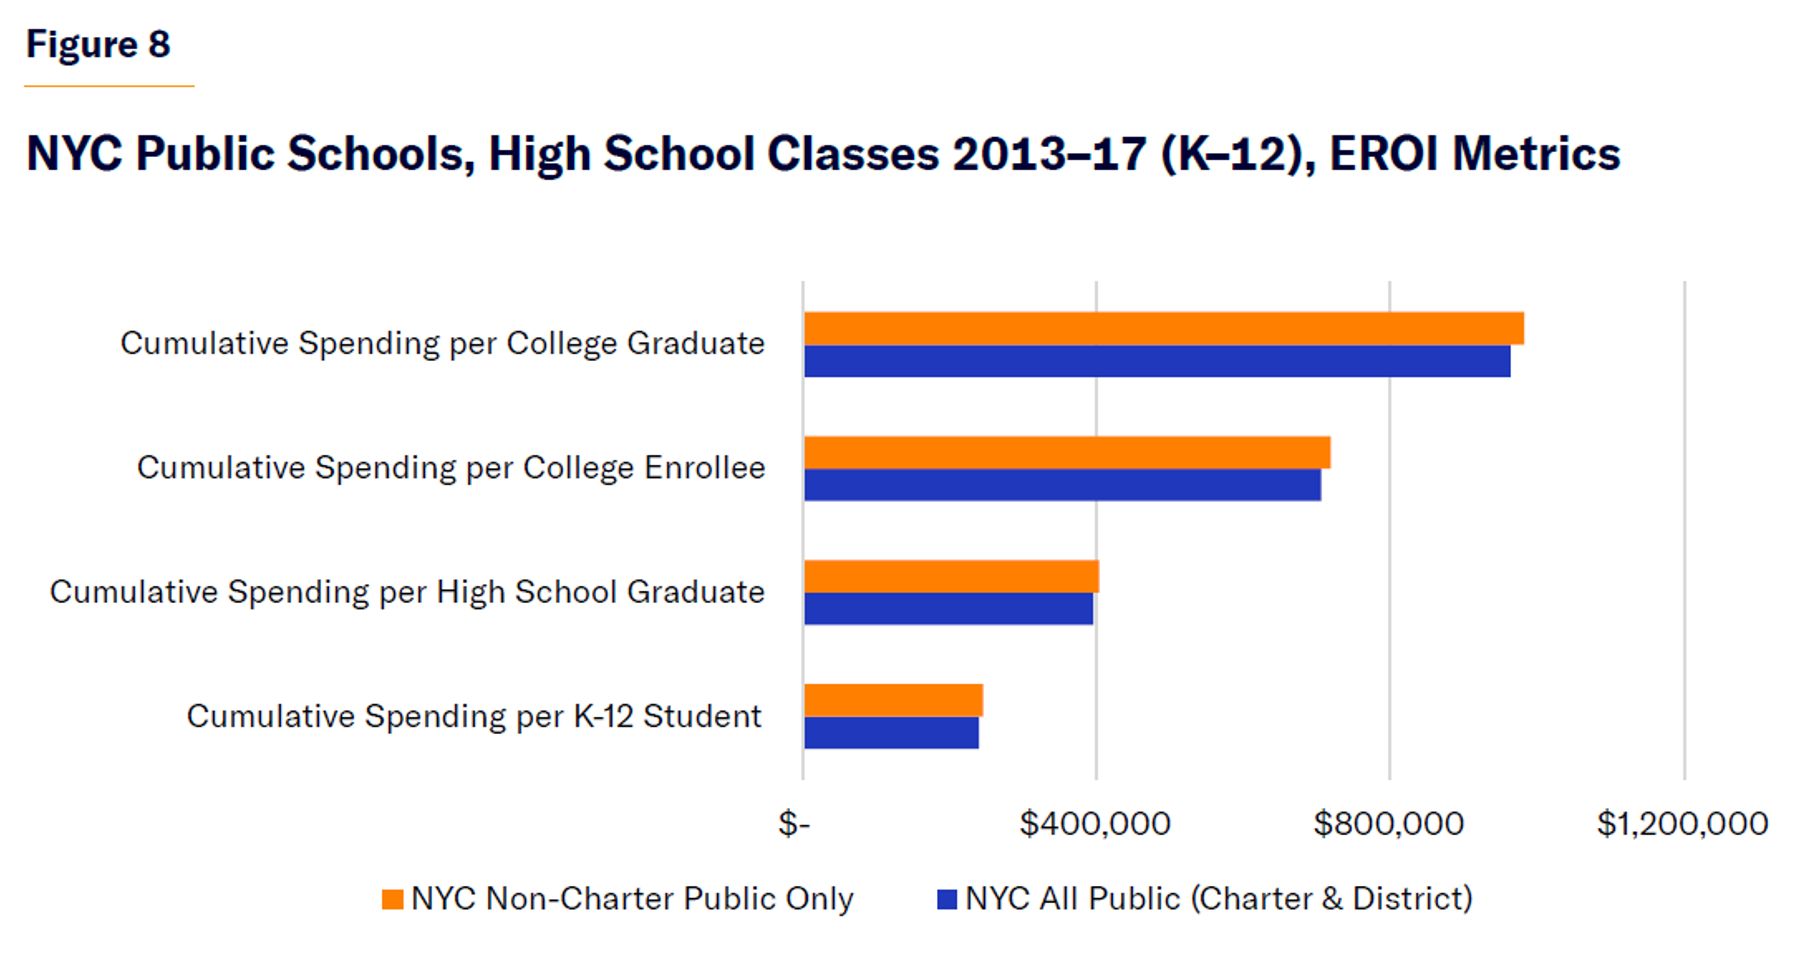
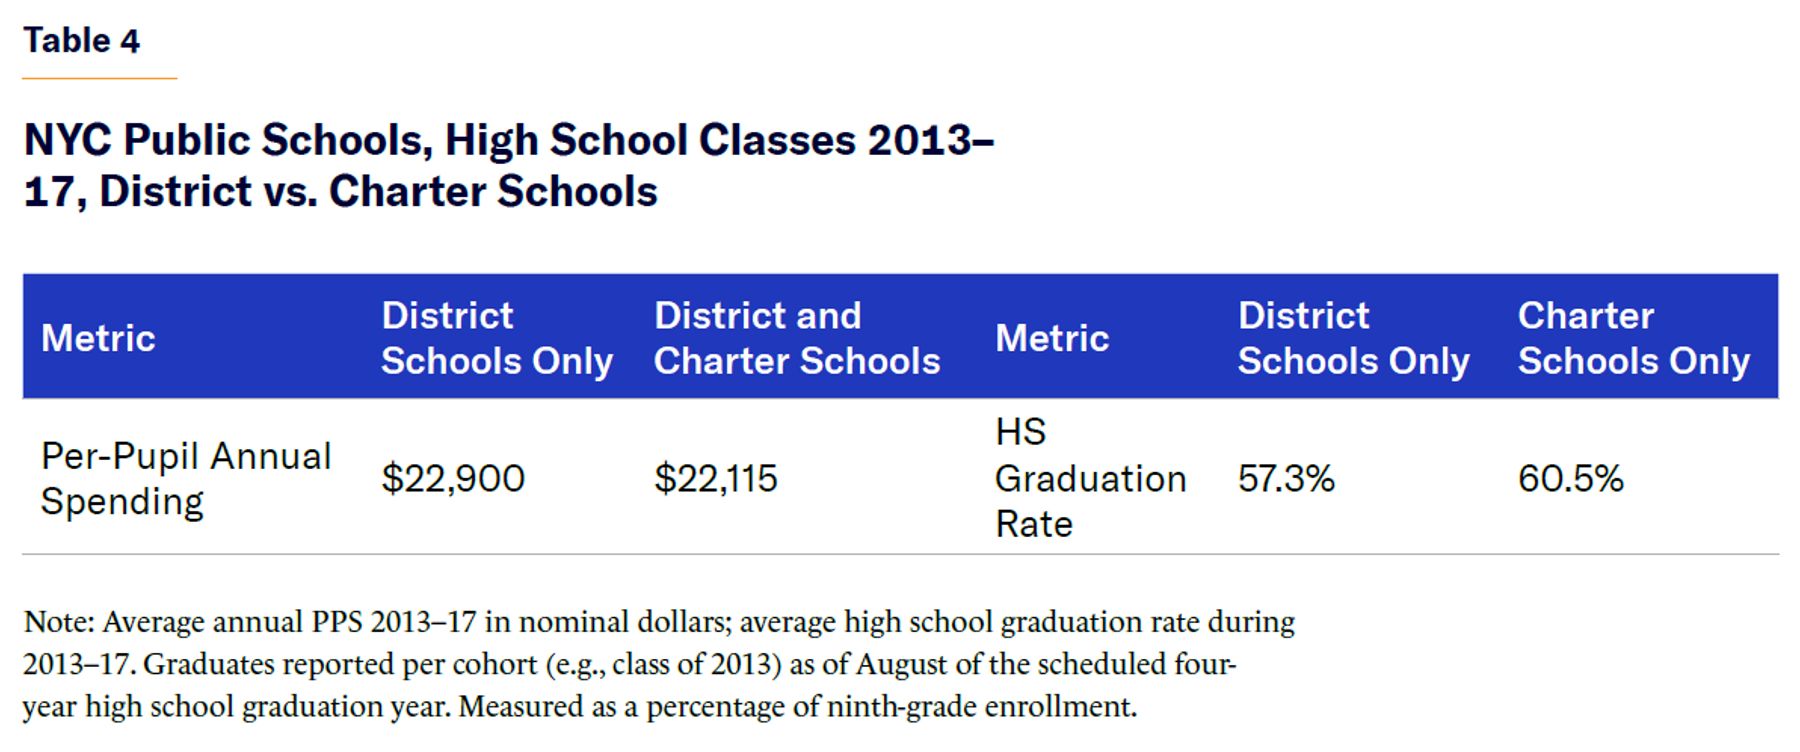
Table 4 shows the gap between district and charter schools in average annual cost and high school graduation rates for 2013–17. Given that charter schools have since grown significantly, to 15% of the total NYC public school population, these gaps have likely grown, and will continue to do so.
Special-Education Programs and Students
As defined in the Individuals with Disabilities Education Act, special education is “specially designed instruction . . . to meet the unique needs of a child with a disability.”[21] Special-education initiatives and programs run the gamut from very modest to quite intensive. They can include relatively simple accommodations—such as extended test-taking time or preferential classroom seating—as well as highly targeted curricula and tailored instruction for high-need students, often formalized via an Individualized Education Program (IEP) and conducted in self-contained classrooms with much smaller faculty–student ratios compared with general-track pupils.
Special education is distinct from general education, in terms of expenditures and academic outcomes. Additionally, charter and independent schools usually do not receive the same level of resources as district public schools to serve special-education students, especially those with more severe disabilities. As a result, district public schools tend to enroll a disproportionate share of special-education students. In NYC, during the years under study, special-education students represented 7%–14% of the total district public school student body.[22]
It is therefore useful to further disaggregate the analysis to take into account variables related to special education. Incorporating these more granular data will help make the EROI framework more applicable across multiple systems such as traditional public, charter, and independent.
Removing special-education students and expenditures from the analysis produces a modest improvement in the EROI “spending per student” results for NYC district schools during this period. The resulting reduction in EROI per-pupil costs is slightly greater than the increase in costs observed when removing charter school students from the analysis.
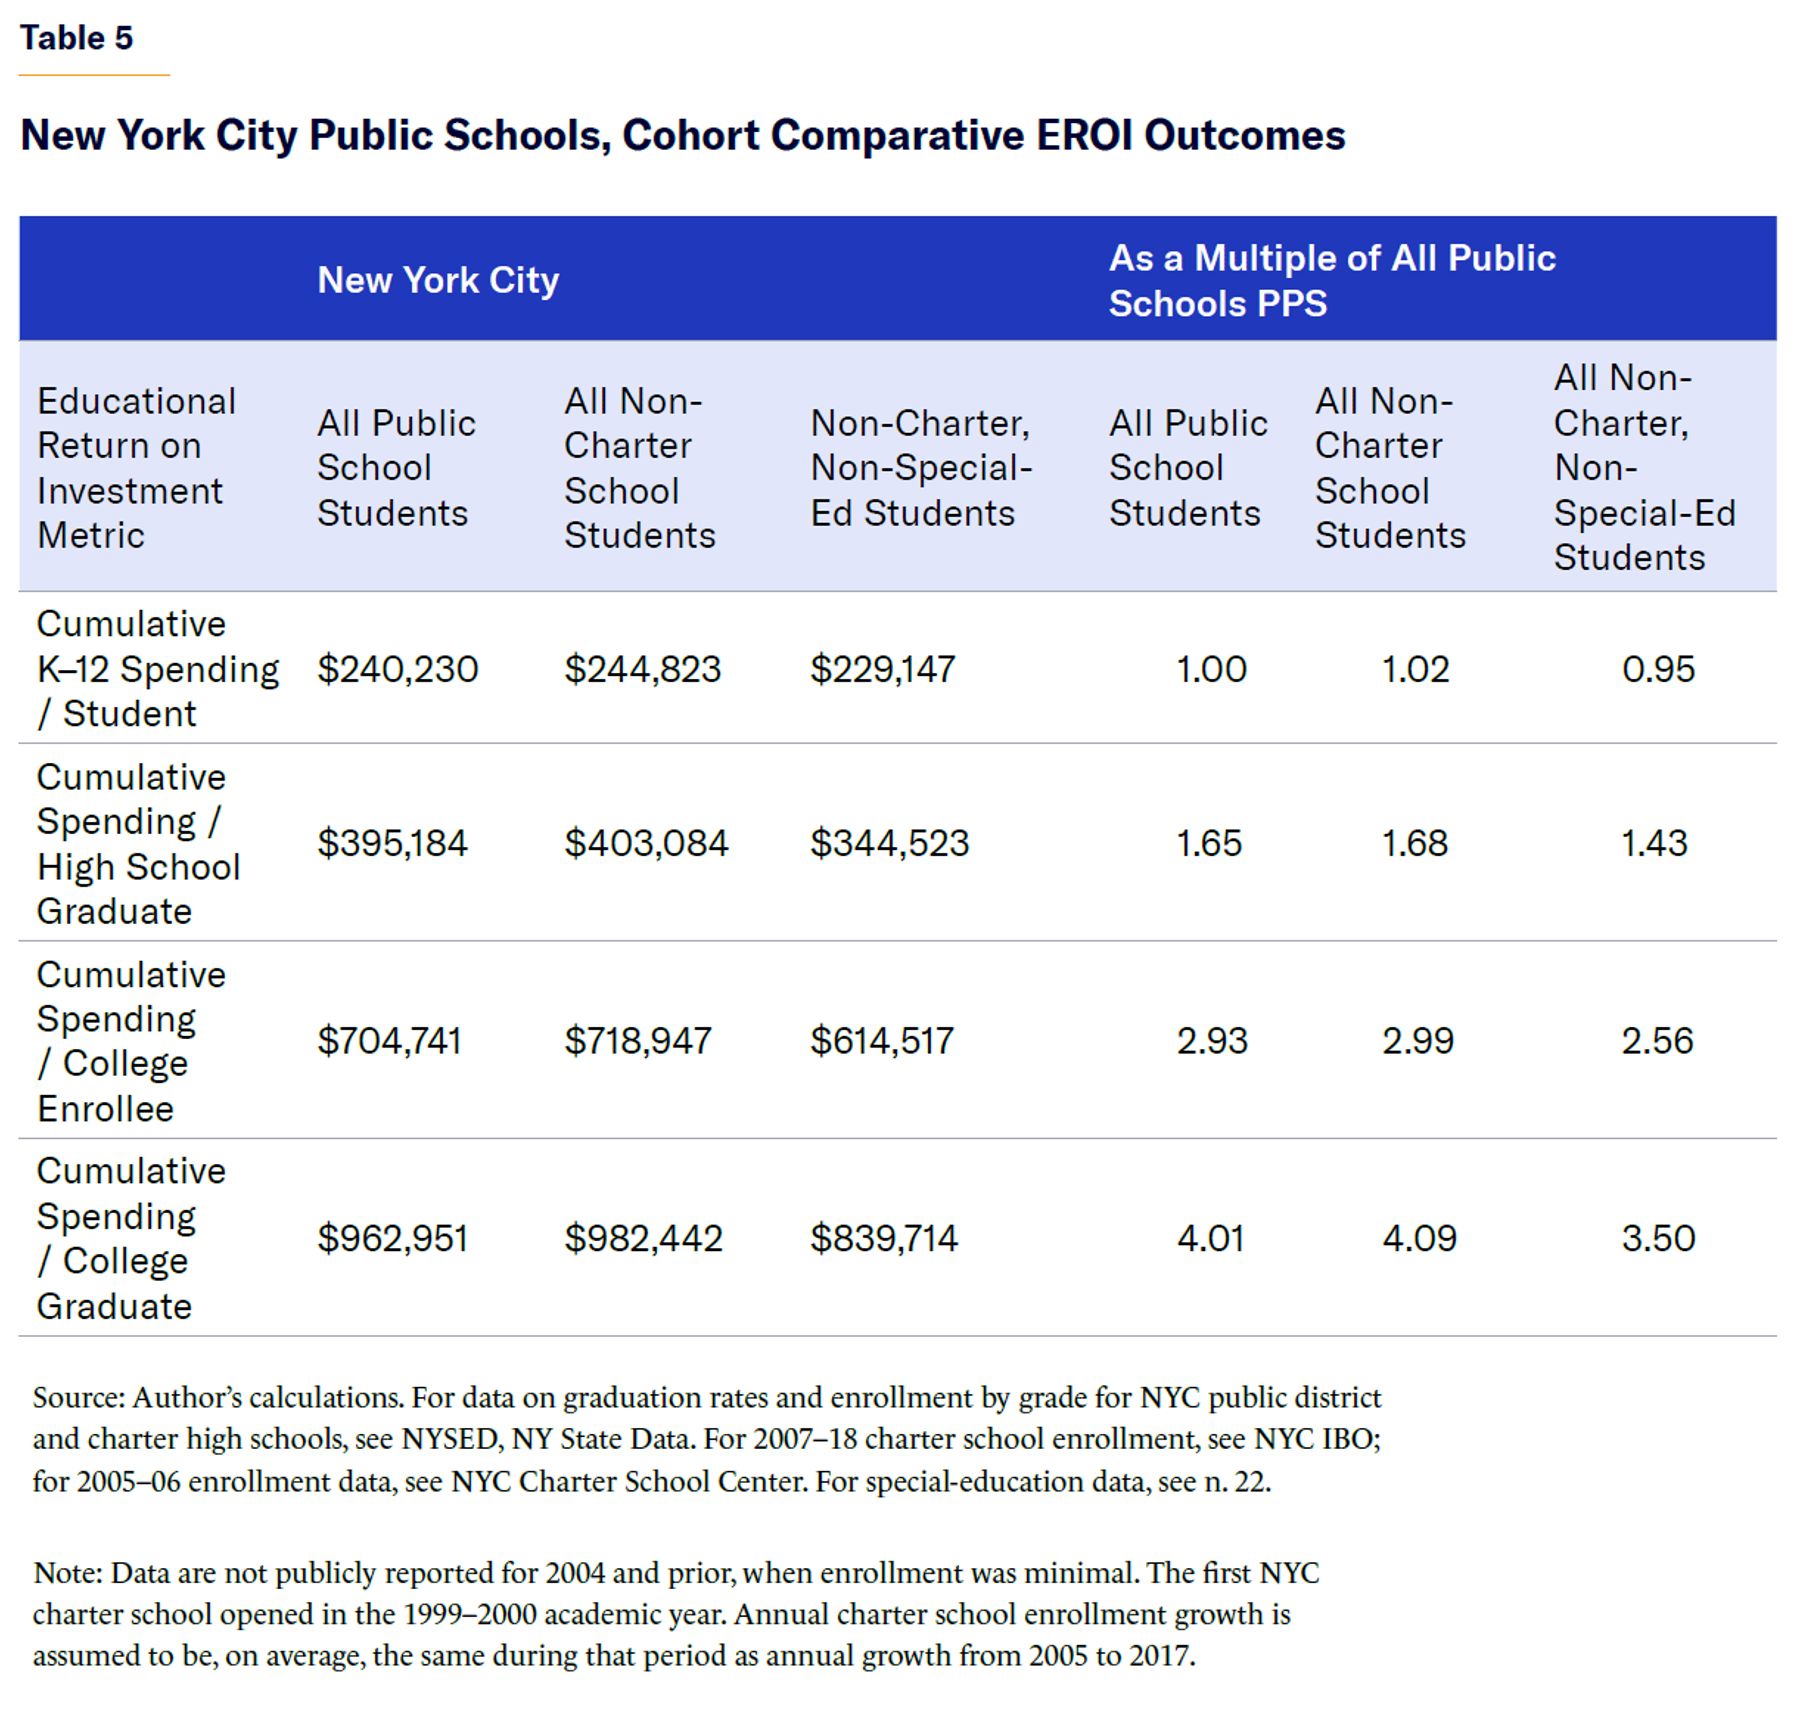
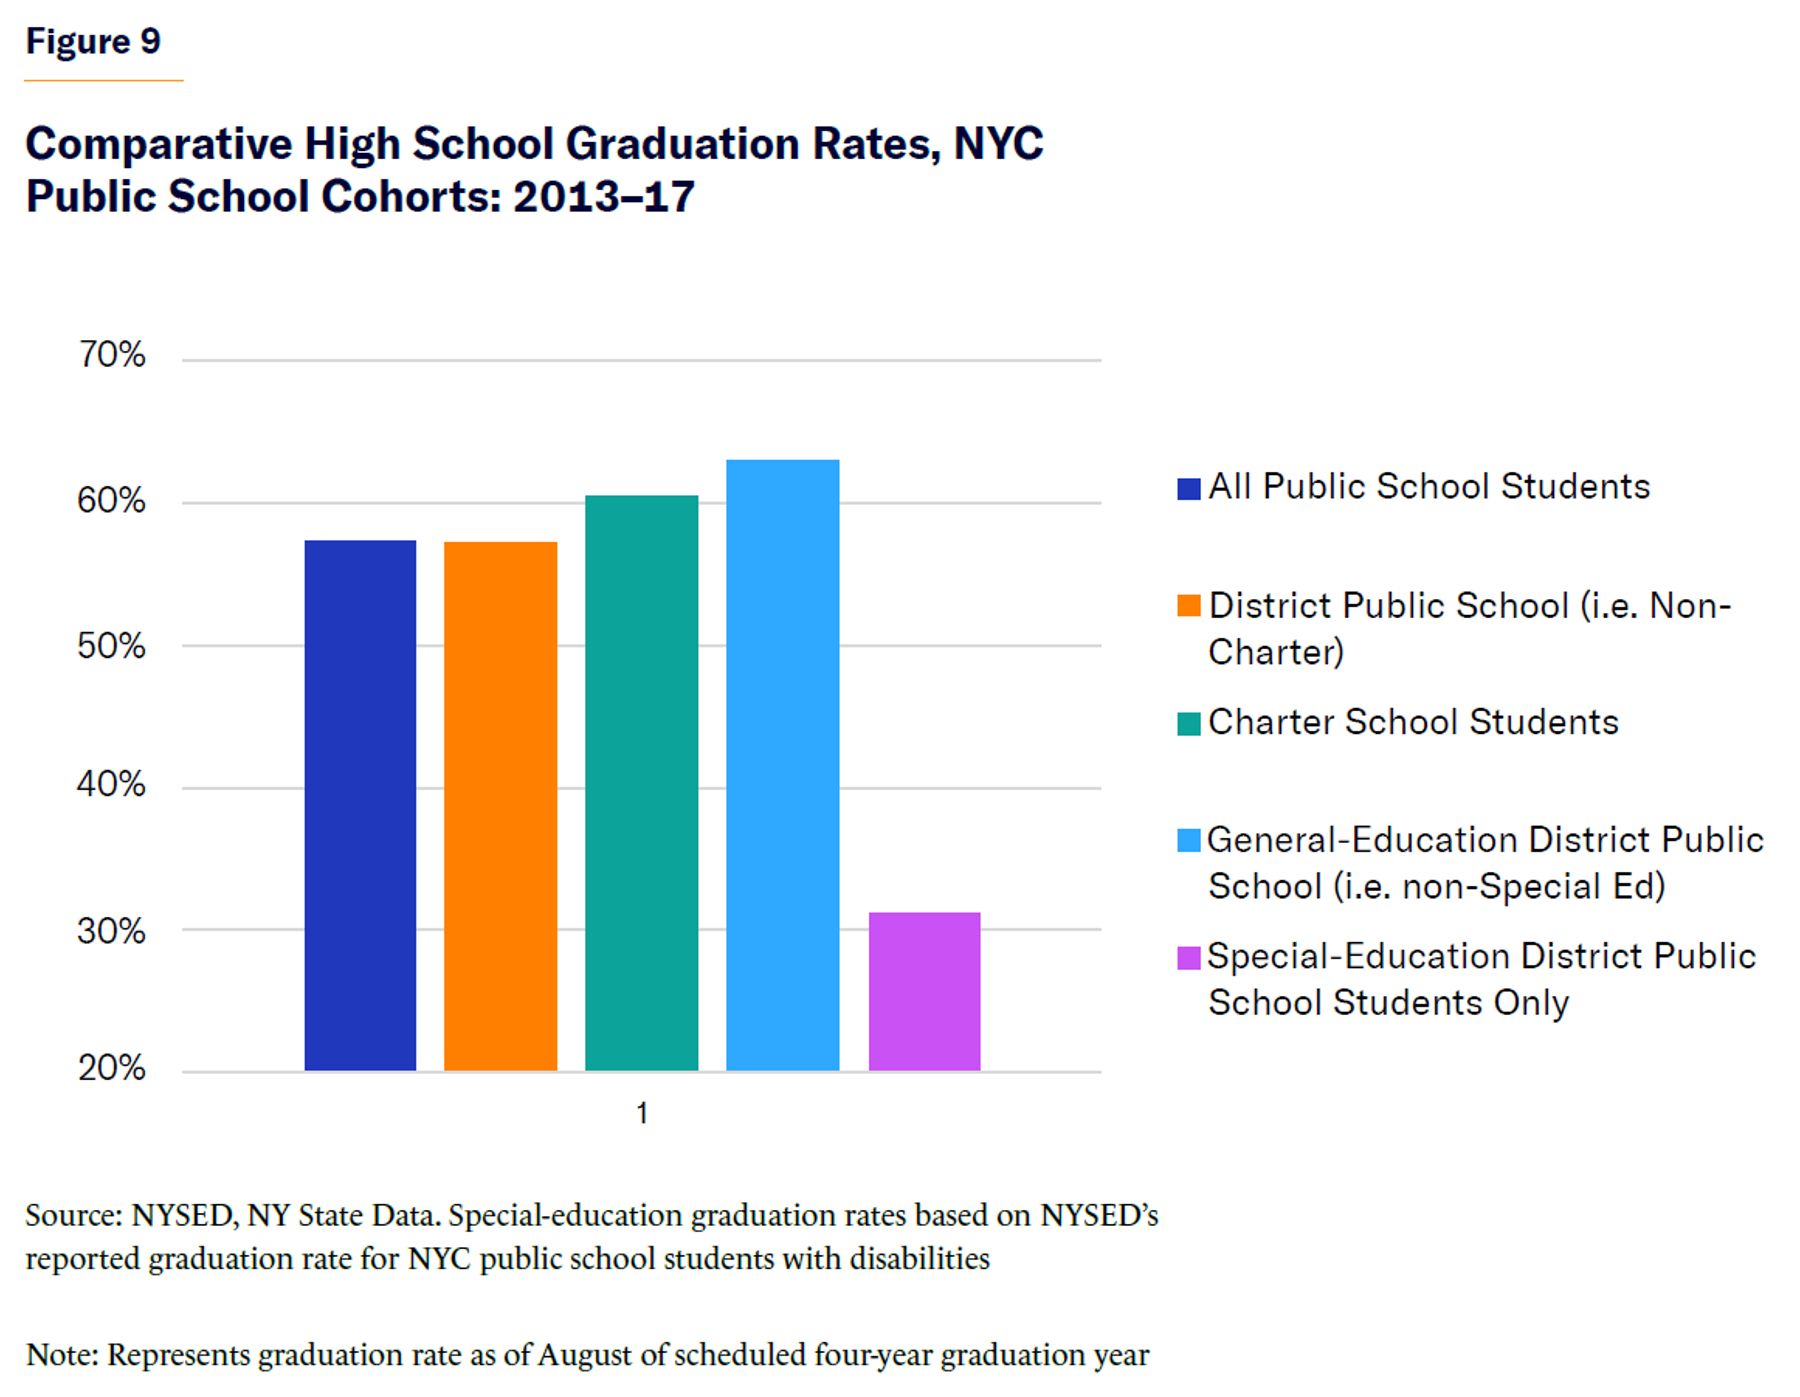
However, as shown in Table 5, the effect of removing special education from the analysis is more pronounced in EROI outcome metrics that capture high school graduation and postsecondary outcomes. As shown in Figure 9, this phenomenon can largely be explained by the dramatic variance in high school completion rates between special-education students and those in other public school segments.
Low-Income Students
The Educational Return on Investment framework is perhaps most useful when applied to students and families of modest economic means:
- Depending on location and economic circumstances, low-income families have more limited options than other families. They are more likely to be priced out of private schools, unable to relocate to more affluent school districts with higher-performing public schools, and shut out of urban charter schools because of government-imposed enrollment constraints.
- Among the high school graduation classes of 2013–17, 61% of NYS high school freshmen classified as economically disadvantaged graduated high school within four years, compared with 85% of all other students.[23]
- According to one national study, only 16% of students from the lowest family-income quartile had earned bachelor’s degrees by the age of 24. For students in the highest income segment, that figure is 58%.[24]
- In the most recent 2024 National Assessment of Educational Progress (NAEP) results, “low-income students continue to score significantly lower than their ... higher-income peers, highlighting ongoing disparities in education access and quality.”[25]
Given these opportunity and achievement gaps, it is not surprising that PPS and other EROI indicators are worse when considering only low-income public school students, as opposed to NYC district public school students overall.
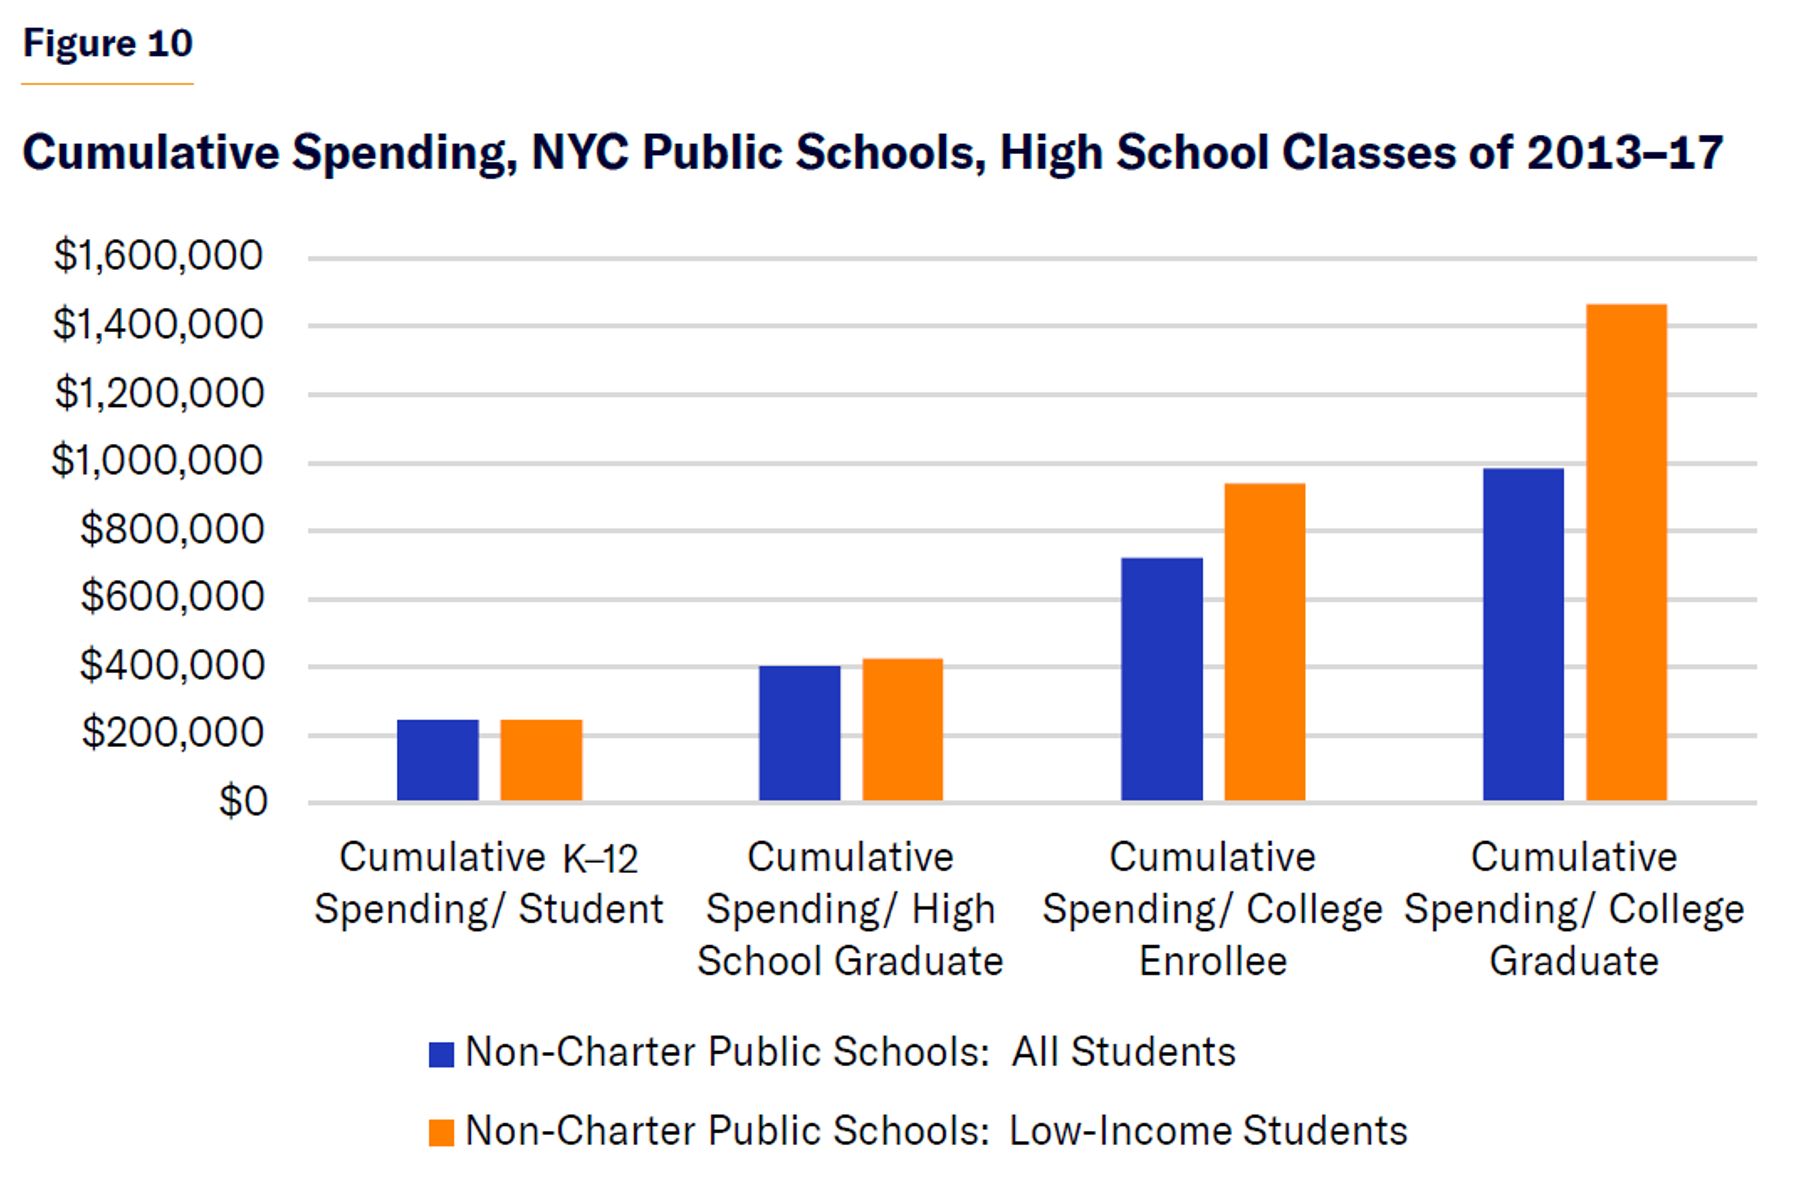
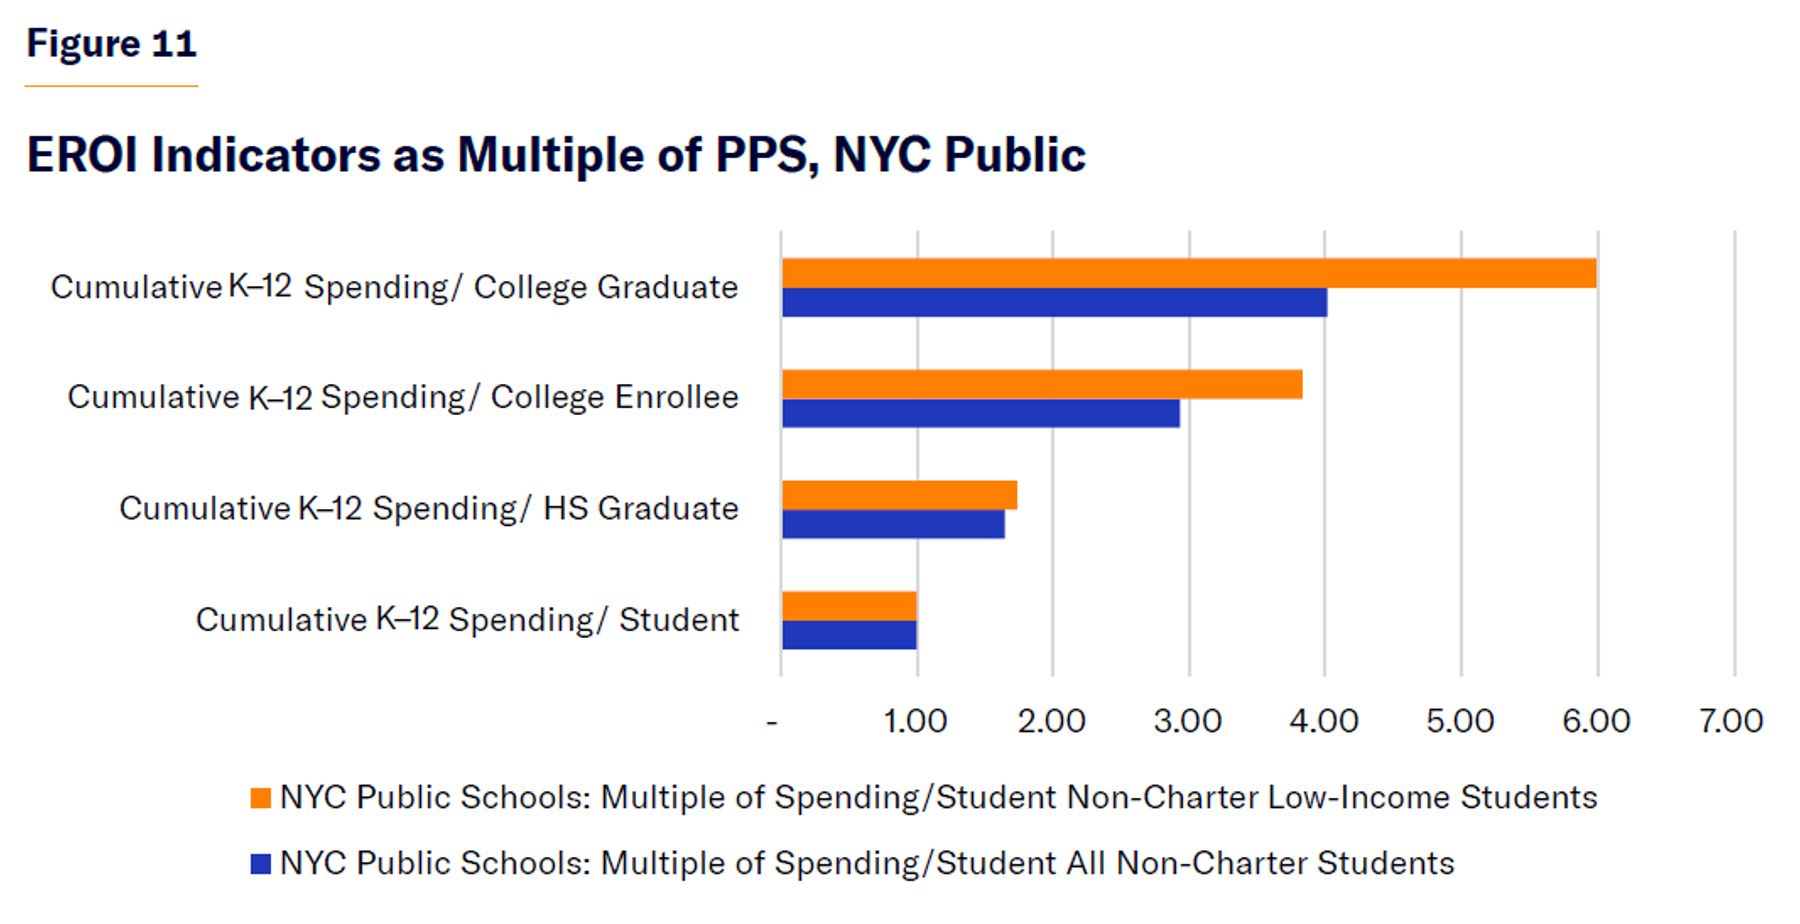
The cost to produce a single college graduate from the low-income student population was over $1.4 million ($2.2 million in today’s dollars), nearly 50% higher than for the overall student population (Figures 10 and 11).
In EROI terms, for every six students of limited economic means who attended NYC traditional public schools, only one ultimately graduated from college with a B.A. or associate’s degree within 10 years of entering high school.
Comparative Analysis: NYC Public Schools and Alternative K–12 Systems
A personal financial investment that results in a 10% ROI might seem like cause for celebration—unless that money could have gone to other investments, with similar cost and risk, that yielded 15%. Although the EROI framework can be useful in assessing a particular K–12 school, model, or system, it is even more useful as a means of comparing outcomes across several institutions, districts, and networks. Therefore, in addition to the NYC public school system, this report also presents an EROI analysis for New York State as a whole as well as for one private/parochial school system in New York City.
New York State Public Schools
NYC students represented about 39% of overall NYS K–12 enrollment in 2013–17. However, PPS is extremely high not only in the city but throughout the state; in those five years, PPS was, on average, higher for K–12 students outside NYC than for NYC students: $27.3K vs. $22.9K, a 19% difference. PPS for all NYS students (including NYC students) in the 2013–17 cohort ($25.5K) is 11% higher than the NYC-only figure ($22.9K).
Despite spending less, NYC performs worse on several EROI metrics (Figure 12): the city performs slightly worse when accounting for high school graduation rates; and notably worse when considering college enrollment and college completion. Across those spending-per-academic-achievement indicators, NYC performs 13%–22% worse than the state as a whole.
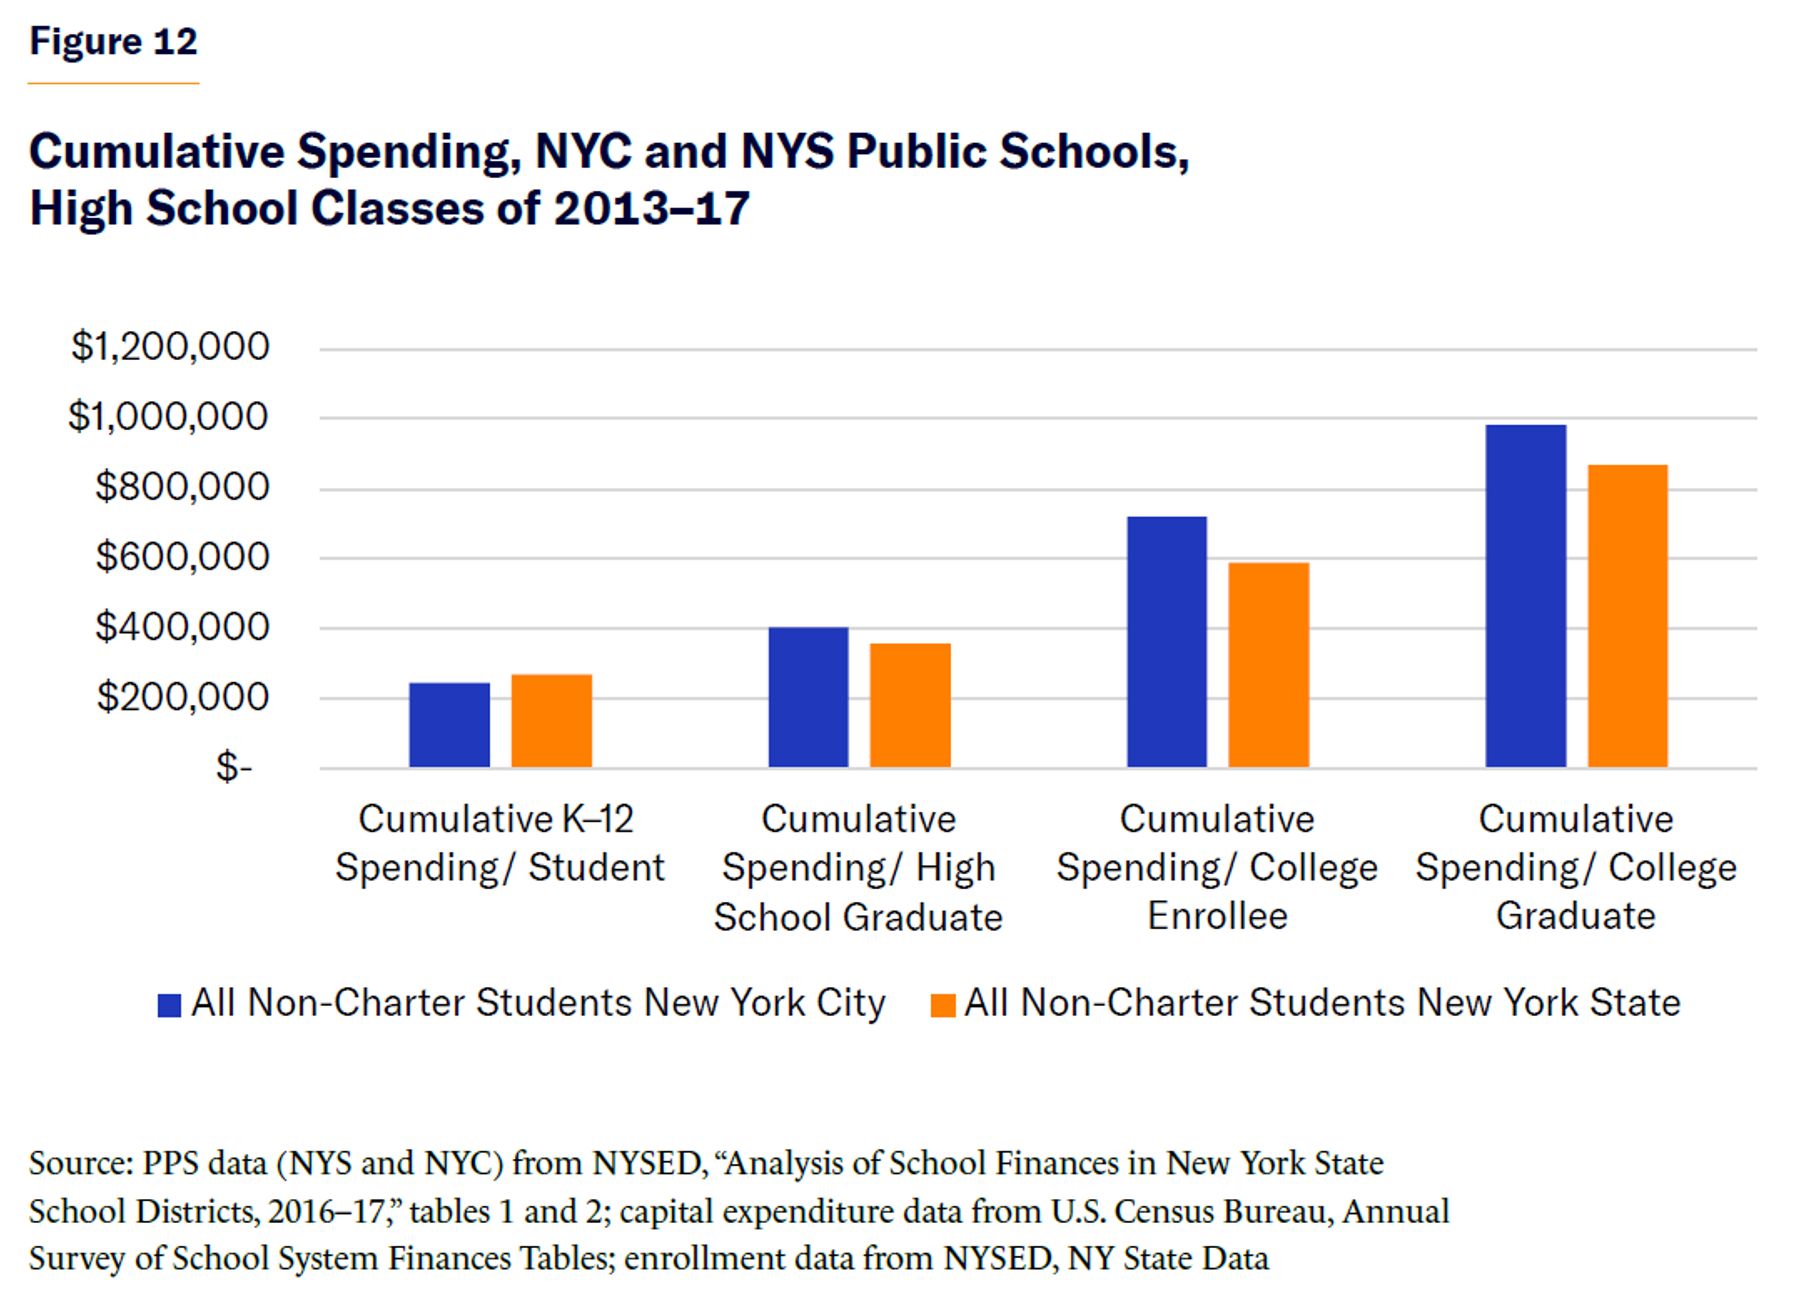
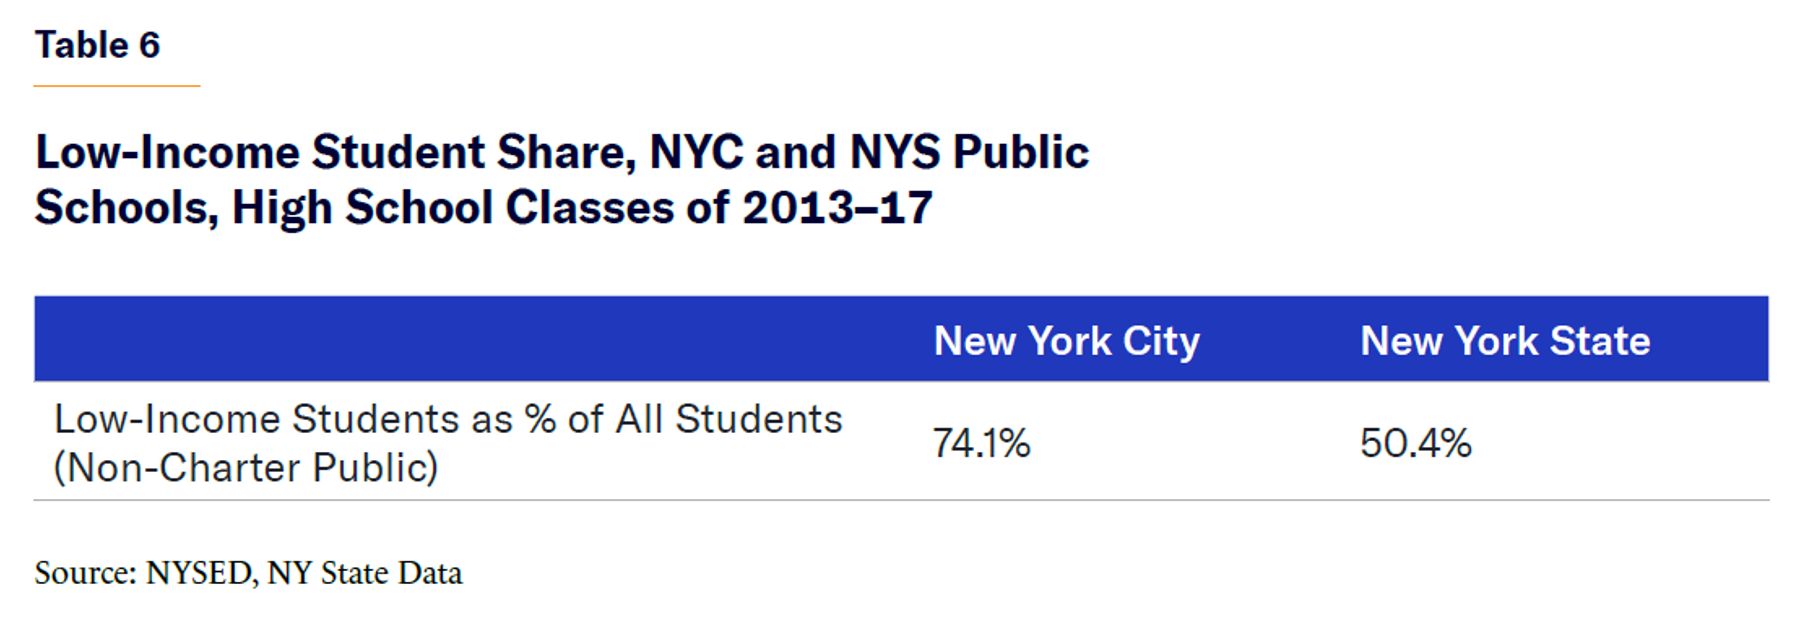
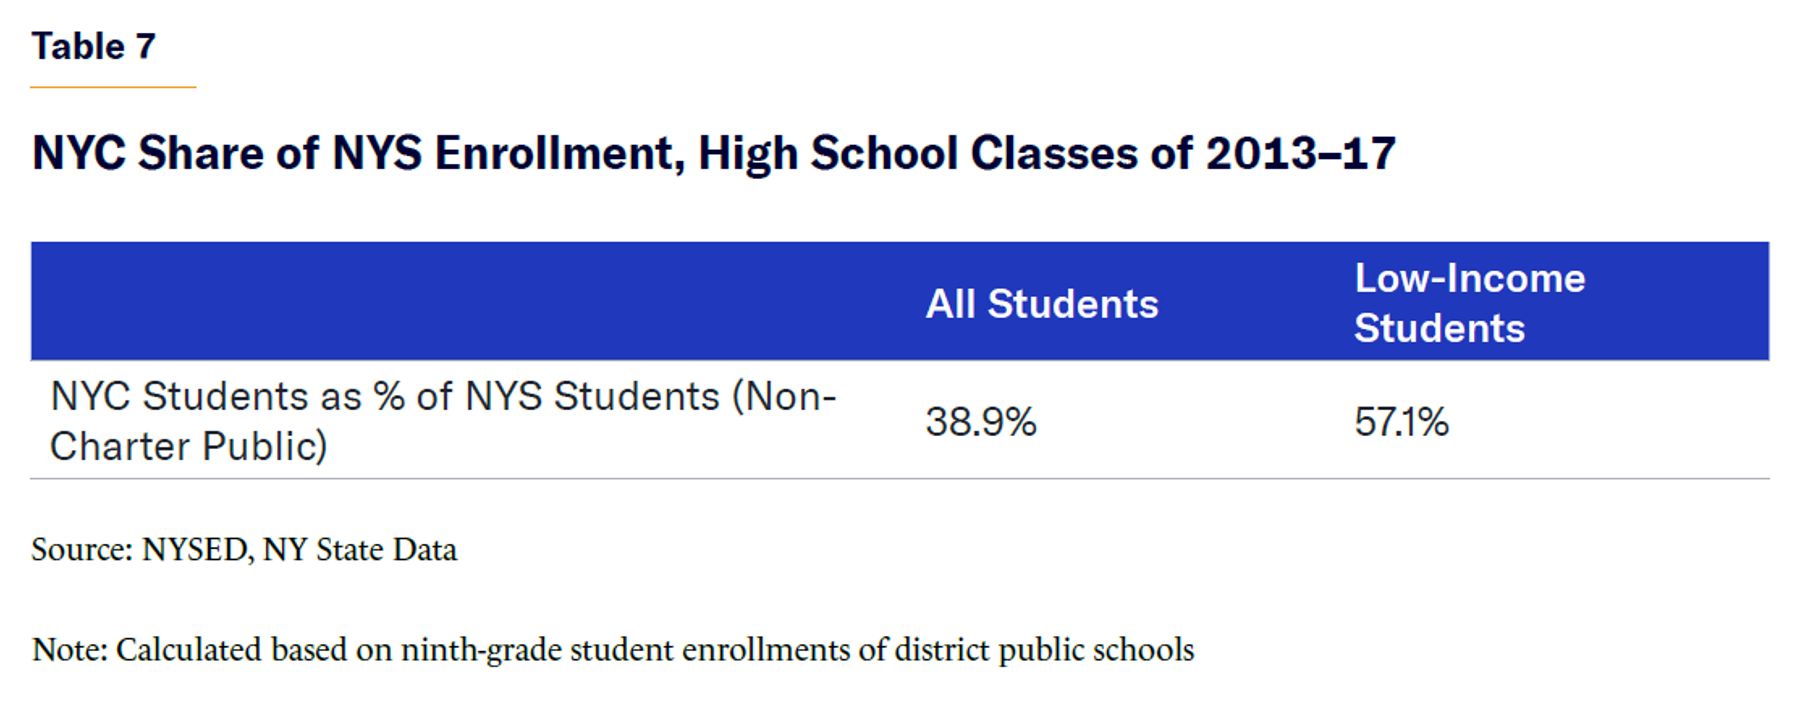
The city’s performance on these metrics can largely be explained by the fact that NYC has a higher concentration of low-income students relative to NYS as whole; and NYC’s share of statewide low-income students is noticeably higher than its percentage of overall enrollment (Tables 6 and 7).
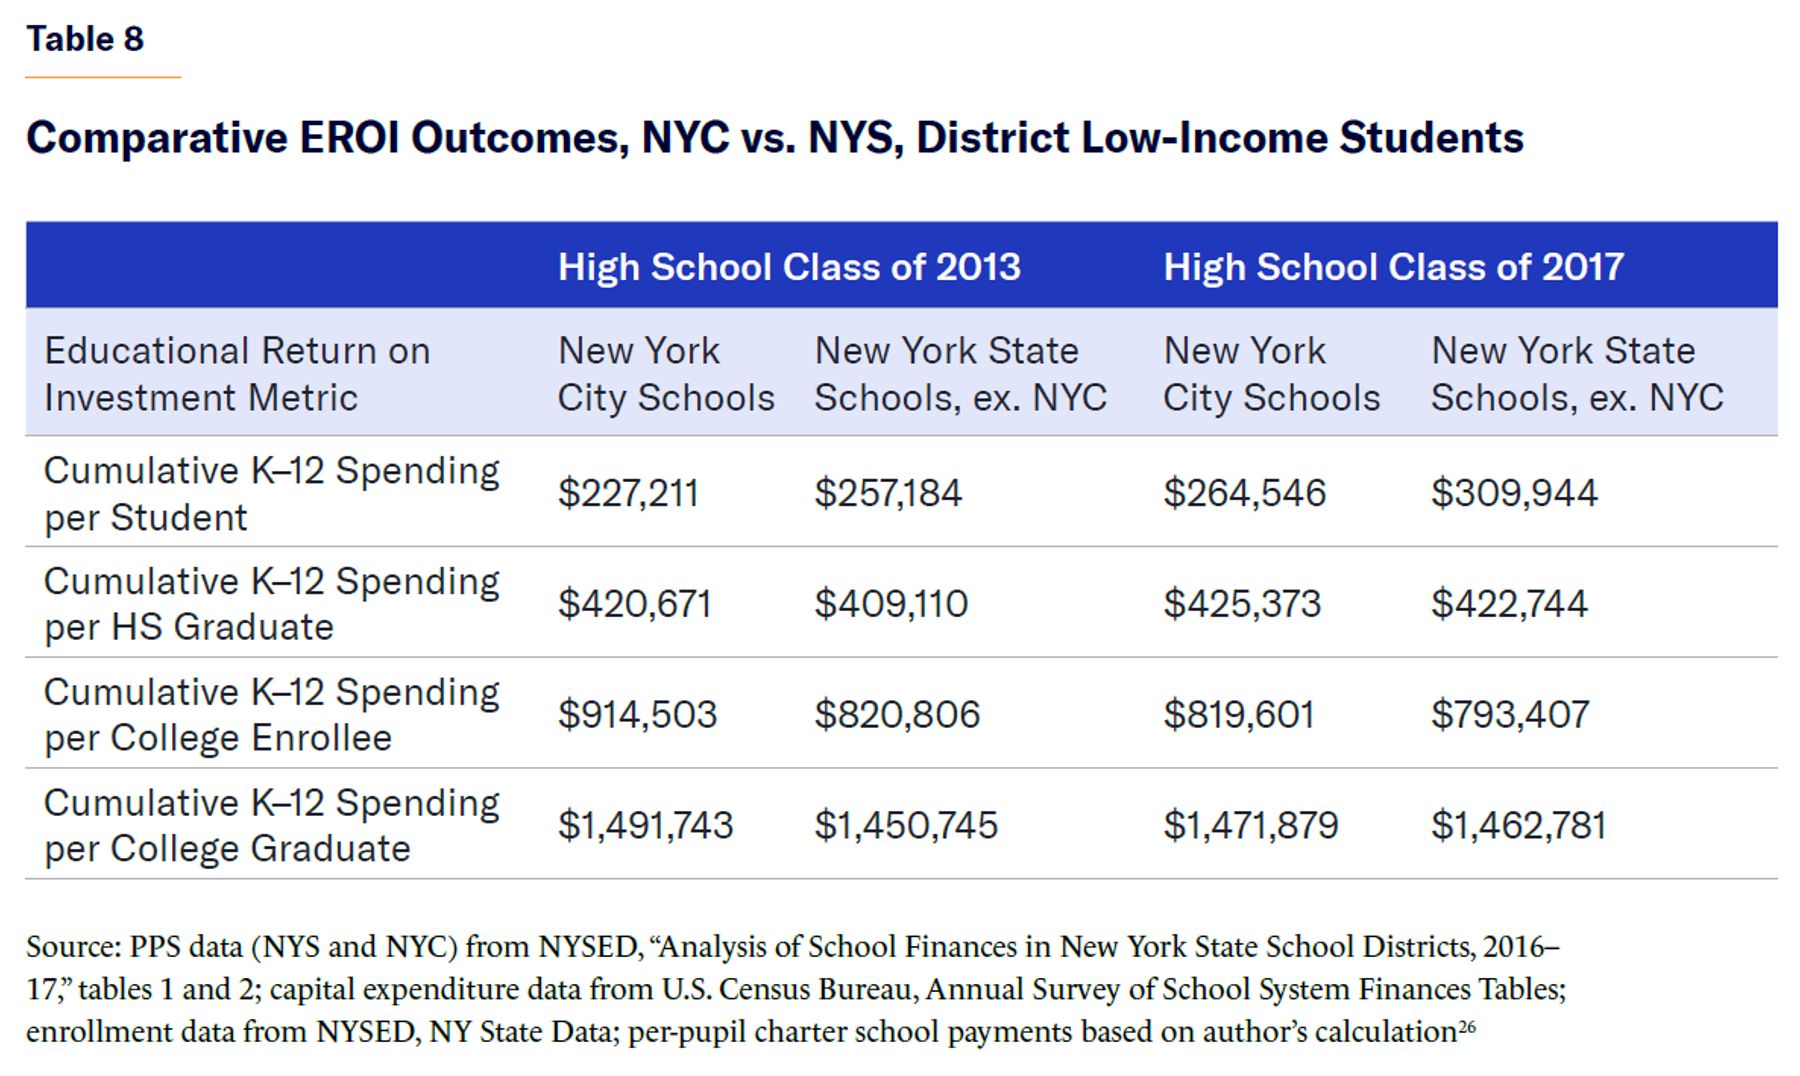
The challenge of delivering cost-effective quality education for low-income students is not limited to New York City. When the analysis is restricted to non-NYC low-income students, we see similar results to those for NYC low-income students (Table 8).
NYS Public Schools: Charter School and Special-Education Students
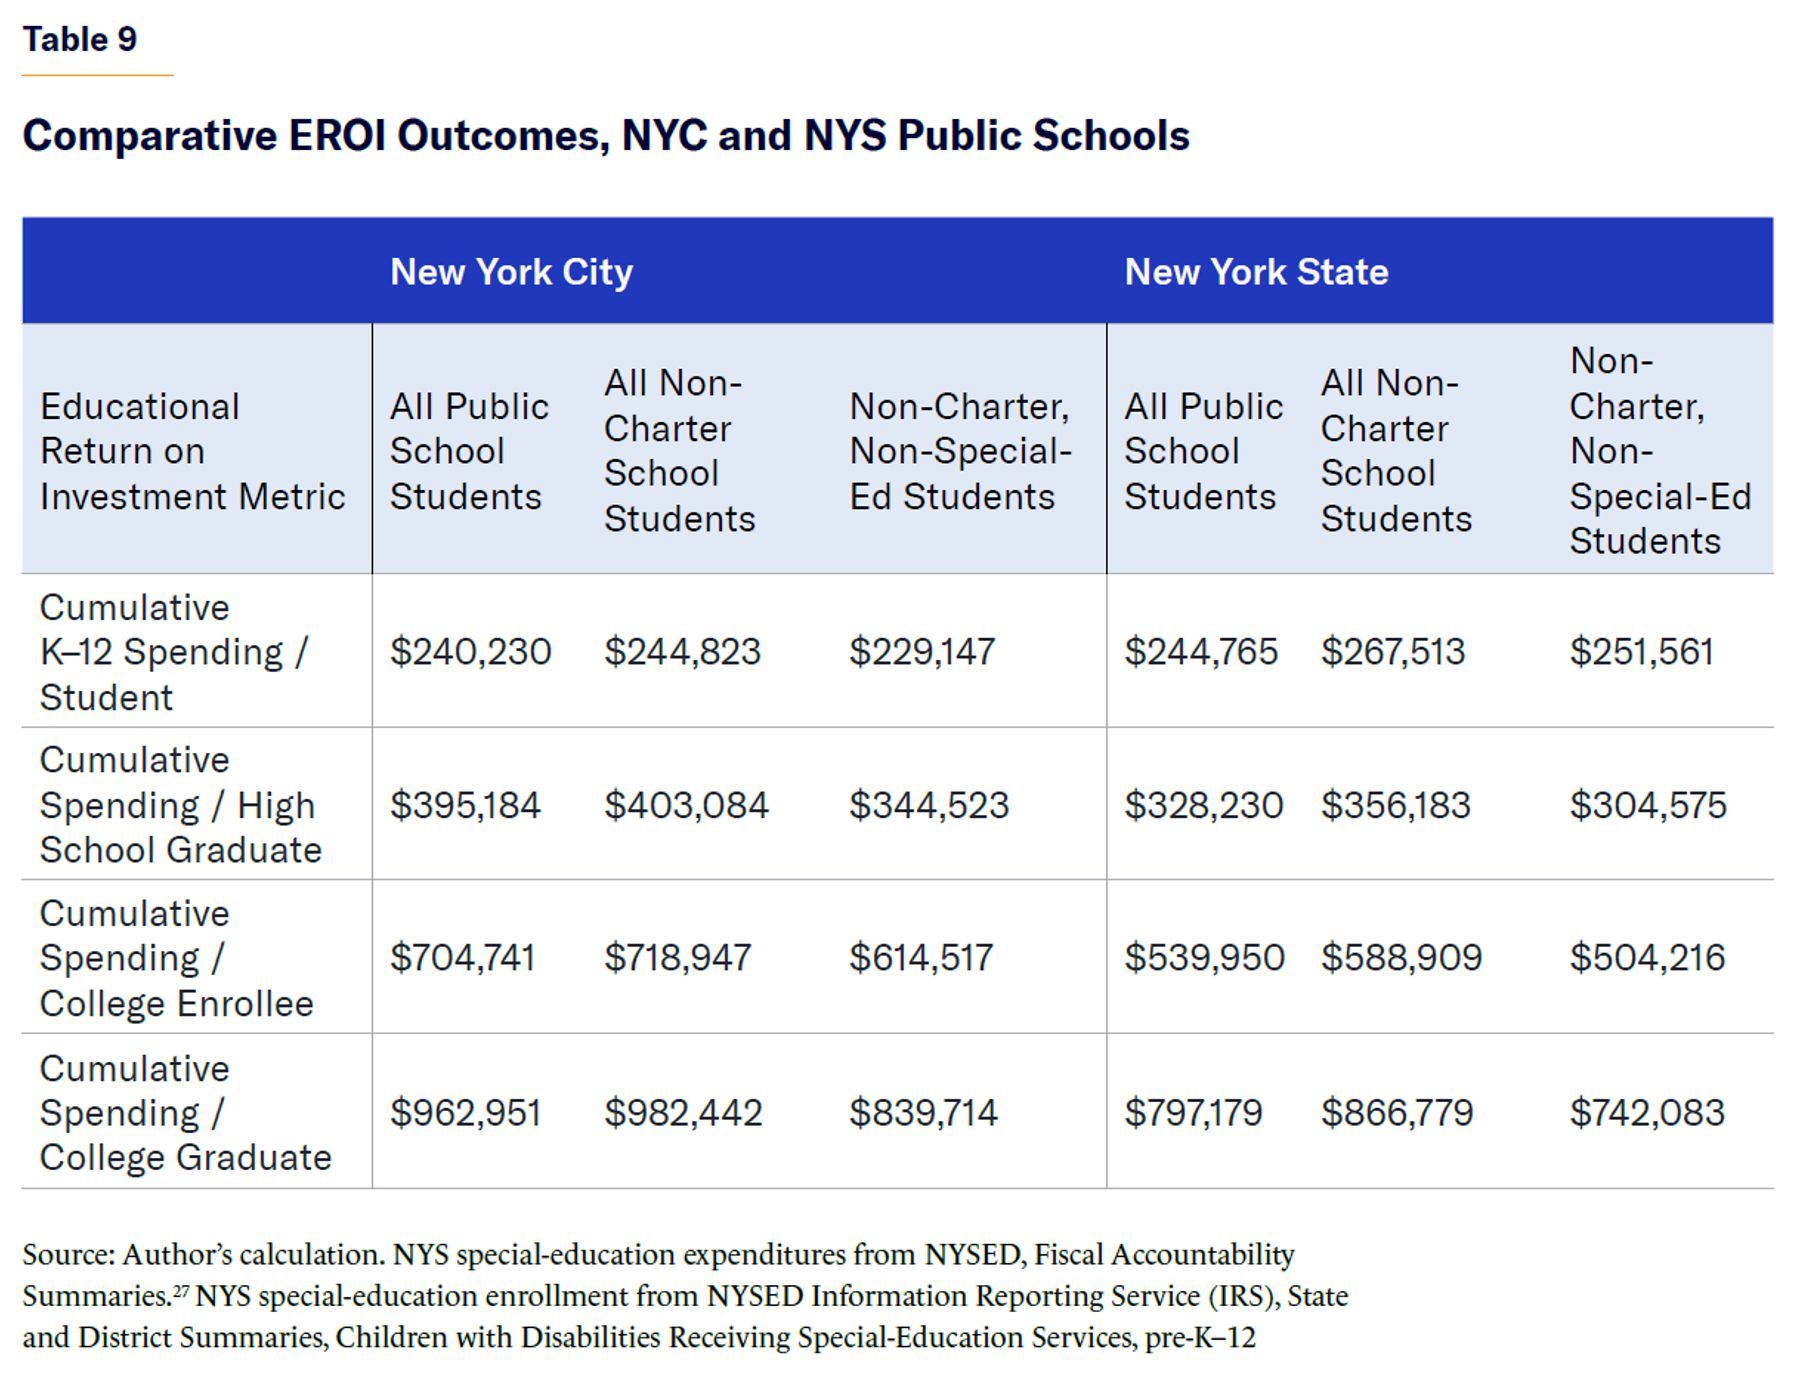
As in the NYC analysis, removing charter students from the statewide public school population yields higher district PPS and worse performance on other EROI metrics, while subtracting special-education students and expenditures reduces (i.e., improves) EROI spending-per-indicator results for the remaining general-education district school segment (Table 9).
NYC Private School System and Institution
To extend the analysis beyond the public school domain, this study also examined the EROI performance of one NYC private high school (Cristo Rey Brooklyn HS) and one feeder elementary school system (Diocese of Brooklyn and Queens), including a comparative analysis with their public school peers.
Key elements of the Cristo Rey model:
- Cristo Rey Brooklyn High School (CRBHS) is a member of the national Cristo Rey Network (CRN), which comprises 41 college-preparatory secondary schools across the country.
- CRBHS is a Roman Catholic institution but actively recruits and serves young people of all faiths.
- CRBHS serves students of all ethnicities and racial backgrounds but, given its location, mission, and model, overwhelmingly enrolls minority students.
- CRBHS, like all CRN schools, exclusively serves families of limited economic means. Applicants whose family income exceeds a certain threshold are ineligible to attend CRBHS.
- While not free, tuition at CRN schools is minimal, covering only 5%–15% of operating costs.
- As a private school, CRBHS requires students to apply and be accepted before matriculating.
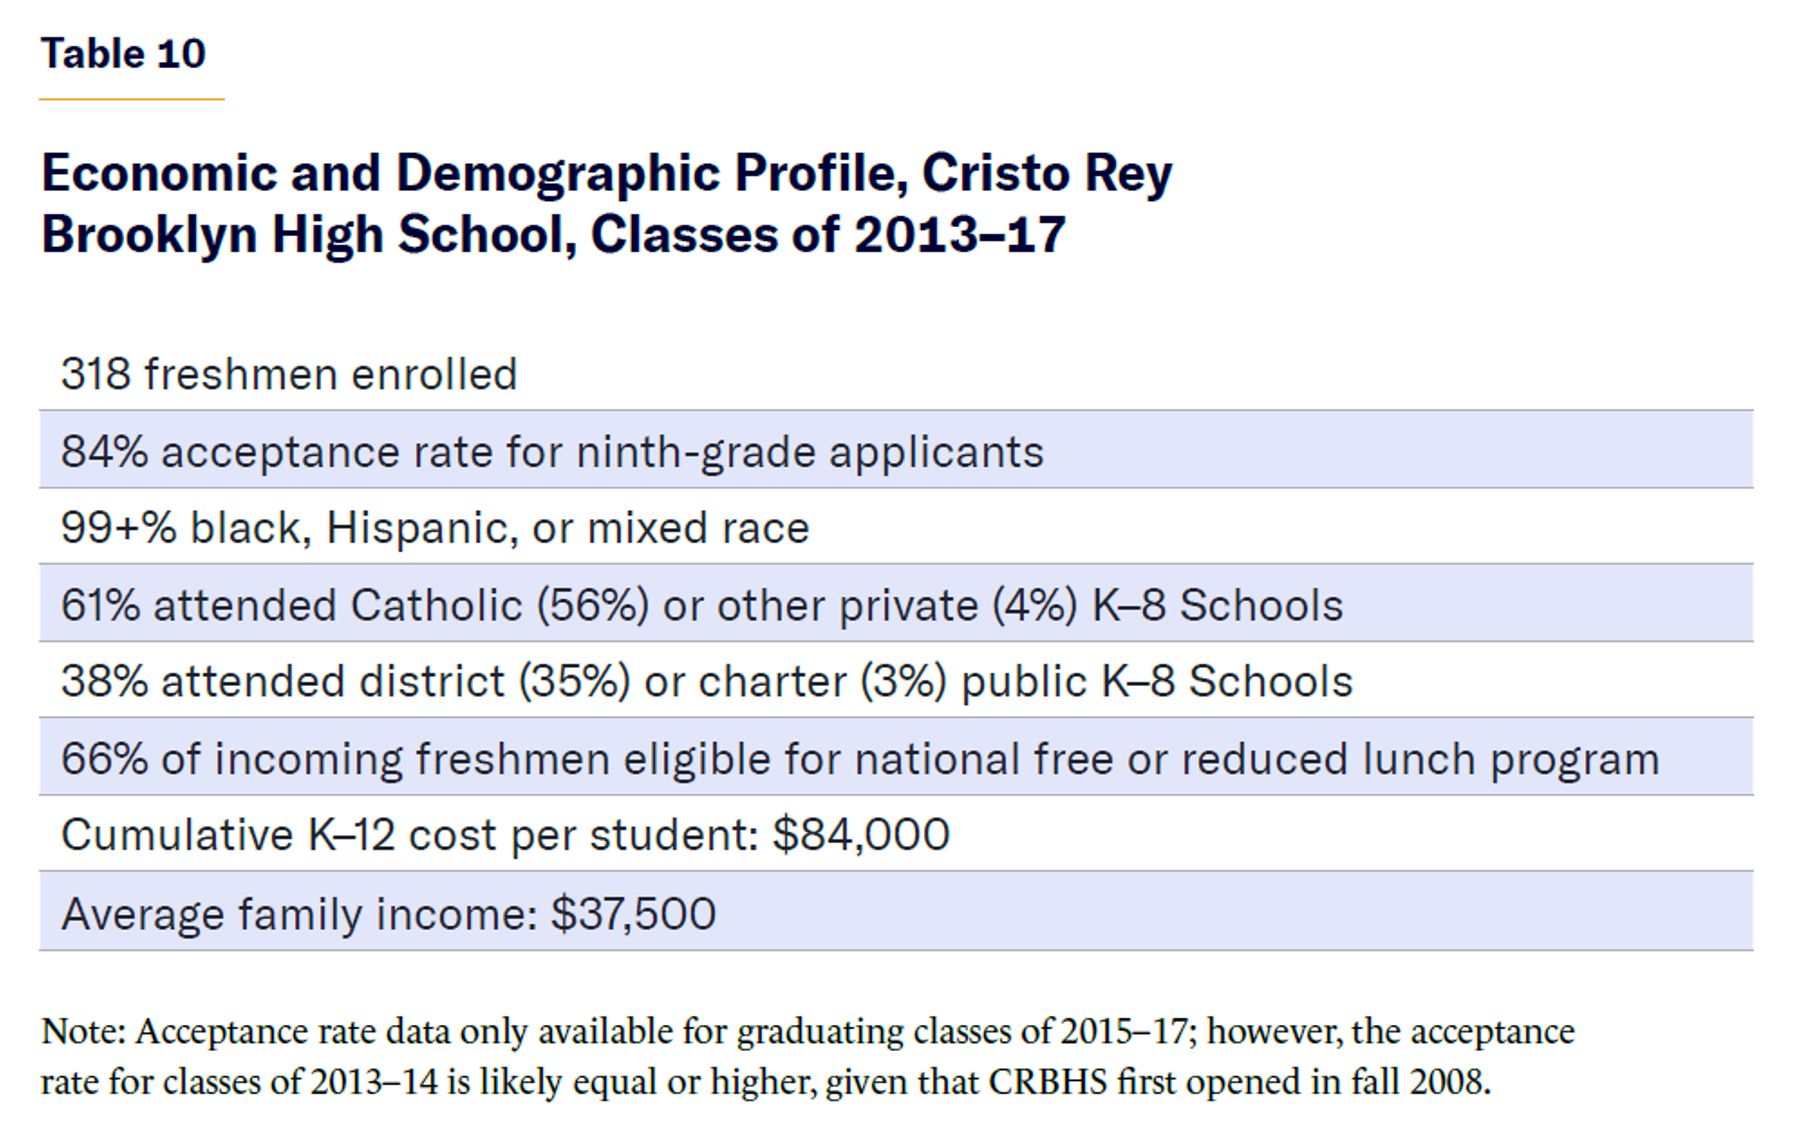
CRBHS was chosen as a subject for this study partly because of its familiarity to the author and its NYC location—but most important, because it exclusively serves families of limited economic means. Table 10 shows the demographic and economic profile of CRBHS classes of 2013–17.[28]
As with public schools, for the purposes of this analysis, CRBHS students are presumed to have also attended Catholic K–8 schools—in this case, within the Brooklyn Diocese.
The Diocese of Brooklyn and Queens, via its Office of Catholic Schools, oversees 64 elementary schools that are educating more than 13,000 students. Though students come from all socioeconomic backgrounds, a significant share qualify for free or reduced lunch or other assistance programs, and over 60% are from minority communities. According to the Diocese, its K–8 PPS is one-quarter that of NYC public schools,[29] while “New York State standardized test results show that students in Brooklyn and Queens Catholic elementary schools surpassed their public school peers in the English language component with students earning a strong standing in Mathematics.”[30]
For these reasons, the combined Cristo Rey HS and Catholic elementary school systems offer a useful point of comparison for the other school systems analyzed in this report.
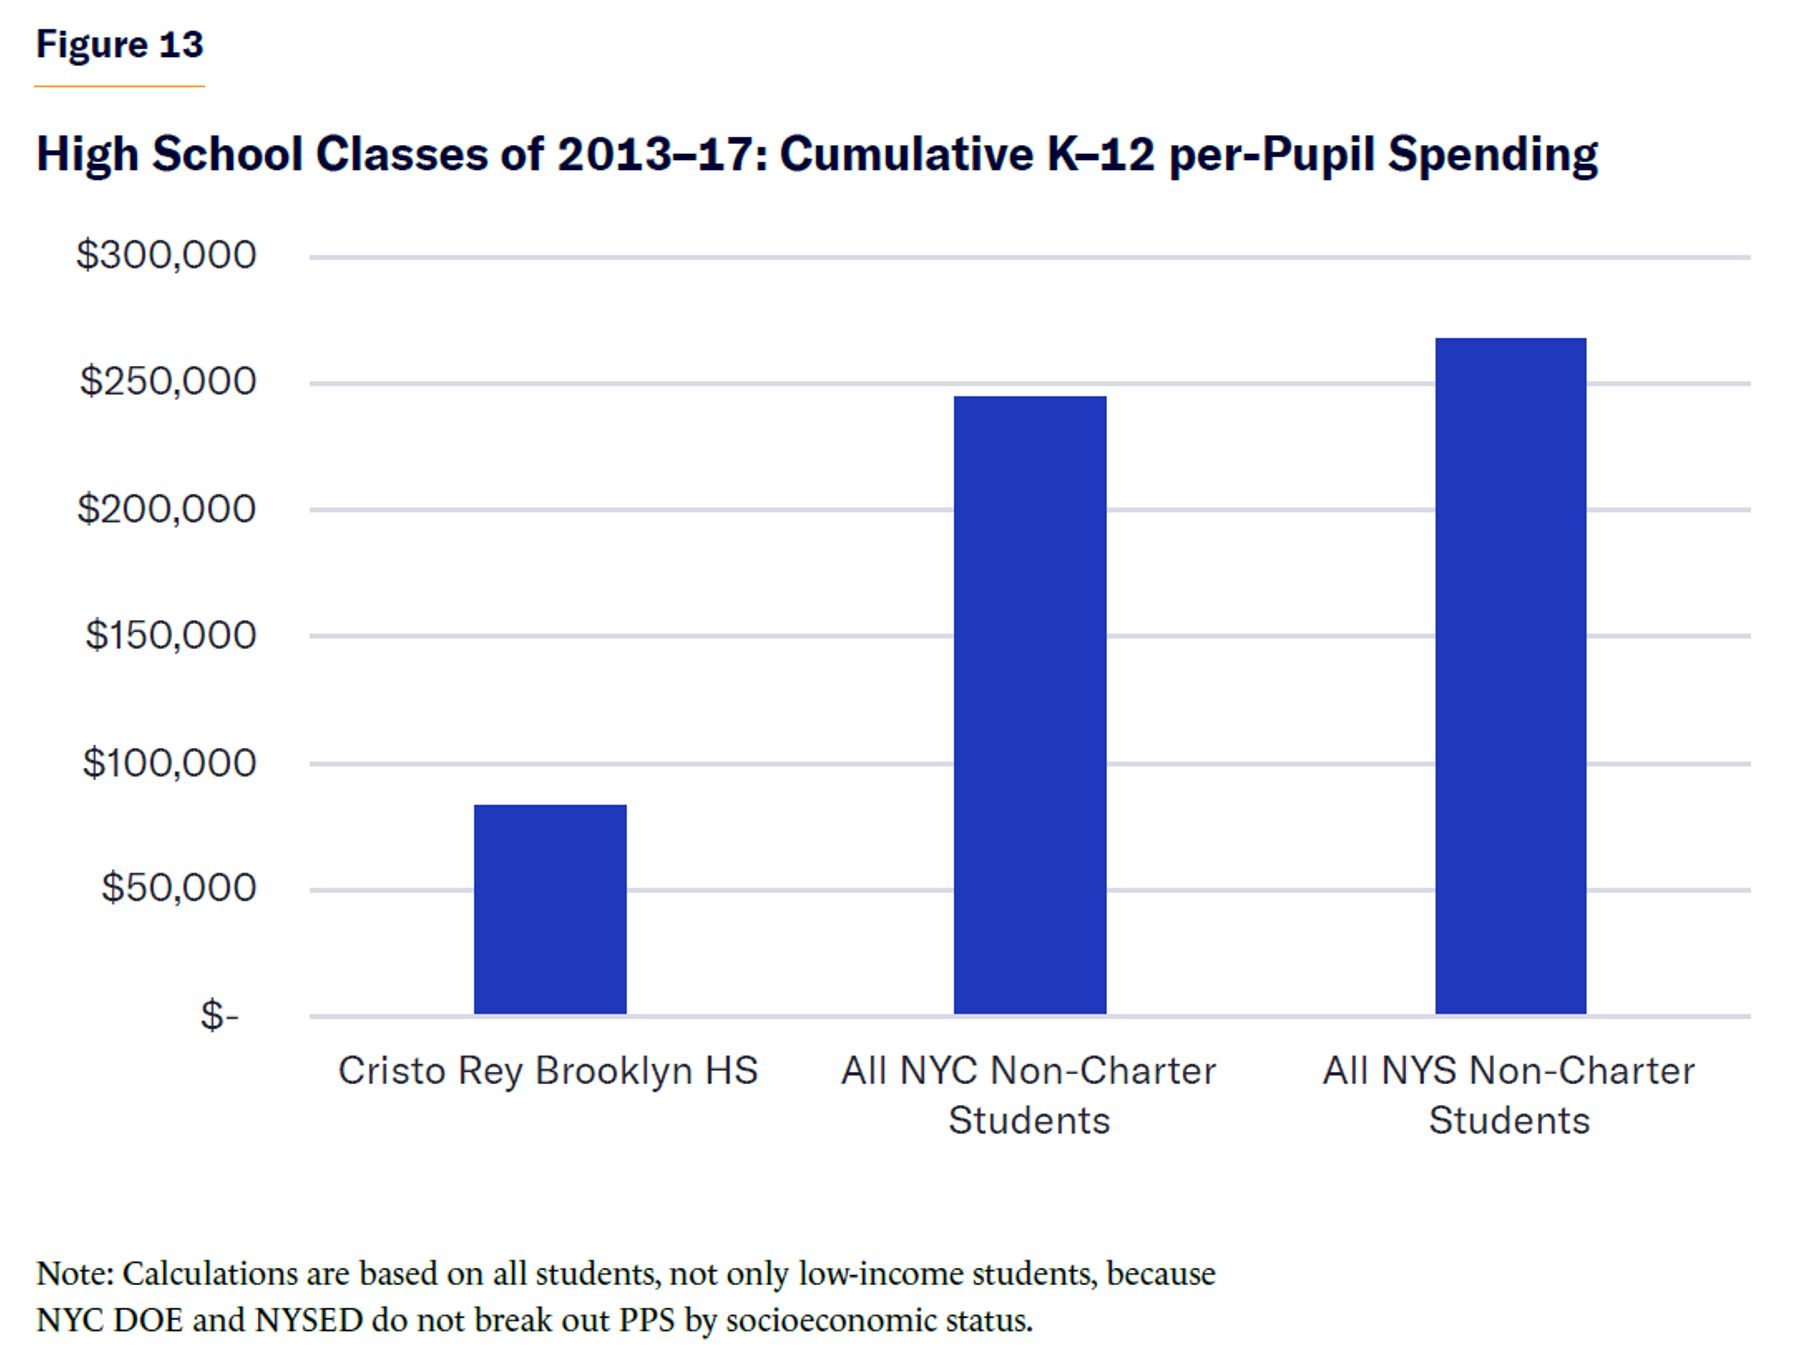
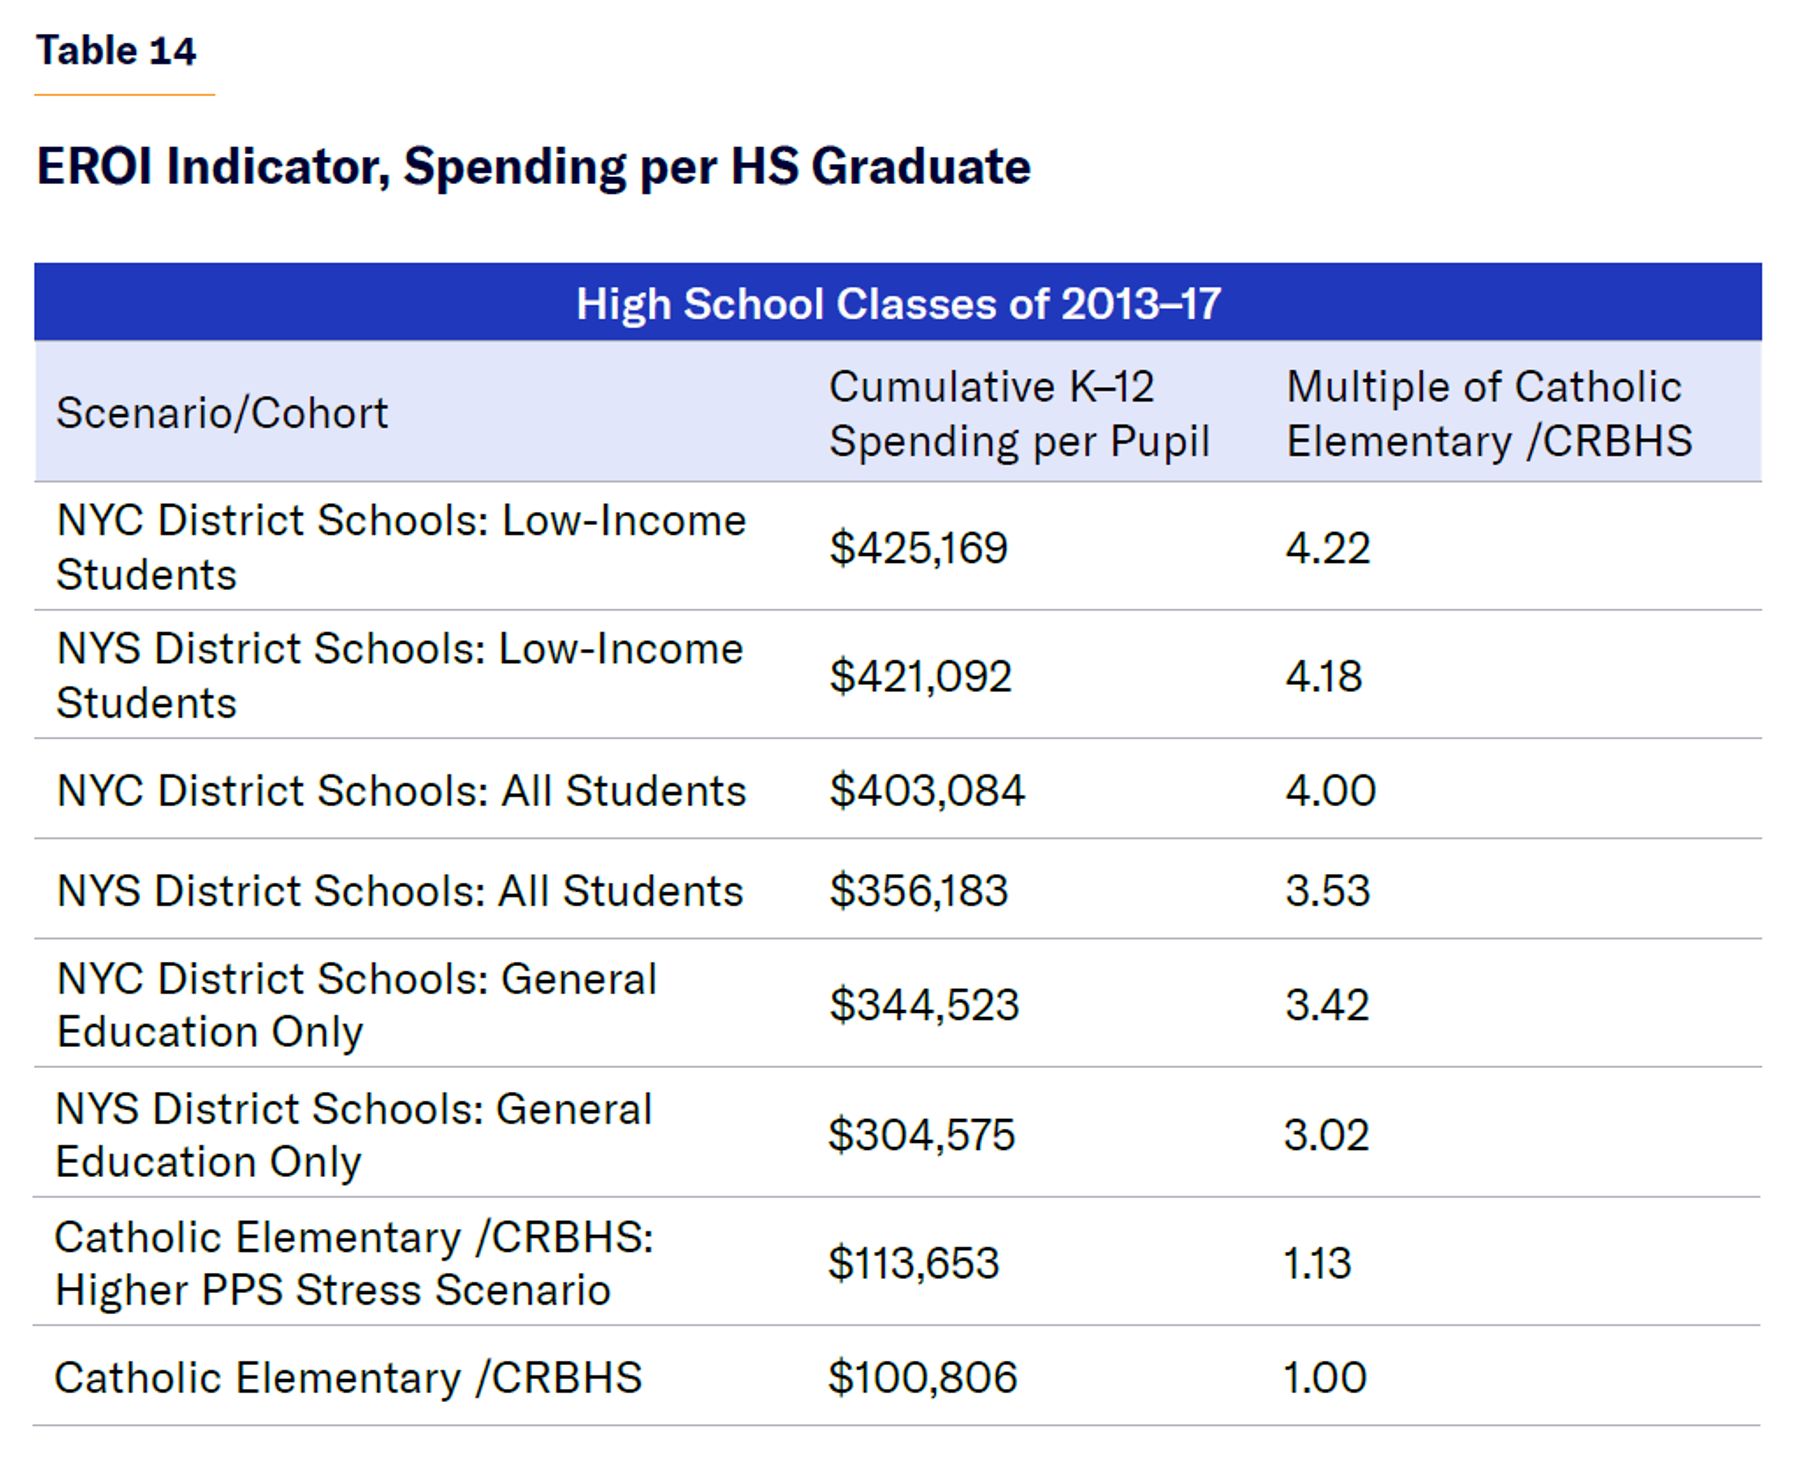
In terms of cumulative K–12 PPS alone—without incorporating academic performance—the cost of educating the high school graduating classes of 2013–17 in NYC and NYS district public schools was 2.9–3.2 times higher than the cost of doing so in the combined Catholic elementary school /CRBHS alternative (Figure 13). In terms of cost per high school graduate, NYC and NYS schools spent 4.2 times more than the Catholic school /CRBHS system.[31]
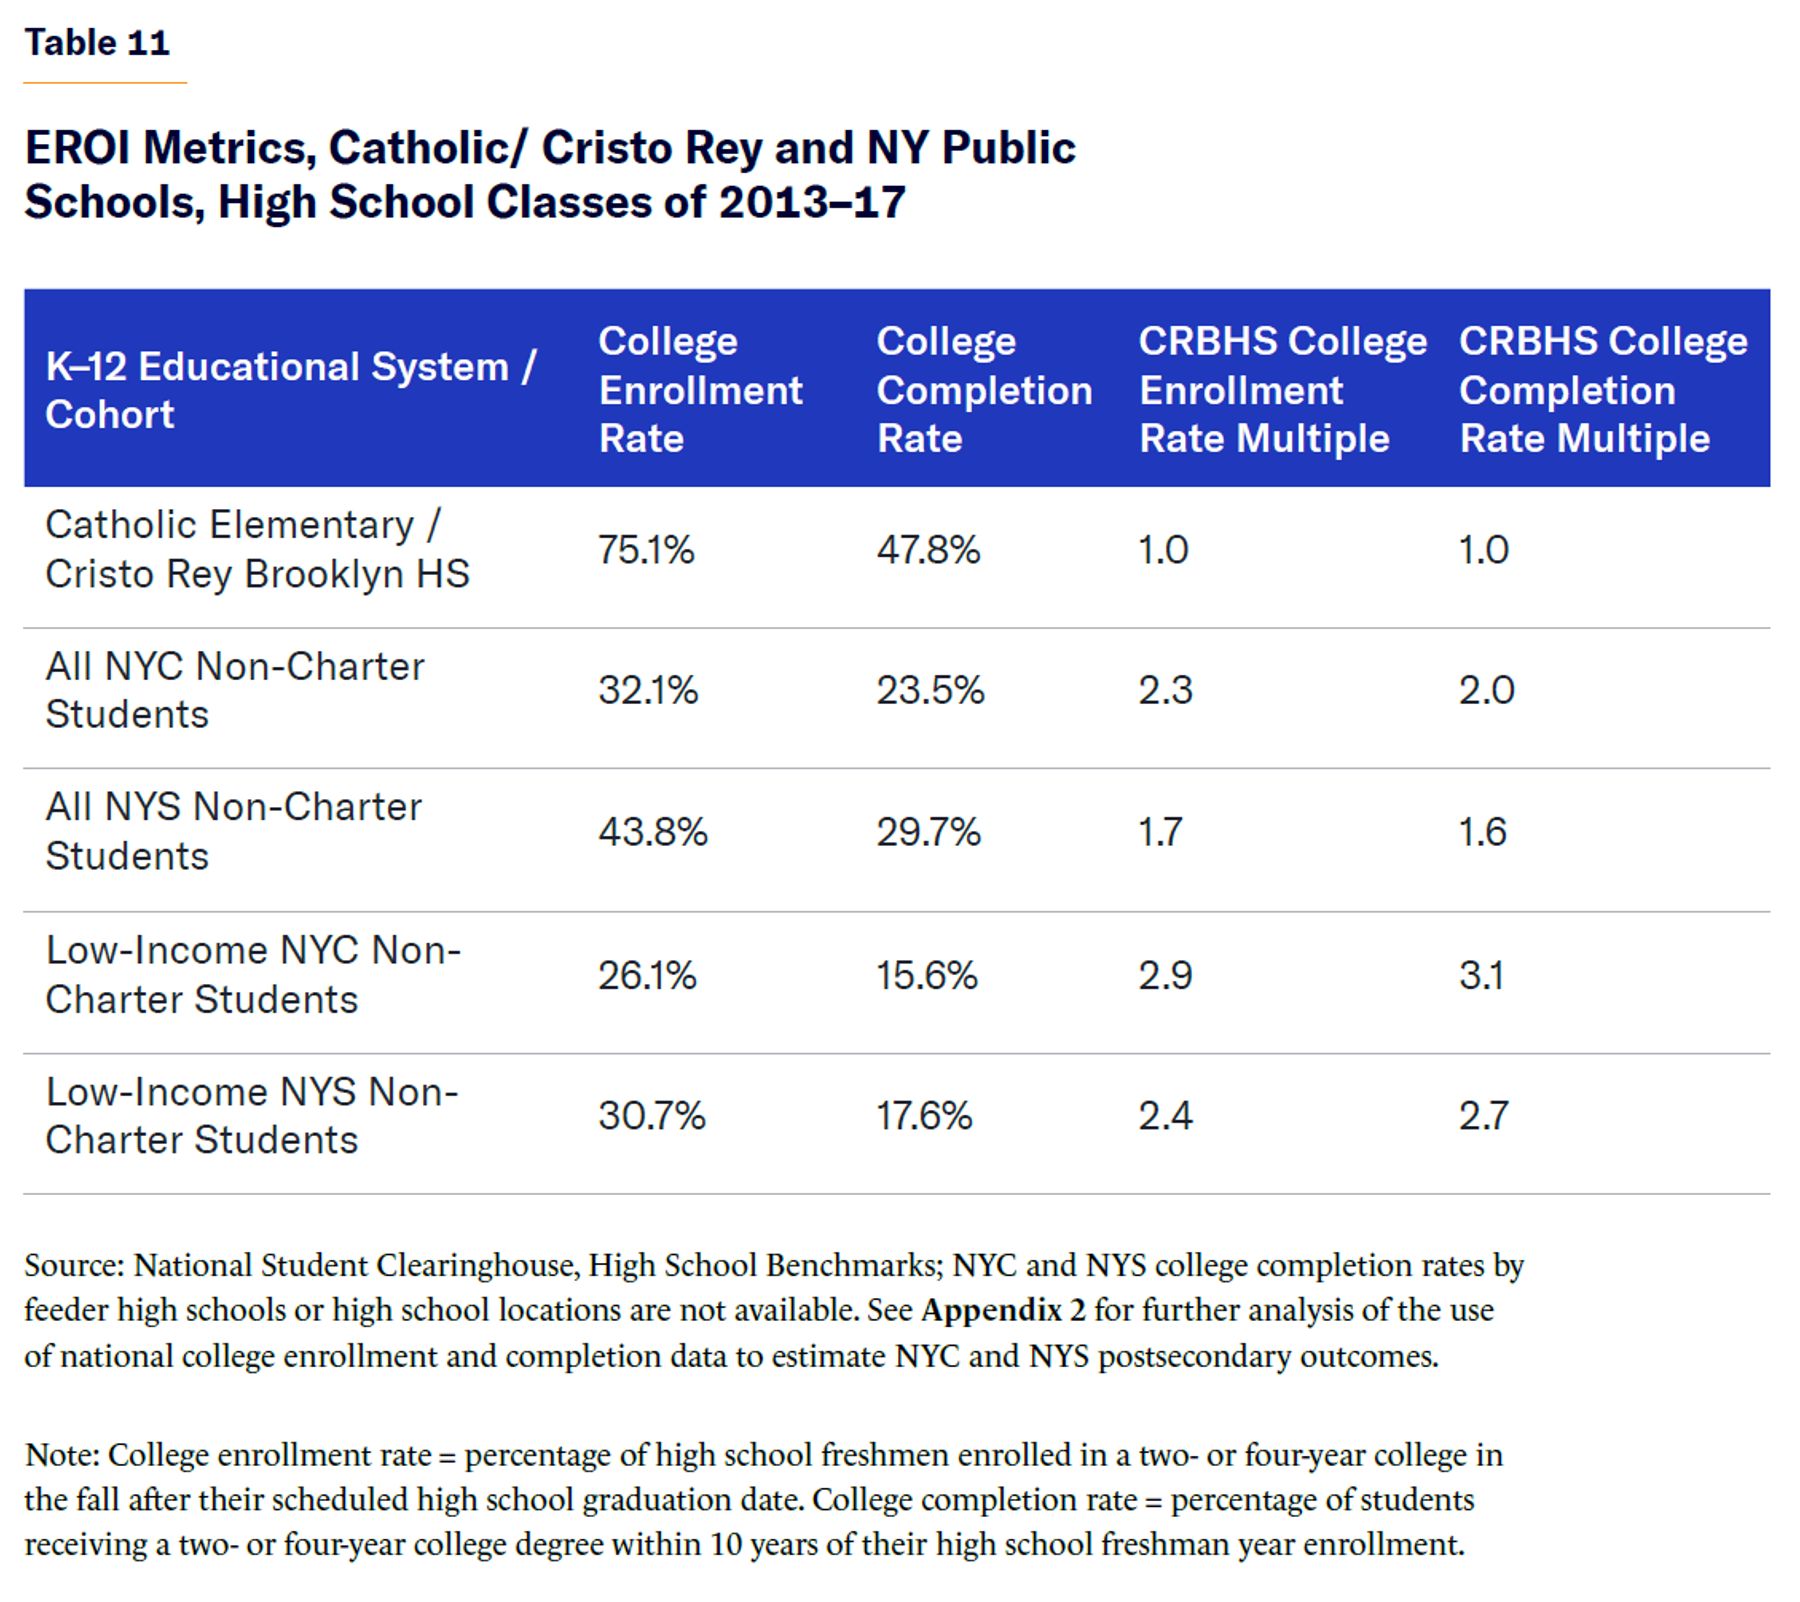
Noticeable differences exist between these two models in terms of postsecondary educational performance (without incorporating any spending criteria or results). Depending on the school location (NYC or NYS) and socioeconomic cohort (all students or low-income only) with which it was compared, the Catholic/ Cristo Rey model performed 1.6–3.1 times better than its public school counterparts (Table 11).
But as posited earlier, the true value of various educational models may be over/underestimated or significantly misunderstood when academic and economic indicators are not integrated with each other. In this case, integrating these measures via the EROI framework shows that differences between the Catholic/ Cristo Rey system and its public school peers are considerably more pronounced than when looked at in isolation.
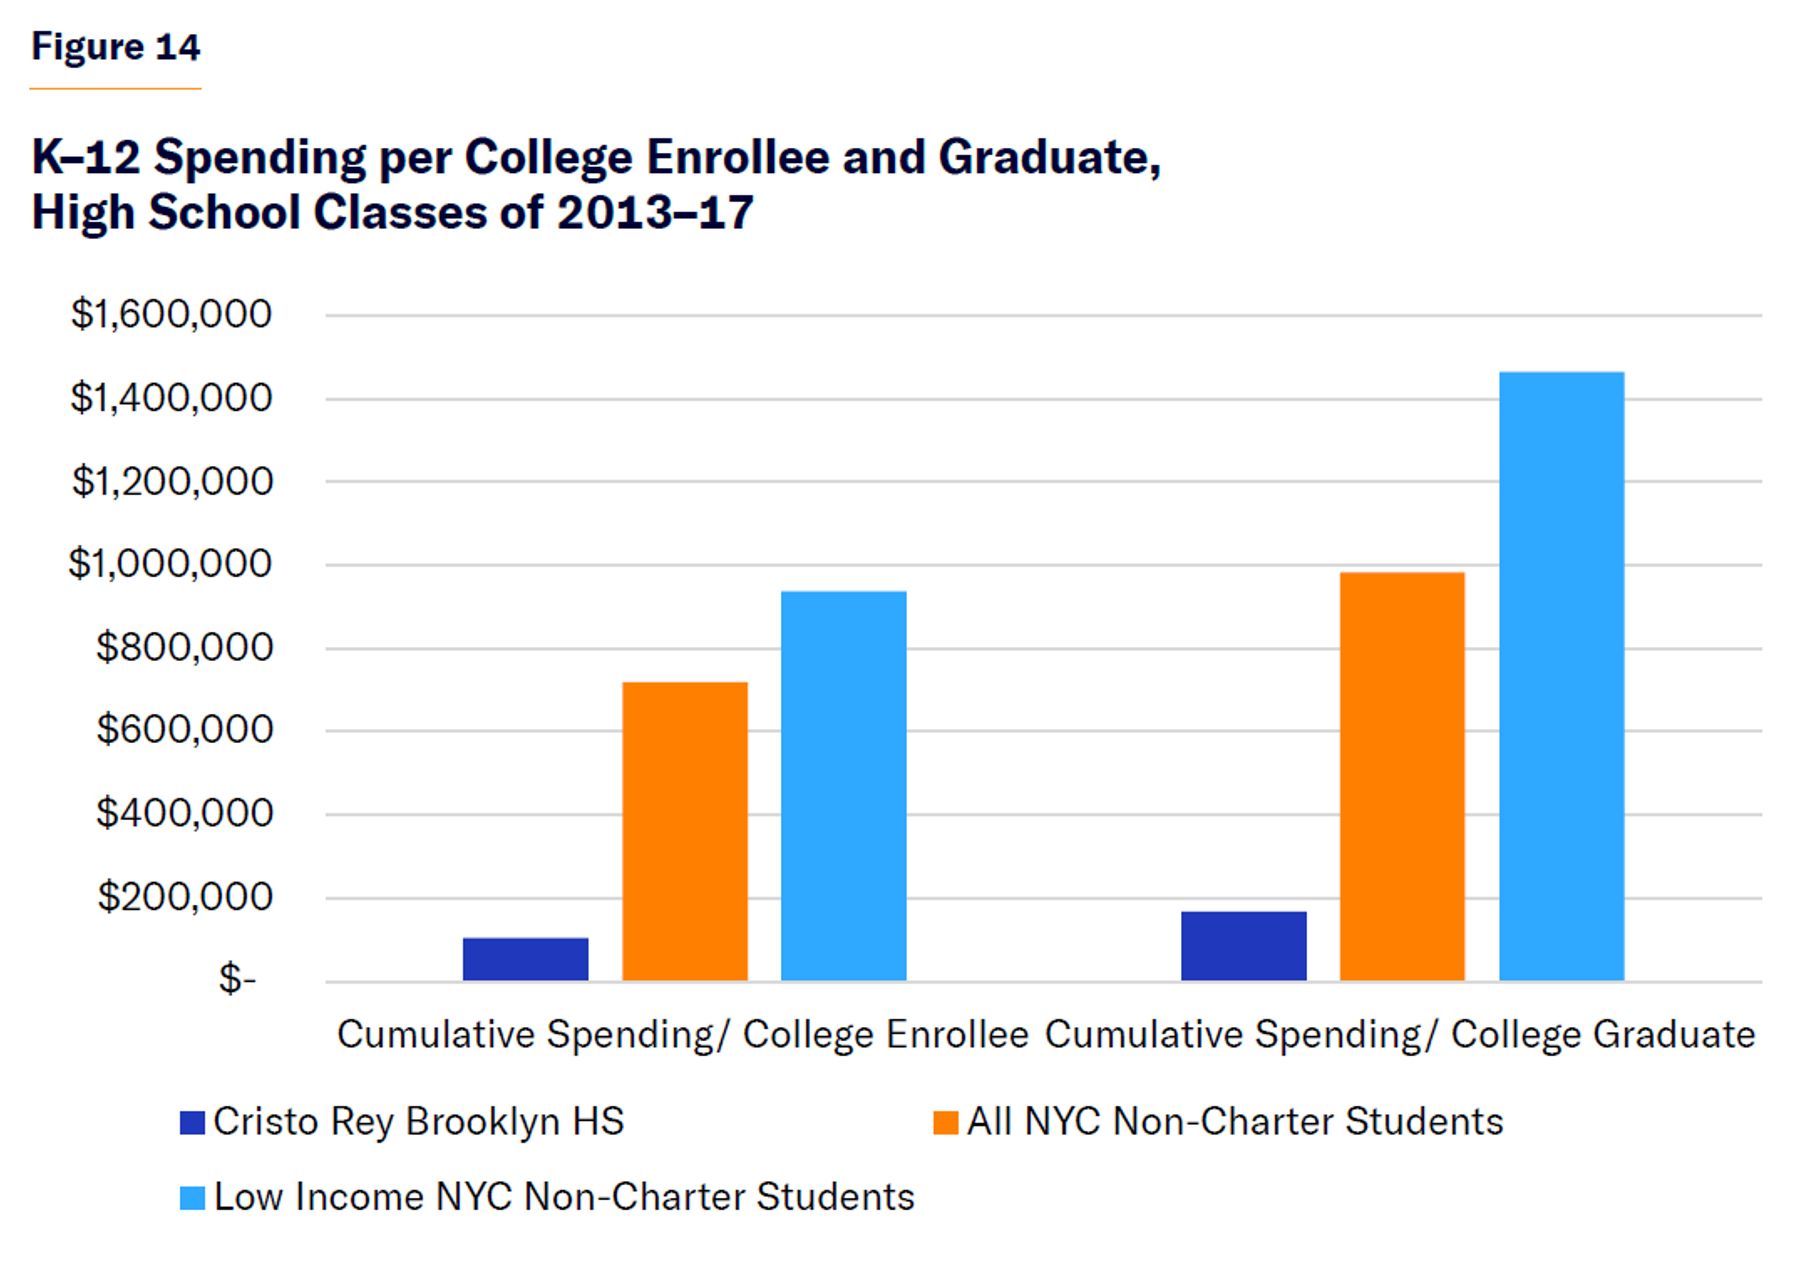
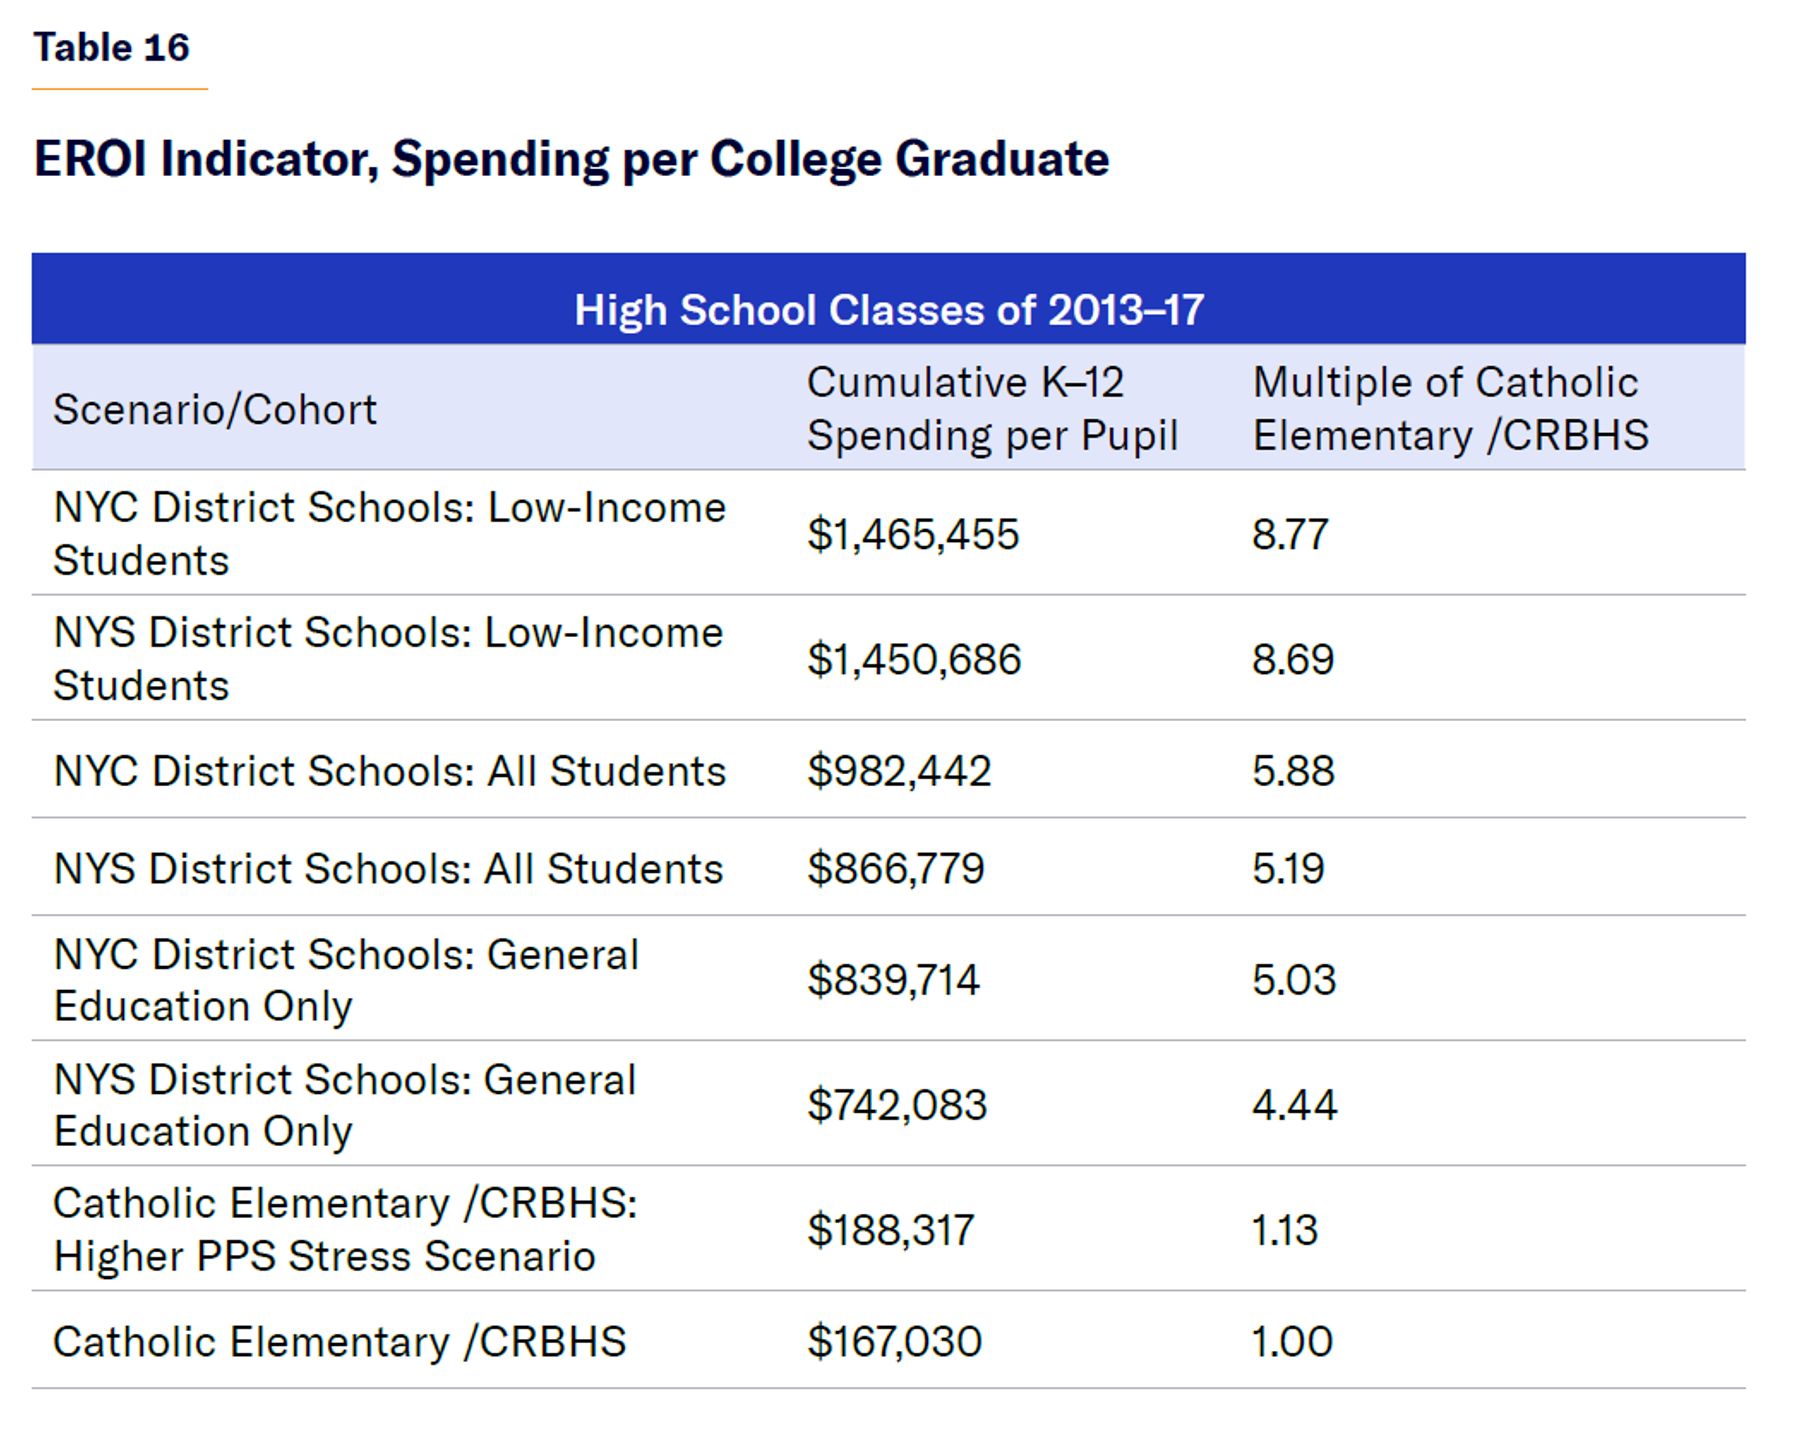
To produce one college graduate within six years of high school graduation from a pool of low-income students, Cristo Rey Brooklyn and Catholic elementary schools spent only $167,000, while the NYC traditional public school system spent $1.47 million ($2.2 million, 2025$) (Figure 14). This translates to a CGM of 8.8, i.e., for the same investment, the Cristo Rey model yielded approximately nine graduates versus NYC public schools’ one graduate.
Similarly, NYS public schools spent $1.45 million per low-income college graduate, giving Cristo Rey a CGM of 8.7 relative to NYS schools.
Analytical and Stress-Testing Adjustments
As observed earlier in this report, the public school systems in New York City and State are large, complex educational operations with dynamics differentiating them from other models. This analysis is dependent upon available data and inputs. In recognition of these limitations and to further facilitate comparative analyses across various K–12 models, Figure 15 presents two additional sensitized scenarios:
- Removing the special-education student segment from the New York City and State district public school populations, leaving only traditional general-track students; no adjustments were made to the Catholic school population—i.e., it was assumed that all Catholic school students were on a general-education track and no incremental special-education expenditures were incurred. Data segmenting special-education public school students by socioeconomic status are not publicly available, so the sensitivity analysis includes all income segments and does not disaggregate low-income students.
- Increasing Catholic school spending. Reported cumulative K–8 PPS for Catholic elementary schools may have included only direct expenditures. Capital and other indirect expenditures that might have been incurred during the period are unknown. Therefore, the Catholic elementary school PPS has been increased by 31%, equivalent to NYC public school indirect costs as a percentage of NYC DOE’s operating budget, less allocations to charter and private schools (NYS public school equivalent % = 9%).
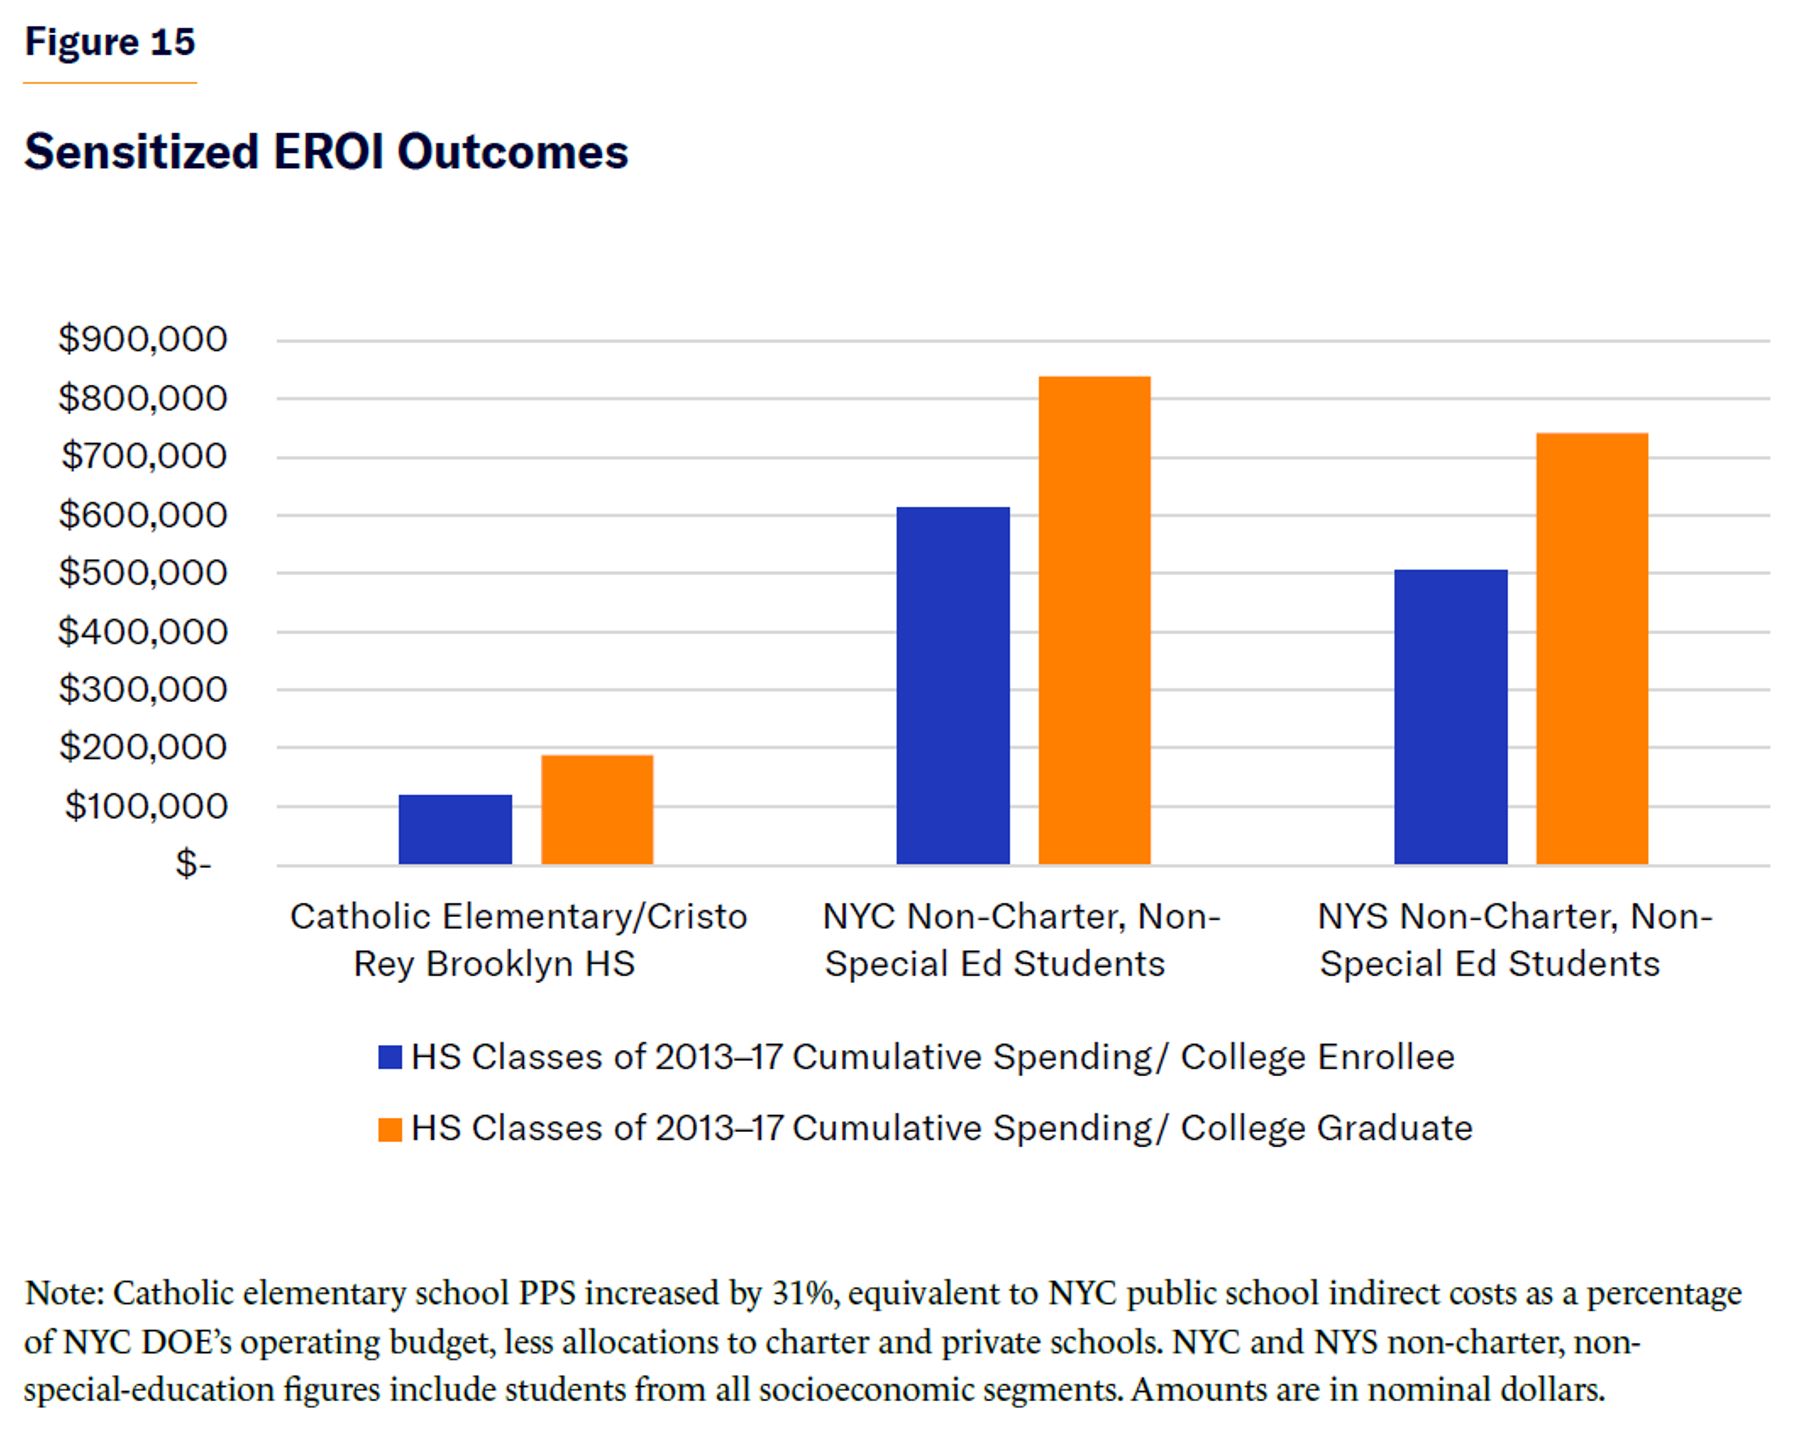
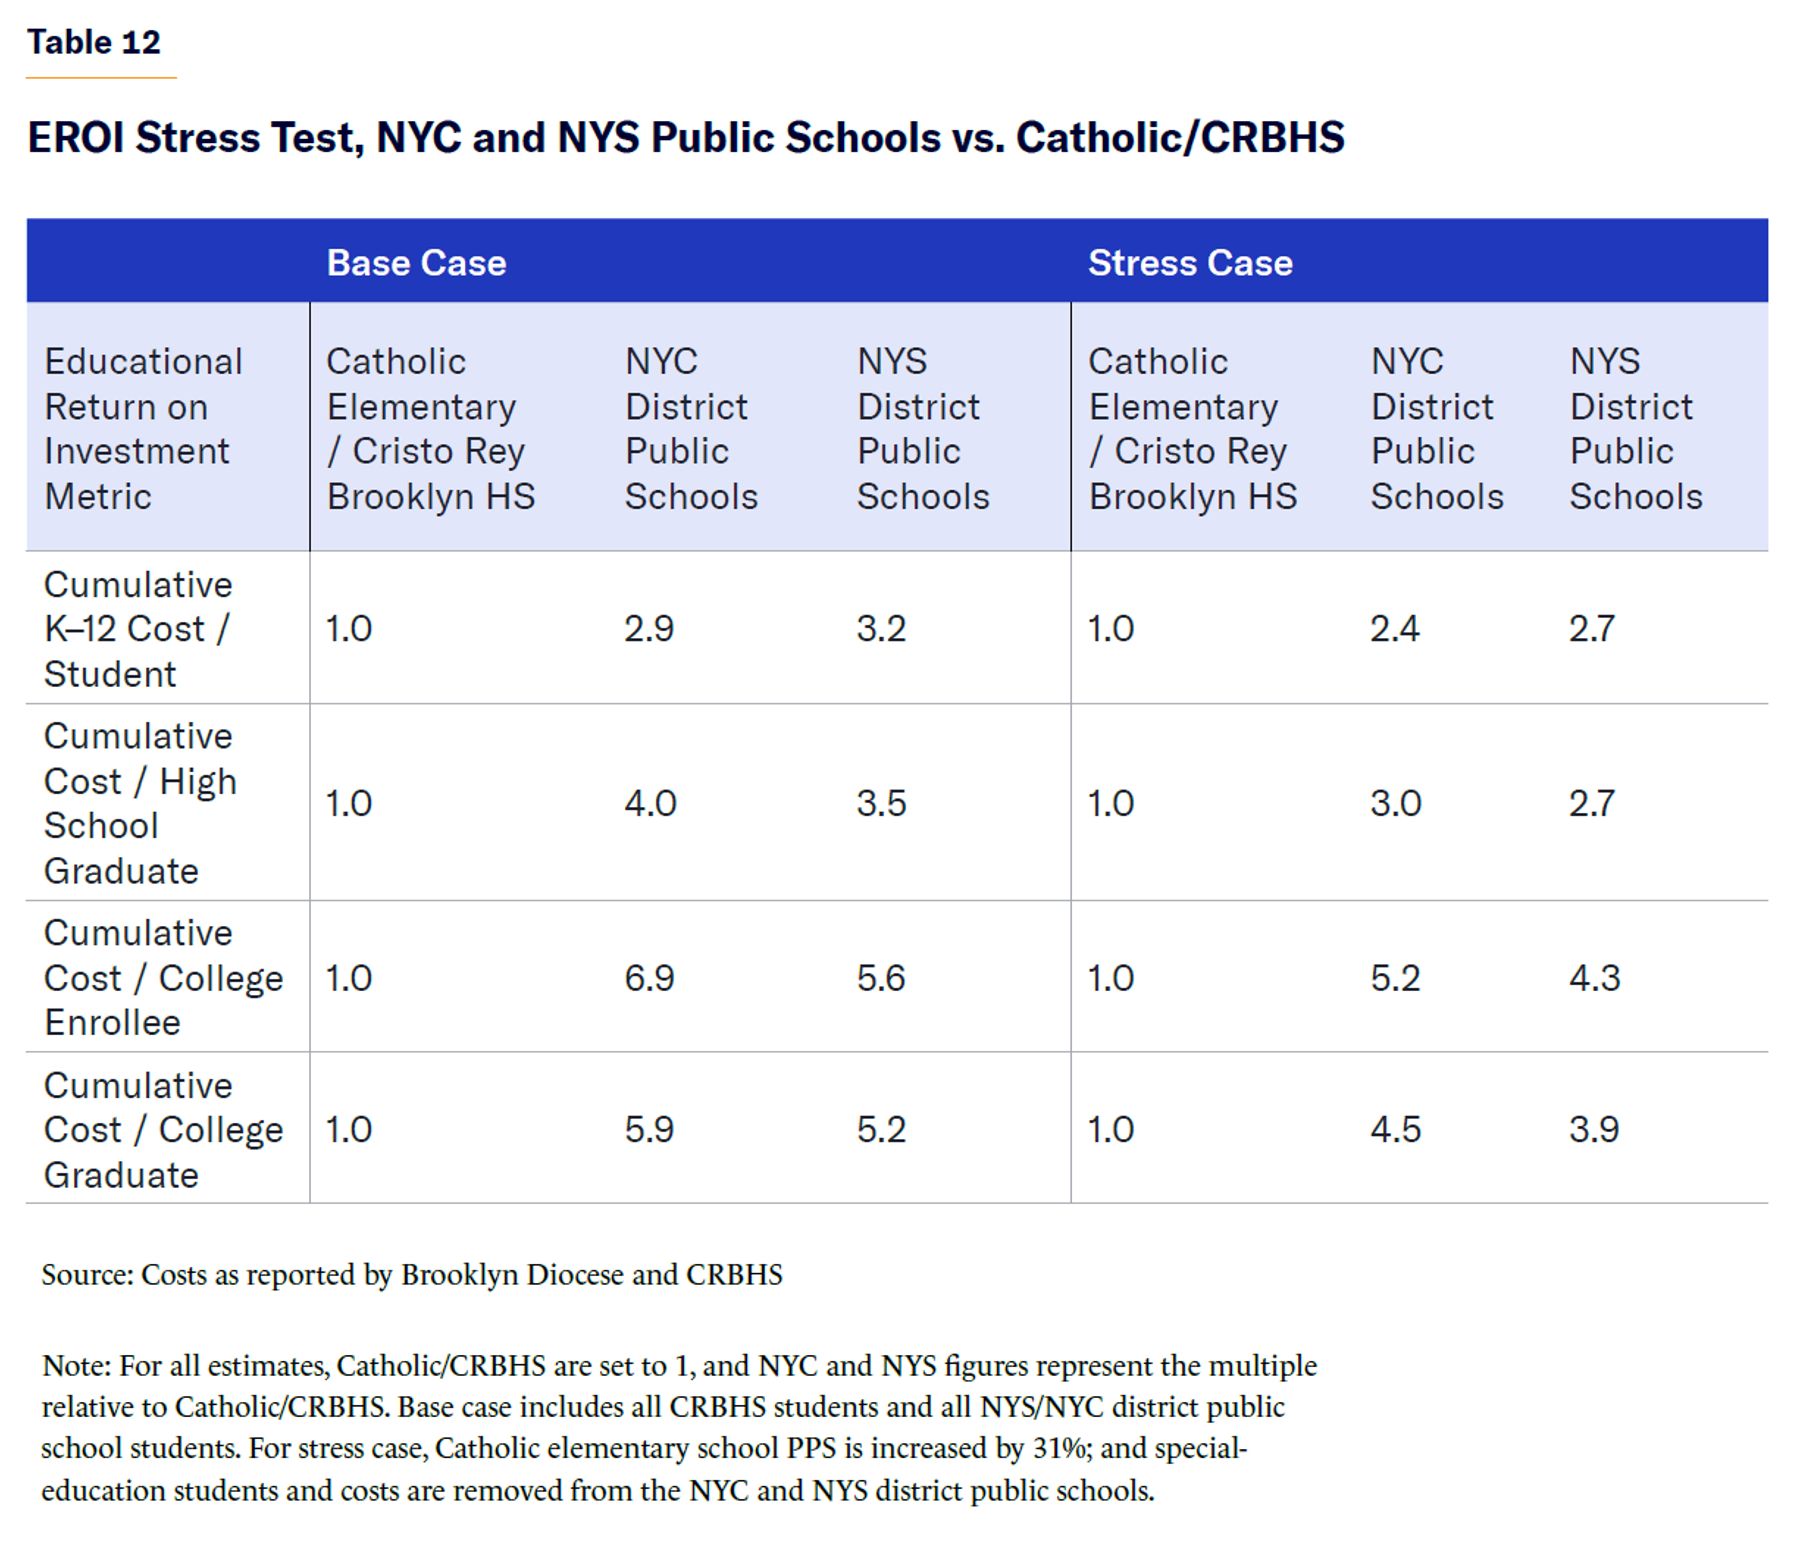
Even in these stress-test scenarios, significant variance occurs among these educational models. The NYC and NYS public school systems spent four to five times more to produce one college enrollee or graduate than the adjusted Catholic/ Cristo Rey alternative (vs. spending five to seven times more in the baseline scenario) (Table 12). After removing special-education pupils and related expenditures from the baseline analysis, it still cost the NYC public school system $840,000 (in nominal dollars) to produce a single college graduate from the NYC general-education public school population.
Conclusions and Recommendations
The failures of the nation’s K–12 education system—which have accelerated in the last decade (i.e., since before Covid)—have been well documented. What has been less understood is just how much we have spent in return for this widespread educational dysfunction.
The initial motivation for this analysis was to provide a more detailed perspective of the relationship between finances and academic outcomes in the K–12 education system. In doing so, this study also aimed to provide good-faith education advocates and stakeholders of all stripes with a valuable tool to identify systems and solutions that are working, as well as to sharpen the case for reform.
Results of this analysis, however, suggest that the challenge is more profound than originally suspected. It is difficult to reconcile, for example, how the vast resources spent on New York K–12 public schools produce such a meager return—as measured by high school and college completion rates—for students and taxpayers alike. Whatever other hardships confront today’s public school systems, a lack of resources does not appear to be one of them.
- Annual PPS statistics show that it is tremendously expensive just to keep the schoolhouse doors open in NYC and NYS public schools. For K–12 for the 2013–17 high school cohort examined in this report, NYC spent nearly $250,000 per student (nearly $400,000 in current dollars, with such expenditures even higher for more recent students, since the growth in education expenditures has far outpaced the rate of overall inflation).[32] Those figures pale in comparison with how much NYC spends when factoring in the academic achievements of its students:
- The cost per college graduate in NYC public schools was $1 million in nominal dollars—four times higher than the average per-pupil K–12 cost. The cost per college enrollee was three times higher.
- Excluding NYC special-education students and expenditures from the overall district public school enrollment, spending per college graduate still exceeded $800,000.
- When considering low-income students only, these costs were 3.8–6 times higher, with nearly $1.5 million ($2.2 million, 2025$) in spending required to produce one college graduate from the low-income cohort.
- NYS as a whole fared better, though not by much, spending 3.1 and 5.4 times more per low-income student to generate college enrollees and graduates, respectively.
- Even as NYC public high school graduation rates began a sharp uptick in 2013–17, NYC spent nearly two times more per high school graduate as it did per student.
- The difference in EROI performance between the NYC and NYS public school systems and one NYC private school alternative was enormous. The private school model yielded:
- Nearly six college graduates for the same funding as NYC district public schools required to produce a single college graduate
- A college graduation multiple (CGM) of five times relative to NYC district public schools, even with special-education students removed from the population
- A CGM of approximately nine times when comparing low-income student segments
- Similar multiples relative to the NYS public school system
All these factors strongly suggest a much more economically efficient and pedagogically effective alternative than the traditional public school system in at least one large metro and statewide area. Appendix 1 summarizes the EROI metrics and multiples across the various cohorts and scenarios in this report.
The magnitude of the disparities between, on the one hand, the public school system’s inputs (i.e., PPS), EROI matriculation and graduation outcomes and, on the other hand, different educational models (public and parochial), should promote even greater urgency among educators, scholars, policymakers, and the public to address the stubborn plight of the K–12 education system as it exists today, especially given the disproportionate disadvantage to the most vulnerable members of society.
New York City and State, along with other jurisdictions, should not require taxpayers to throw more good money after bad for education. States and municipalities should cease any new public initiatives to further expand the role of government in early education until it can conclusively demonstrate that it can fix what is already broken.
To facilitate needed reform, local and state governments, school districts, charter management organizations, independent school operators, and other education gatekeepers and advocates should capitalize on the diagnostic foundation and tools offered by the EROI framework. Recommended actions include:
- Collection, retention, and publication by school system operators and overseers of a wider and deeper universe of relevant data, including enhanced transparency and accessibility
- Broader analysis of other cities and school systems (e.g. charter, independent, faith-based/ secular, home schooling)
- Larger sample sizes, including both student population and time periods
- More granular and extended variables and outcome metrics (e.g., standardized test results, two- vs. four-year higher-education tracks, postgraduate outcomes)
- Assessment of indirect and post-education societal cost-benefits, correlated with differing educational outcomes
- Investigation, assessment, and explanation of outcomes within and across various systems and models—technical, economic, demographic, curriculum and programming, culture, faith-based/values-driven, standards, and student/family mix
Acknowledgements
The author gratefully acknowledges the contributions of the many individuals at the Manhattan Institute who provided valuable feedback and guidance throughout the research, development, and publication of this paper. In particular, the author thanks senior fellow and director of cities John Ketchum for his project advocacy and support, senior fellow Ray Domanico for his critical guidance, insights, and subject-matter expertise, and MI intern Reissy Catu for her research and analytical support during the pivotal later stages of this project.
The author also thanks Cristo Rey Brooklyn High School, the Cristo Rey Network and the Diocese of Brooklyn and Queens for access to data and the institutional support that made this effort possible, including several key individuals at each of those organizations for their unwavering encouragement throughout this process.
About the Author
William Henson is the President Emeritus of Cristo Rey Brooklyn High School. He has been engaged with the Cristo Rey Network since 2008, serving on the board of trustees and in senior leadership roles at both Cristo Rey New York High School and Cristo Rey Brooklyn High School. He was President of Cristo Rey Brooklyn for more than a decade.
Previously, Bill spent over 30 years in financial services, including as a senior investment banker with Citicorp Securities and Putnam Lovell Securities. At Putnam Lovell, he held positions of Chief Operating Officer, Head of Capital Markets and member of the Board of Directors. He was responsible for the creation and development of Asset Management Finance, launched in 2003 and later acquired by Credit Suisse at a valuation of nearly $500 million. In his last position at Citicorp, he was Managing Director and Industry Head in the Corporate Finance Group.
Bill holds a BA from Union College in Schenectady, New York and an MBA from New York University’s Stern School of Business.
Appendix 1
EROI Analysis: Summary Results
K–12 Spending per Pupil
K–12 Spending per High School Graduate
K–12 Spending per College Enrollee
K–12 Spending per College Graduate
Appendix 2. Data Limitations
Due to the lack of publicly available information for a few key variables, certain assumptions, adjustments, or proxies have been used:
- College enrollment rate, New York State district public high school graduates, all students and low income; estimated totals equal the sum of:
- NYC district public high school graduates reported college enrollment rates (see n. 16); plus
- Total NYS high school graduates less NYC high school graduates times national college enrollment rates (see n. 17).
- College completion rates, NYC and NYS high school graduates: Defined as the estimated number of NYC and NYS public high school graduates to complete college, either two- or four-year, within six years of high school graduation and 10 years of high school inception; based partly on the national results from the National Student Clearinghouse (NSC) High School Benchmark Reports.[33] To test the reasonableness of employing national data as a tool to credibly estimate NYC and NYS results, the following comparisons and calculations were studied or conducted:
- The Pell Institute’s 2024 Higher Education Indicators Report (see n. 24) reported an estimated 16% B.A. attainment nationally by age 24 of students from the lowest family-income quartile and all secondary school types; represents a three-year moving average through 2022. In the 2019 Indicators Report, this was 13%, which compares with 15.6% NYC and 17.6% NYS combined associate’s and B.A. degree national completion rates reported by NSC for the period studied and used herein.
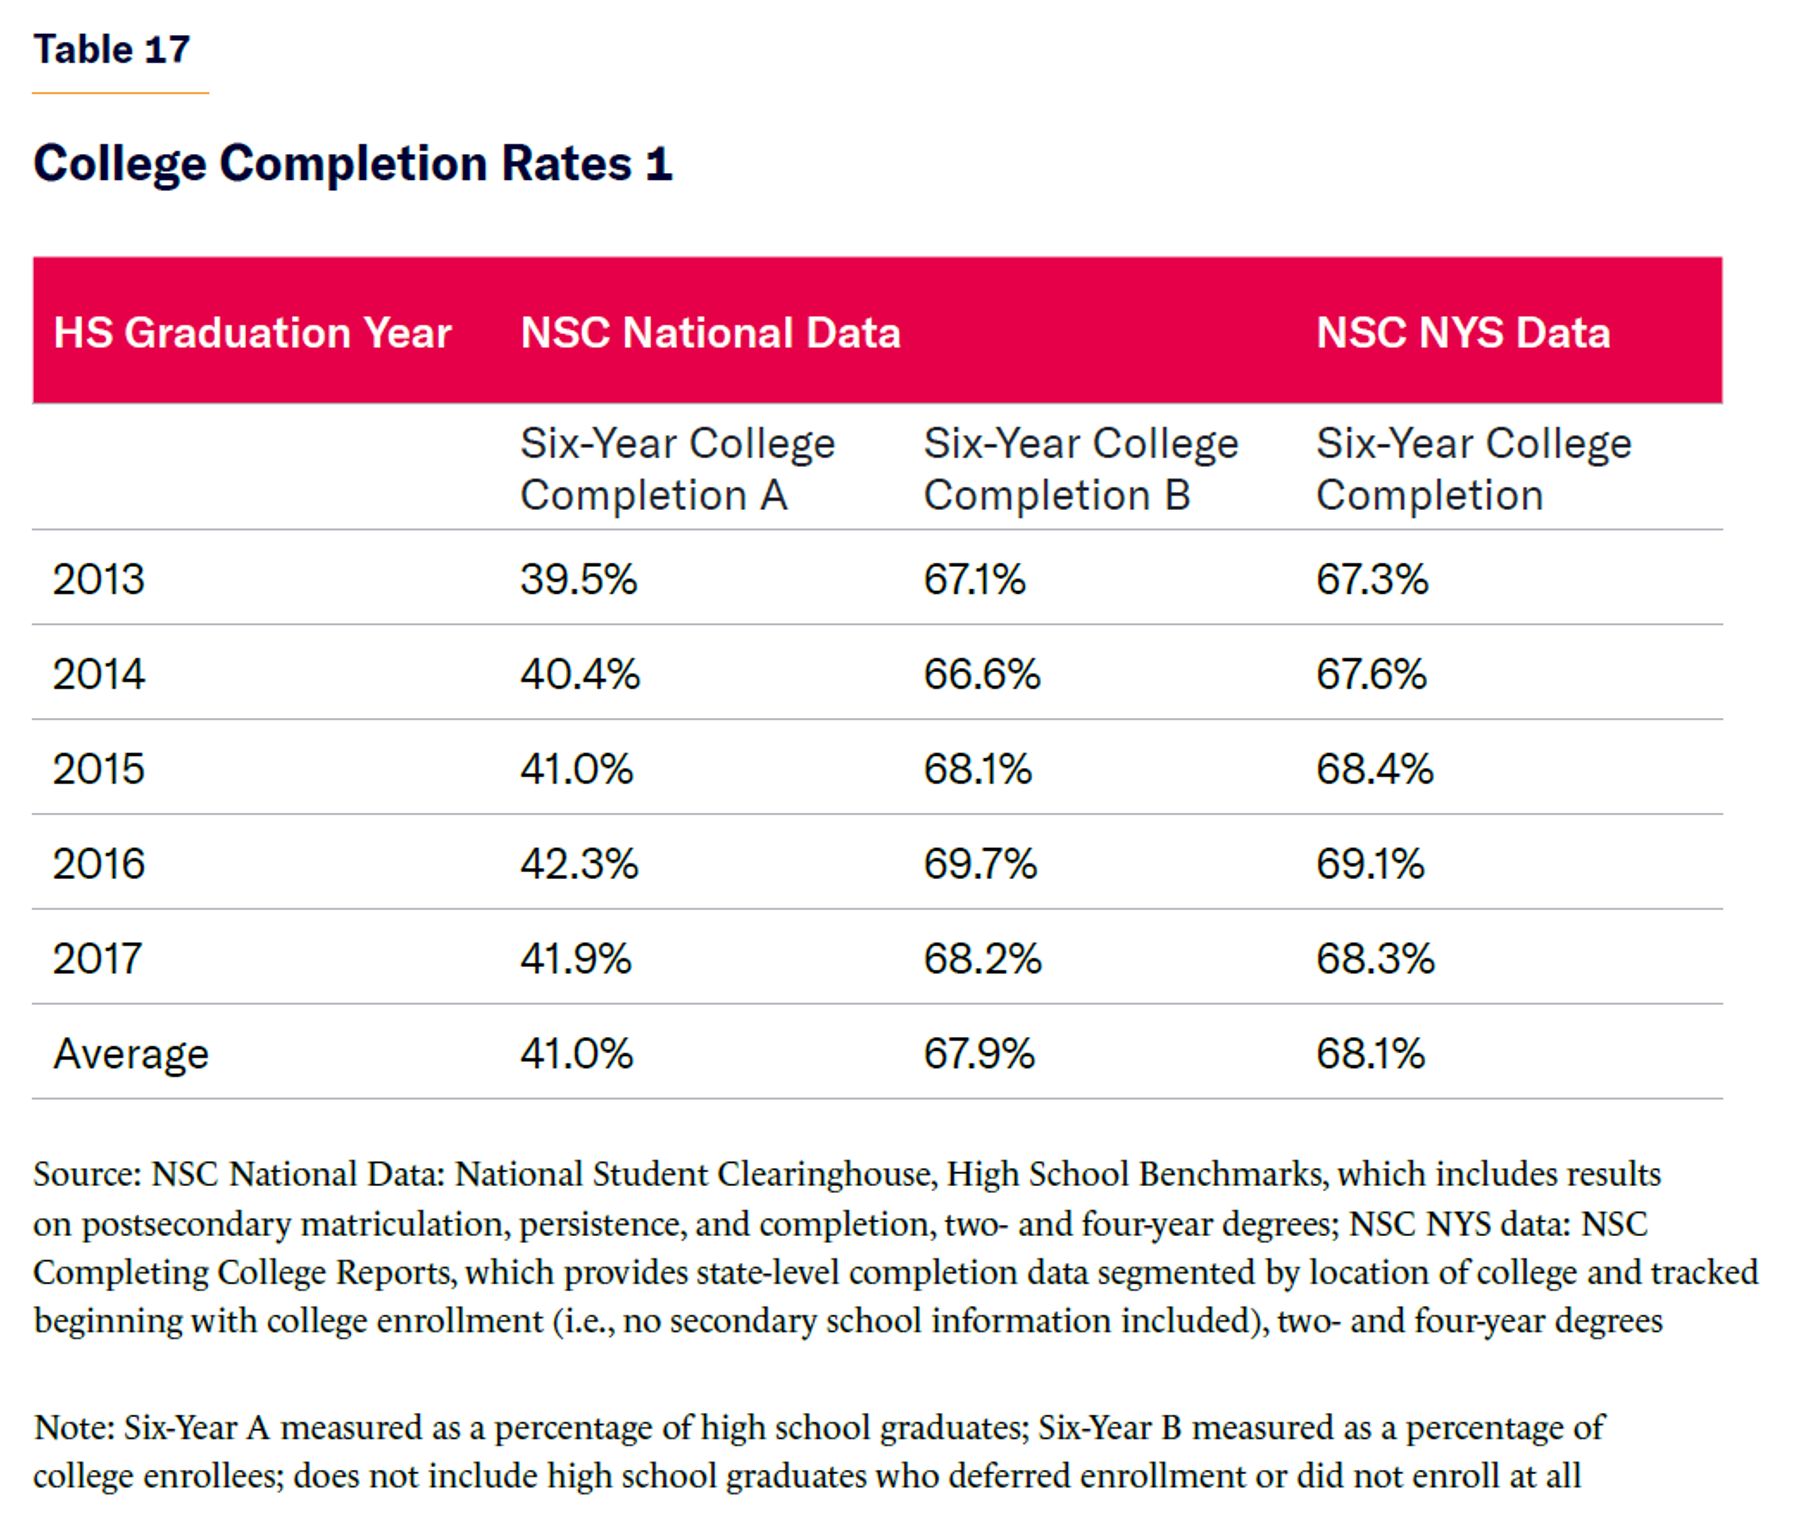
- NSC Yearly Progress and Completion Report tracks college persistence and completion from the time of initial college enrollment (vs. secondary school enrollment or graduation) and provides state-level college matriculation and completion statistics based on college state of domicile, not the student’s home or high school address. However, because a very high percentage of NYS college students are also NYS residents (e.g., during 2014–24, 94%–97% of students in the State University of New York [SUNY] system were NYS residents[34] ) these NSC-reported data serve as a useful, if imperfect, check. Reported higher-education completion rates from these two separate but related sources and methods yielded nearly identical results, as seen in Table 17.
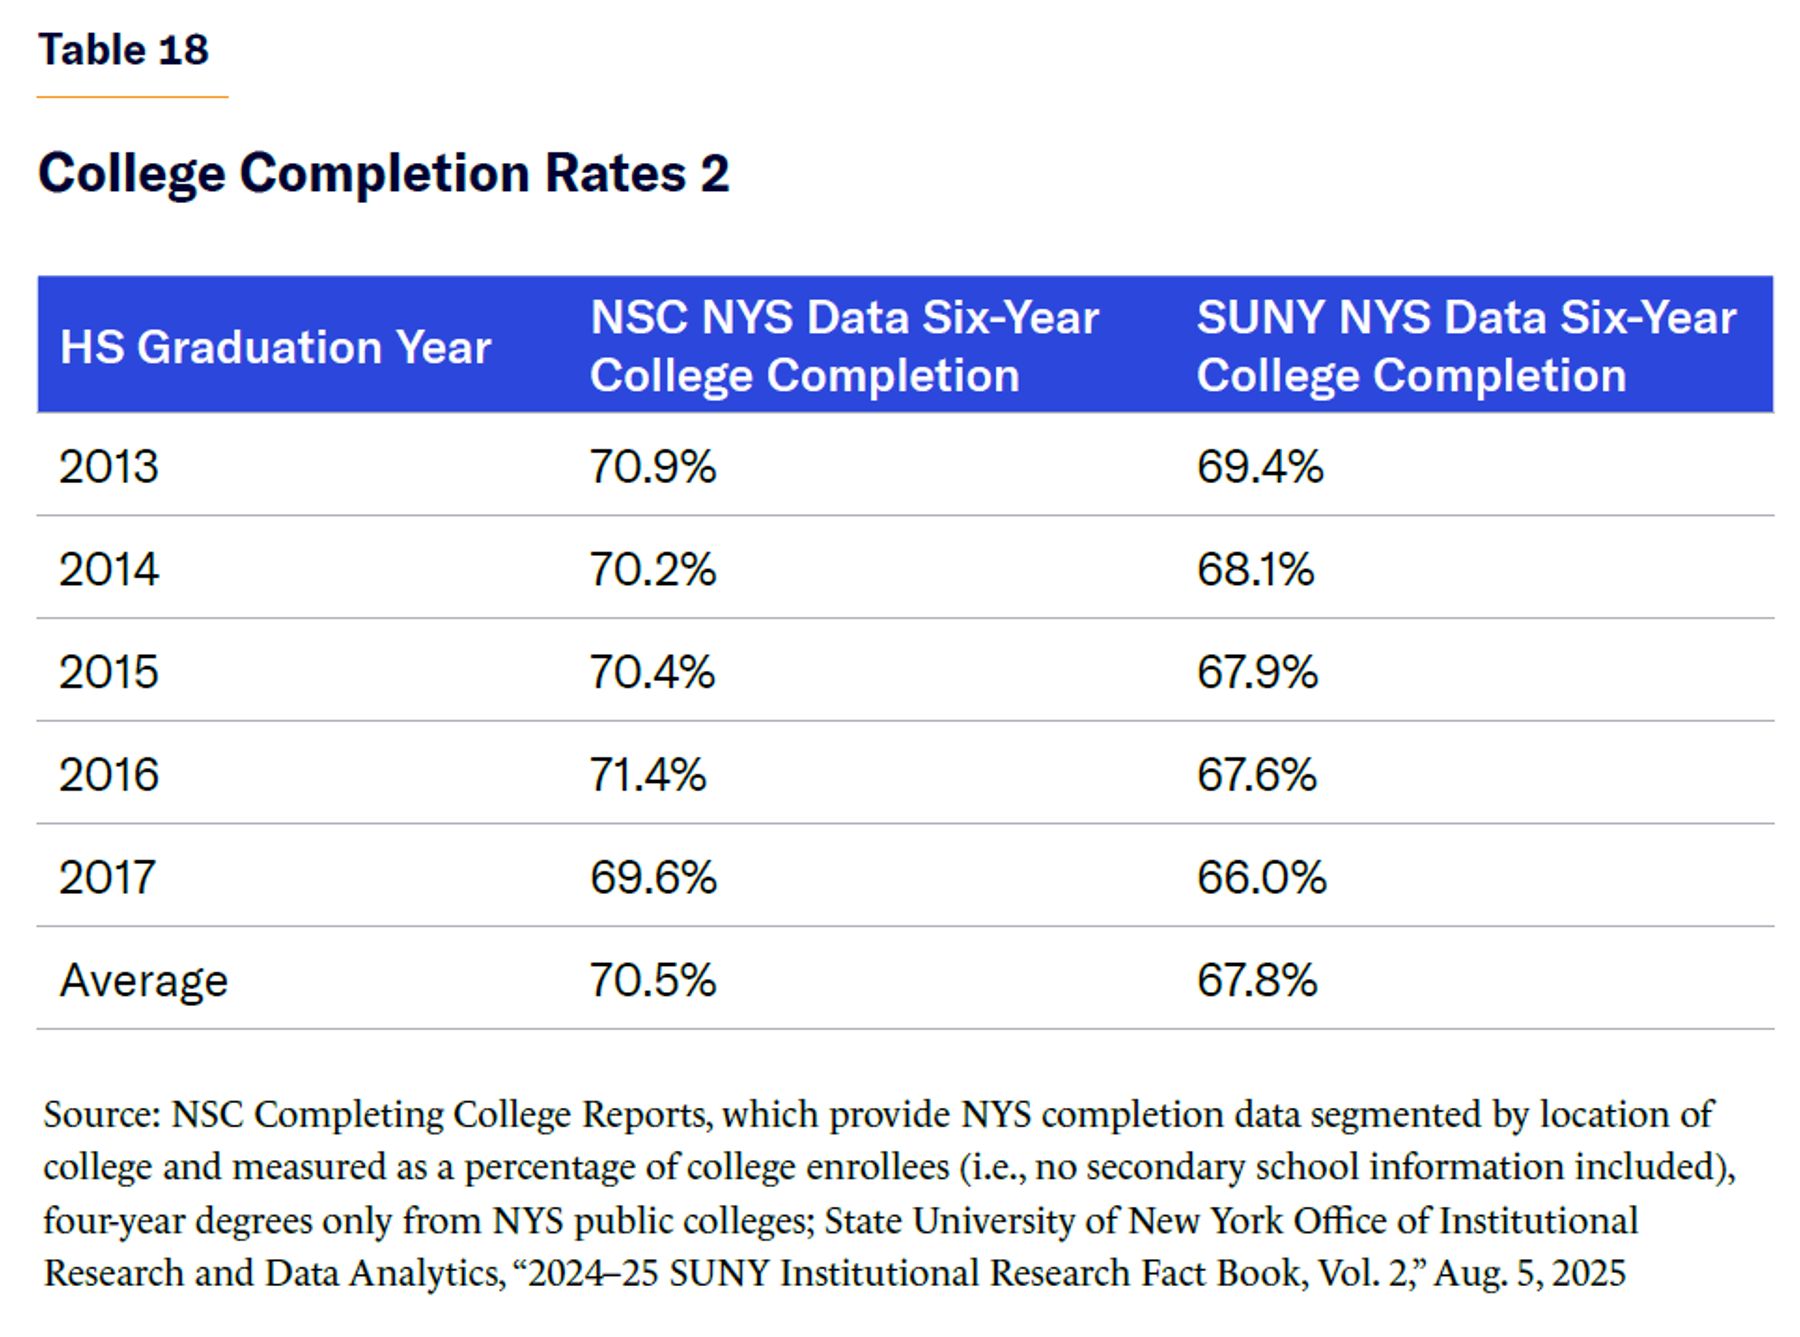
- The SUNY Office of Institutional Research and Data Analytics tracks the college completion rates of its students.[35] Given that over 90% of SUNY students come from NYS, combined with the significant correlation between the NSC reports referenced above, a comparison of SUNY and NSC college completion data was also performed. Here, too, were similar results, as evidenced in Table 18. This comparison includes only B.A. attainment, since SUNY’s tracking of associate’s degree completion is measured over a three-year period while the NSC employs a six-year window.
Endnotes
Photo: Thana Prasongsin / Moment via Getty Images
Are you interested in supporting the Manhattan Institute’s public-interest research and journalism? As a 501(c)(3) nonprofit, donations in support of MI and its scholars’ work are fully tax-deductible as provided by law (EIN #13-2912529).