Defund the Police? New York City Already Did Funding for Law Enforcement, as a Share of NYC’s Budget, Has Long Been Shrinking

Photo by Ertugrul Cingil/Anadolu Agency/Getty Images
Introduction
Since mid-2020, government spending on American police departments has come under intense scrutiny nationwide. The New York Police Department (NYPD) is no exception. Left-wing critics supporting the “defund the police” movement charge that spending on police is crowding out necessary spending on civilian agencies that provide education, housing, health care, and social services. Even moderate Democrats and supposedly neutral news outlets accept the premise that police spending is either too high, relative to the rest of the city budget, or, at minimum, keeping up with the rest of the city budget.
What’s missing from the “defund” argument and even from news sources is context. How large is the NYPD budget, relative to the overall city budget? How has spending on policing changed over the years and decades, relative to the entire budget? How large is uniformed-police staffing, relative to the overall city workforce?
To answer these questions, this paper analyzes four decades of New York City police spending, from the recovery after the 1970s fiscal crisis through the pandemic years of the early 2020s.
This paper puts spending and officer headcount in the context of the overall budget. The paper finds that operational spending on the uniformed NYPD, contrary to conventional wisdom, has shrunk substantially as a share of the city budget since the early 1980s, both in terms of spending and the size of the uniformed-officer workforce.
The Hardening—and Misleading—Conventional Wisdom
The idea that police spending is disproportionately large, and thus consumes resources needed for other spending, predates the urban turmoil and defund-the-police movement that resulted from the murder of George Floyd by Minneapolis police officers on May 25, 2020. On April 30 of that year, a coalition of nearly 100 New York advocacy groups, ranging from the Legal Aid Society to the Riders Alliance transit group, called on then-mayor Bill de Blasio to cut the police budget. “Historically, city government has spent far more on police than on public health, homeless services, youth services and other vital agencies,” the groups wrote in a public letter. “We urge you to realign budget priorities with the understanding that safety for all is possible only when there is strong public health infrastructure, housing for all, quality education, environmental justice, food justice, transportation justice, [and] disability justice.”[1]
Nearly three years later, in early 2023, progressive city council members carried this line of reasoning into a new budget season. The city council’s progressive caucus, comprising 19 of the council’s 51 members,[2] says that as a statement of principle, it will “do everything we can to reduce the size and scope of the NYPD … and prioritize and fund alternative safety infrastructure that truly invests in our communities.”[3] Progressive council member Tiffany Cabán of Queens, juxtaposing library spending against police spending, observed that “the mayor is trying to cut $75 [million] from libraries over the next four years.… $75 [million] is 0.013[%] of the NYPD’s operating budget for just one year.”[4]
Supposedly neutral news sources contribute to the perception that policing is a substantial share of New York City’s budget, preventing the city from investing in education and social services. For example, the Financial Times published a chart (Figure 1) on January 6, 2023, implying that police spending overwhelms other major aspects of the New York City budget.[5]
Figure 1
Alleged Overfunding of NYPD Compared with Social Services

This rhetoric appears to have an impact on public policy. Even moderate Democrats who, historically, might have called for more policing amid rising crime, have shied from suggesting an increase to the police budget. For example, NYC mayor Eric L. Adams, despite his anticrime message, has not proposed adding new police officers to the city’s ranks.[6] Yet the rhetoric does not fit reality.
Citywide Spending Trends Up, Up, Up
Over the four decades since New York City began emerging from the fiscal crisis of the 1970s, during which a state board temporarily took control of local finances, NYC’s municipal budget rose consistently, far outpacing inflation (Figure 2). In fiscal year 1980, NYC spent about $13.5 billion, or $47.9 billion in inflation-adjusted equivalents. In fiscal year 2023, the city spent $107.6 billion annually, representing an increase of 124.5% in real terms. Counting only spending funded by city taxpayers (that is, subtracting federal and state grants), city spending in 1980 was $32.2 billion in today’s dollars; by 2023, it was $78.8 billion, or an increase of 144.6% from 1980 levels.[7]
Figure 2
NYC Municipal Spending (FY1980–2023)

Citywide Workforce Also Up, Up, Up
Unsurprisingly, as city spending has gone up, the size of the city’s workforce has increased, as well. Spending on “personal services” such as wages and benefits has long been the biggest single item in the city budget, constituting about half of spending.[8]
In 1980, NYC employed 195,563 full-time workers. In 2022, the figure was 282,498. Though the 2022 figure was down from the all-time highs of 2019 and 2020—when full-time employment topped 300,000—it still represented growth of 44.5% over four decades (Figure 3).[9] Though the full FY2023 data are not yet available, additional data show the city workforce continuing to decline in FY2023 because of high vacancy levels after pandemic-era resignations and retirements.[10]
Figure 3
Number of Full-Time City Employees (FY1980–2022)

City Spending: Growth Uneven, but Favors Education
City spending has not risen uniformly (Figure 4).
By far, the fastest-growing category of spending is public education. In 1980, inflation-adjusted spending on education (including on the City University of New York) was $10.8 billion. By 2021, such spending was $31.7 billion, representing real growth of 193.5%. By contrast, spending on the uniformed services—fire and sanitation, in addition to police and corrections—grew from $5.3 billion to $12 billion, which is growth of 126%. This means that the growth in spending on uniformed services is in line with overall city spending growth (including federal and state grants), but the growth is still slower than city-funded spending growth (not including such grants).[11]
Spending on health and social services (not including education), started from a much higher base than either education or uniformed services. In 1980, spending on this category was $13.8 billion in inflation-adjusted dollars. This spending grew by 56.8%, to $21.6 billion by 2021. (None of these figures includes pension or other benefits spending, but only current operations.)
Figure 4
City Spending by Category (FY1980–2021)

Because of the city’s changing spending priorities over the long term, the city’s four uniformed services have only maintained their share of the entire city budget, at 11% in 1980 and 11.2% in 2021 (Figure 5). By contrast, the share of the budget consumed by education has grown from 22.5% to 29.6% of the overall city budget, or 31% growth in share.
Figure 5
Share of City Budget by Category (FY1980–2021)

Policing: A Shrinking Share of City Services
Though spending on the city’s four uniformed agencies constitutes the same share of the city budget as four decades ago, police spending has shrunk slightly (Figure 6). In 1980, the city’s NYPD budget (again, not including benefits) was 5.2% of the overall city budget; by 2022, policing constituted just a 4.9% share.
Figure 6
Police-Operations Spending (FY1980–2022)

The impact of a smaller police budget in the context of the overall city budget is clear from the size of the city’s policing workforce. Though the city’s workforce (including unarmed civilian police workers, such as school-safety agents) has grown over the past 40 years, the uniformed police department has not kept up and, in recent years, has seen significant relative shrinkage.[12]
The city reached a high in police staffing at the turn of the millennium (Figure 7). In 2000, the city’s 40,285 uniformed police officers represented a 49.7% increase over the 26,913 officers in 1980. (This 1980 figure includes the then-separate public housing and transit police departments. After 1994, the departments merged.) By 2022, the city’s uniformed headcount of 34,825 represented a 13.6% drop from that peak. Uniformed police constituted just 12% of the city workforce in 2021, not only significantly below the 16.1% high reached in 2000 but also significantly below the 13.8% share of the city’s overall workforce in 1980.[13]
Figure 7
Full-Time Uniformed Police Workforce (FY1980–2022)

The start and endpoints of police spending and staffing over the past four decades do not tell the whole story, however. The endpoints mask significant volatility—volatility that tells a story of changing political and policy means, priorities, and goals.
In 1980, the fact that operational spending on police was 5.2% of the city budget was not the city’s preferred or optimal outcome. It was the result of a half-decade of job cuts as the city grappled with its 1970s fiscal crisis and the corresponding lack of autonomy over its own budget.[14] In the early 1980s, as Mayor Edward I. Koch (1978–89) gradually brought the city out from under state fiscal control and rebuilt the city’s workforce, police spending increased dramatically as a share of the city budget, to 6.4% by 1988. The police department further expanded as a share of the city budget in the early to mid-1990s, as Mayors David Dinkins (1990–93) and Rudolph W. Giuliani (1994–2001) both successively further expanded the police force to cut crime.[15] Police spending increased commensurately, hitting a record high of 8.8% of the city budget in 2002.[16]
Since then, police spending has fallen. Under Mayors Michael R. Bloomberg (2002–13) and Bill de Blasio (2014–21), police spending fell, albeit for different political and policy reasons under each mayor. Bloomberg said that more attentive and efficient management would reduce the need for officers.[17] De Blasio kept the force lean partly as a reflection of his antipolice campaign rhetoric in 2013, the year he won office, and partly to fund his other priorities, including expanded prekindergarten, homeless-services, and social-services (including broader access to mental health care) spending. As NYC voters have long been attentive to crime rates, both mayors implied by their actions that record-low crime reduced the need for police officers.
Police Retirement Benefits in Context of City Benefits Budget
When one looks at retirement and other benefits for police officers in addition to day-to-day operational spending, the picture changes significantly in terms of percentage of citywide retirement benefits expended but not in terms of the long-term trend.
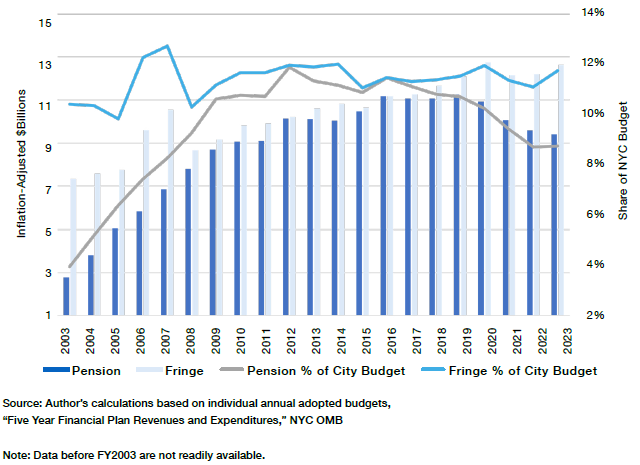
Since 2003, across all departments, the amount of money that the city spends each year on nonwage benefits for workers and retirees has risen substantially (Figure 8). In 2003, the city spent nearly $2.8 billion (in inflation-adjusted dollars) on pensions; by 2023, the figure was $9.4 billion, constituting 8.7% of the entire city budget, up from 3.9% two decades earlier. In 2003, the city spent $7.3 billion on fringe benefits (mostly health-care benefits) for workers and retirees; by 2023, the figure was $12.6 billion, or 11.7% of the city budget, up from 10.4%.[18]
Figure 8
Pension and Fringe-Benefit Costs as Share of City Budget for All Departments (FY2003–23)
Against this backdrop of citywide higher spending, the trend of spending on police pensions and fringe benefits is mixed. The city has long favored uniformed workers over civilian workers in its retirement-benefits structure. Most uniformed workers can retire with half-pay (including capped overtime) after 22 years, with no minimum-age requirement, a far more generous plan than civilian workers receive; teachers must work 27.5 years to get a half-pay pension, for example, and generally must reach the age of 63 to receive full retirement benefits.[19] For that reason, uniformed workers’ pension and fringe benefits have long constituted a greater share of the city’s pension and fringe payouts (Figure 9).
Figure 9
Police Pension and Fringe Payments, as Percentage of Citywide Payments (FY2003–23)

But this phenomenon is not new. Nor are the city’s retirement- and health-benefits costs for police, taken together, growing as a share of the citywide benefits budget. In 2003, for example, police pensions constituted 39.5% of citywide pension payments. In 2023, such payments constituted 28.1%. In 2003, fringe benefits for police constituted 27.6% of benefits; in 2023, they constituted 31%.
Conclusion: Correcting the Factual Record
Conventional wisdom on the political left and center, and even on the part of neutral news organizations, holds that police spending, as a large and growing portion of New York City’s municipal budget, is preventing the city from spending and investing in other areas, particularly education, housing, and social services.
No matter what one’s position on police spending, this conventional wisdom is wrong as a factual matter. As a share of the city’s budget, operational spending on the NYPD is at a record four-decade low, and the number of uniformed police officers has steadily fallen for two decades. The uniformed ranks have fallen even as NYC’s population continued to increase, from barely 8 million at the turn of the millennium to between 8.5 and 8.8 million by 2020.[20]
Though spending on police retirement and other employee benefits is high, this level of spending is not new or growing and is largely a result of political decisions at the state and city levels to offer uniformed workers retirement packages after 22 years of service. (State law governs local pension benefits, though not local health benefits.) To the extent that social services other than education have fallen as a share of the city budget (though not in inflation-adjusted real terms), the city has diverted that money to education, not to policing.
The city can use these data to make political and policy decisions. With operational police spending having fallen to just 4.9% of the city budget, even lower than it was in 1980, the city must now ask whether the police force is too lean to keep crime near pre-pandemic record levels, even under a pro-policing mayor. Relatedly, the city and the state must reconsider the retirement packages that it offers uniformed employees, as high and growing spending on pension and health benefits threatens all future city spending on current operations, policing and otherwise.
Endnotes
Photo by Ertugrul Cingil/Anadolu Agency/Getty Images
Are you interested in supporting the Manhattan Institute’s public-interest research and journalism? As a 501(c)(3) nonprofit, donations in support of MI and its scholars’ work are fully tax-deductible as provided by law (EIN #13-2912529).