Americans for Meritocracy

Photo: ferrantraite / E+ via Getty Images
Introduction
Last summer, in Students for Fair Admissions v. Harvard (SFFA), the United States Supreme Court issued a blockbuster decision eliminating affirmative action in higher education. In ending the nation’s controversial 45-year experiment with race-conscious admissions, the SFFA majority emphasized how affirmative action had evolved to discriminate against certain “overrepresented” minorities (Asian students), who did not receive a boost on account of their race, in favor of other “underrepresented” minorities (black and Hispanic students) who did:
College admissions are zero-sum.… [A] benefit applied to some applicants but not to others necessarily advantages the former group at the expense of the latter … [such that] the guarantee of equal protection cannot mean one thing when applied to one individual and something else when applied to a person of another color.[1]
The Court’s ruling in SFFA may be applied to the consideration of race in other areas, including in admissions at the nation’s service academies and selective public high schools and in employment and federal contracting, all of which are being actively litigated in lower courts.[2] Amid this new legal and political upheaval over the future of affirmative action, many progressives have sought to delegitimatize SFFA on two grounds.
First, some have described the case as conservative judicial activism. The narrative goes something like this: three new justices joined the court and abandoned precedent so that they could impose their extreme and narrow conservative policy preferences on the public. Arthur Coleman, a cofounder and managing partner of EducationCounsel, put it this way: “You might say, ‘Gee, it was only seven years ago that the University of Texas prevailed on these very same [affirmative action] issues. What’s the difference?’ In large part, it’s the composition of the Court.”[3] Not to be outdone, President Biden indicted the decision as extreme, saying immediately after the ruling was handed down that “this is not a normal court.”[4]
Second, many affirmative action advocates, especially in the media, insist that most Americans (including most Asians) favor affirmative action. Therefore, they say that SFFA was “out of step” with the public’s support for diversity in higher education.[5] For example, in the very same news conference where he blasted SFFA, President Biden said: “Take a look at how [the court has] ruled on a number of issues that have been precedent for 50, 60 years. That’s what I meant by not normal. …Across the board, the vast majority of the American people don’t agree with the majority of decisions the court is making.”[6]
This report marshals new evidence to show that both criticisms miss the mark.
Drawing on two survey experiments from the 2022 Cooperative Election Study (CES),[7] we show that affirmative action was politically vulnerable before SFFA. Specifically, we argue that the SFFA ruling strongly aligns with growing consensus that merit should trump diversity in university admissions, particularly when race-conscious admissions policies harm Asian students.
Specifically, our survey data show that:
- On average (across several versions of an affirmative action question), seven in 10 Americans said that they opposed race-based admissions in higher education.
- It was important that SFFA focused on discrimination against Asian students. Respondents who were told that affirmative action harmed Asian (rather than white) students were more likely to oppose racial preferences in university admissions.
- The discrimination against Asian students that was revealed in the SFFA litigation made Democrats, in particular, more skeptical of affirmative action: fewer than half of Democrats supported affirmative action once they learned that Asian students would be disadvantaged. In contrast, 68% of Democrats who were told that affirmative action would disadvantage white students said that they supported maintaining racial preferences.
- In an experiment where survey respondents played the role of a medical school admissions officer, the vast majority made admissions decisions based on race-neutral, merit-based criteria. Specifically, when asked to choose between two competing applicants (one Asian, one black), most chose the applicant with better academic qualifications, even if it came at the expense of maximizing diversity in the medical school. While respondents do value racial diversity at the margins, we find that they do so only when applicants have relatively comparable academic qualifications. However, in practice, universities’ rarely implemented race-based admissions policies this way.[8]
In sum, despite what progressive critics have argued in their attempt to delegitimize the decision, SFFA was not an example of the Court simply placating a small slice of the electorate (conservative whites). Rather, we show that SFFA’s concern for discrimination against Asian students reflects a wide degree of consensus from across the political spectrum. That consensus is driven by a public, including most Democrats, that prioritizes merit-based, rather than diversity-maximizing, admissions criteria.[9]
How Affirmative Action Is Framed Matters
Issue framing matters in politics. Research has long shown that the way an issue is framed can lead to significant policy change.[10] As one of us has written previously, “every issue can be understood, or defined, in multiple ways. Issue definition draws attention to some dimensions of an issue rather than others, [helping determine] which values, goals, and ideas are understood to be germane to a policy choice … when contemplating an issue.”[11]
In recent years, the debate surrounding affirmative action in American higher education has changed considerably. In the past, legal and political challenges to the practice focused on the harms to white students (see, e.g., Bakke, 1978; Hopwood, 1996; Grutter and Gratz, 2003; Fisher, 2013 and 2016). More recently, the issue has been framed to focus on discrimination against Asian applicants (e.g., SFFA, 2023).
Did this reframing of the affirmative action debate weaken public support for racial preferences? More specifically, does public support for affirmative action tend to decline when Asians (rather than whites) are shown to be disadvantaged by race-based admissions policies? To find out, we conducted a framing experiment on the most recent CES, a large national survey of Americans carried out in November 2022 (before the SFFA ruling).[12] In our first experiment, survey respondents were assigned to one of four possible versions of the following question (the bold font indicates the conditions that were randomly varied):
Some people say that {because of past discrimination / because it is important to have diversity on college campuses}, Blacks should be given preference in university admissions. Others say that such preference is wrong because it discriminates against {whites/Asians}. What about your opinion—are you for or against preferential admissions policies for Blacks?
About half the respondents were told that critics of affirmative action worry that these policies discriminate against Asian students, while the other half were told that such policies would hurt white students. We found no evidence that the first part of the question (which provided different rationales for affirmative action) had any impact on the results; so to keep things as straightforward as possible, we focus on the results of the latter experiment here. Although all the results (broken out by racial subgroup) are shown in the Appendix, we highlight only the headline findings here in the body of the report.
Three main findings stand out.
First, on average (across the different experimental conditions), most respondents (71%) indicated that they oppose racial preferences (just 29% support them).[13] Unfortunately, we do not have large enough samples of racial-minority respondents to make reliable comparisons between minority subgroups. Therefore, we pool, or combine, responses from non-Hispanic whites (N=501), Asians (N=19), and Latinos (N=83), in order to compare them with responses from non-Hispanic blacks (N=79), since research shows that blacks hold decidedly more positive views of affirmative action than do other racial/ethnic subgroups.
We find little difference in support for affirmative action between whites alone and the pooled group of whites, Asians, and Latinos. When considered alone, 77% of non-Hispanic whites oppose the use of racial preferences in college admissions, compared with 75% of the white, Asian, and Latino grouping (across all the experimental conditions). We have fewer than 100 black respondents in our sample, but they were far more likely to favor preferences (70% in favor versus just 30% against).
Our second major finding comes from our other framing experiment, which found that respondents who learn that affirmative action policies may harm Asian (rather than white) students are far more likely to oppose racial preferences. That is, we find compelling (and statistically significant) evidence that when Asian disadvantage is emphasized, support for affirmative action craters. In total, support for preferences dropped by 10 percentage points, from 35.4% to 25.6%. Among whites alone, support dropped by 8 points, and among the pooled white, Asian, and Latino grouping, support dipped 10 points (all statistically significant differences).[14]
Third, in order to test the extent to which SFFA was, as critics allege, a “right-wing” ruling that catered to conservative whites, we break out the results by party identification in order to examine how the framing experiment worked on different political coalitions. We were especially interested in whether key elements of the Obama electoral coalition (progressive whites, Asians, and Hispanics) felt cross-pressured by affirmative action policies that hurt Asians (an important and growing member of that coalition).
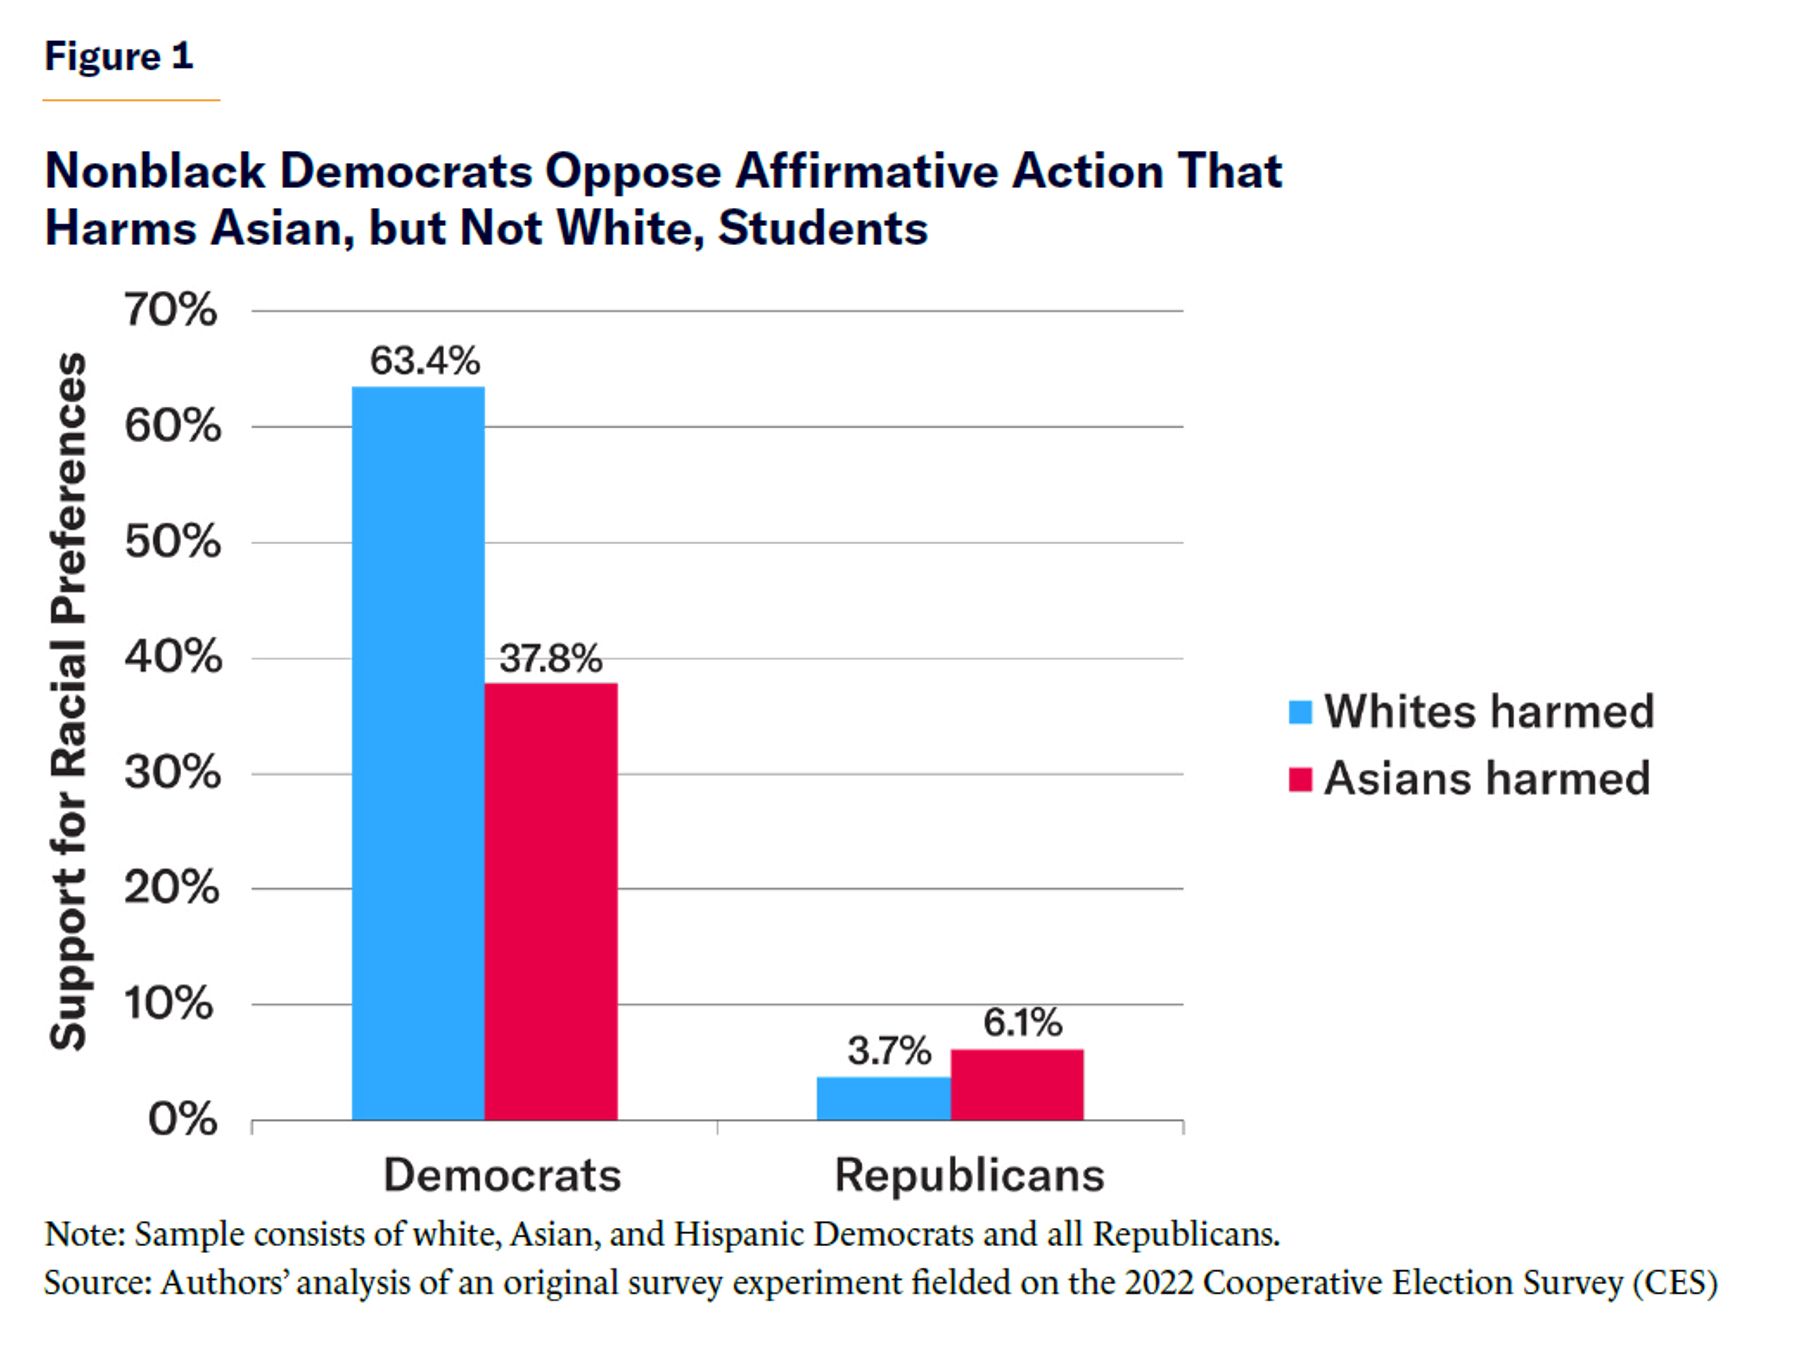
Unsurprisingly, we found strong opposition to affirmative action among Republicans (95%), irrespective of whether Asians or whites were mentioned as the victims. But among Democrats, we witnessed a remarkable crack in the Obama coalition. Specifically, seven out of 10 Democrats who were told that affirmative action disadvantaged whites favored giving racial preferences to black students. But when Democratic respondents were informed about the disadvantages to Asian students, a minority (46%) said that they supported such preferences. Among the nonblack elements of the diverse Obama coalition (progressive whites, Asians, Hispanics), support dried up even more. As Figure 1 shows, 63% of these voters favored preferences that came solely at the expense of white students, but only 38% backed affirmative action when they learned that Asian applicants would lose out.
Suffice it to say that ending affirmative action wasn’t a right-wing affair. Rather, the Court’s evolving affirmative action jurisprudence tracked a shift among nonblack Democratic voters who, once cross-pressured by Asian plaintiffs’ interests, ultimately abandoned support for race-based university admissions (a position in line with most of the nonblack Obama electoral coalition). In sum, our findings show that when affirmative action programs threaten opportunities for Asians (as opposed to whites), most Americans—especially most Democrats—become far less comfortable with using race in admissions decisions.
Americans Want Universities to Use Merit-Based Admissions Criteria, Considering Diversity Only as a Tiebreaker Among Relatively Equal Applicants
When interpreting public opinion surveys, it is important to focus on specific questions that pollsters ask. Question wording is especially important for polling about affirmative action.[15] For example, proponents of the practice often point to polls that show strong support for programs that “help [minorities] get better access” to higher education.[16] Opponents, however, can just as easily find polls that show that most Americans oppose using race as a factor in admissions or hiring decisions.[17]
These findings reveal something important about Americans’ values. Large majorities broadly favor equality of opportunity but not equality of outcomes. Since equality of opportunity seems congruent with universities taking affirmative steps to diversify (another popular value), it’s not surprising that the public responds favorably to abstract questions about “affirmative action.” By contrast, most Americans oppose preferences, because that emphasizes how race-conscious policies intentionally benefit some groups (and harm others) to obtain equal outcomes.
Values, however, are only one part of the affirmative action polling puzzle. Most people do not pay close attention to politics, and thus do not know very much about how complex policy issues—including affirmative action programs—work in practice.[18] To be clear, we are not saying that Americans don’t hold sincere beliefs about what constitutes fairness in admissions policies. But one’s answer to a question about affirmative action depends not only on those beliefs about fairness but also on beliefs about how affirmative action programs actually work. Poll questions themselves, however, can have a strong impact on how respondents understand an issue. As political scientist Terry Moe explains:
Because [Americans] come to any survey with little information, they will be quite sensitive to information contained within the survey itself. …This information determines how the issue is “framed.” And the framing, in turn, influences which (of many possible) values and beliefs get activated in people’s minds, and thus how people respond. …If public opinion is to be well measured on an issue, the issue must be framed with great care. The framing should provide respondents with enough information to give them a good sense of what the issue is about. The information also needs to be balanced, so that respondents are not pushed to see the issue in a positive or a negative light.[19]
We agree with Moe so far as it goes, but we think that measuring public support for affirmative action presents additional challenges, ones that limit the value of conventional survey questions. Affirmative action puts so many competing values—diversity, inclusion, merit, opportunity, and nondiscrimination—directly in tension with one another, that even the most unbiased pollsters will struggle to write balanced questions that clearly convey these trade-offs for an unsophisticated public.
As an alternative, we propose experimental vignettes as a helpful solution.
Our vignettes are modeled after a technique used by political scientists to study voters’ preferences in elections known as “candidate choice survey experiments.”[20] In our vignettes, respondents are asked not to evaluate two competing political candidates but to play the role of an admissions officer and decide between two competing medical school applicants.
Specifically, in our experiment, we told each survey respondent that “a medical school must choose between two candidates who are competing for the final spot in next year’s class of future doctors.” Then we ask the respondents to “carefully review each applicant’s profile before selecting the applicant they would admit.” Importantly, although the applicants’ accomplishments were randomly varied, the specific pair of applicants that each respondent saw always consisted of an Asian applicant and a black applicant (Table 1).[21]
Table 1
Illustration of Applicant Pairings in Medical School Admissions Vignette Experiment
| Pair 1 Example | Pair 2 Example | |||
| Applicant A | Applicant B | Applicant A | Applicant B | |
| Accomplishments: | Accomplishments: | Accomplishments: | Accomplishments: | |
| • 3.8 grade point average (GPA) • Scored better than 90% of applicants on Medical College Admissions Test (MCAT) • Interns for [cancer/ biomedical] research lab • Volunteers at local [animal shelter / food bank] | • 3.5 grade point average (GPA) • Scored better than 65% of applicants on Medical College Admissions Test (MCAT) • Interns for [cancer/ biomedical] research lab • Volunteers at local [animal shelter / food bank] | • 3.8 grade point average (GPA) • Scored better than 90% of applicants on Medical College Admissions Test (MCAT) • Interns for [cancer/ biomedical] research lab • Volunteers at local [animal shelter / food bank] | • 3.7 grade point average (GPA) • Scored better than 85% of applicants on Medical College Admissions Test (MCAT) • Interns for [cancer/ biomedical] research lab • Volunteers at local [animal shelter / food bank] | |
| Personal: | Personal: | Personal: | Personal: | |
| • Asian American • Male • Middle-class background | • Black/ African American • Male • Middle-class background | • Asian American • Male • Middle-class background | • Black/ African American • Male • Middle-class background | |
The experiment was designed to test whether, and when, Americans believe that diversity should trump merit in medical-school admissions. In other words, we wanted to know whether respondents would ever reject the more “qualified” applicant so that they could admit one who would increase racial diversity at the medical school.
First, we tested the effects of making the two competing applicants closer or further apart on the conventional merit-based criteria that medical schools consider: college grades (GPA) and performance on the Medical College Admissions Test (MCAT). We created two applicant pairings. In the first pairing arrangement, which we call the real-world merit gap, the Asian applicant boasts a 3.8 undergraduate GPA and a 90th-percentile MCAT score, while the black applicant has a much lower 3.5 GPA and 65th-percentile MCAT score. We call this the real-world merit gap because these numbers approximate the actual differences (on average) between black and Asian applicants who were accepted to an accredited U.S. medical school at the time of our survey (Table 2).[22]
Table 2
Average MCAT Scores and GPAs for Matriculants to U.S. MD-Granting Medical Schools, by Race/Ethnicity, 2023–24
| Matriculants | Asian American | White | Hispanic | Black |
| MCAT | 514.3 | 512.4 | 506.4 | 505.7 |
| Approximate MCAT Percentile Rank | 88–90 | 83–86 | 66–69 | 62–66 |
| GPA | 3.83 | 3.80 | 3.66 | 3.59 |
A perfect score on the MCAT is 528. Here, GPA is based on a 4.0 scale.
In the second applicant pairing, which we call the affirmative action edge case, the Asian applicant boasts the same high grades and test scores as before, but we increase the black applicant’s GPA to 3.7 and MCAT score to the 85th percentile to create an “edge case”—i.e., one in which the underrepresented minority (the black applicant) is only slightly academically less impressive than the overrepresented minority (the Asian applicant).
We also randomized background information on the hypothetical medical school in the question prompt. One group of respondents were told that the medical school’s student body already matched “the racial/ethnic composition of the United States.” The other group were shown enrollment figures that matched the real-world racial composition of America’s medical schools (i.e., where Asians are overrepresented, and blacks and Hispanics underrepresented).[23] Respondents were randomly assigned to these different contextual cues, so we can be sure that any difference in their willingness to admit the underrepresented minority applicant is directly attributable to what they learned from the question about the lack of diversity or the magnitude of merit-based differences between the applicants.
The intuition of the experiment is straightforward. We first vary whether the medical school lacks representation (racial diversity); then we vary how close the underrepresented minority applicant is on merit-based criteria to the higher-performing overrepresented minority applicant. This allows us to examine whether and when Americans are willing to support affirmative action in practice—as opposed to supporting it in the abstract (as a non-zero-sum program that ensures equal opportunities for underrepresented minorities).
What do we find?
First, regardless of the vignette received, most respondents make their admissions decisions on merit-based criteria (college grades and MCAT scores). Consider the “strongest” case for giving the nod to the black applicant: one in which blacks are severely underrepresented at the medical school and the black applicant in question is an “edge case,” i.e., only a little below the Asian applicant on academic qualifications. Even in this most favorable (and, as we have noted, unrealistic) scenario, only about one in three respondents would admit the less qualified black applicant. About 70% still choose the Asian applicant.
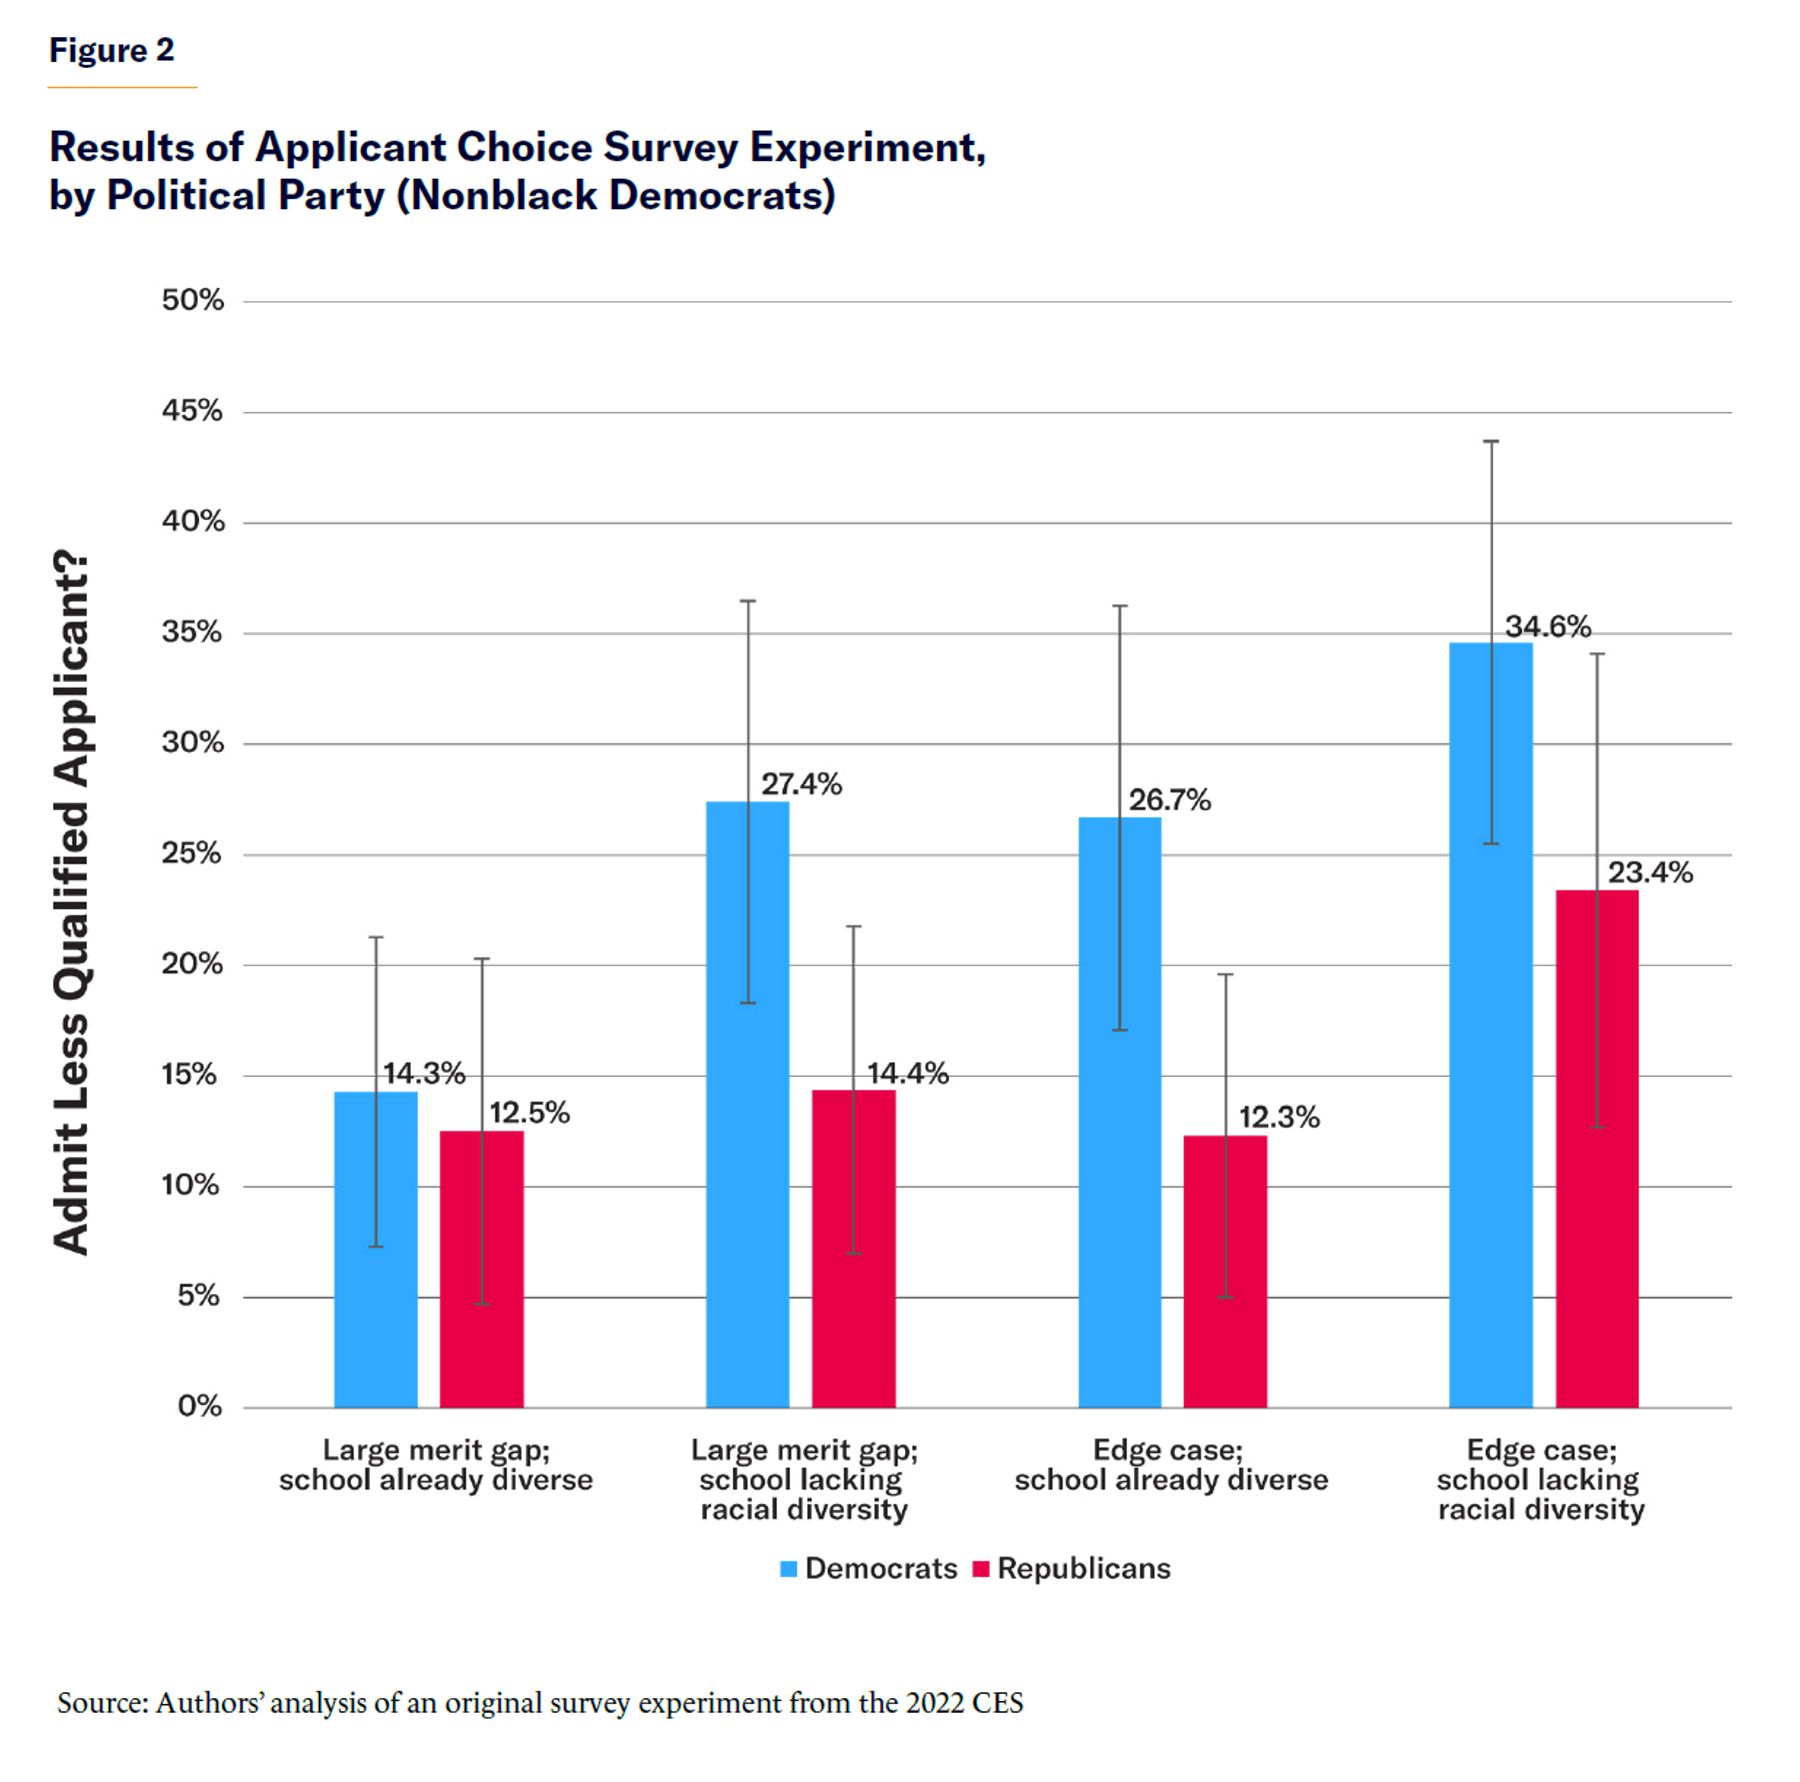
Figure 2 shows the rates at which nonblack Democrats and nonblack Republicans would admit the black applicant over the Asian applicant, depending on the experimental condition. As we expected, political affiliation makes some difference, but respondents in both parties make their admissions decisions overwhelmingly using merit-based criteria. Even when the black and Asian applicants are close on these criteria and the school lacks diversity, only 35% of nonblack Democrats say that they would admit the black applicant to diversify the medical school.
Diversity, however, is still important for these respondents—and especially for Democrats. When Democratic respondents are told that the black applicant has much lower grades and test scores than the Asian applicant, and that the medical school is already racially representative of the country, just 14% admit the black candidate. However, regardless of the black applicant’s qualifications (relative to the Asian), about one in three Democrats will admit the black student when told that blacks are underrepresented, and Asians overrepresented, at the medical school. In other words, diversity looms larger for Democrats, and they feel cross-pressured, despite their clear concern for merit, to consider racial representation in medical school admissions.
The results of our vignette experiment are telling. Remember, when Americans are asked abstract questions about affirmative action, they tend to respond favorably, saying that they support programs that ensure equal opportunities for minorities in education. However, this experiment reveals what happens when we dispense with abstraction. Instead of asking citizens to understand what “affirmative action” means, our vignette experiment asks them to perform a straightforward task that mirrors what admissions officers actually have to do: evaluate actual applicants relative to a pool and choose. In the case of medical school admissions, Americans are a merit-first bunch. They tend to choose the applicant with better academic qualifications. They do appear to value diversity at the margins, but they allow it to become a deciding factor only when applicants are close on the merits, rather than far apart.
Americans Favor Merit-Based Admissions Criteria and Reject Anti-Testing Narratives
Some readers might object that our vignette experiment emphasizes standardized test scores as the linchpin of merit-based admissions criteria. After all, many affirmative action proponents claim that such tests are racially biased and are poor proxies of students’ academic qualifications. To address this criticism, we asked all our survey respondents two additional sets of questions that probe their beliefs about testing and the various criteria that should be used in higher-education admissions.
First, we asked respondents which of the following two statements about the role of standardized tests—such high school exit exams, the SAT/ACT, and Advanced Placement (AP) exams—was closer to their own views:
Since their inception almost a century ago, standardized tests have been instruments of racism that perpetuate racial bias in our society.
Although they are imperfect instruments, standardized tests are one objective indicator of a student’s academic progress and ability.[24]
Over 75% chose the second option. What’s more, most nonwhite respondents firmly rejected the first option (that standardized tests are instruments of racism that perpetuate bias). Over 65% of nonwhites said that, in fact, such tests are an imperfect objective indicator of academic ability. Just over 55% of non-Hispanic black respondents agreed. In other words, only a minority of blacks (44%) said that standardized tests were instruments of bias rather than objective indicators of learning.
We then asked a series of questions (modeled after a similar survey conducted by Pew Research) about the factors that should and should not be used in college and (separately) medical school admissions. Specifically, for undergraduate college admissions, we asked whether the following criteria should be a major factor, minor factor, or not a factor:
Race or ethnicity
Character or personality factors (e.g., likeability, courage, kindness)
Scores on standardized tests, such as the SAT or ACT
High school grades
For medical school admissions, we asked about:
Race or ethnicity
Character or personality factors (e.g., likeability, courage, kindness)
Scores on the Medical College Admissions Test (MCAT)
College grades
The full set of results for all demographic subgroups are displayed in Table A3 in the Appendix. Here we wish only to note that Americans of all racial backgrounds are far more supportive of using high school grades and SAT/ACT (in the context of college admissions) and undergraduate GPAs and MCAT scores (in the context of medical school admissions) than any other factor we examined. In other words, most respondents would likely object not only to Harvard’s use of race/ ethnicity but also to its use of the now-infamous “personality scores” (which were biased against Asian students) to ensure that it recruited a racially diverse class. Americans of all stripes rejected both consideration of race and of subjective factors, and instead supported using test scores and grades as the major factor in admissions decisions.
Conclusion
Since the Supreme Court eliminated affirmative action in higher education, university administrators have been hard at work devising various ways to weaken the impact of the decision. One popular workaround has been to encourage students to write about their race or ethnicity in application essays. Consider one of the 2023–24 supplemental essay prompts for admission to Harvard College: “Harvard has long recognized the importance of enrolling a diverse student body. How will the life experiences that shape who you are today enable you to contribute to Harvard?”[25]
This prompt is not only in tension with the Court’s opinion in Students for Fair Admissions—the majority noted that “universities may not simply establish through application essays or other means the regime we hold unlawful today”—but it also goes against public consensus that race should play, at most, a minimal factor in admissions. Our findings from the 2022 CES show that for large swaths of the American public—including, we would note, most nonwhite Democrats—merit trumps race when it comes to university admissions; and this is especially true when Asians are framed as the victims of affirmative action.
Appendix
Table A1
Asian Framing Experiment (Subgroup Results)
Note: “Asian frame” refers to the experimental condition in which respondents were told that affirmative action would harm Asian (rather than white) applicants.
Sample: All Americans
| Asian frame? | Give blacks college admissions preferences? | ||
| No | Yes | Total | |
| No | 228 | 125 | 353 |
| 64.59 | 35.41 | 100.00 | |
| Yes | 265 | 91 | 356 |
| 74.44 | 25.56 | 100.00 | |
| N | 493 | 216 | 709 |
| 69.53 | 30.47 | 100.00 | |
Sample: Non-Hispanic Whites
| Asian frame? | Give blacks college admissions preferences? | ||
| No | Yes | Total | |
| No | 185 | 69 | 254 |
| 72.83 | 27.17 | 100.00 | |
| Yes | 199 | 48 | 247 |
| 80.57 | 19.43 | 100.00 | |
| N | 384 | 117 | 501 |
| 76.65 | 23.35 | 100.00 | |
Sample: Non-Hispanic Whites and Asians
| Asian frame? | Give blacks college admissions preferences? | ||
| No | Yes | Total | |
| No | 191 | 71 | 262 |
| 72.90 | 27.10 | 100.00 | |
| Yes | 209 | 49 | 258 |
| 81.01 | 18.99 | 100.00 | |
| N | 400 | 120 | 520 |
| 76.92 | 23.08 | 100.00 | |
Sample: Non-Hispanic Blacks
| Asian frame? | Give blacks college admissions preferences? | ||
| No | Yes | Total | |
| No | 10 | 28 | 38 |
| 26.32 | 73.68 | 100.00 | |
| Yes | 14 | 27 | 41 |
| 34.15 | 65.85 | 100.00 | |
| N | 24 | 55 | 79 |
| 30.38 | 69.62 | 100.00 | |
Sample: Latinos/Hispanics
| Asian frame? | Give blacks college admissions preferences? | ||
| No | Yes | Total | |
| No | 20 | 20 | 40 |
| 50.00 | 50.00 | 100.00 | |
| Yes | 31 | 12 | 43 |
| 72.09 | 27.91 | 100.00 | |
| N | 51 | 32 | 83 |
| 69.53 | 30.47 | 100.00 | |
Sample: All Democrats
| Asian frame? | Give blacks college admissions preferences? | ||
| No | Yes | Total | |
| No | 50 | 105 | 155 |
| 32.26 | 67.74 | 100.00 | |
| Yes | 84 | 71 | 155 |
| 54.19 | 45.81 | 100.00 | |
| N | 134 | 176 | 310 |
| 43.23 | 56.77 | 100.00 | |
Sample: Non-Hispanic White, Asian, and Latino Democrats
| Asian frame? | Give blacks college admissions preferences? | ||
| No | Yes | Total | |
| No | 45 | 78 | 123 |
| 36.59 | 63.41 | 100.00 | |
| Yes | 74 | 45 | 119 |
| 62.18 | 37.82 | 100.00 | |
| N | 119 | 123 | 242 |
| 49.17 | 50.83 | 100.00 | |
Sample: All Republicans
| Asian frame? | Give blacks college admissions preferences? | ||
| No | Yes | Total | |
| No | 133 | 7 | 140 |
| 95.00 | 5.00 | 100.00 | |
| Yes | 133 | 8 | 141 |
| 94.33 | 5.67 | 100.00 | |
| N | 266 | 15 | 281 |
| 94.66 | 5.34 | 100.00 | |
Sample: Non-Hispanic White, Asian, and Latino Republicans
| Asian frame? | Give blacks college admissions preferences? | ||
| No | Yes | Total | |
| No | 129 | 5 | 134 |
| 96.27 | 3.73 | 100.00 | |
| Yes | 124 | 8 | 132 |
| 93.94 | 6.06 | 100.00 | |
| N | 253 | 13 | 266 |
| 95.11 | 4.89 | 100.00 | |
Table A2
Medical School Admissions Experiment (Subgroup Results)
MeritGap: Asian applicant has a 3.8 undergraduate GPA and a 90th-percentile MCAT score; black applicant has 3.5 GPA and 65th-percentile MCAT score.
EdgeCase: Asian applicant has a 3.8 undergraduate GPA and 90th-percentile MCAT score; black applicant has 3.7 GPA and 85th-percentile MCAT score.
Rep: Medical school has a student body that corresponds to the racial/ethnic makeup of the United States.
UR: Medical school has a student body that matches real-world racial composition of America’s medical schools (Asians overrepresented and blacks/Hispanics underrepresented).
Sample: All Americans
| Treatment | Admit black medical applicant? | ||
| No | Yes | Total | |
| MeritGap+Rep | 211 | 45 | 256 |
| 82.42 | 17.58 | 100.00 | |
| MeritGap+UR | 192 | 71 | 263 |
| 73.00 | 27.00 | 100.00 | |
| Edge Case+Rep | 170 | 63 | 233 |
| 72.96 | 27.04 | 100.00 | |
| Edge Case+UR | 171 | 77 | 248 |
| 68.95 | 31.05 | 100.00 | |
| N | 744 | 256 | 1000 |
| 74.40 | 25.60 | 100.00 | |
Sample: Non-Hispanic Whites
| Treatment | Admit black medical applicant? | ||
| No | Yes | Total | |
| MeritGap+Rep | 152 | 19 | 171 |
| 88.89 | 11.11 | 100.00 | |
| MeritGap+UR | 135 | 37 | 172 |
| 78.49 | 21.51 | 100.00 | |
| Edge Case+Rep | 134 | 33 | 167 |
| 80.24 | 19.76 | 100.00 | |
| Edge Case+UR | 119 | 49 | 168 |
| 70.83 | 29.17 | 100.00 | |
| N | 540 | 138 | 678 |
| 79.65 | 20.35 | 100.00 | |
Sample: Non-Hispanic Whites and Asians
| Treatment | Admit black medical applicant? | ||
| No | Yes | Total | |
| MeritGap+Rep | 159 | 19 | 178 |
| 89.33 | 10.67 | 100.00 | |
| MeritGap+UR | 141 | 37 | 178 |
| 79.21 | 20.79 | 100.00 | |
| Edge Case+Rep | 138 | 34 | 172 |
| 80.23 | 19.77 | 100.00 | |
| Edge Case+UR | 125 | 50 | 175 |
| 71.43 | 28.57 | 100.00 | |
| N | 563 | 140 | 703 |
| 80.09 | 19.91 | 100.00 | |
Sample: Non-Hispanic Blacks
| Treatment | Admit black medical applicant? | ||
| No | Yes | Total | |
| MeritGap+Rep | 19 | 15 | 34 |
| 55.88 | 44.12 | 100.00 | |
| MeritGap+UR | 15 | 22 | 37 |
| 40.54 | 59.46 | 100.00 | |
| Edge Case+Rep | 12 | 18 | 30 |
| 40.00 | 60.00 | 100.00 | |
| Edge Case+UR | 12 | 15 | 27 |
| 44.44 | 55.56 | 100.00 | |
| N | 58 | 70 | 128 |
| 80.09 | 19.91 | 100.00 | |
Sample: Latinos/Hispanics
| Treatment | Admit black medical applicant? | ||
| No | Yes | Total | |
| MeritGap+Rep | 20 | 10 | 30 |
| 66.67 | 33.33 | 100.00 | |
| MeritGap+UR | 29 | 11 | 40 |
| 72.50 | 27.50 | 100.00 | |
| Edge Case+Rep | 15 | 10 | 25 |
| 60.00 | 40.00 | 100.00 | |
| Edge Case+UR | 24 | 9 | 33 |
| 72.73 | 27.27 | 100.00 | |
| N | 88 | 40 | 128 |
| 68.75 | 31.25 | 100.00 | |
Sample: All Democrats
| Treatment | Admit black medical applicant? | ||
| No | Yes | Total | |
| MeritGap+Rep | 105 | 24 | 129 |
| 81.40 | 18.60 | 100.00 | |
| MeritGap+UR | 82 | 43 | 125 |
| 65.60 | 34.40 | 100.00 | |
| Edge Case+Rep | 74 | 36 | 110 |
| 67.27 | 32.73 | 100.00 | |
| Edge Case+UR | 80 | 52 | 132 |
| 60.61 | 39.39 | 100.00 | |
| N | 341 | 155 | 496 |
| 80.09 | 19.91 | 100.00 | |
Sample: Non-Hispanic White, Asian, and Latino Democrats
| Treatment | Admit black medical applicant? | ||
| No | Yes | Total | |
| MeritGap+Rep | 84 | 14 | 98 |
| 85.71 | 14.29 | 100.00 | |
| MeritGap+UR | 69 | 26 | 95 |
| 72.63 | 27.37 | 100.00 | |
| Edge Case+Rep | 63 | 23 | 86 |
| 73.26 | 26.74 | 100.00 | |
| Edge Case+UR | 70 | 37 | 107 |
| 65.42 | 34.58 | 100.00 | |
| N | 286 | 100 | 386 |
| 74.09 | 25.91 | 100.00 | |
Sample: All Republicans
| Treatment | Admit black medical applicant? | ||
| No | Yes | Total | |
| MeritGap+Rep | 66 | 11 | 77 |
| 85.71 | 14.29 | 100.00 | |
| MeritGap+UR | 80 | 16 | 96 |
| 83.33 | 16.67 | 100.00 | |
| Edge Case+Rep | 75 | 10 | 85 |
| 60.00 | 40.00 | 100.00 | |
| Edge Case+UR | 53 | 16 | 69 |
| 76.81 | 23.19 | 100.00 | |
| N | 274 | 53 | 327 |
| 83.79 | 16.21 | 100.00 | |
Sample: Non-Hispanic White, Asian, and Latino Democrats
| Treatment | Admit black medical applicant? | ||
| No | Yes | Total | |
| BigGap+Rep | 84 | 14 | 98 |
| 85.71 | 14.29 | 100.00 | |
| BigGap+UR | 69 | 26 | 95 |
| 72.63 | 27.37 | 100.00 | |
| Edge Case+Rep | 63 | 23 | 86 |
| 73.26 | 26.74 | 100.00 | |
| Edge Case+UR | 70 | 37 | 107 |
| 65.42 | 34.58 | 100.00 | |
| N | 286 | 100 | 386 |
| 74.09 | 25.91 | 100.00 | |
Sample: Non-Hispanic White, Asian, and Latino Republicans
| Treatment | Admit black medical applicant? | ||
| No | Yes | Total | |
| BigGap+Rep | 63 | 9 | 72 |
| 87.50 | 12.50 | 100.00 | |
| BigGap+UR | 77 | 13 | 90 |
| 85.56 | 14.44 | 100.00 | |
| Edge Case+Rep | 71 | 10 | 81 |
| 87.65 | 12.35 | 100.00 | |
| Edge Case+UR | 49 | 15 | 64 |
| 76.56 | 23.44 | 100.00 | |
| N | 260 | 47 | 307 |
| 84.69 | 15.31 | 100.00 | |
Table A3
Public Support for Different College and Medical School Admissions Criteria
Note: Authors’ analysis of CES questions modeled on Pew survey questions about the role that various criteria should play in university admissions
| Respondent group | Admissions domain | Don't consider tests | Tests a minor factor | Tests a major factor | Don't consider grades | Grades a minor factor | Grades a major factor |
| All Americans | College | 7 | 38 | 55 | 6 | 22 | 73 |
| Non-Hispanic whites | College | 7 | 43 | 50 | 4 | 21 | 74 |
| Non-Hispanic whites + Asians | College | 7 | 43 | 50 | 4 | 21 | 75 |
| Blacks | College | 11 | 41 | 48 | 7 | 24 | 69 |
| Latinos | College | 12 | 31 | 57 | 6 | 31 | 63 |
| Whites, Asians, Latinos | College | 8 | 41 | 51 | 5 | 22 | 73 |
| Democrats | College | 9 | 47 | 43 | 4 | 25 | 70 |
| Republicans | College | 6 | 28 | 66 | 3 | 18 | 79 |
| All Americans | Medical | 5 | 19 | 76 | 4 | 14 | 82 |
| Non-Hispanic whites | Medical | 4 | 18 | 78 | 3 | 13 | 84 |
| Non-Hispanic whites + Asians | Medical | 4 | 19 | 78 | 3 | 13 | 84 |
| Blacks | Medical | 8 | 24 | 68 | 5 | 23 | 71 |
| Latinos | Medical | 8 | 19 | 73 | 7 | 22 | 71 |
| Whites, Asians, Latinos | Medical | 4 | 19 | 77 | 4 | 14 | 82 |
| Democrats | Medical | 4 | 25 | 71 | 4 | 18 | 79 |
| Republicans | Medical | 3 | 10 | 86 | 2 | 11 | 86 |
| Respondent group | Admissions domain | Don't consider race | Race a minor factor | Race a major factor | Don't consider personality traits | Personality a minor factor | Personality a major factor |
| All Americans | College | 58 | 29 | 13 | 24 | 44 | 31 |
| Non-Hispanic whites | College | 60 | 32 | 9 | 27 | 46 | 26 |
| Non-Hispanic whites + Asians | College | 60 | 31 | 9 | 26 | 47 | 27 |
| Blacks | College | 32 | 32 | 36 | 20 | 41 | 40 |
| Latinos | College | 49 | 32 | 19 | 19 | 40 | 41 |
| Whites, Asians, Latinos | College | 58 | 31 | 10 | 35 | 46 | 29 |
| Democrats | College | 37 | 43 | 20 | 22 | 45 | 33 |
| Republicans | College | 79 | 15 | 6 | 26 | 49 | 25 |
| All Americans | Medical | 64 | 25 | 11 | 20 | 45 | 35 |
| Non-Hispanic whites | Medical | 66 | 27 | 7 | 20 | 49 | 31 |
| Non-Hispanic whites + Asians | Medical | 66 | 27 | 7 | 20 | 49 | 31 |
| Blacks | Medical | 43 | 30 | 27 | 16 | 44 | 41 |
| Latinos | Medical | 56 | 26 | 18 | 20 | 41 | 38 |
| Whites, Asians, Latinos | Medical | 64 | 27 | 9 | 20 | 48 | 32 |
| Democrats | Medical | 45 | 38 | 17 | 16 | 45 | 39 |
| Republicans | Medical | 84 | 12 | 4 | 24 | 47 | 29 |
Endnotes
Photo: ferrantraite / E+ via Getty Images
Are you interested in supporting the Manhattan Institute’s public-interest research and journalism? As a 501(c)(3) nonprofit, donations in support of MI and its scholars’ work are fully tax-deductible as provided by law (EIN #13-2912529).