Making Metros Family-Friendly: Rankings and Suggestions

Photo: monkeybusinessimages/iStock
Executive Summary
The declining presence of children in the nation’s dense urban areas has been a matter of concern for years, and this trend has only continued since the 2020 pandemic. In light of this pattern, this report assesses the family-friendliness of more than 200 metro areas across the U.S., using a wide variety of data sources, including the Census Bureau’s 2017–21 American Community Survey. It discusses which places have the most children, where families with children choose to move, and how metros fare on measures of well-being such as educational achievement, social mobility, social capital, and child poverty.
An accompanying data tool that I created allows readers to see how well each of these variables correlates with all the others.[1] Cost of living emerges as an overwhelming theme of these correlations: the metros that are home to the most children, as well as the metros attracting the most family migration, do not strongly tend to be the ones with, for example, high educational achievement, low child mortality and homicide rates, and strong upward mobility. Some of these correlations are even in the “wrong” direction. Rather, the metros that are objectively attractive to families are the ones with low cost of living, including affordable housing and child care.
This report also offers suggestions as to how cities and other levels of government might make urban living more attractive to families with children. The single biggest suggestion is to bring down the cost of housing by increasing supply, which is currently held back by intense zoning regulations. Major metro areas cannot compete directly with the combination of advantages that smaller ones boast—cheaper housing plus more space—but they certainly can make housing more affordable, continue to offer their own cultural and economic advantages (areas where smaller cities cannot compete), and make public spaces more accessible and friendly to children.
Introduction: Why Family-Friendly Metros?
I grew up in a suburb of Green Bay, Wisconsin. But like a lot of Americans, I was drawn through education and employment to much bigger cities—even though city life, as such, held little appeal for me. By 25, I had been to college near Chicago, held two jobs in Washington, D.C., and moved up to New York City. I was “moving to density,”[2] as countless young adults have through American history, simply because the opportunities of urban areas outweighed the downsides. I did not own a car.
Yet everything played out in reverse. A little before we hit 30, my wife and I decided to return to the D.C. area to have kids. Relative to New York, at least, it was a little more affordable to buy a home with bedrooms for kids (and a yard, to boot) in the farther-out Northern Virginia suburbs; fortuitously, both our employers had D.C. offices and an openness to working from home. Fast-forward another 10 years and three children, and it had become even more feasible to do our writing and editing jobs from anywhere in the country—and in the meantime, the pandemic and coastal America’s response to it, which had included an attempt at virtual kindergarten for our eldest, had taken its toll.
Now we live in a suburb of Green Bay, Wisconsin.
This is more than a personal anecdote. Cities throughout the U.S. are experiencing these dynamics. They have suffered population losses and declining school enrollment,[3] though, by one recent analysis, cities’ population loss seems to be slowing.[4] Downtown office buildings and the surrounding businesses are especially being clobbered, as even those who continue living in and around cities are going to the office less.
Working from home has risen dramatically, despite some debate over the precise extent of the increase.[5] A February 2023 Pew Research Center survey found that about 40% of Americans have “teleworkable” jobs and that, of those, about 35% work remotely all the time, with the latter number up from just 7% before the pandemic.[6] An even more recent analysis found that, for Americans aged 20–64, 28% of paid workdays were worked from home as of mid-2023, up four times from 2019 and 10 times from the 1990s.[7] The American Time Use Survey, which chronicles what each respondent did in a single day, finds a much smaller increase, with the share of employed people working from home on the day in question rising from 24% to 34% between 2019 and 2022.[8] But whether the change is 10 points or four times, that’s an enormous shift in the forces bringing workers to their employers’ physical locations in just a few years.
And those forces matter. There are certainly many people who love dense city life for its own sake—but a significant fraction of city dwellers do not. In one recent poll, nearly a third of New York City residents said that they wished they lived somewhere else, and two-fifths said that the city was not a good place to raise a family.[9] Fifteen years ago, discussing a similar poll asking New Yorkers whether they would leave if they could, the economist Steven Landsburg joked that the results proved that “37 percent of New Yorkers lie to pollsters,” as anyone who actually wanted to move out of New York City was perfectly free to do so.[10] It’s fair to say, though, that these polls capture a sense of subjectively enjoying a place. Brute economic incentives can override these offhand judgments; but when economic incentives change, it can free people to do what they previously “wanted” to do only abstractly.
Even if trends stabilize soon, the current flight from density interacts in interesting ways with a much older debate. Going back two decades, one of the big concepts within urbanism has been the “creative class”; Richard Florida famously suggested that this hipster crowd was key to cities’ fortunes,[11] and pop-culture hits such as Sex and the City glamorized urban life for the single and well-to-do. Ali Modarres and Joel Kotkin, in a much-discussed 2013 City Journal article, lamented a corollary of this focus—namely, that big cities, especially inner cores, were becoming “childless,” with the under-18 percentage of the population declining as total population grew. Cities had become “playgrounds for the rich, traps for the poor, and way stations for the ambitious young en route eventually to less congested places.”[12]
A 2019 article for the Atlantic by Derek Thompson continued the discussion and provided the startling statistic that since “2011, the number of babies born in New York has declined 9 percent in the five boroughs and 15 percent in Manhattan.”[13] Compiling changes between the 2010 and 2020 censuses, the Annie E. Casey Foundation recently documented a roughly 1.5% decline in the nationwide under-18 population, a 2.2% decline in the 100 largest cities, and far bigger declines in some major individual cities. Los Angeles saw its number of children fall 14%; Chicago, 12%; Baltimore, 15%.[14]
A pandemic, a crime wave, and a growing ability of knowledge workers to do their jobs without living in urban centers have only continued the decline of children’s presence in cities, especially dense inner cores. A recent analysis from the Economic Innovation Group[15] concluded that, just from the beginning of the pandemic through mid-2022, the under-five population had shrunk 6% in large urban counties, 3% in small urban counties, 1.6% in suburban counties, and not at all in the exurbs, with declines also concentrated in coastal cities. It further found that, while urban areas were losing population in general, they were losing small children especially quickly, primarily owing to changes in migration rather than births. And it identified a “doughnut effect,” in which under-five population growth was better in areas surrounding cities than in cities themselves.
The question underpinning the childless-cities debate is thus as relevant as ever: Should anyone care if big cities are devoid of children? Cities certainly should worry that they’re losing taxpayers in general, especially if that trend continues much longer. But why is it a problem if, say, New York City and San Francisco, especially their densest and wealthiest areas, are way stations for many of the people who live in them—places for the young and educated from around the country to establish themselves, heading elsewhere if they decide to start families?
There are several reasons to worry, from a variety of ideological perspectives.
The most fundamental answer comes from the pro-natalist perspective: if great numbers of Americans are going to live in large metro areas when they’re young and single, but do not want to raise children there—either because it’s too expensive or because the environment is not suitable—that can force extremely difficult decisions when it comes to fertility. America’s overall fertility rate is well below replacement at this point, having fallen during the Great Recession and having never recovered. The inhospitability of big cities to children, despite their attractiveness to young adults, could be one target for policy reforms.[16]
One can debate whether a childless city has no future, or whether, instead, generation after generation of bright young people could simply move into big cities and then move out again if and when they settle down. It seems much more obvious that a childless country has no future—and that having large population centers serve as hubs for childbearing-age young Americans, yet offer few attractive options after those Americans have children, can hardly be helping in this regard. It is very difficult to change fertility rates with government policy, so every possible lever is important.
There are other reasons to lament childless cities as well. Thompson, in his 2019 piece, added this note from the economic left: “It’s incoherent for Americans to talk about equality of opportunity in an economy where high-paying work is concentrated in places, such as San Francisco and Manhattan, where the median home value is at least six times the national average. Widespread economic growth will become ever more difficult in an age of winner-take-all cities.”
Some would add environmental concerns. Humans do less damage to the environment when they live in denser places. They drive less, or might be able to eschew car ownership entirely, relying instead on public transit and even walking. Their buildings and streets occupy less space and displace less of nature, per person.
Other potential arguments abound. It might be seen as socially unhealthy for urban residents to rarely see children, or perverse for cities to deliberately exclude parents by, for example, blocking the creation of multi-bedroom apartments or day-care centers (cf. the discussion of “vasectomy zoning”).[17] Cities themselves could benefit from having children grow up with a long-term attachment, both to the particular city and to urban life in general. After all, most children don’t go too far when they become adults. According to one recent study,“At age 26, 69% of individuals live in the commuting zone where they grew up. 80% of young adults have travelled less than 100 miles and 90% travelled less than 500 miles.”[18] City partisans may not want to deprive children of the unique experiences of growing up urban.
With all this in mind, I set out to rank U.S. metro areas on numerous dimensions of family-friendliness. Informed by my findings, I also put together suggestions for making city life more attractive to families.
Why consider entire metro areas, defined to include central cities and surrounding counties with strong commuting ties, rather than just central cities themselves, or compare cities with their own suburbs? In truth, all these approaches are valuable, and I’ll reference other research to fill in some of the many gaps left by my own analysis, but there is much to be learned from looking at entire metro ecosystems.
It does seem inevitable—in the modern, First World, U.S. context—that some dense neighborhoods packed with small apartments will be popular among the young and trendy, while roomier neighborhoods and suburbs will offer single-family lodging and other stroller-accessible amenities to those settling down. I would not have wanted to live in my quiet single-family neighborhood, with kids on bikes clogging the streets, when I was 25, and I would not want an unmarried-20-something-packed New York City apartment building next door now. But it is one thing for different parts of a metro area to serve residents at different stages of their lives, while work and entertainment downtown bring everyone together—and another thing for a metro to drive children away entirely.
Fortunately, differences in the presence of children are much less pronounced at the metro-area level than at the level of central cities alone. Notoriously childless San Francisco, for example, has a population that’s only about 13% under 18,[19] but the San Francisco–Oakland–Berkeley metro area, by contrast, is about 20% minor in my data, below the nationwide figure of roughly 22%, but not shockingly so.
As we shall see, there remain enormous differences between metro areas in terms of how many children there are, how many children are moving in, and how well children fare. Cataloging those differences and seeing what can be inferred from them is the purpose of this report.
Measuring Family-Friendliness
To dig into these issues in an objective way, I start with the 2017–21 five-year sample of the Census Bureau’s American Community Survey, relying on the metro-area classification provided by IPUMS, a project of the University of Minnesota Population Center that formats census data and adds extra variables.[20] Combining five years greatly increases the sample size—the full data set, including Americans of all ages, has more than 15 million observations. The period covers a mix of the pre-pandemic status quo and the pandemic years, in the hope that a combination of the status quo ante and the Covid-19 shakeup will bear some resemblance to the future.[21] I have data on about 250 metro areas, containing about three-quarters of the entire U.S. population. From there, I merge in metro-level data from a myriad of other sources.
The combined data set is necessarily messy in some ways. IPUMS itself is unable to identify certain metro areas (including those based around Charlottesville, VA, and Flint, MI) because the boundaries don’t correspond closely enough to publicly released geographies; different sources are sometimes missing data for different metros, use slightly different classification systems, or cover somewhat different periods; in some cases, I had to combine county-level data into metro areas, despite missing some smaller counties.[22] In the aggregate, however, these data offer a clear picture of where children live, where families are moving, and where children are thriving. They facilitate fun rankings in the spirit of a classic BuzzFeed listicle (“see how your city measures up!”) and reveal systematic patterns. An overriding theme, for example, is that places with lower density and cheaper housing have a far higher presence of children and a greater net in-migration of families today.
I assembled a total of about 35 variables. An accompanying data tool (below) shows how well every variable correlates with every other, complete with scatterplots, and serves as a backbone for much of my analysis. These calculations are weighted by population, so that the relationships represent where people actually live and to account for greater measurement error in smaller metros.
Some explanations and caveats before we proceed: the correlations are calculated on a scale of –1 to 1, with negative numbers indicating that when one variable is higher, the other tends to be lower. (Think temperature and the percentage of people wearing long sleeves.) An admittedly crude way of interpreting these statistics is that relationships, positive or negative, of 0.2 or lower are weak (in these data, correlations much below that threshold are mostly statistically insignificant, meaning not clearly different from zero); relationships of 0.4 to 0.6 are moderate; and relationships of 0.6 or higher are strong.
Note that measurement error reduces correlations, and some variables in the data set are measured much more precisely than others, owing, for example, to differences in their sources’ sample sizes. Also note that correlation does not prove causation. These numbers document which variables tend to go together, but they do not prove that one is caused by another. To answer causal questions, as appropriate, I will reference other research and, now and then, resort to common sense.
Where Are the Children, and Where Are They Going?
The simplest measure of a place’s family-friendliness is simply how many children (more specifically, minors under age 18) live there. Places with lots of children, by definition, are places where parents choose to raise their families.
Most of this report will focus on numbers at the level of metro areas, but the large sample sizes of the American Community Survey, combined from 2017 through 2021, allow this fundamental statistic to be calculated at a much smaller level of geography, specifically “Public Use Microdata Areas” (PUMAs) containing only about 100,000–200,000 people apiece. This reveals an abundance of children in the middle of the country, with Utah standing out, and noticeable stretches of child-starved regions on the coasts (Figure 1).
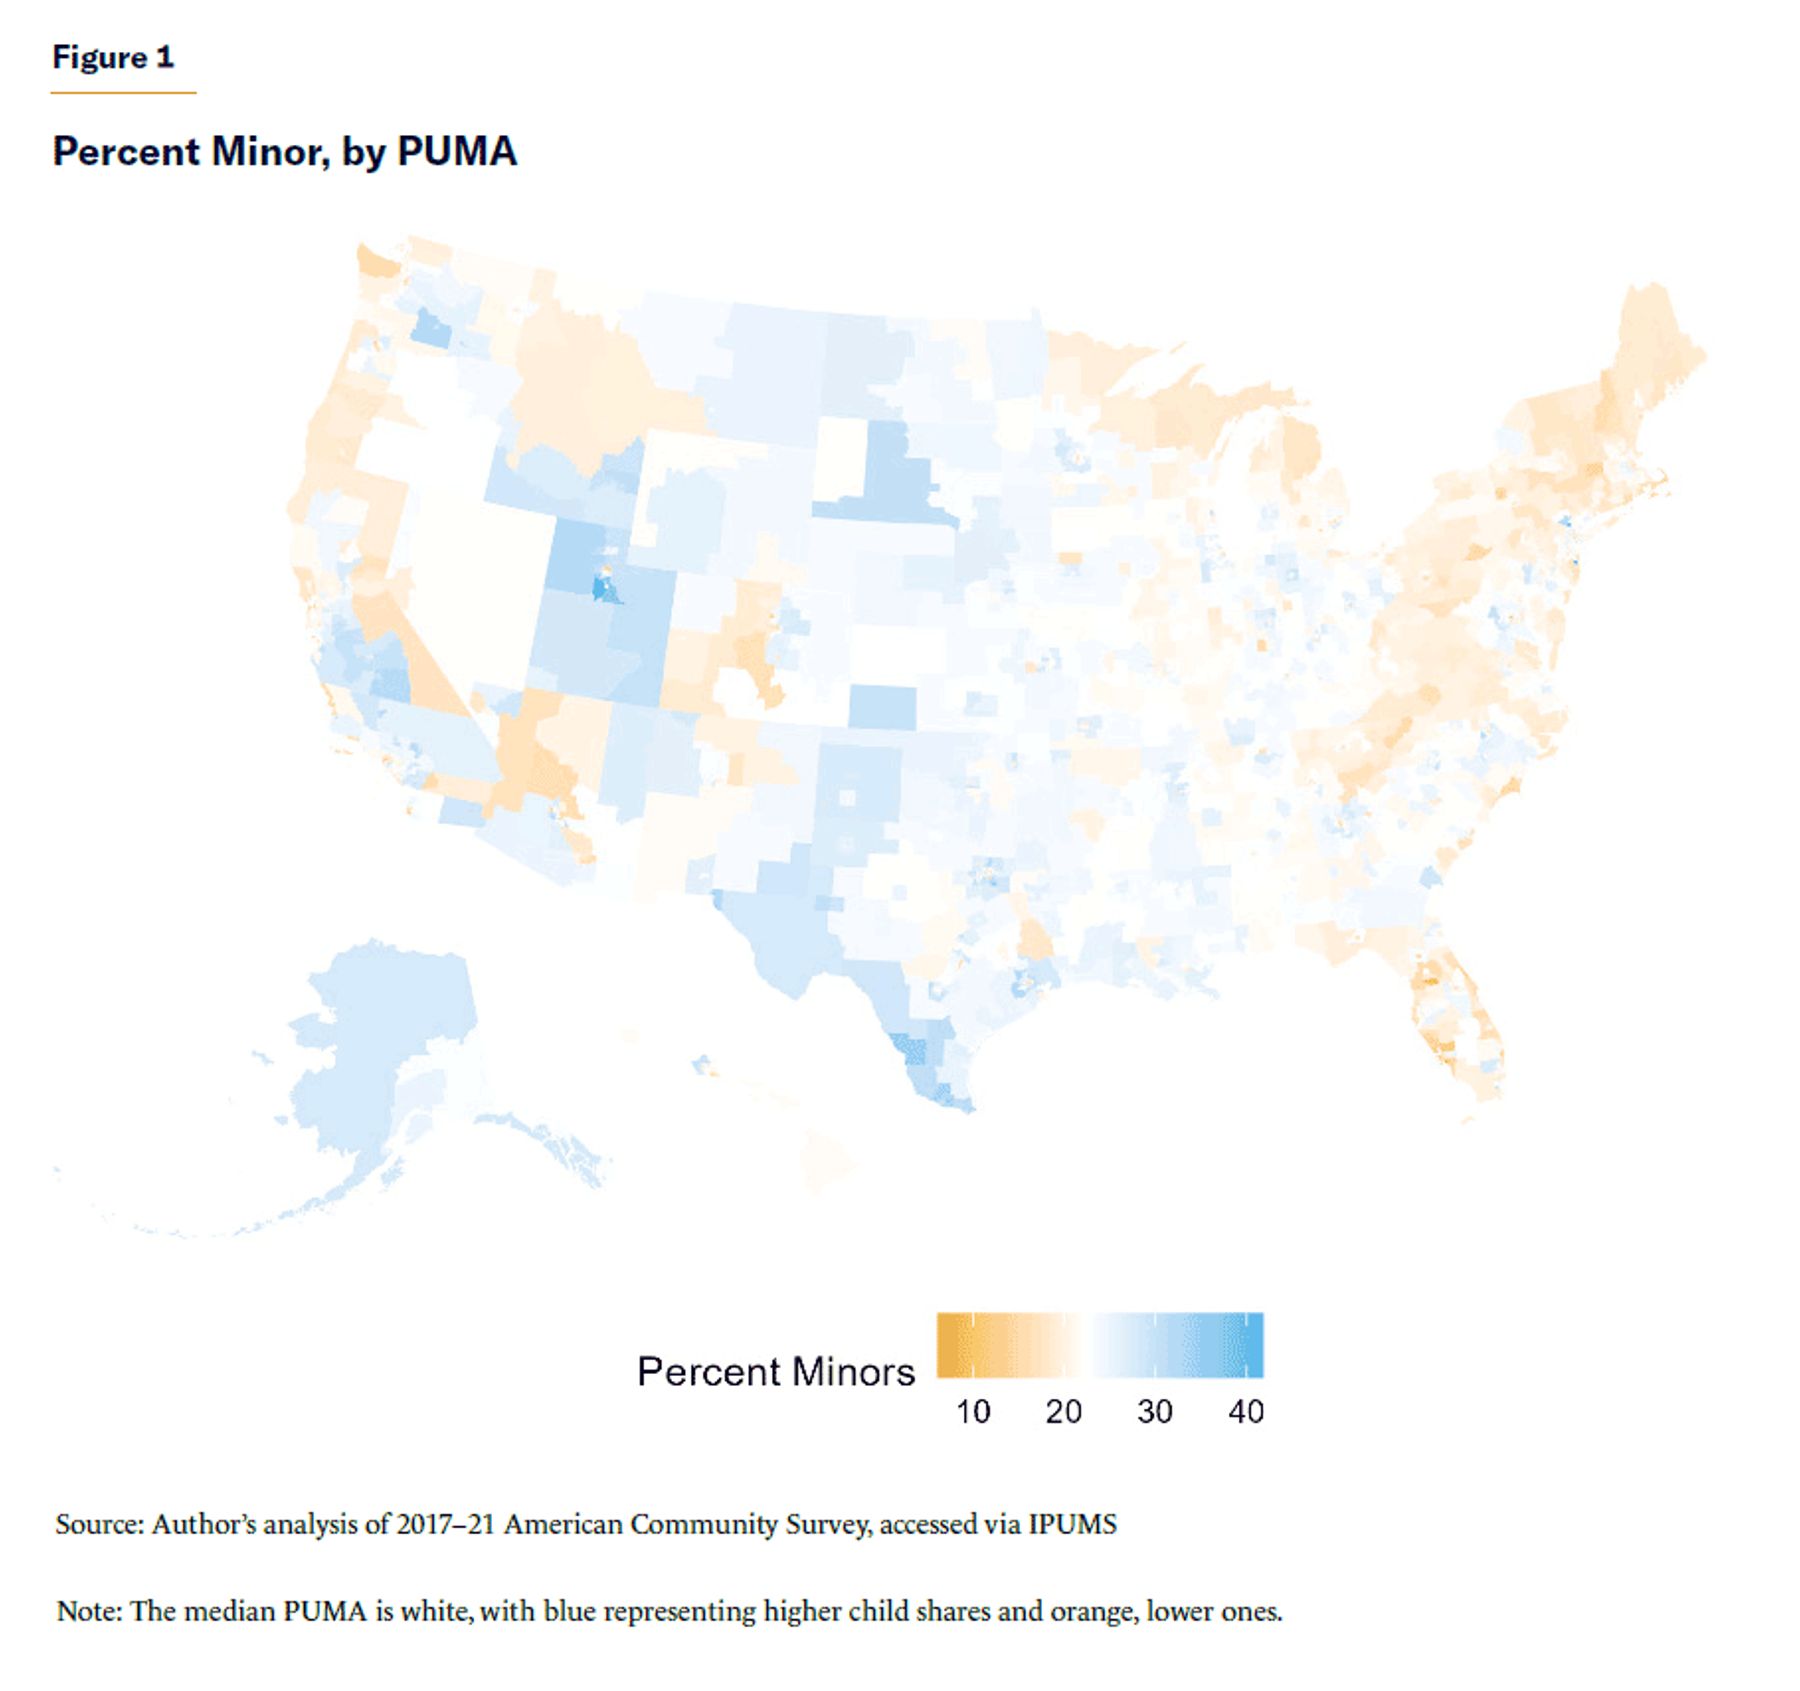
Of course, some of these patterns are driven by the heightened presence of the elderly, rather than a young-adult population that skews childless, and one might want to distinguish the two. (There is more of a public-policy argument for making economically thriving metros more family-friendly than for shoehorning families with children into retirement communities, for example.) Outside the elderly havens of Florida, though, the map looks quite similar when the denominator is the under-55 population rather than the total population.
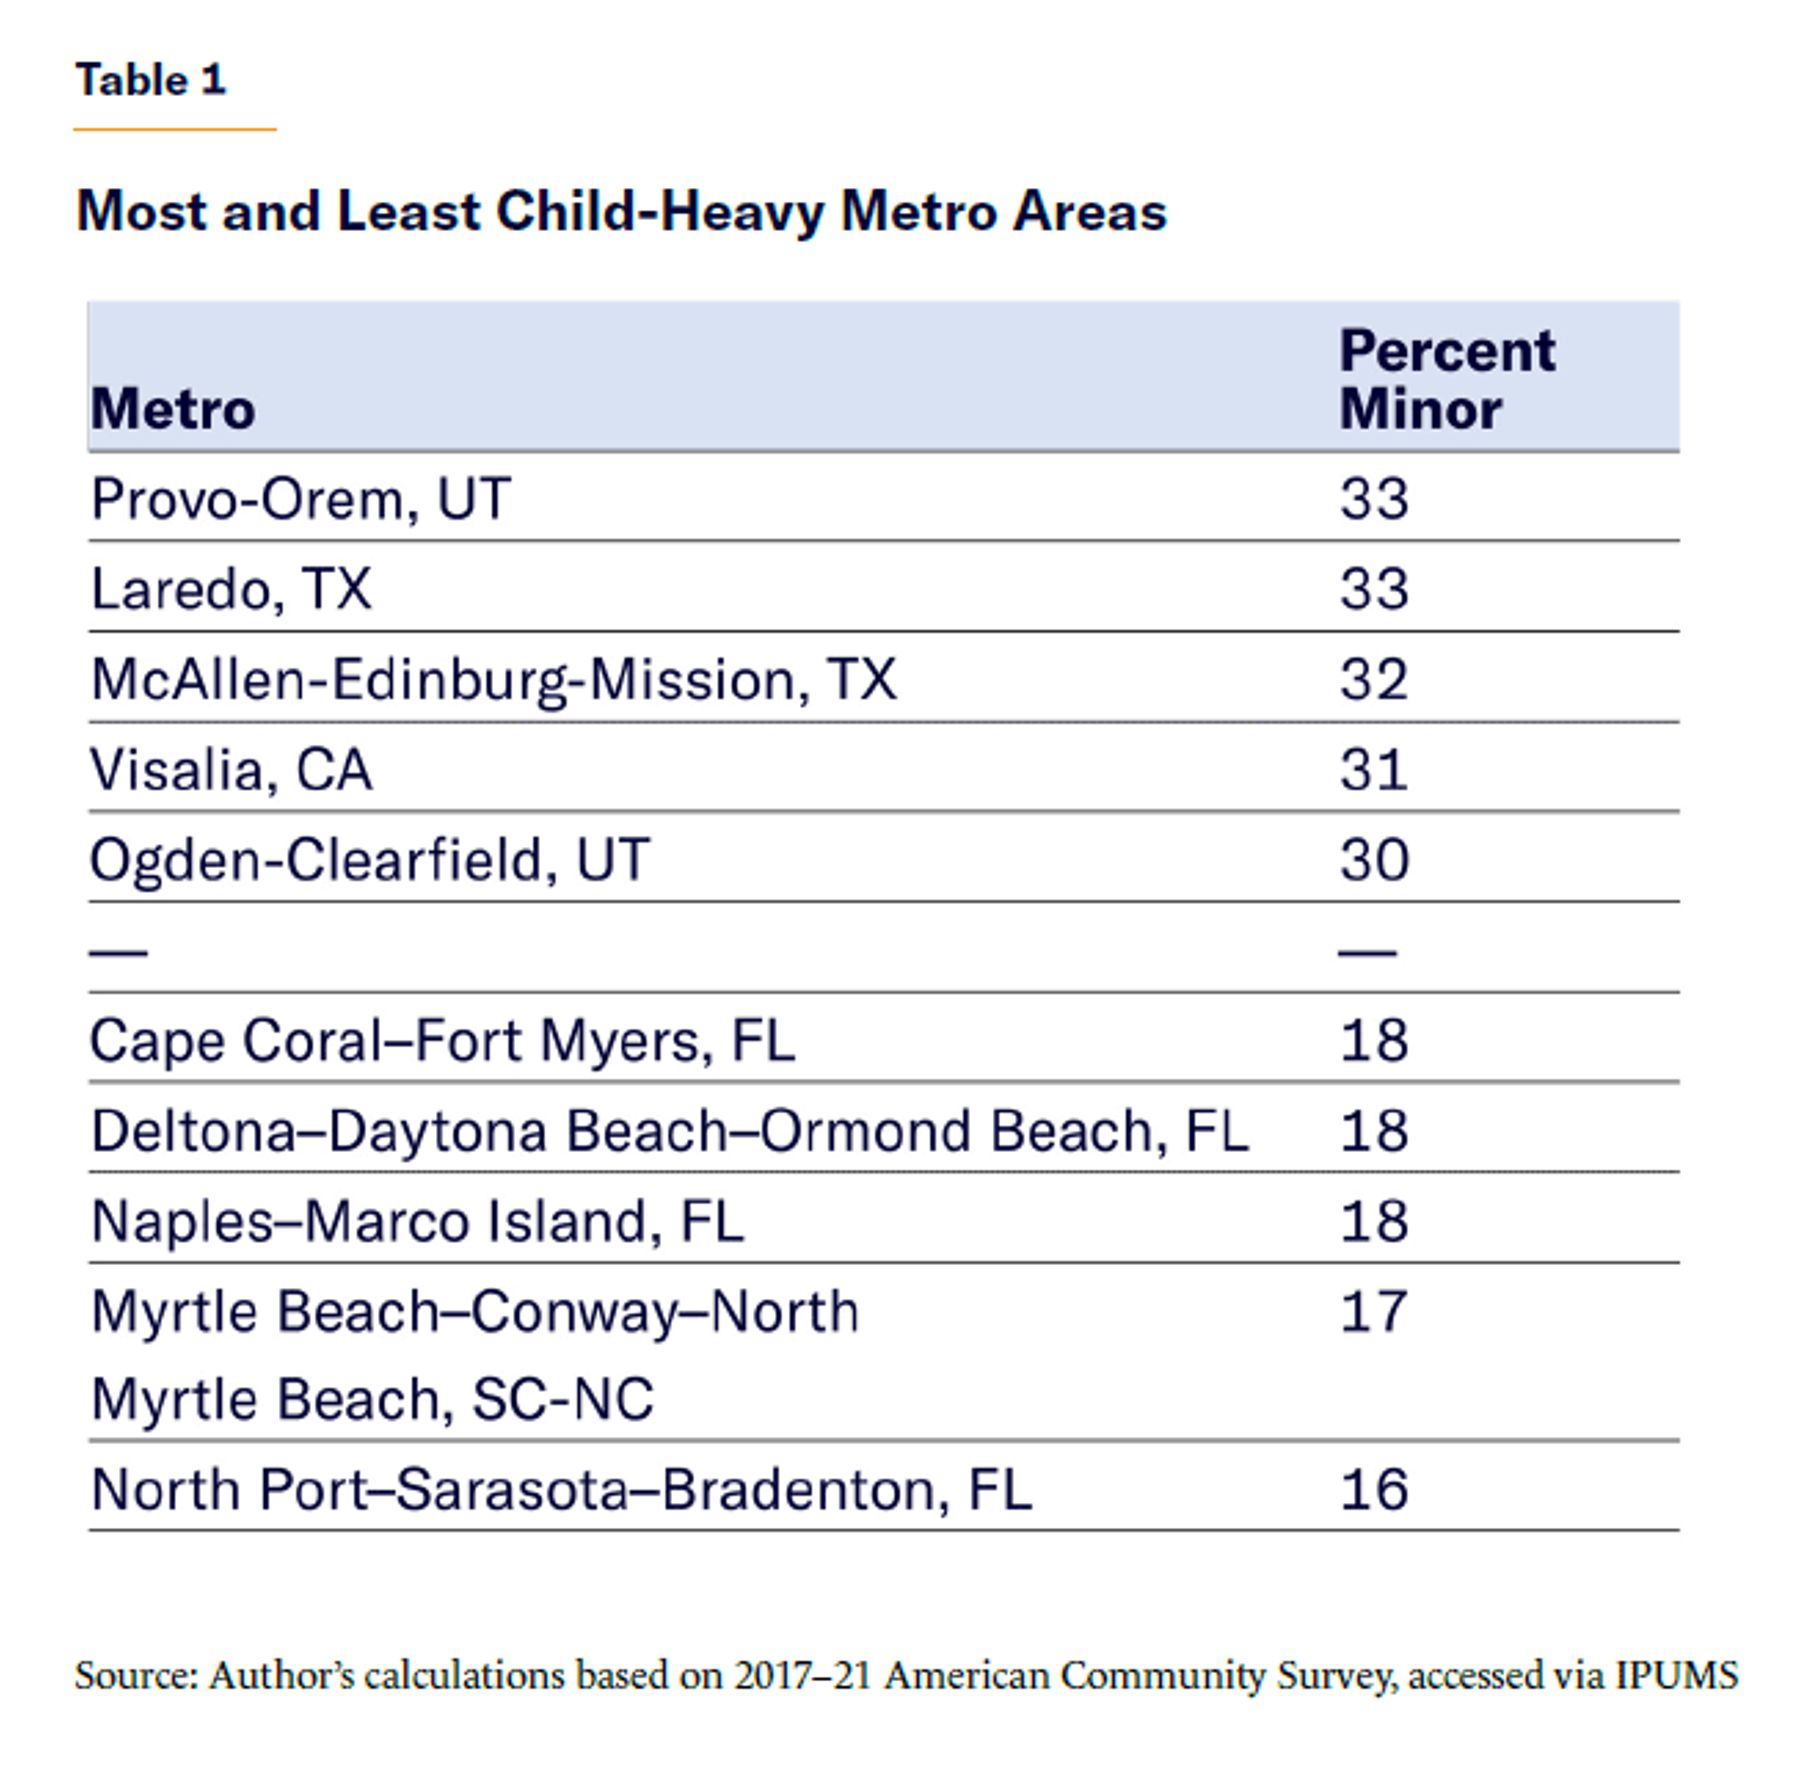
Moving up to the level of metro areas, Table 1 lists the most and least child-dominated metros with at least 250,000 population.[23] (The smaller Punta Gorda, Florida, metro area wins the least-children contest without that restriction. Generally, numbers for smaller metros are measured less precisely, and 250,000 serves as a decent proxy for whether the average reader might have at least a passing familiarity with the place.) For this and similar tables later in the report, I provide the top and bottom of the list, with the middle excluded, with the full rankings available for download.[24] Interestingly, the bottom of the list is dominated by aging areas rather than big-city metros; less surprisingly, the higher-fertility Mormon and Hispanic populations are strongly represented in the metros at the top of the list.
The ACS data allow me to look at the presence of children through other lenses as well. One has to do with migration: When families with children move from one U.S. metro to another, where do they leave and where do they go? Subtracting each metro’s leavers from its arrivers as captured in the ACS and then dividing by population yields a rough estimate of net migration per capita[25]—“rough” because the survey tracks past-year migration and only a small percentage of families move every year, so the effective sample sizes here are reduced massively. (Also, some metros—most notably, Boston and Denver—are, for technical reasons, missing from the IPUMS variable used to identify leavers, and thus must be excluded.) Since the estimates are imprecise, I will highlight some bigger metros rather than making a list: the NYC, San Jose, and Miami[26] metro areas stand out as places losing children, while the Raleigh and Austin metros are gaining children.
Is there anything special about where children are moving, as opposed to other Americans? Yes, but perhaps not as much as one might think. Using the same methods but focusing on the migration of adults aged 25–54 (“prime age”), I calculated the same numbers for parents living with children under 18, adults with no minor children in the household, and adults with and without BAs. All these variables are positively correlated with one another, at about +0.5 or higher. Generally, metros’ levels of appeal follow a similar gradient for prime-age adults of all education and parenthood statuses.
As a reliability check and an additional exercise, I measured child migration using the University of Wisconsin Applied Population Lab’s Net Migration Patterns for U.S. Counties data set, which ends at the 2010s and remains in “beta” but uses methods considerably more precise than those of the ACS.[27] The research team behind the data calculates migration by combining census data with birth and death records, comparing actual populations with a counterfactual in which births and deaths are the only factors that change, the difference indicating the level of migration. I aggregated county-level estimates into metro areas, which should help address one limitation of the data, which is that some mothers give birth in hospitals in nearby counties where they do not live.
Children’s migration patterns from the 2010s do correlate with patterns in the overlapping 2017–21 period (+0.47). However, migration patterns have shifted in important ways recently, especially after the pandemic and the rise of remote work, which is evident in the different ways these two measures correlate with other variables. In the 2017–21 ACS, net child migration is highest in areas where less of the adult population holds a BA (–0.48); subbing out the ACS migration variable for the UW variable eliminates the link. Similarly, the ACS data show child migration to be highest in areas that have lots of children in general among the under-55 population (+0.38), but the connection is not evident using the UW measure. In more recent years, children have been moving to places with more children and fewer highly educated adults in a way they had not been previously.
Last, I analyze how many kids under age five are living with each woman aged 16–49 in the data set, not merely asking which metros have the most fertile populations (which would be mostly redundant with the minor-share-of-population analysis presented above) but statistically controlling for a myriad of demographic variables—specifically, age, race, ethnicity, ancestry, state or foreign location of birth, and education level. This analysis does not necessarily prove that certain metro areas cause new births or fertile young families to move in from elsewhere, but it shows which metros have more young children than one would expect from the demographics of local women in the age range where women are most likely to be bearing and raising young children. I focus on women, of course, because they are typically most likely to have the children in the event of a breakup or to be raising children alone for other reasons, and therefore the number of under-five kids living with a woman is a very good indicator of her recent fertility.
Table 2 displays the coefficients from a Poisson regression, where each observation comprises data from one woman surveyed in the ACS, with larger numbers representing that if a woman lives in a certain metro, she tends to have more young children than demographically similar women elsewhere. The New York City metro area is set as the “reference category” and is thus fixed to zero. The results can approximately be interpreted in percentage terms, such that a coefficient of +0.05 means that women in the given metro have about 5% more young children living with them than demographically comparable women in the NYC area. The regression is performed on all available metros but, as always, I rank only those with at least 250,000 population.
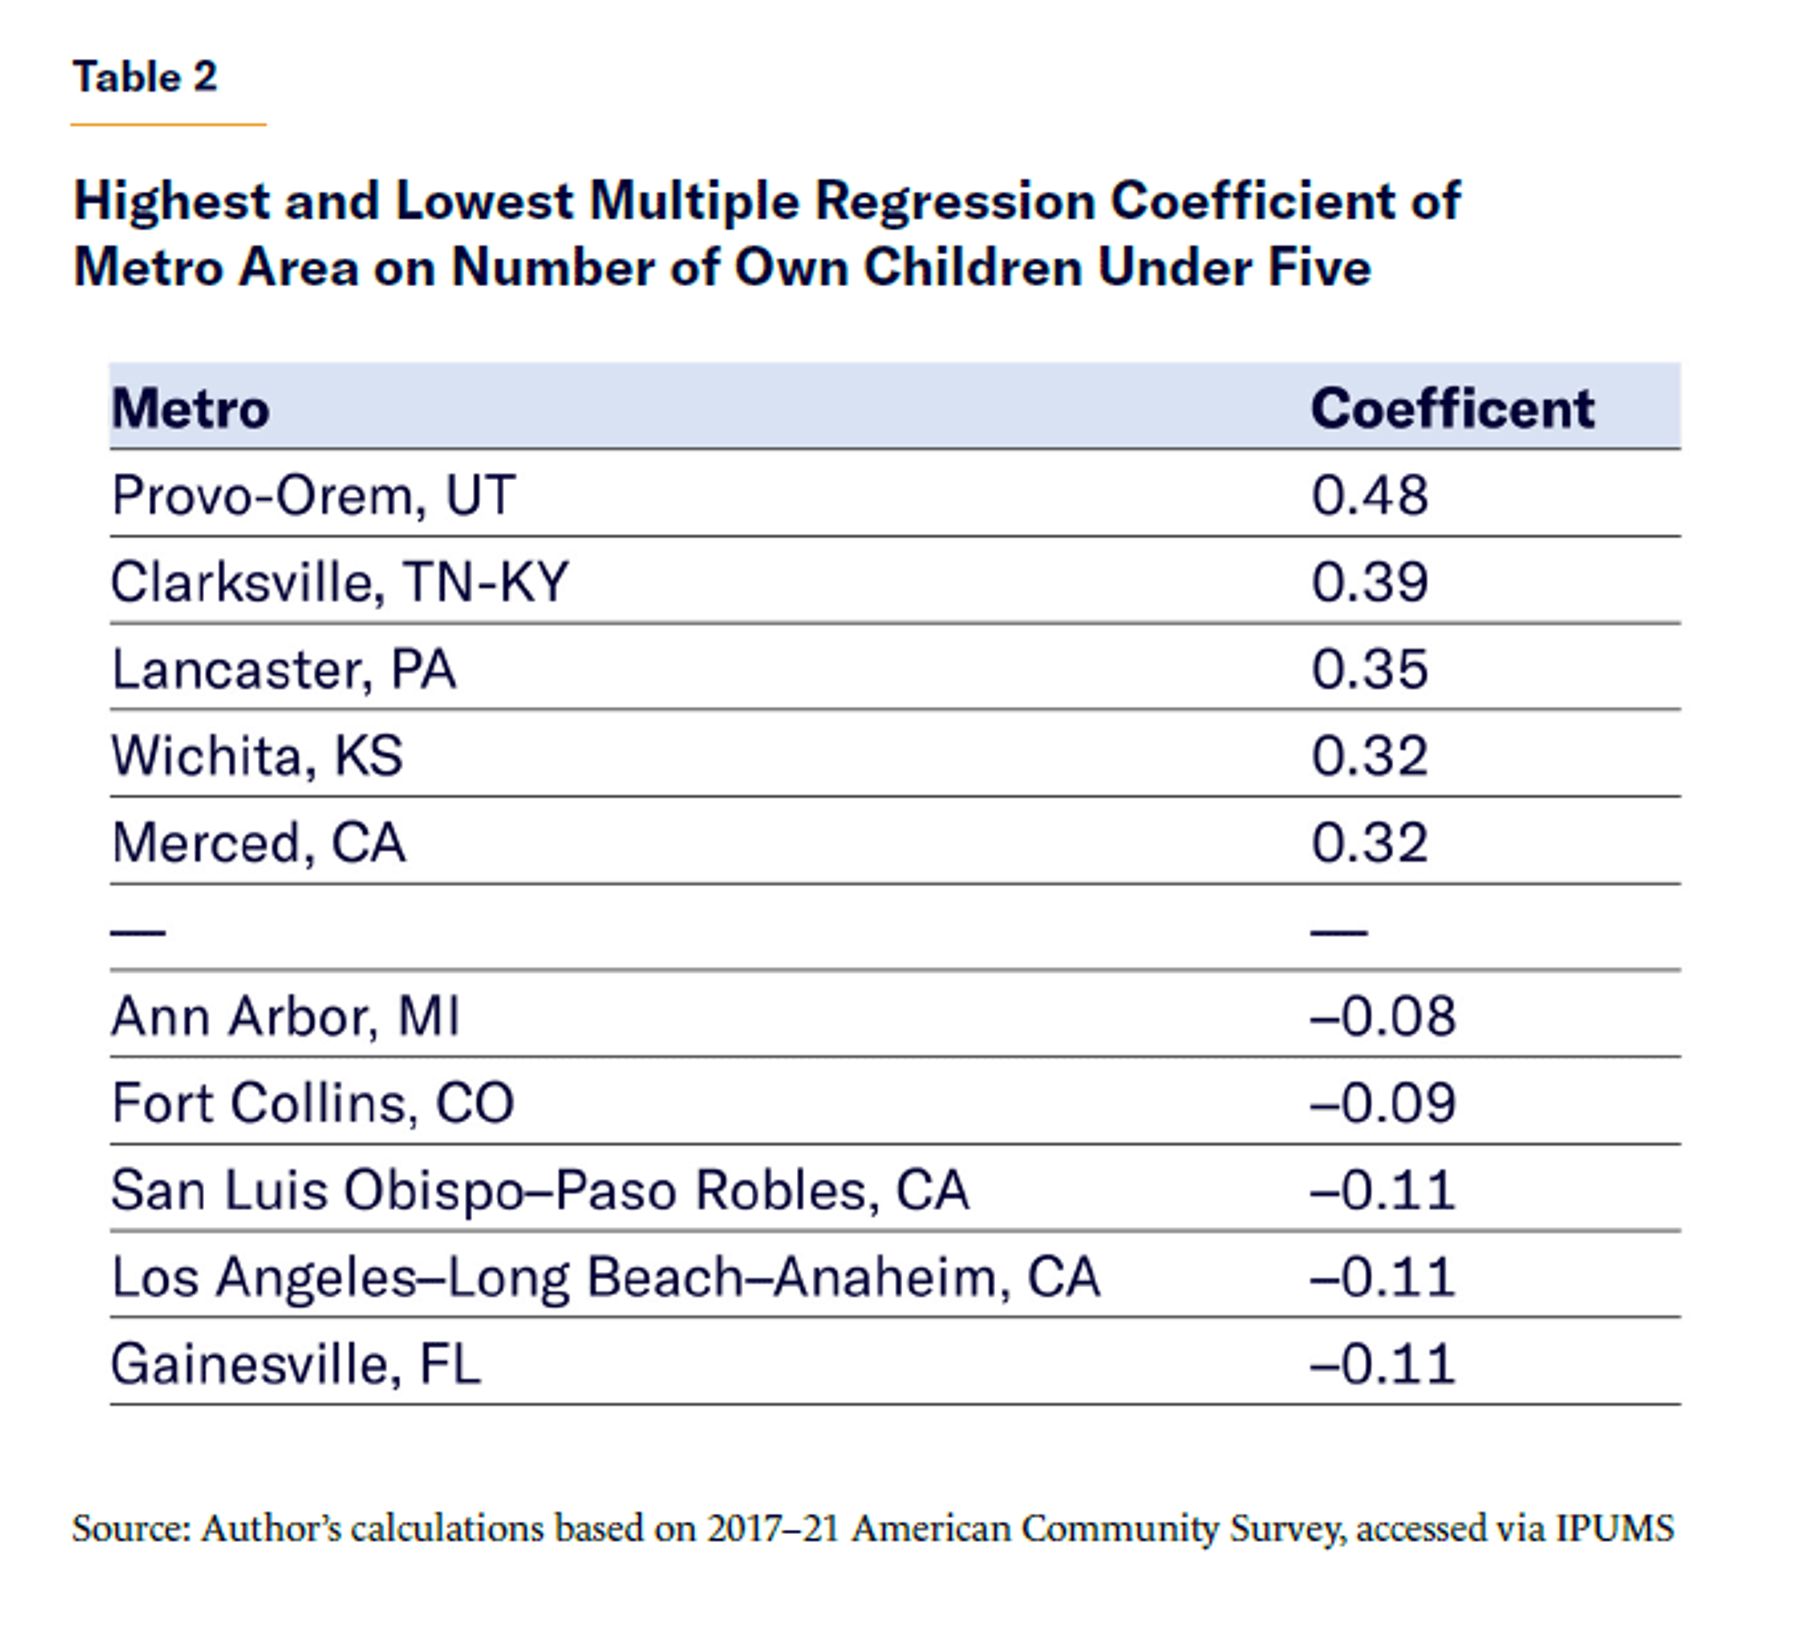
Of course, the dominance of highly Mormon Provo-Orem, Utah, suggests that religion could be an important factor not captured in the ACS. This will not be the last time that Provo-Orem appears in this report.
The Many Measures of Well-Being
In addition to knowing where kids are being born and moving, we might want to know where children are thriving in ways that, while subjective, are widely agreed to be important. To explore this question, I compiled a wealth of data on how children fare in various metro areas. These aspects of metro areas tend to be fairly stable in the short term, but it is worth noting that different data sources cover somewhat different years, and I chose the most recent data when several choices were available.
These numbers enrich our understanding of which metros are friendliest to children. Viewed alongside migration and fertility patterns, they help us see whether metros that are healthy for children are also the ones where families are forming and moving.
Education
An issue of special concern, for families looking to move and for social scientists studying upward mobility, is the quality of schools. Actually measuring school quality, however, is difficult, since schools differ widely in the students they serve, and different demographics of students face different obstacles. Even a very good school could have middling test scores if it serves highly disadvantaged students, for instance, while even a mediocre school might boast high test scores if it serves the privileged.
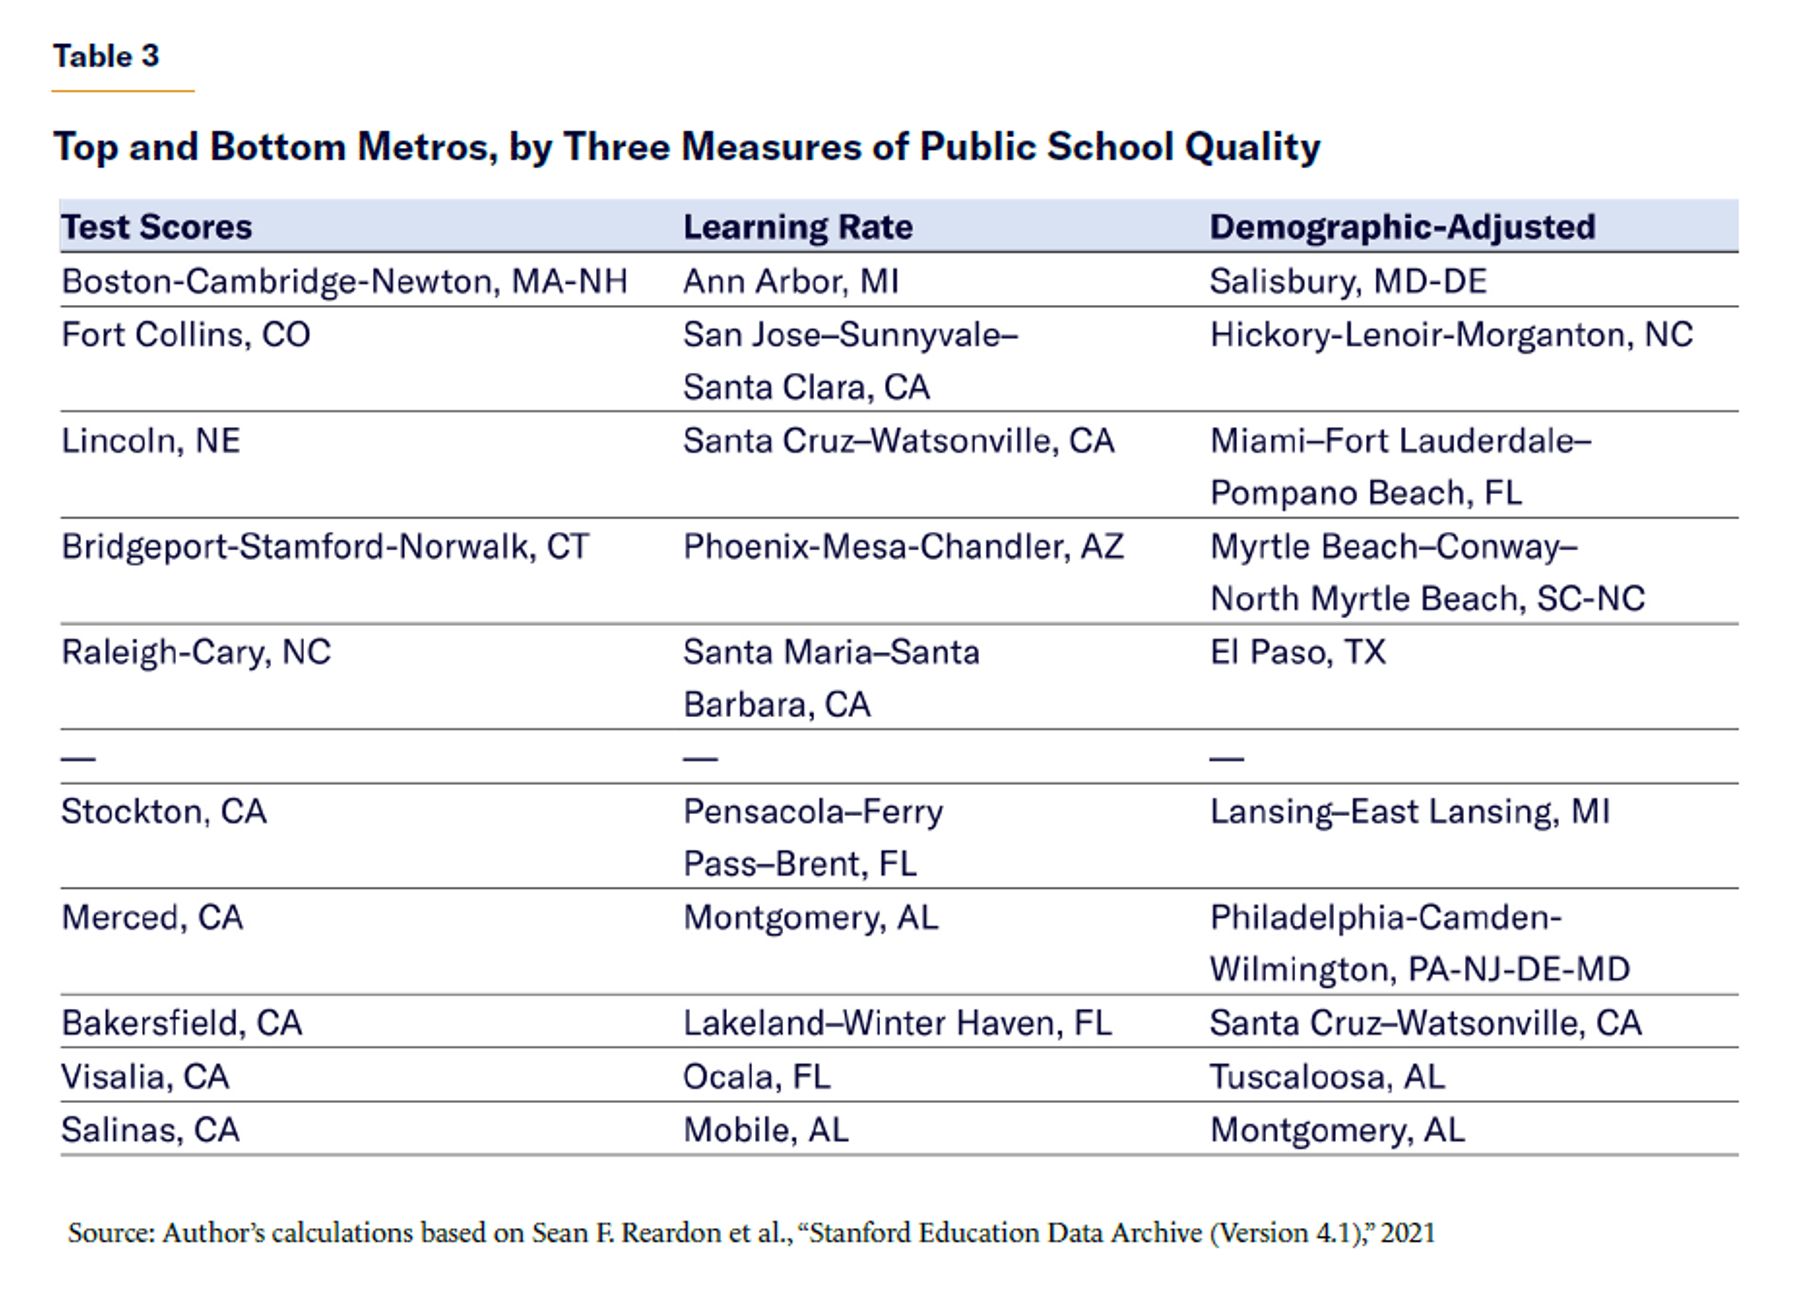
I thus measured metros’ public school quality in three ways, all of them drawing on the Stanford Education Data Archive (SEDA),[28] which provides numerous statistics summarizing metros’ educational performance[29] and offers demographic information.
One measure is simply state test scores, which SEDA converts to a common metric. This represents overall student performance, which is of interest even aside from its (limited) value as an indicator of school quality. The second measure is the “grade slope” of test scores as calculated by SEDA, which represents the “learning rate” from grade to grade.
The third measure stems from my own analysis of SEDA’s data: I created a model that, at the metro-area level, predicts average test scores based on metros’ median income, unemployment, rate of female-headed households, percentage of adults with a BA, and percentages of students who are English-language learners, receive free lunch, and are black, Hispanic, Asian, and Native American—a total of 10 control variables to account for factors outside schools’ control, plus a weight for the total number of assessments given so that bigger metros exert more influence on the results. The extent to which each metro outperforms or underperforms what one would expect, based on these factors, is captured in the model’s “residuals.”[30] Of course, an adjustment like this is never perfect; for example, the Asian and Hispanic populations are diverse within themselves, and controlling for the overall categories cannot account for that. And there are certainly many education-relevant societal factors not captured in this or any data set.
Interestingly, these three metrics measure rather different things. The test-score slopes are not strongly related with either of the other measures. Places with the highest test scores, with or without adjusting for demographics, do not also tend to have the fastest academic progress. The demographic-adjusted test scores still correlate with the overall test scores that they are calculated from, unsurprisingly—but only at +0.53.
Which metros have the best and worst education thus depends on how one prefers to conceptualize good education (Table 3). In the cross-correlations, most of the relationships are rather weak, though the minor share of the under-55 population is higher in places with low test scores (–0.38), and net child migration is higher in places with slower learning rates (–0.27). City-to-suburb movement likely takes kids to places with better schools, but the metro-to-metro moves captured in my data show little sign of this.[31]
Upward Mobility and Social Capital
In a landmark 2018 study,[32] economists Raj Chetty and Nathaniel Hendren leveraged tax data to show that some counties cause more upward mobility than others—moving beyond raw correlations by analyzing the outcomes within families that move between counties, with younger siblings spending more time in the new place. I rely on their causal estimates of how much adult income increases or decreases when a child born at the 25th percentile of the national income distribution spends an extra year in a given county.[33] The county-level estimates can easily be aggregated to metro areas (which, after all, are collections of counties), as long as one gives more populous counties more weight in computing the averages.
Relatedly, Senator Mike Lee’s Social Capital Project aggregated numerous signs of social capital[34]—such as family unity, philanthropy, and strength of friendships—into a public index. A less intricate, but still commonsensical, measure of social capital is simply the proportion of adults in each metro who hold BAs. These I calculated from the ACS data discussed above, restricted to those aged 25–54.
Table 4 displays the rankings for these three measures, with Provo-Orem yet again topping a list.
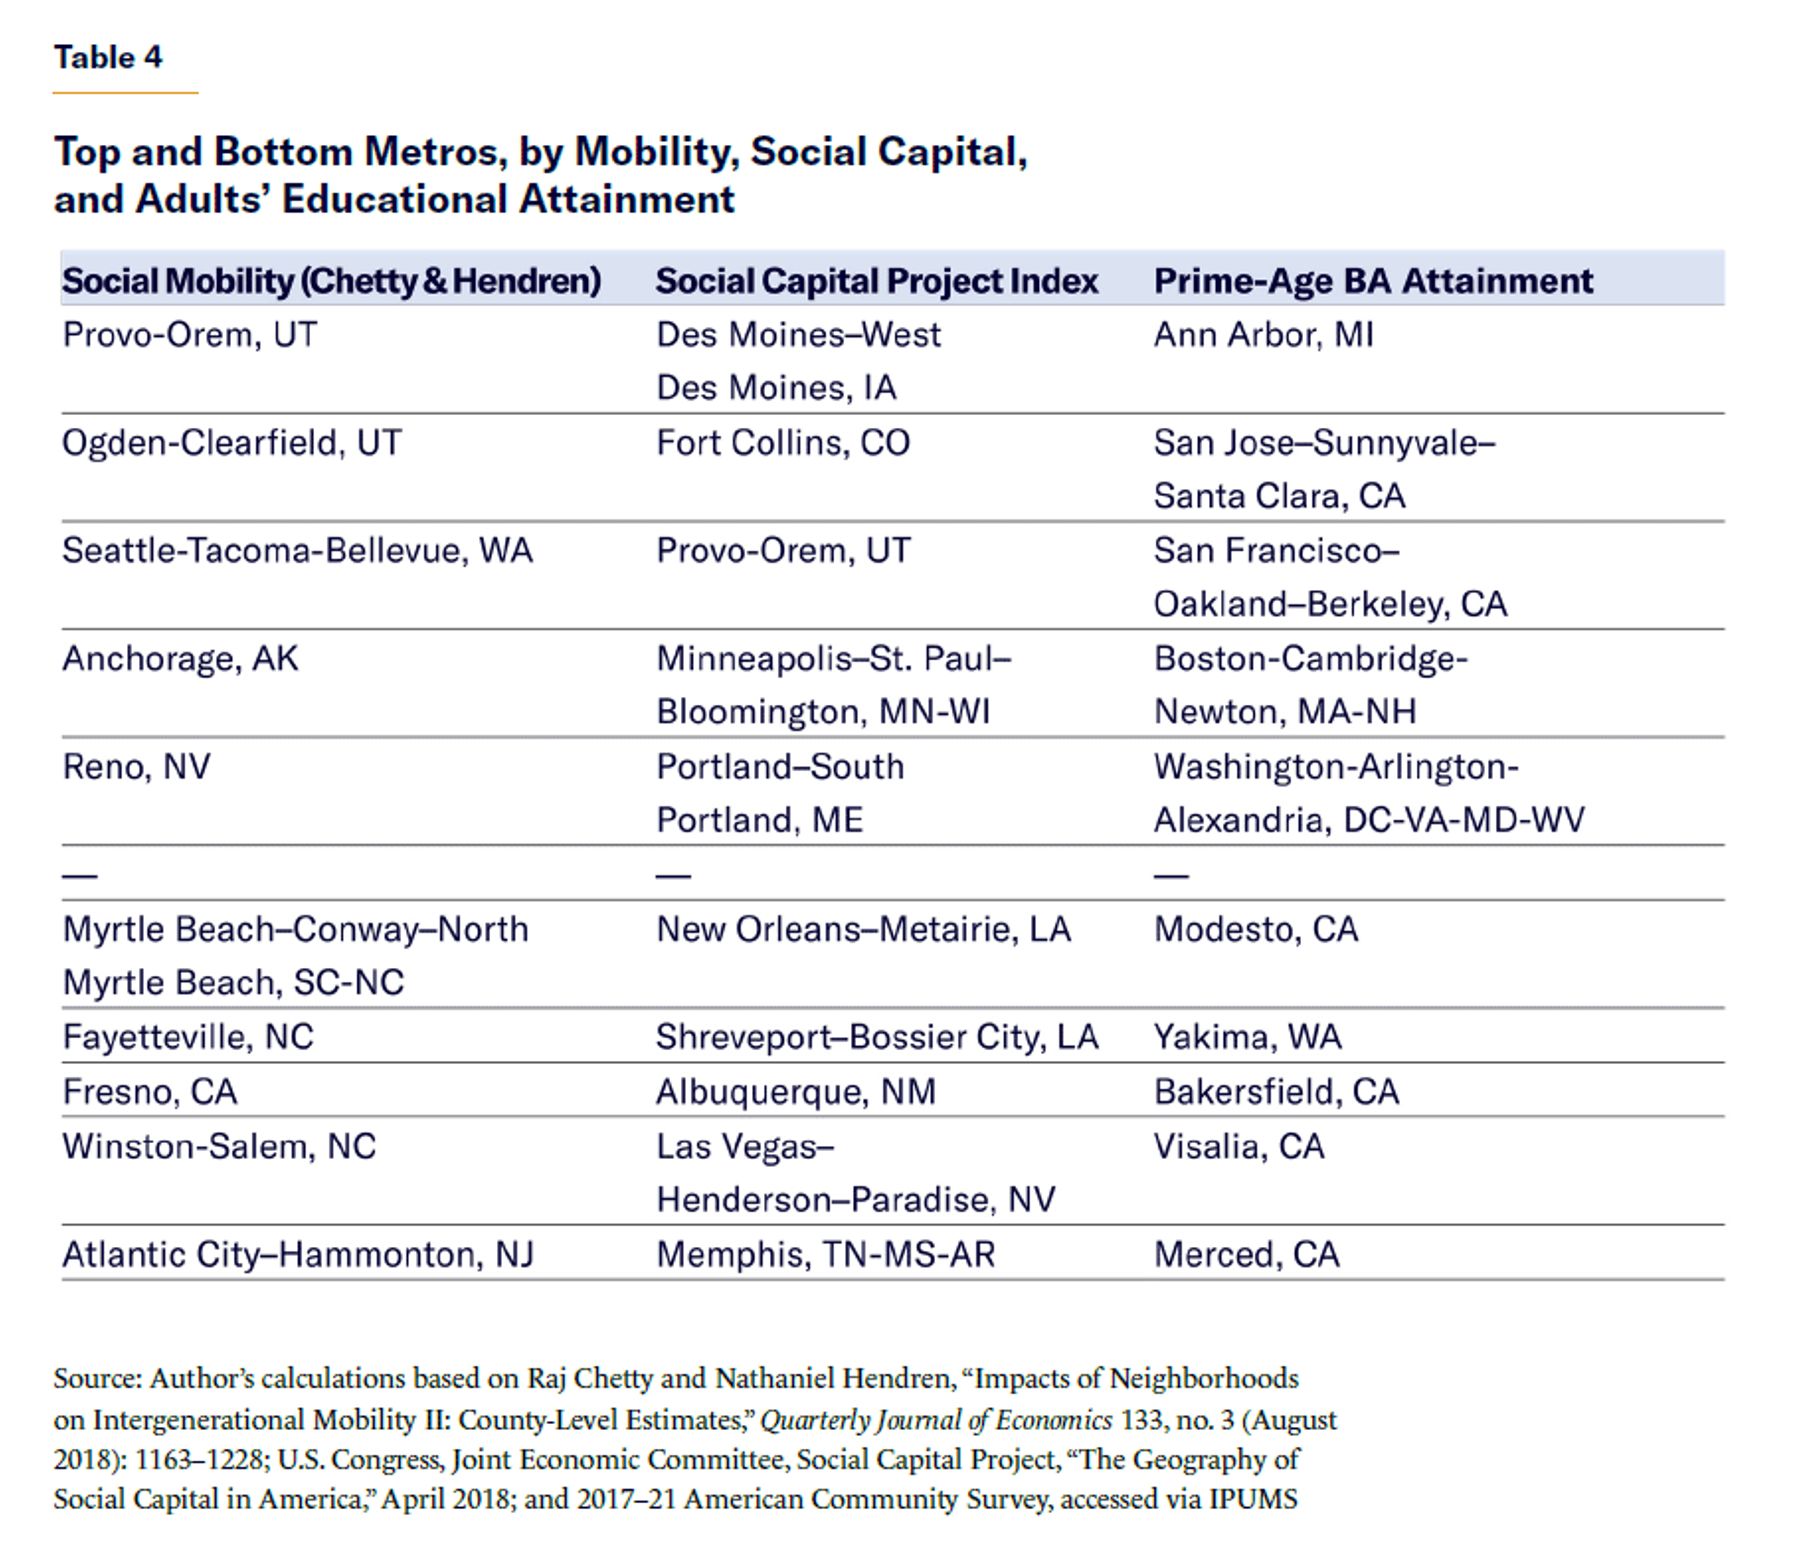
The mobility and social-capital-index measures (columns 1 and 2 in Table 4) tend to correlate weakly, if at all, with measures of where the most kids are living and moving. As with education, parents may gain these benefits from shifting from city to suburb, rather than from metro to metro. As Edward Glaeser noted: “Cities appear to be almost as bad for upward mobility as they are good for productivity.”[35]
Net child in-migration and minor shares of the under-55 population are both higher in metros where fewer prime-age adults have BAs (–0.48 and –0.58, respectively). Less educated women tend to have more children: per the Centers for Disease Control and Prevention (CDC), the total fertility rate for those who graduated high school but did not attend college is about two children per woman; for those with exactly a BA, it is roughly 1.3.[36]
Mortality: Health, Crime, and Social Dysfunction
County Health Rankings, a project of the University of Wisconsin Population Health Institute,[37] compiles and updates a variety of statistics at the county level. Three are key mortality rates drawn from 2014–20 CDC data, which paint a picture of children’s health and the crime and social dysfunction that surrounds them in the broader population: child mortality, drug overdose mortality, and homicide mortality (Table 5). The top listed metros have the lowest death rates.
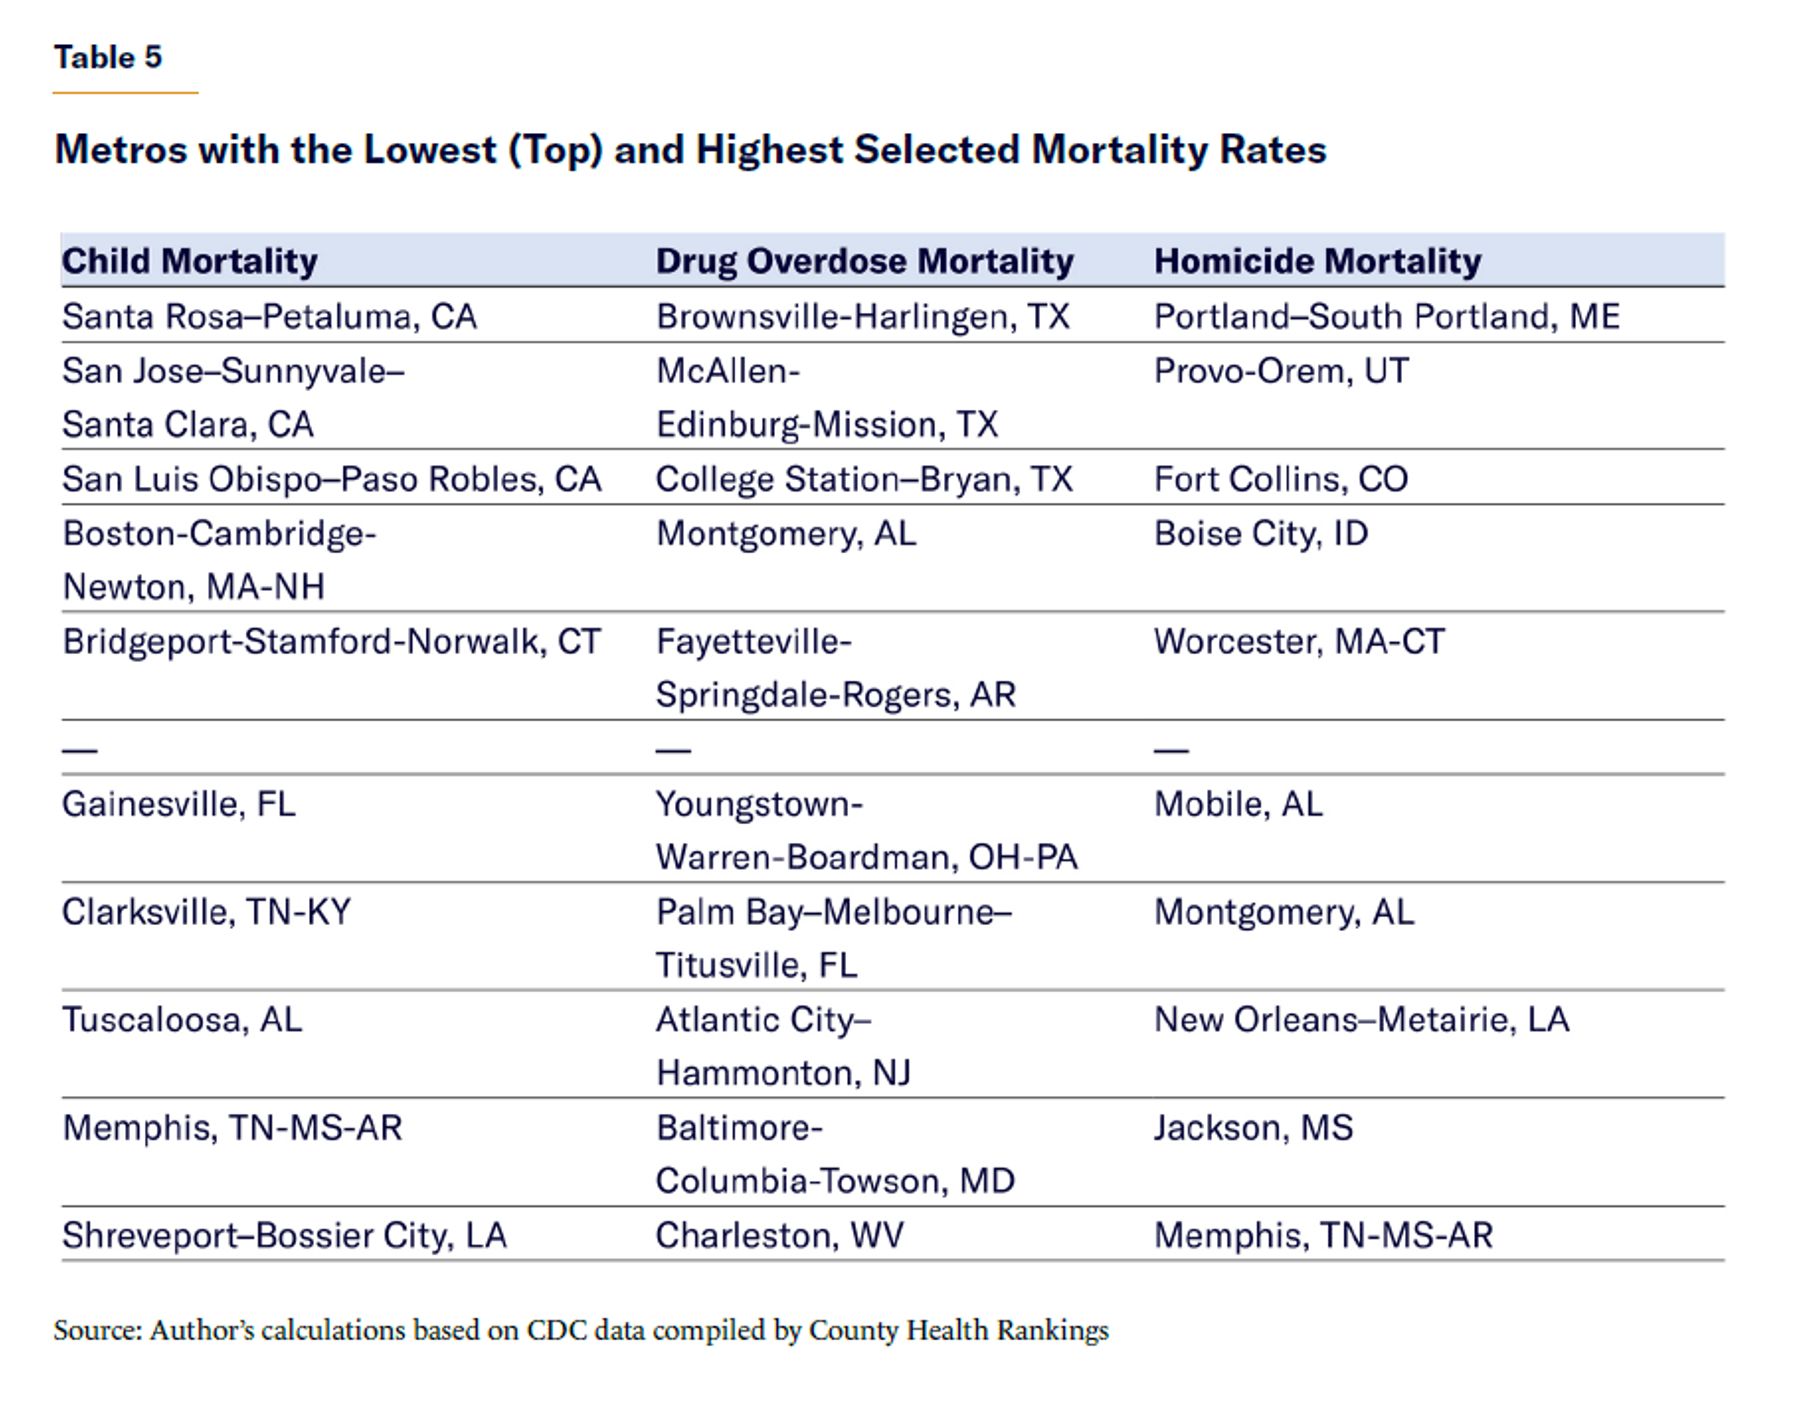
In the cross-correlations, two things stand out. First, distressingly, metros with higher net child migration tend to have more child mortality (+0.42). Second, despite crime being a much-discussed reason for people to flee big cities, places with higher homicide rates do not have lower net child migration; to the contrary, homicide rates and net child migration correlate weakly and positively (+0.17). Yet again, family migration has tended to run from city to suburb, in addition to the metro-to-metro moves that I analyze here.
Child Poverty
When asking how children are faring in various metro areas, poverty rates are an obvious factor to consider. Even with working from home on the rise, many parents’ fates will be different in different places. One recent study found that roughly “half of the variation in mean wages across [commuting zones] is attributable to differences in worker ability…. [T]he other half is attributable to place effects.”[38]
But which poverty rate should one use to compare metros? The Census Bureau provides two rates: the long-standing Official Poverty Measure (OPM); and the newer Supplemental Poverty Measure (SPM). Both measures work by comparing a measure of resources to a threshold representing what it costs to satisfy an economic unit’s basic needs, but they differ in fundamental ways.[39]
OPM counts only cash income, such as wages, salaries, cash welfare, and Social Security payments, but ignores in-kind transfers, such as food stamps and even refundable tax credits (sent as a refund check if the beneficiary has no tax liability and thus cannot use a tax credit in the traditional fashion). It has long been criticized for ignoring the entire noncash safety net, which has grown immensely in recent decades.
Meanwhile, SPM takes a much more comprehensive accounting of a family’s government benefits, and its thresholds include a geographic adjustment for housing costs because meeting basic housing needs costs different amounts in different places. It even has somewhat different thresholds for those who rent, those with mortgages, and those who own their dwellings outright. It is clearly much more thorough and sophisticated. Relative to OPM, SPM tends to find much lower poverty rates for children and much higher rates for the elderly, since children benefit much more from programs such as refundable tax credits.
However, some have taken issue with geographic adjustment.[40] Poverty rates not adjusted for local costs, for example, better correlate with other measures of well-being, such as owning appliances and having secure access to adequate food. However, on a more intuitive level, it seems odd to find, as SPM does (to considerable media interest), that California has the worst state-level poverty rate in the nation, higher even than Mississippi.[41]
Since the measures capture different aspects of poverty—specifically, a lack of cash measured in the national context vs. a lack of total resources after considering local housing costs—I present both (Table 6).[42] The Census Bureau did not measure SPM at all in 2020, owing to the pandemic’s effects on survey work, so I calculated metro-level child poverty rates over the years 2018, 2019, and 2021. (I left out 2017, to avoid giving so much more weight to the pre-pandemic status quo than is the case for my other ACS variables.) The top listed metros have the lowest poverty rates.
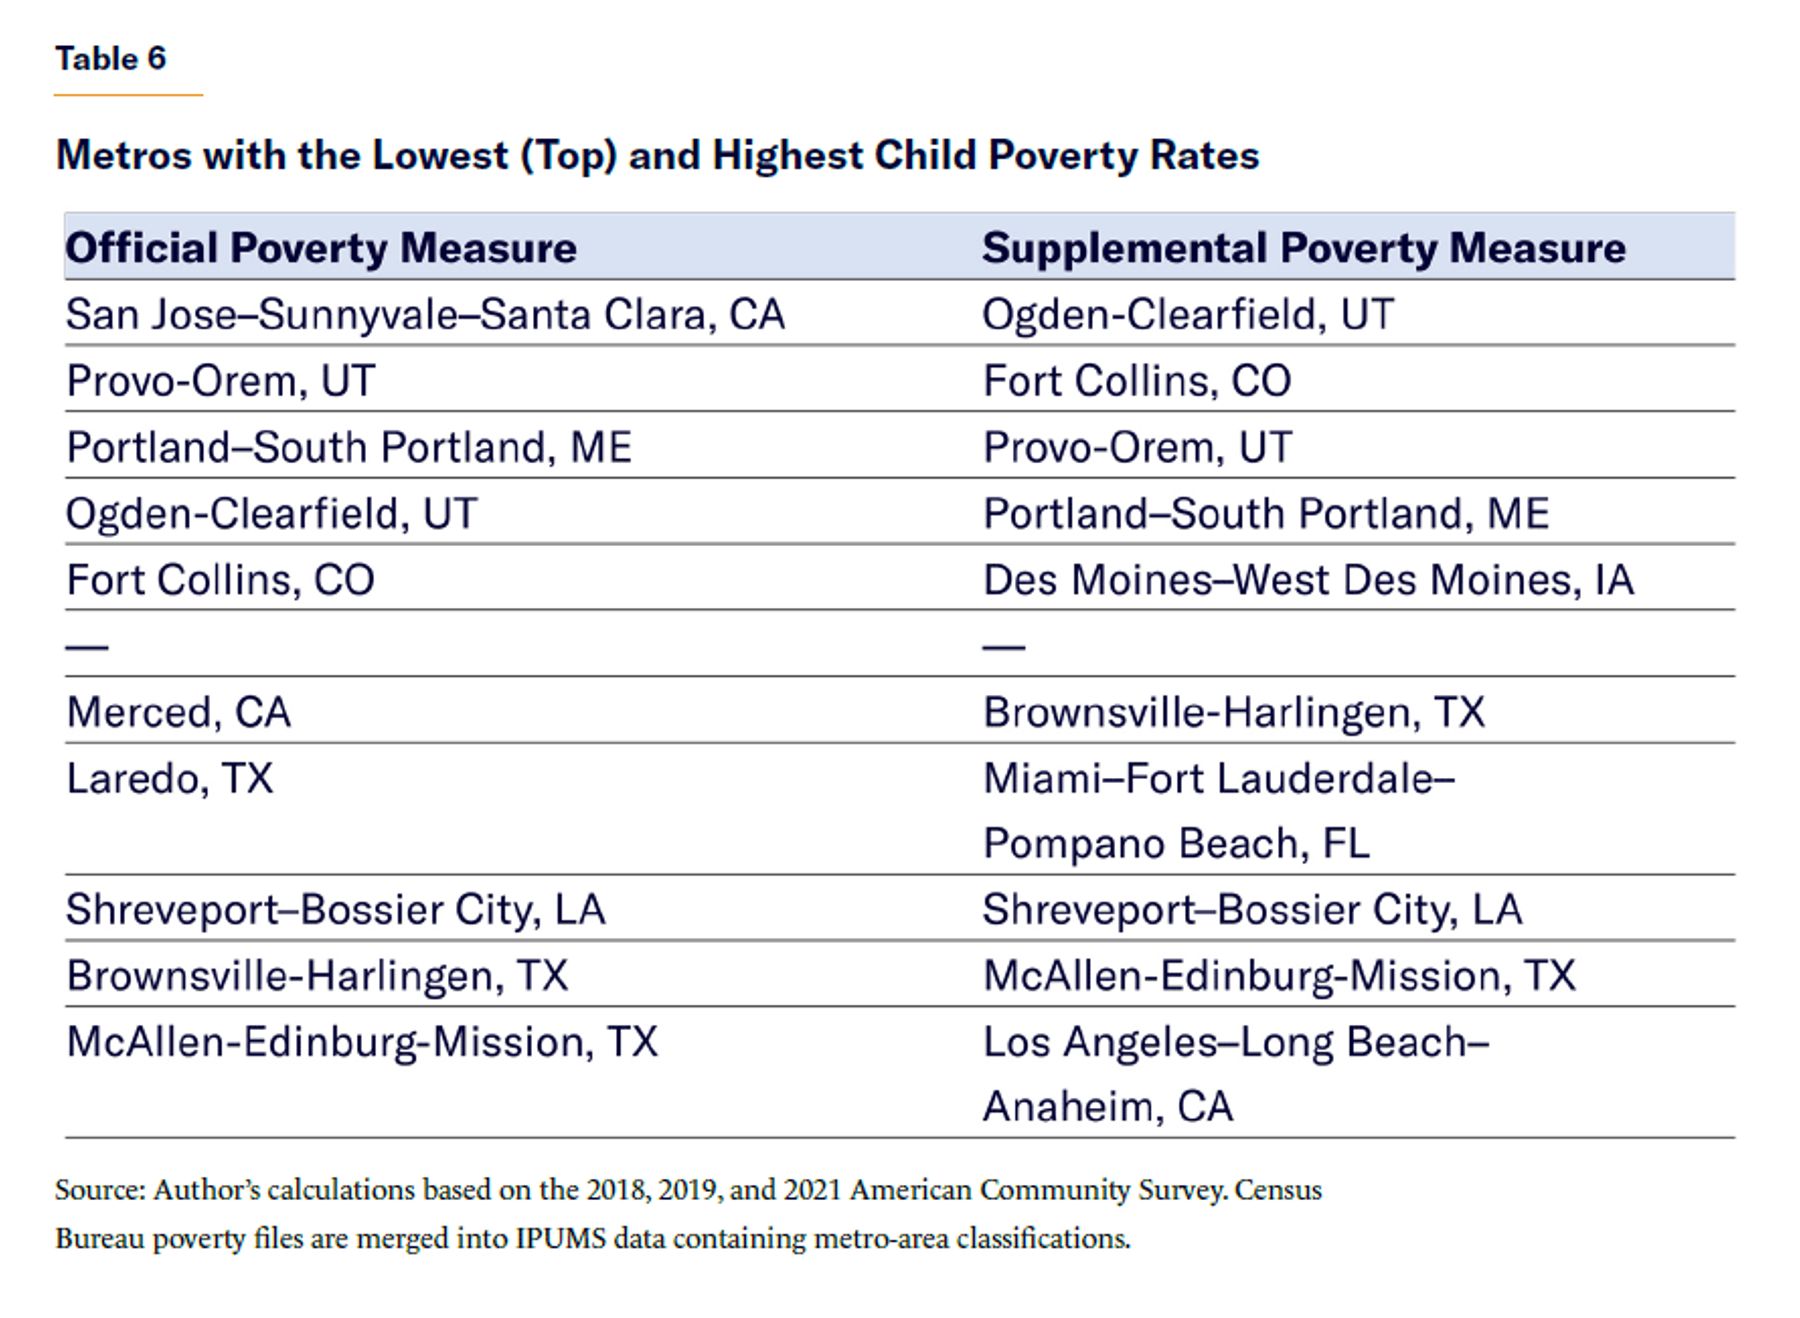
These two measures correlate positively with each other (+0.43), and the extremely high and low scorers overlap strongly. But the measures correlate in opposite ways with many other important variables. Metros with higher OPM rates tend to have somewhat higher net migration of children (+0.19), suggesting that kids are being moved to places with more child poverty. But SPM tells the opposite story (–0.34). Similarly, the places with high OPM child poverty tend to have more children living there as a share of the under-55 population (+0.43), suggesting that children are disproportionately living in the places that are worst for them economically; but the relationship disappears using SPM (–0.11).
Child poverty is the last topic in this section—but not because it is the least important. Instead, I discuss it here because the differences between OPM and SPM illustrate an overriding fact about my data set: cost of living is a powerful variable that, beyond complicating any analysis of metros’ economic pros and cons, seems to have a lot of explanatory power in and of itself. Let’s explore that concept in more detail.
Cost (of Living) Rules Everything Around Me
Owing largely to accidents of geography, industry, and migration, some cities in the U.S. have become packed. For example, New York, America’s most populous city, owes its size largely to geography. The water’s “initial depth, the Hudson River and its location, and the other advantages provided by the water-borne connection to the Great Lakes ensured that this port would be America’s port,” as Edward Glaeser has written. This “attracted manufacturing and services to cater to the mercantile firms and to take advantage of their low shipping costs.”[43] By the time shipping became easier elsewhere, New York’s established density fortuitously helped it serve as a hub for information-heavy industries that relied on face-to-face contact, such as finance and business services.
New York and other coastal economic hubs such as San Francisco, however, came to resist their own densification with intense zoning restrictions. According to Aaron Renn, New York more or less capped its own population—which doubled between 1900 and 1960 but has grown only 8% since—by refusing to accommodate more people with, for example, taller apartment buildings and “scaled up” infrastructure to match. The effect of a cap on housing supply, naturally, is soaring prices. Other economic-powerhouse “superstar” cities did similar things.[44]
These zoning restrictions reduce density relative to what would happen otherwise, but they tend to be strongest in the densest places.[45] For instance, at the metro level, the Zoning Restrictiveness Index, calculated by Matthew Mleczko and Matthew Desmond by processing the text of local zoning codes,[46] correlates positively and strongly with measures of population density (roughly +0.6, or +0.4 with the outlier-but-important New York area removed).[47]
A side effect of high demand, rising prices, and housing supply constraints is that moving to (or staying in) big, productive cities becomes especially difficult for the less educated and lower-earning, as other research has documented. For these individuals, higher housing costs overtook the advantages of higher wages in dense urban places long ago.[48] Today, elite coastal metros, and dense areas in general, are heavy on the educated, stemming from this effect and from the general tendency of the highly educated to cluster in urban centers.
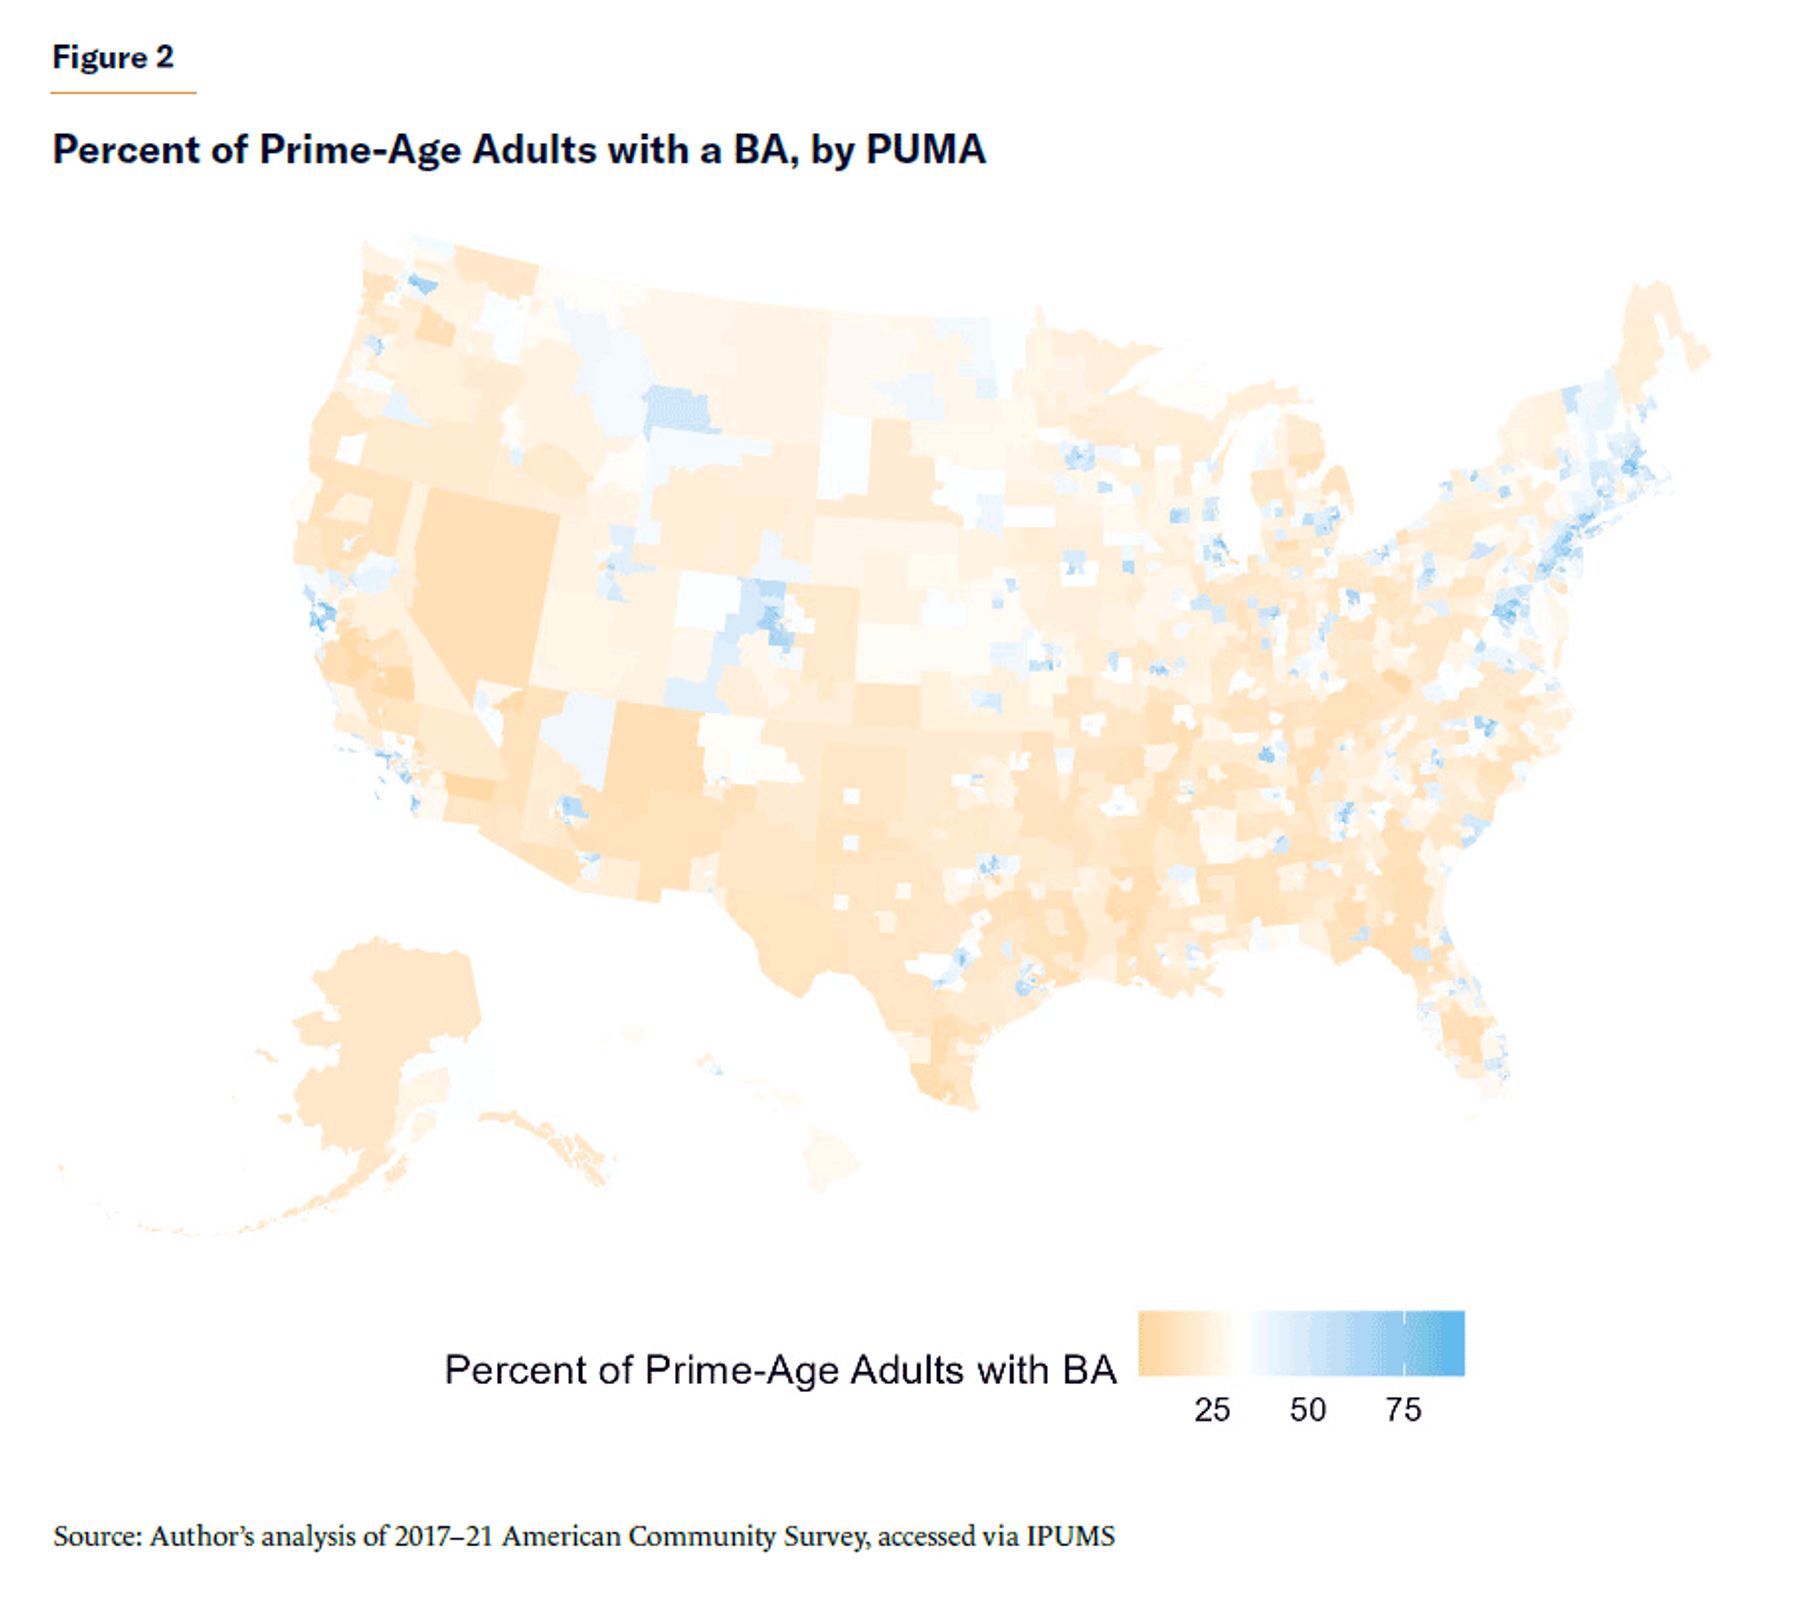
I created a PUMA-level map (Figure 2), similar to the one of the minor percentage of the population presented earlier, depicting the percentage of the 25–54 population who hold a BA in the 2017–21 ACS. As in the previous map, I set the median PUMA to show up as white—and recall that PUMAs are designed to have roughly the same population. But since the high-BA areas are so much denser, approximately the same number of people occupy a smaller geography, and thus, the orange areas swamp the blue areas on the map visually. The D.C.-to-Boston corridor along the East Coast especially stands out.
This combination—density, high demand, high housing prices thanks to artificial supply constraints, and educated populations—might have been good problems to have, at least from the standpoint of city governments, 15 years ago. Yet they put cities in a difficult position when fewer people (knowledge workers in particular) are tethered to big cities by jobs reliant on features such as ports and face-to-face social contact. As a New York Times analysis of ACS data recently found, the educated have now joined the less educated in leaving the most expensive coastal cities.[49]
It’s not hard to see what is happening. As the economic forces that once shoved these people into cities weaken, the option of heading somewhere cheaper and less dense—more room for less money—starts to look more attractive. Dense places cannot compete with that combination directly, for if they lifted their zoning regulations to bring down prices, they would become even more dense, and if they artificially reduced their housing supply to de-densify, they would drive prices up. Both room and price are especially pressing concerns for families, as opposed to singles and childless couples, whose smaller households require less space and less (or no) spending on essentials from diapers to preschool to high school sports equipment. Over time, demand for space has risen along with living standards in general, with per-person living space roughly doubling over the past half-century.[50]
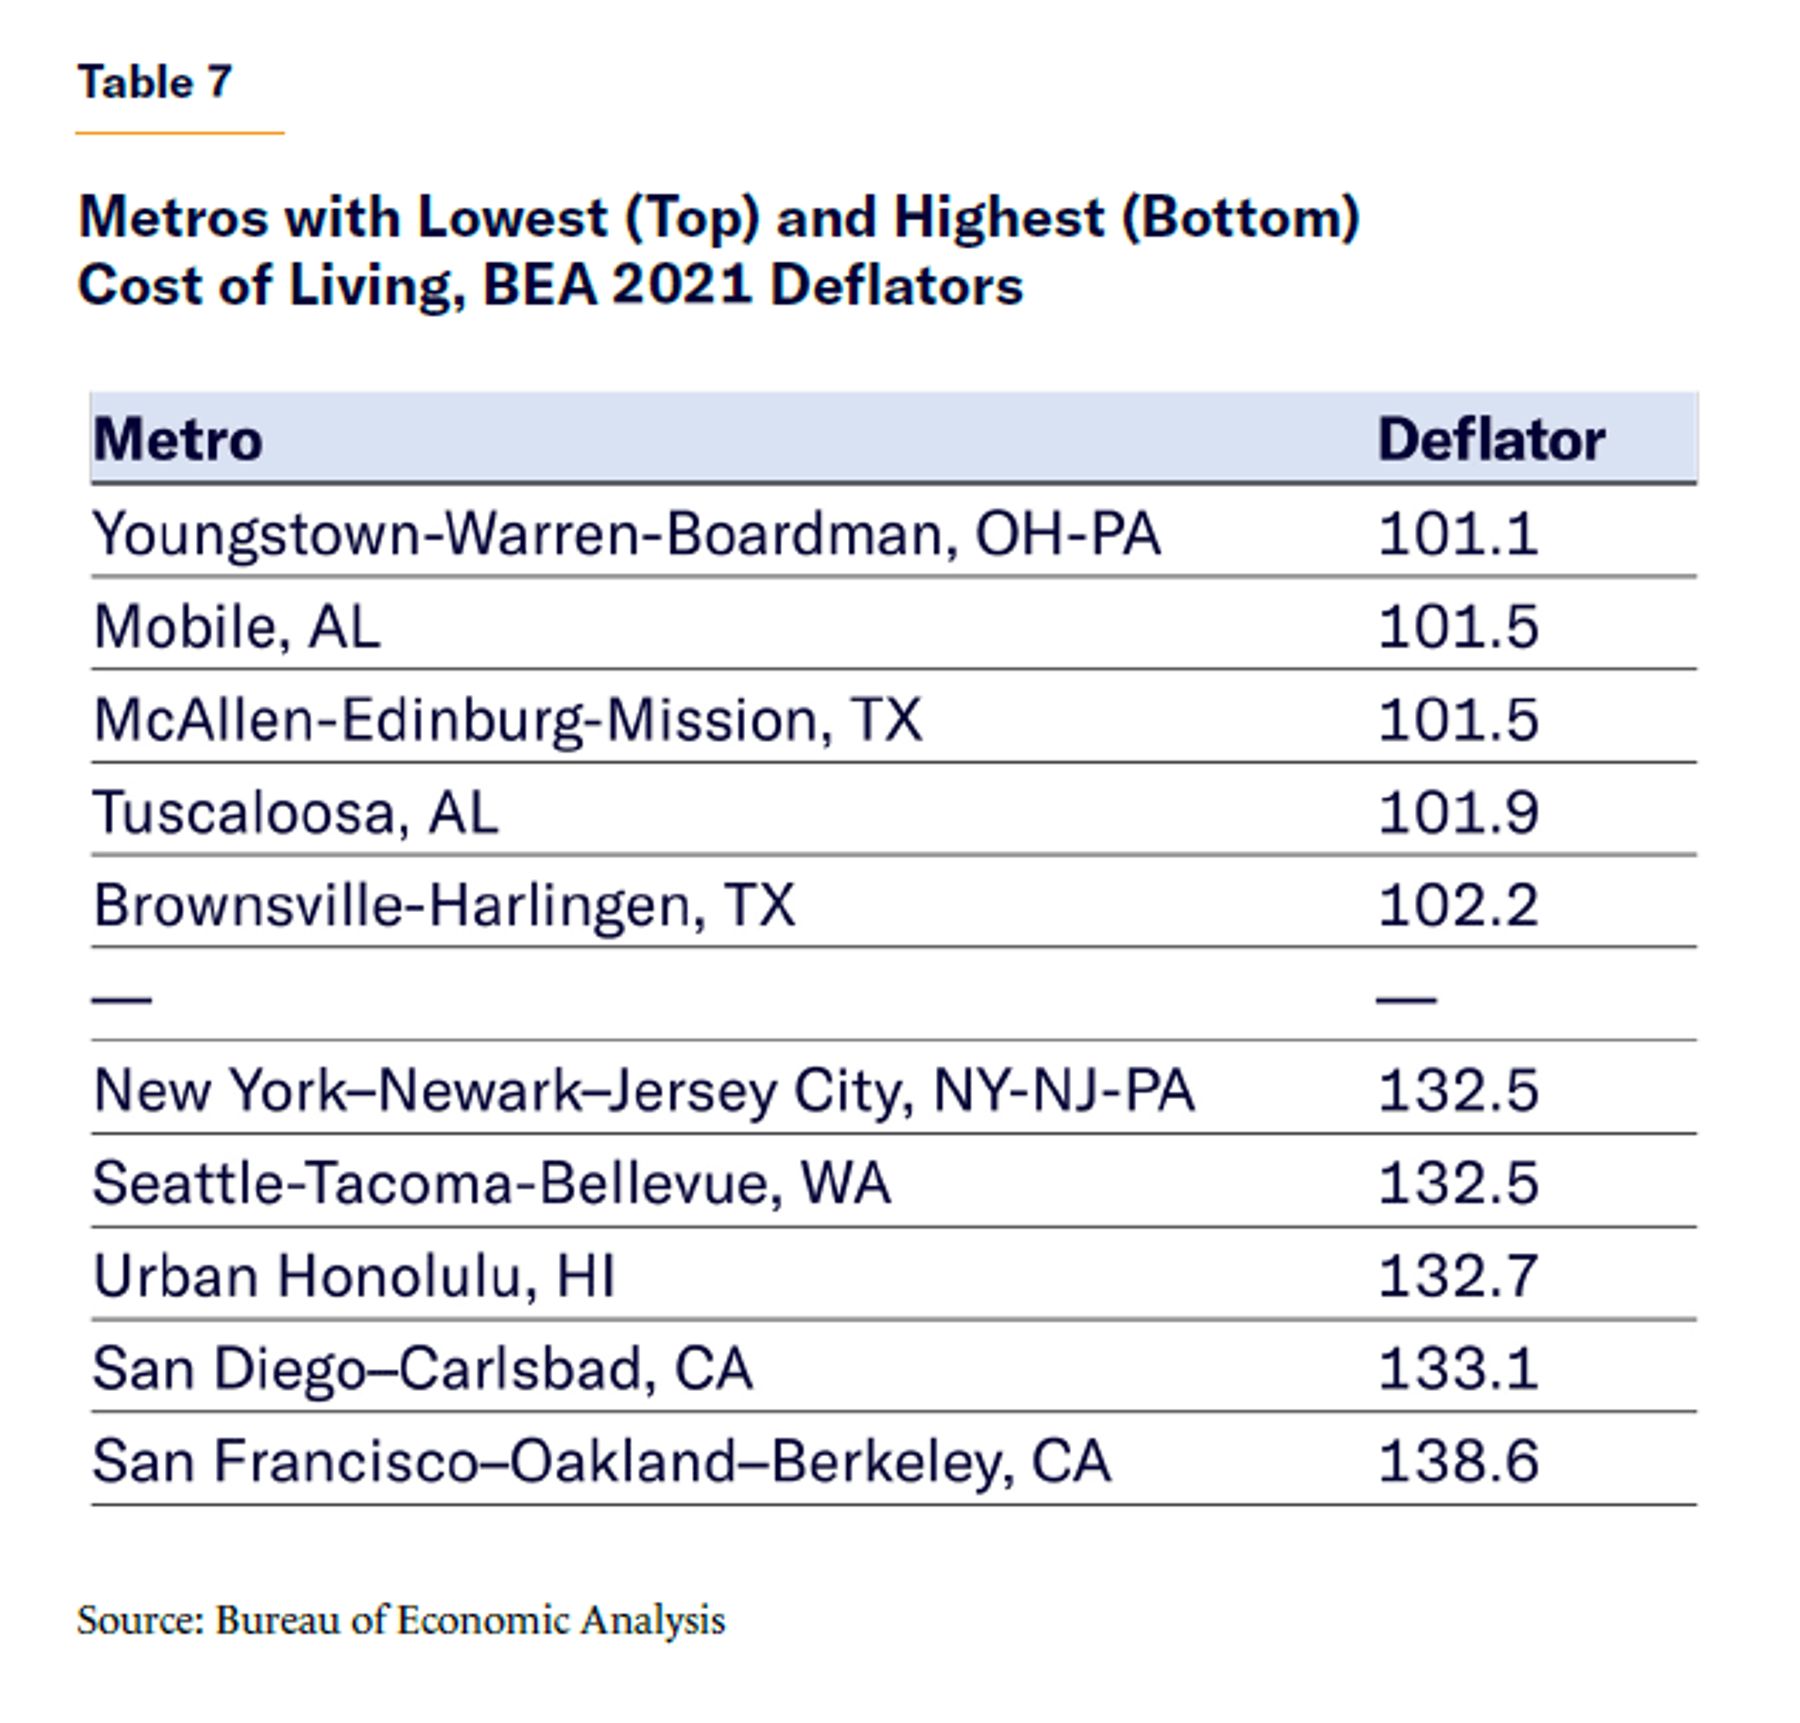
In my data,[51] there are clear relationships between metros’ cost of living and the presence of families. The rent index used to calculate the above-discussed SPM in 2021,[52] for example, correlates negatively with the minor share of the under-55 population (–0.28) and with net in-migration of kids (–0.58). The same is true for an overall cost-of-living measure from the Bureau of Economic Analysis[53] (–0.45 and –0.58, respectively), as well as population density[54] itself (–0.3 and –0.5, though the NYC area is an extreme outlier on this variable) and, in the opposite direction, a measure of prime-age homeownership[55] (+0.33 and +0.51).
I estimated metro-level child-care prices based on the federal government’s county-level National Database of Child Care Prices.[56] These prices track overall cost of living (+0.73) and are especially important to working parents. Child-care prices are far more variable across metro areas than other goods[57] and thus, unsurprisingly, also correlate with minor shares and net child migration (both –0.58). Also unsurprisingly, given the links among politics, density, and family size these days, the Trump share of the two-party 2020 vote is linked with minor shares and child migration as well (+0.5 and +0.57),[58] fitting into a longer-term pattern of blue-to-red migration, documented by my former colleague Michael Hendrix.[59]
Although I hesitate to rely heavily on multiple regression when different variables are measured with quite different degrees of accuracy, the Bureau of Economic Analysis (BEA)’s cost-of-living measure does remain a strong predictor of under-55 minor shares and child migration after controlling for racial demographics, as well as a collection of measures discussed above (e.g., mortality rates, mobility, educational outcomes).[60] Of particular note is that child in-migration is no longer correlated with child and homicide mortality rates, after controlling for cost of living. While hardly dispositive, this is consistent with a theory in which cost differentials are pulling children into places with higher mortality rates.
Americans, for good or ill, are raising families in the places where it is most affordable to raise a family (Table 7).
Advice from an Ex-Urbanite
If the status quo simply continues with no effort on the part of big cities to change course, families (and perhaps people in general) will likely continue to trickle out. The abrupt jolt of the pandemic is fading into the background, and crime rates appear to be inching back toward normal, but remote work is here to stay—indeed, it may continue to grow in the long term, as younger and growing firms are more likely to offer it.[61]
But let us not fall into the trap of “no one goes there anymore; it’s too crowded.”[62] Dense, expensive cities remain, well, dense and expensive. They still have lots of people living there; immense economic strength, thanks to concentrations of talent; cultural amenities that smaller places cannot match; and high rents, suggesting that even more people would come if they could afford it, given that rent levels are the result of what is essentially a bidding process. Even today, many big cities have the clear option of growing if they bother to try.
How might cities and their surrounding metro areas attract more families? Here are several suggestions, offered based not only on the above data but also from my own experience in fleeing two urban centers in the past decade.
End the Housing Stagnation in “Superstar” Cities
The unwillingness of some of the country’s most economically productive and in-demand coastal cities to build housing has sparked much academic research and the political YIMBY—Yes in My Back Yard—movement. Zoning rules reduce overall economic growth, hinder the upward mobility of people who might move in search of a better life, and simply make life more expensive. But how do families fit into this pattern and the movement to fix it?
As is their wont, children tend to complicate this debate.[63] Aaron Renn has pointed out, for example, that making space for families can mean combining units, which urbanists sometimes oppose because it reduces density.[64] And as I have already noted, big cities cannot compete directly with the deal that less dense places offer to families: more space and lower cost.
Yet core cities can bring prices down by building more housing, which would allow the subset of parents who don’t mind density, who value the amenities that only a big city can provide, and who cannot afford current rents, to move in (or stay). Further densification is certainly possible, even in American cities that are already dense: Paris is twice as dense as New York City,[65] which is far denser than other American cities and is in the middle of its own debate over adding more housing.[66] Beyond building taller, converting empty office space to housing is an opportunity provided by the post-pandemic landscape that minimizes changes to existing structures. (See the recent proposal from my MI colleague Arpit Gupta and two coauthors.)[67]
Even without shifting the minor percentage of the population, such efforts would certainly increase the number of kids in cities. As seen above, metros attractive to prime-age adults tend to attract parents and nonparents alike. Yet building more housing designed specifically for families, and tailoring neighborhoods to match—even when economics, urbanist activism, and developers’ preferences all point toward more small apartments for the childless—may well be necessary to shift proportions.
Whether it is worth it is a subjective question. Modarres and Kotkin painted the picture in 2013:
A more family-friendly city remains possible. The Brooklyn community of Flatbush—like Staten Island, Queens, and eastern portions of Brooklyn—was built in the first half of the twentieth century to appeal to families fleeing the congestion of New York’s core.… Flatbush’s tree-lined neighborhoods, such as Kensington and Ditmas Park, may be the city’s best hope for retaining middle-class families. These areas still have many single-family homes and low-rise apartments. And Cortelyou Road, a main drag in Ditmas Park, brims with family-friendly restaurants and shops, though it was fairly desolate just a decade ago.…
For many young families living in New York’s outer boroughs, the availability of space, particularly backyards, is deeply important Obviously, people who settle here are willing to make do with less space than those who, say, move to a far-flung exurb in Putnam County. But all are seeking space in communities more amenable to family life than are the contemporary city cores.…
Such opportunities exist elsewhere in America, too, in places where detached single-family homes—the preferred housing of 80 percent of American adults, according to a National Association of Realtors survey in 2011—are often just a short walk or ride from the urban core.…
Families are also deeply attracted to open space. The great Frederick Law Olmsted–designed New York parks, including Prospect Park in Flatbush, are enormous assets for families without backyards.[68]
Other ideas for retooling city infrastructure with kids in mind abound.[69] These include slowing or outright discouraging traffic, designing bus routes and schedules with schoolchildren in mind, making subways and other public spaces stroller-accessible (which also aids the disabled), adding shade to facilitate summertime outdoor play, and building small “pocket parks.” At the extreme—or at least, an extreme relative to modern American city design and parenting styles—some envision children freely roaming safe urban environments.
Even if big cities eschew these approaches and mainly build more housing for the childless, declining housing prices in cities can take some pressure off the suburbs as well, allowing families to live closer in than they might otherwise be able to afford. (As one fascinating study simulated, building a new housing unit for one household, such as a market-rate unit for the better-off, quickly affects all sorts of people as the new occupant vacates his previous unit, and that unit gets a new owner, and so on down the line.)[70]
The most in-demand suburbs themselves could also stand to deregulate and build more housing—common reforms include allowing accessory dwelling units, legalizing duplexes and triplexes rather than mandating single-family housing, and allowing more and bigger apartment buildings close to transit. If the ultimate goal of a family-friendly urbanism amounts to walkable communities with plentiful housing, yet adequate open space, inner-ring suburbs may be an especially promising target. A related approach is for cities to build outward rather than upward; anti-sprawl regulations (such as growth boundaries, agricultural zoning, and large lot-size requirements) often prevent this, but new construction reasonably close to major cities would be highly attractive to families.[71]
In general, the focus should not be to shove a lot of families with children right in the middle of cities’ densest neighborhoods, or to knock down apartment buildings to make room for parks. Rather, the realistic goal is to bring inward the “doughnut” of places where people starting families—and possessing the means to live elsewhere if they so desire—might plausibly choose to settle down. Once again: offering lower prices and more space like small metros and exurbs is not an option, but bringing down prices and accommodating children in public spaces while continuing to offer the benefits of dense city life absolutely is.
The big political obstacle to YIMBYism is that the status quo exists for a reason. Current residents, especially owners and very much including parents, like to keep property values high, houses and yards big, apartment buildings short, historical buildings and “character” intact, and outsiders, especially the poor ones, out. As a result, action at the state level is often needed to move local policy,[72] and despite constitutional concerns, there are reasonable arguments for certain forms of federal involvement as well. (For instance, federal affordable-housing dollars should arguably not go to cities that deliberately make housing unaffordable through zoning.) To the extent that higher levels of government override lower ones, the goal should be not to micromanage every zoning decision but to require enough flexibility in housing supply to meet demand.
A more structural and less confrontational solution is to make growth profitable for cities, as the Manhattan Institute’s Reihan Salam[73] and Judge Glock[74] have each discussed. For instance, states can take on a larger share of the expenses that new families impose on cities, such as education costs. Additionally, charging impact fees for new development tends to increase the amount of development. Yes, it imposes a cost on the actual developers, but it provides an incentive for cities to allow the development to take place at all. Formal “proffer” laws can allow developers and policymakers to exchange promises on a legally enforceable basis; a developer might agree to build new roads in exchange for zoning changes that allow more building.
Beyond the political difficulties of YIMBYism, a counterintuitive trade-off between housing prices and fertility is perhaps worth considering. Research from Lisa Dettling and Melissa Kearney[75] suggests that, in the short term, a $10,000 increase in housing prices reduces fertility by 2.4% among renters (who find themselves less able to buy homes) but increases it by 5% among owners (who get added financial security from their housing values going up). “At the mean U.S. home ownership rate,” Dettling and Kearney summarize, “these estimates imply that the net effect of a $10,000 increase in house prices is a 0.8% increase in current period fertility rates.” Other studies have similarly found disparate effects for the two groups, though the precise magnitudes vary.[76]
One should not rush to conclude that reducing housing prices would be counterproductive. For one thing, the densest and most expensive places are precisely where homeownership is lowest, and thus where even these short-term effects tip in favor of fertility.
Extrapolating these findings over the long term, one would expect more consistent antifertility effects from higher housing prices, in perfect harmony with the strong cross-sectional negative correlation in my data set between housing costs and the minor share of the under-55 population. A one-time increase in housing prices would be expected to increase fertility for a single generation of owners yet decrease it for all future generations of renters, who would pay the higher price but not gain free equity from the increase itself. Repeated housing-price increases, meanwhile, would be expected to have worsening effects over time—each windfall for owners would raise the homeownership barrier even higher for renters, and thus the share of owners vs. renters would decline over time.
In the densest, most expensive, and most renter-heavy areas, increasing housing supply is an unambiguous boon to workers and families. Even in places where homeownership is already common, policymakers would be well-advised to keep prices reasonable.
Control Disorder
As noted above, families are not systematically moving to metros with lower homicide rates. But this does not mean that crime and disorder are not a concern.
New York City is an excellent case in point. During the 1990s, the Big Apple famously brought its crime rate down. The city still has a lower homicide rate than the U.S. as a whole—30% lower, 4.8 vs. 6.9 per 100,000 over the 2018–22 period, per CDC data.[77] Anyone painting New York as a murder-ridden hellscape is simply incorrect. And many of those leaving New York, including those famously heading to Florida, are going to places where rates of serious violence are higher, not lower.
Yet in the biggest cities, crime and general disorder tend to be much more present to families that want a good environment for their children. One can live in the suburbs and drive a minivan from one safe location to another in much of the country; but in New York, it’s hard to avoid the subway, the attractions downtown, and dense city streets in general. It is of utmost importance for those spaces to feel safe, even when murder rates are relatively low.
In a Manhattan Institute poll last year, about 70% of New Yorkers said that crime was a “very big problem”; 45% said that crime was increasing a lot, with another 31% saying that it was increasing some; and more than half said that they felt “not that” or “not at all” safe on the subway.[78] Moving west, Gene Balk of the Seattle Times recently drew attention to data from the Census Bureau’s Household Pulse Survey, which provides data only on the 15 biggest metros but includes questions about whether residents felt pressure to move recently, owing to public-safety concerns.[79] The Seattle metro topped the list at 7%. Meanwhile, in a poll of San Francisco, only 30% of residents said that they feel safe visiting the downtown area at night.[80] Taking a broader and more academic view, there is research showing that migration to central cities instead of suburbs, particularly of wealthier “gentrifiers,” depends partly on crime being under control.[81]
I will not offer a comprehensive public-safety plan here, though my colleagues at the Manhattan Institute have written about these issues extensively.[82] The basics are to staff police departments adequately, train officers well, put cops where the crime is, incapacitate repeat offenders, maintain an orderly environment on public transit, and get the severely mentally ill into treatment.
Offer Educational Choice
If family-size housing is expensive in big cities, so is private school. Those wanting good public schools must pay for those, too, because property values partly reflect the right to send kids to the school that the property is zoned to. School closures during the pandemic increased many parents’ sense of frustration and powerlessness over the workings of the schools to which they had been assigned.
As with homicide rates, families are not systematically moving to metros with stronger public school performance—but no parent moves without looking into the specific schools that his children will attend in the new place. Therefore, in addition to movement between metros, children are shifting from central cities to suburbs. Studies show that wealthier parents, in particular, tend to move toward better schools[83] and that educational quality affects non-metro areas’ ability to draw new migrants, for example.[84]
In urban areas, allowing broader choice is an obvious way to attract parents who may otherwise be leery of the local schools in affordable neighborhoods. This can take the form of vouchers for private schools, which some red states have been aggressively exploring since the pandemic. (My colleague Nicole Stelle Garnett has written about how to maximize these programs’ effectiveness.)[85] But it can just as easily take the form of charter schools, magnet schools, and simply allowing parents to send their children to public schools in other neighborhoods.
Simply improving public schools across the board is another option that could make families more willing to move in. Here, as with policing, funding appears to have a role. More important, though, is to spend money effectively[86] and to maximize performance using objective measures—for instance, by expanding high-performing schools while closing failing ones.[87]
Attract Families or Subsidize Them?
There are profound ideological disagreements when it comes to the role of government in bringing families to cities. In some areas, government simply must make the decision—there are few libertarian paradises with no zoning laws at all, so the questions of how a city is arranged and how much housing may be built are ones for elected officials. In other areas, one may debate whether the government should be involved at all, as with subsidy programs. I write from the perspective of a conservative with some libertarian tendencies, and I make no apologies for doing so; but here, I would like to tip my hat to other regions of the political spectrum.
My primary suggestion of allowing more housing would entail relaxing government restrictions, which will please libertarians, fellow conservatives with an emphasis on free-market economics, YIMBYs, and, more selfishly, real-estate developers. It is also popular among “supply-side progressives”—left-leaning thinkers who decry the tendency of government to restrict supply while subsidizing demand (as in the case of housing subsidies and rent control paired with intense zoning restrictions) and point to increasing supply as a better alternative.
However, many others on the left strongly embrace the subsidizing-demand aspect of that equation, and a growing faction of “New Right” conservatives are also far more friendly to using government to achieve their aims. It is not difficult to imagine a more forceful path to cities that are more welcoming to families and parents who are more likely to choose cities: offer federal grants for (or condition existing grants on) the building of family-size housing, subsidize or outright provide housing and child care for families that live in denser areas, mandate play space in urban residential neighborhoods,[88] and ramp up the taxation of suburban life (particularly the environmental externalities).
New spending will have to be paid for eventually, some of these ideas will be more popular than others at the ballot box, and, as the supply-side progressives note, subsidies will, to some extent, simply increase prices by juicing demand. But it is not as if government programs, with all the good and bad they entail, are foreign to the American psyche as a solution to pressing problems. And it is not as if you cannot get more of something by subsidizing it, legally mandating it, or taxing the alternatives. Those seeking more regulation and redistribution have that right, at least.
Conclusion
The landscape on which cities compete has shifted. Many workers are no longer tied to their employers’ physical locations. City life in general has lost some of its luster, thanks to a pandemic and a crime wave. And, continuing a long-running trend, families with kids have been among the most eager to head to greener, more affordable, less dense pastures.
Big cities can’t provide the combination of low price and ample space that smaller places can. Economically, the way to bring down prices is to increase the supply of housing, which also increases density. Cities still, however, provide numerous amenities facilitated by density, from arts and entertainment to job hubs.
Large metros can stem their loss of children by leaning in to their strengths. They can attract the subset of parents who don’t mind density by bringing down prices, making public spaces safe and welcoming to children, and offering every child a decent education.
About the Author
Robert VerBruggen is a fellow at the Manhattan Institute, where he provides policy research, writes for City Journal, and contributes to special projects and initiatives in the President’s office. Having held roles as deputy managing editor of National Review, managing editor of the American Conservative, editor at RealClearPolicy, and assistant book editor at the Washington Times, VerBruggen writes on a wide array of issues, including economic policy, public finance, health care, education, family policy, cancel culture, and public safety. VerBruggen was a Phillips Foundation Journalism Fellow in 2009 and a 2005 winner of the Chicago Headline Club Peter Lisagor Award. He holds a BA in journalism and political science from Northwestern University.
Endnotes
Photo: monkeybusinessimages/iStock
Are you interested in supporting the Manhattan Institute’s public-interest research and journalism? As a 501(c)(3) nonprofit, donations in support of MI and its scholars’ work are fully tax-deductible as provided by law (EIN #13-2912529).